Article

Impacts of a Recent Interdecadal Shift in the Summer Arctic Dipole on the Variability in Atmospheric Circulation over Eurasia

1
Department of Atmospheric and Oceanic Sciences, Institute of Atmospheric Sciences, Fudan University, Shanghai 200438, China
2
School of Atmospheric Sciences, Chengdu University of Information Technology, Chengdu 610225, China
3
China Meteorological Administration Training Center, China Meteorological Administration, Beijing 100081, China
*
Author to whom correspondence should be addressed.
Atmosphere 2024, 15(1), 71; https://doi.org/10.3390/atmos15010071
Submission received: 23 November 2023 / Revised: 21 December 2023 / Accepted: 25 December 2023 / Published: 7 January 2024
(This article belongs to the Special Issue Arctic Atmosphere–Sea Ice Interaction and Impacts)

Abstract

:
This study investigated the relationship between the summer Arctic Dipole (AD) anomaly and the climatic variability in Eurasia during the period 1979–2021. It was found that the summer AD anomaly experienced a phase shift from frequent negative phases before 2006 to positive phases after 2007, as manifested by the shift of the center of the positive (negative) AD anomaly to Greenland (in the Laptev Sea and East Siberian Seas) in the more recent period (2007–2021) from the vicinity of the Kara Sea and Laptev Sea (the Canadian archipelago) in the earlier period (1979–2006). Before the mid-2000s, a wave train was shown in the middle troposphere of Eurasia, and this teleconnection pattern of atmospheric circulation could have resulted in local warm and wet (cool and dry) anomalies over northern Russia and East Asia (Western Europe and the Far east). Since the mid-2000s, the wave train has experienced a notable adjustment that was conducive to East Asian and Arctic cooling, displaying anticyclonic anomalies around northern Eurasia and two cyclonic anomalies centered near the Arctic and East Asia. The presence of a cold Arctic anomaly was found to enhance westerly winds at high latitudes by modulating the meridional temperature gradient (MTG) and impeding the southward propagation of cold Arctic air. Additionally, the warmth of northern Eurasia may have also resulted in a reduction in the MTG between northern Eurasia and the mid-lower latitudes, favoring a weakening of zonal winds over the central region of Eurasia. The increased upper-level westerly winds over southern East Asia implied a weakened East Asian Summer Monsoon, which inhibited precipitation in northeast China.

1. Introduction

The transport of sea ice through the Fram Strait depends on atmospheric forcing [1], which is often measured in terms of storm tracks and quasi-stationary wave teleconnections, such as the North Atlantic Oscillation (NAO) [2], the Arctic Oscillation (AO) [3,4,5], and the Arctic Dipole (AD) anomaly [6,7,8,9]. The AD anomaly was defined as the second mode of the empirical orthogonal function (EOF) of sea-level pressure (SLP) north of 70° N [6], and the positive phase (i.e., the SLP has a positive anomaly in the Canadian Archipelago and a negative one in the Barents Sea) is predominantly associated with a meridional wind, which tends to affect the meridional sea ice transport from the Arctic to the Atlantic via the Fram Strait [10]. The strong Atlantic cyclones coupled with the negative phase of the AD anomaly promote the transport of warm and moist air into the central Arctic, which favors the melting of sea ice [11,12] and could contribute to record minima for the extent of sea ice in September [13,14].
Some studies have even suggested that the accelerated decline of summertime Arctic sea ice is related to a more enhanced transpolar drift induced by the large-scale atmospheric circulation on interannual timescales over the next few decades [1,15]. However, Overland et al. [7] regarded the summer AD anomaly as a strong driver of atmospheric circulation in early summer that has contributed to the decrease in Arctic sea ice since 2007 [9]. The impacts of the summer Arctic Dipole (AD) anomaly not only affect Arctic sea ice but may also extend to extreme weather events or climatic variability in subarctic regions and the mid-latitudes [7,16]. Yu et al. [17] found that the positive winter AD anomaly had a significant impact on the frequency of inversion occurrences in the Arctic. Wu et al. [18] showed that the summer AD anomaly modulated the responses of winter atmospheric circulation to sea ice loss. The negative phase of this anomaly enhances the negative effect of Arctic sea ice loss on the winter atmospheric variability over Eurasia. Polyakov et al. [19] found that a transition to a negative AD phase may accelerate the decline of Arctic sea ice, which would further change the climate system of the Arctic. Most of these studies highlighted the importance of the effect of the AD anomaly on Arctic sea ice loss. However, few studies have focused on the influence of the summer AD anomaly on surface air temperature (SAT) variations in Eurasia.
In the last few decades, the summer surface air temperatures (SATs) have significantly increased over many portions of Eurasia. This is likely related to anomalous southerly winds that bring warmer and wetter air northward from lower latitudes [20]. In addition, the high-latitude atmospheric circulation transporting less cold air to the mid-low latitudes also contributes to warming [21,22]. The summer AD anomaly could contribute to the shrinking of Arctic sea ice, thus promoting Arctic warming [23]. Arctic warming may induce a weakened equator-to-pole thermal gradient, which is associated with the weakening of mid-latitude circulation, leading to more persistent hot-dry extremes in the mid-latitudes [24]. On the other hand, the reduction in Arctic sea ice is conducive to triggering the Rossby wave, which originates from the Arctic and propagates eastward, then disperses southward toward East Asia, causing extreme droughts there in the summer [25,26]. However, it remains unclear whether changes in the AD anomaly can influence contemporaneous climatic variability in Eurasia via internal atmospheric variability. This has important implications for our understanding of the variability in the summer climate over Eurasia.
Additionally, some studies have suggested that the NAO is closely connected with changes in the Eurasian climate via the NAO-related downstream wave train [27,28]. For example, Liu et al. [29] investigated the combined effects of the summer NAO on extreme high temperatures in East Asia via the Rossby waves over Eurasia. Nonetheless, in the context of decadal variations in AD, the linkage between the summer AD anomaly and the NAO has received far less scientific attention, despite the potential effects that might influence the occurrence of extreme events in East Asia. In addition, the question of whether the NAO can modulate the strength of the effects of the AD anomaly on the SATs/precipitation over Eurasia via the Rossby waves is rarely discussed. Hence, this study concentrates on the statistical relationship between large-scale atmospheric circulation in the high latitudes and the climatic variability over Eurasia during the boreal summer. In particular, this study discusses the potential relationship between the summer AD anomaly and the variability in the Eurasia climate during boreal summer on a decadal timescale. The question of whether AD anomalies can influence climatic variability in Eurasia independently of the NAO is also discussed.

2. Data and Methods

The monthly mean sea-level pressure (SLP), geopotential height, horizontal wind, total precipitation, and air temperature from 1979 to 2021 were obtained from the fifth-generation reanalysis datasets (ERA5) provided by the ECMWF [30] with a 0.25° × 0.25° latitude–longitude grid and accessed on 15 August 2023. The monthly mean sea ice extent (SIE) data for the same period were acquired from the National Snow and Ice Data Center (Boulder, CO, USA) (https://sidads.colorado.edu/DATASETS/NOAA/G02135/north/monthly/data/) and accessed on 25 April 2023. The monthly precipitation data from 1979 to 2021 were obtained from the Global Precipitation Climatology Project (GPCP, https://www.ncei.noaa.gov/data/global-precipitation-climatology-project-gpcp-monthly/access/) and accessed on 27 October 2023, where they are publicly available. Herein, “summer” refers to June–August. The negative phase of the atmospheric circulation pattern was obtained by multiplying the atmospheric circulation index by −1.
An analysis of the empirical orthogonal functions (EOFs) was conducted to obtain the leading modes of atmospheric variability in the SLP over the Arctic region (70–90° N) during the summer, and this was also used to define the AD [6,13]. The AO/NAO index was provided by the NOAA/CPC through its website (https://www.cpc.ncep.noaa.gov/data/teledoc/telecontents.shtml) and accessed on 28 Novermber 2022. Regression, correlation, and composite analyses were conducted to investigate the atmospheric circulation anomalies associated with the variability in the Eurasian climate and the summer AD anomaly. Differences were tested for statistical significance by using a two-tailed Student t-test, and similar results were obtained with the Monte Carlo bootstrap significance test.

3. Results

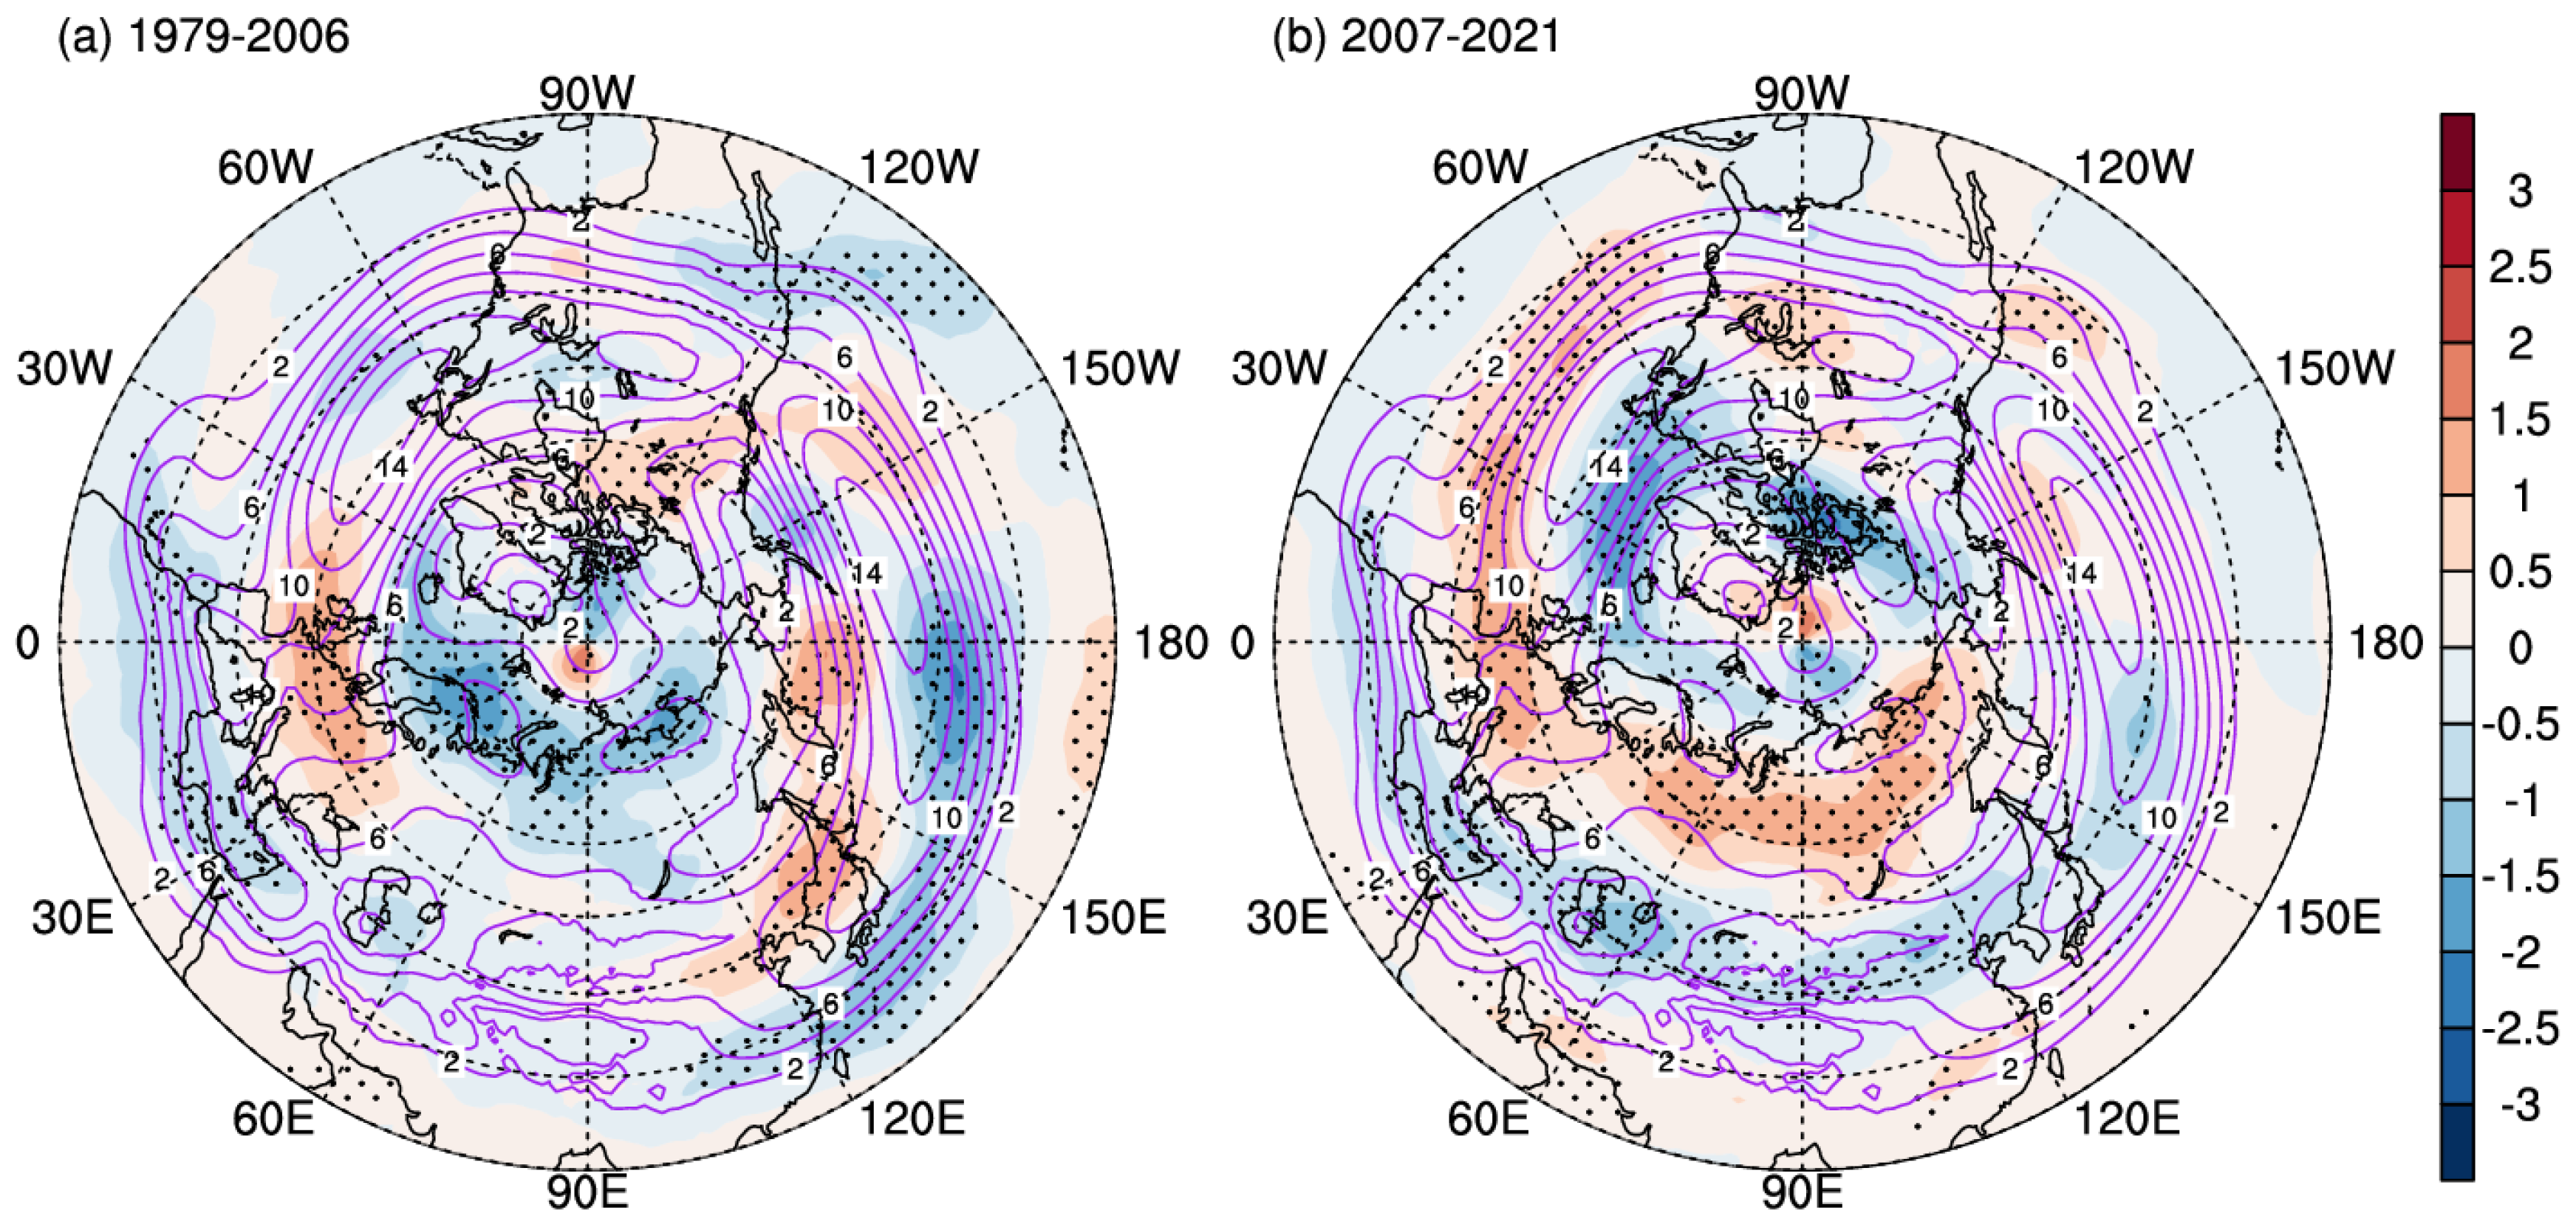
3.1. Dipole Circulation Anomaly in the Arctic

To reveal the dominant modes of variation in the SLP, we applied an EOF analysis to the mean summer SLP north of 70° N for the period from 1979 to 2021. The first two EOFs and their corresponding principal components (PCs) could be used to explain the main characteristics of the spatiotemporal variations in the Arctic atmospheric circulation, as they accounted for 60.5% and 14.1% of the total variance, respectively. According to North et al. [31], the first two modes (EOF1 and EOF2) were well separated from the other modes. The leading mode represented part of the Arctic Oscillation in the Arctic (Figure 1a), with a correlation of −0.95 between PC1 and Thompson and Wallace’s monthly mean AO index [3] (Figure 1c).
EOF2 showed a dipole structure—that of the AD anomaly—with opposite signs over northern Eurasia and the Arctic marginal seas and over northern Canada and Greenland (Figure 1b). Variations in this dipole pattern could enhance or reduce the meridional flow crossing the Arctic and could affect sea ice transport through the Fram Strait [32]. PC2 experienced an interdecadal change after around 2006, which was verified by the moving t-test (not shown), indicating that the AD shifted into a positive phase (Figure 1d), in agreement with Overland et al. [7], Serreze et al. [33], and Wu and Li [34]. They examined the decadal changes in the SLP patterns over the Arctic and found that the SLP anomalies in recent years more closely resembled a positive AD pattern, which was associated with a decrease in sea ice. These dominant features in the summer SLP anomalies were, to some extent, also frequently found in each summer since 2007. According to the time series of the Arctic Dipole (AD) (Figure 1d) and the spatial modes of the sea-level pressure (SLP) anomalies (relative to the 1979–2021 mean) north of 70° N (Figure 2), 14 out of the 15 summers exhibited a dominant feature in which SLP anomalies manifested a dipole structure north of 70° N. These summers included those of 2007, 2008, 2009, 2010, 2011, 2012, 2013, 2014, 2015, 2016, 2017, 2018, 2020, and 2021. The summers of 2009, 2011, 2017, 2018, 2019, and 2021 exhibited particularly strong AO-like atmospheric circulation anomalies, which may have covered the AD-type atmospheric circulation anomalies.
Previous studies mainly discussed the simultaneous relationship between the summer AD anomaly and atmospheric circulation in the mid-lower latitudes of Eurasia from 1979 to 2021 [18,35]. However, the AD anomaly has shifted to a positive phase since 2007 (Figure 1d). Therefore, in the following analysis, we further discovered the interdecadal phase changes in AD and their effects on variations in atmospheric circulation in East Asia by selecting different summer AD phases before and after the mid-2000s. Firstly, we compared the decadal changes in the modes between the early period (1979–2006) and the recent period (2007–2021), and then we analyzed the possible linkage between the variability in the atmospheric circulation over East Asia and the interdecadal variations in the AD. The differences in the summer mean variables between these two periods reflected the atmospheric changes associated with summer AD anomalies (Figure 3). Positive SLP anomalies appeared in Greenland, Eurasia, and the Pacific Ocean, with negative SLP anomalies being exhibited in the mid-lower latitudes of North America, the North Atlantic Ocean, and Novaya Zemlya and its vicinity (Figure 3a). Accordingly, the dominant positive 500 hPa geopotential height anomalies appeared over the Pacific Ocean, Atlantic Ocean, Eurasia, and western North America, while negative anomalies appeared over the North Atlantic Ocean, the Barents–Kara Seas, Alaska, and part of North America (Figure 3b). This indicated that the summer AD anomalies in the mid-lower troposphere were concurrent with the decreased SLP in the North Atlantic since 2007.
Several previous studies revealed that the wind pattern of the winter AD anomaly was not confined only to the Arctic region and could span a large domain north of 20° N [18,36]. Thus, we calculated the summer SLP anomalies corresponding to different values of EOF2 every 10 degrees north of 20° N to confirm whether such dipoles could affect the changes in atmospheric circulation at mid-low latitudes (Figure 4). A typical AD anomaly in the Arctic is shown in Figure 4a; the results revealed that opposite anomalous centers were located over the Greenland and Siberian marginal seas and over northern Eurasia. Additionally, there was one positive center over the North Pacific and a negative center extending from North America westward through the North Atlantic to Western Europe. As the domain was enlarged, the spatial distributions of the SLP anomalies exhibited some visible similarities (Figure 4b–f). The summer AD anomaly was significantly correlated with PC2 from the EOF analysis of the summer SLP variability over different domains. The correlation coefficients were all greater than 0.88 after removing the linear trend during 1979–2021. The results showed that although the summer AD anomaly was a ‘‘local’’ pattern north of 70° N, it also displayed a close relationship with the atmospheric variability over the mid-lower latitudes relative to the Arctic. These results are different from those of previous studies [18,35], which found that the correlations of the winter AD anomaly with PC2 from the EOF analysis of the winter SLP variability over different domains rapidly declined from north of 60° N to north of 50° N after removing the linear trend, and the extent of positive anomalies in Greenland decreased and became weaker when the domain was enlarged to the south of 50° N; the opposite was found over the North Pacific.
Figure 5 shows regression maps of the summer SLP and geopotential height anomalies at 500 hPa in the normalized AD time series during 1979–2006 and 2007–2021. We used the negative phase of the summer AD before 2007 to analyze its possible relationship with atmospheric circulation over Eurasia. During the early period (1979–2006), the SLP anomaly exhibited a dipole structure, with a positive center over the Laptev Sea and the Kara Sea and a negative center over the Canadian archipelago (Figure 5a). In the middle troposphere (at 500 hPa), a cyclone anomaly mainly occurred over Western Europe and south of Lake Baikal, while an anticyclone anomaly occupied the Arctic and Japan in the early period (Figure 5c). Unlike in the first phase, a negative SLP anomaly occurred over the Laptev Sea and East Siberian Sea, and a positive SLP anomaly occurred over Greenland and the Canadian archipelago during 2007–2021 (Figure 5b). Overland et al. [7] suggested that a regional atmospheric blocking mechanism was responsible for the presence of the AD pattern, which was consistent with observations of unprecedentedly high-pressure anomalies over Greenland since 2007. The geopotential height anomalies at 500 hPa clearly showed a belt structure, with the center of the negative anomaly being located in the eastern hemisphere in the Arctic and at the mid-lower latitudes of Eurasia and the center of the positive anomaly being located at the mid-high latitudes of Eurasia and in the western hemisphere in the Arctic (Figure 5d). This atmospheric circulation anomaly in the middle troposphere was conducive to a similar spatial distribution of air temperature in the more recent period.

3.2. Associations with Climate Variability over Eurasia

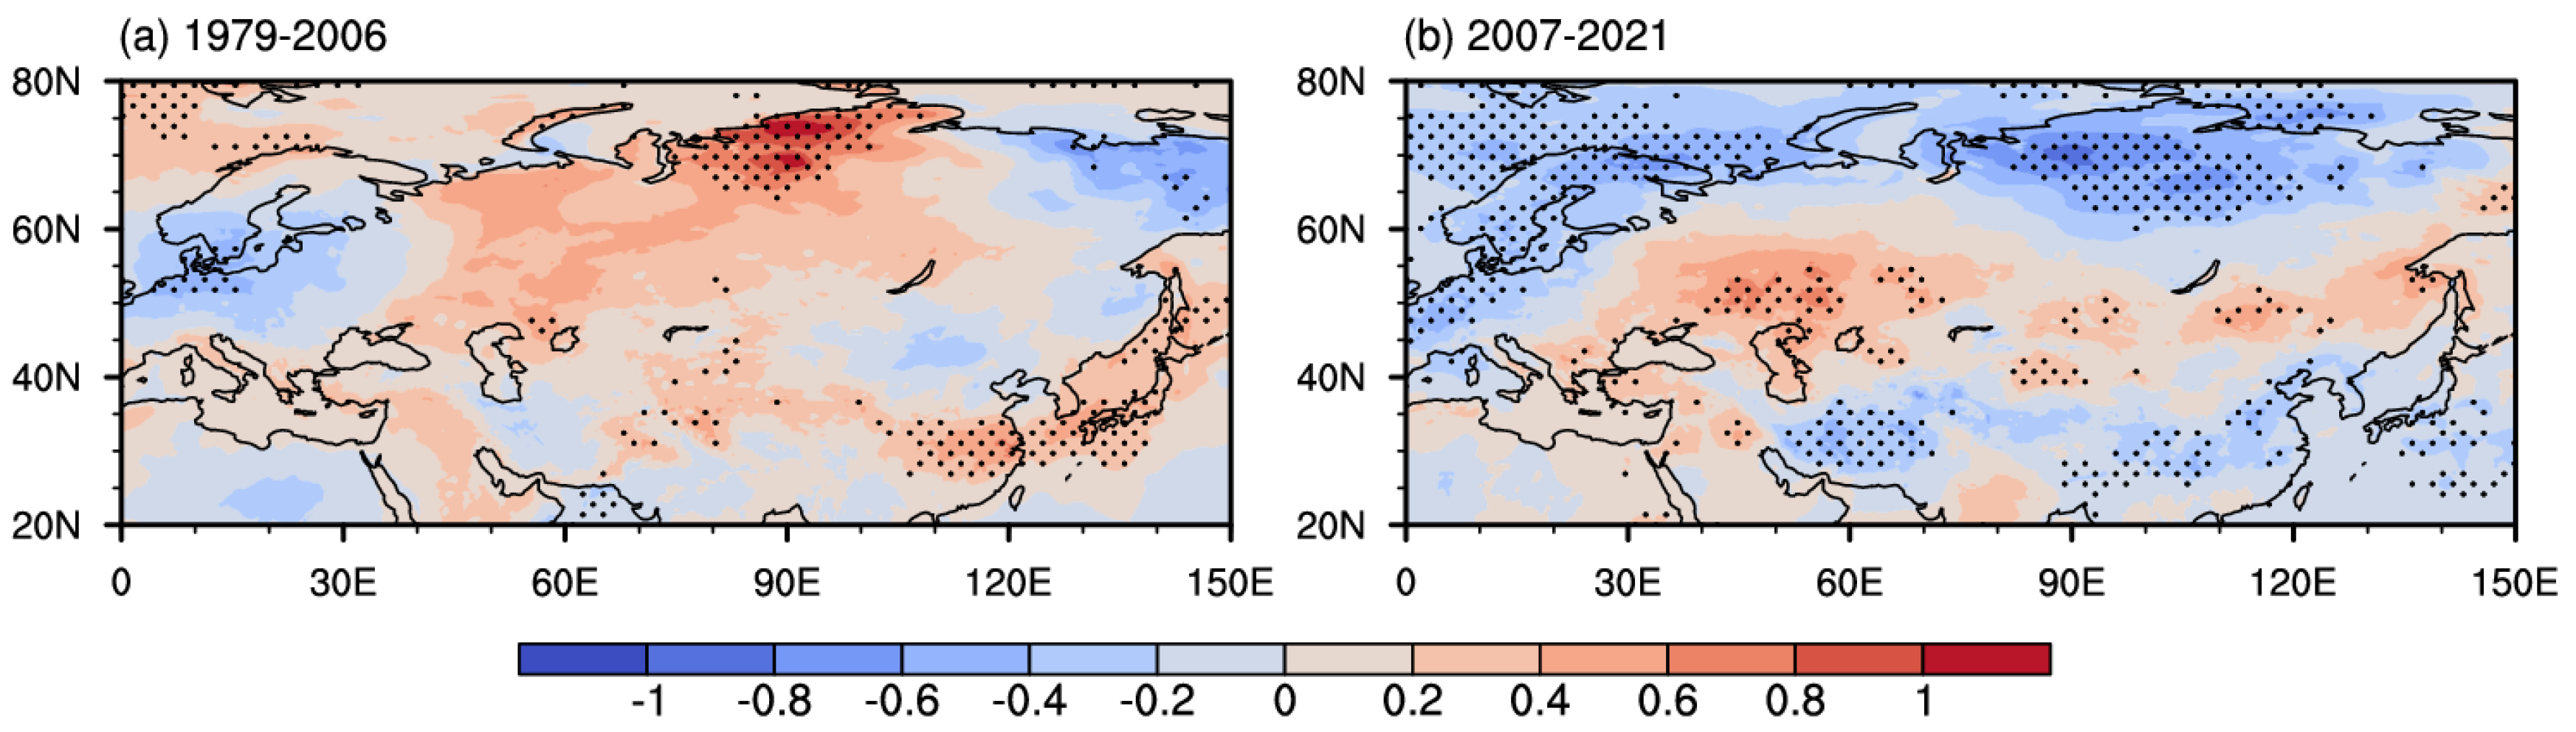
3.2.1. Impact on the Summer SAT over Eurasia

The summer SAT anomalies associated with different AD phases displayed notable differences over Eurasia during 1979–2006 and 2007–2021. Figure 6 shows regression maps of the summer SAT anomalies on the normalized AD time series during the two periods. In response to the negative phase of the summer AD anomaly, the SAT anomalies over northern Eurasia showed a zonal pattern, with cold anomalies appearing in Western Europe and in the Far East of Russia and with warm anomalies being located in northern Russia during 1979–2006 (Figure 6a). In particular, significantly positive SAT anomalies also appeared in East Asia. During the more recent period (2007–2021), positive SAT anomalies almost completely occupied central Eurasia, and the center was distributed in the south of the Ural Mountains. Cold anomalies occurred in northern and southern Eurasia, and the centers were distributed in Western Europe, northern Russia, and East Asia (Figure 6b). It is worth noting that the spatial pattern of the SAT anomalies in Eurasia changed from a meridional pattern in the first phase to a zonal pattern in the second phase.

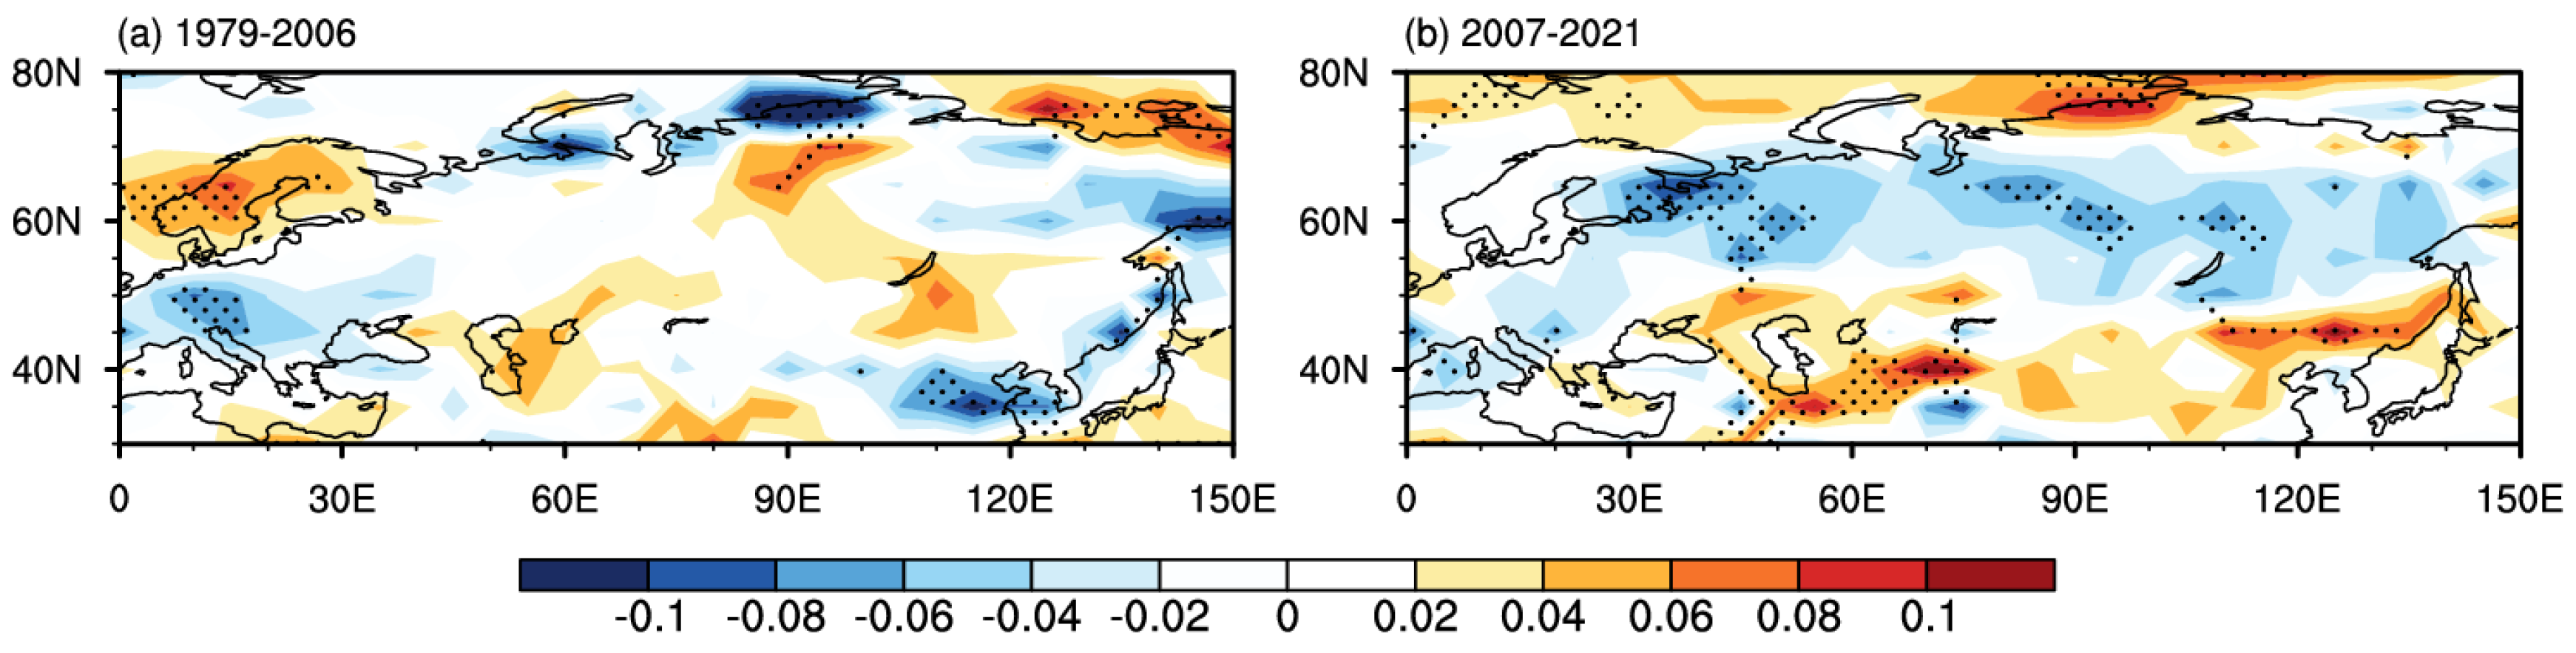
3.2.2. Impact on the Summer Precipitation over Eurasia

The regressions of precipitation anomalies on the AD anomalies during the two periods were calculated. The results showed that the corresponding precipitation anomalies related to AD were completely different during the two periods. Similarly, we used the negative phase of the summer AD to analyze its possible relationship with SAT anomalies over Eurasia during 1979–2006 (Figure 7a). Before the mid-2000s, significantly decreased summer precipitation was seen in the Arctic, Southern Europe, and the mid-lower Yangtze River in China and Japan, while significantly increased precipitation occurred in northern Europe and from the southeast of Lake Baikal to the Russian Far East. A wetter Europe was seen in the recent period, and this included increased precipitation in northern Europe and less drought in southern Europe. In East Asia, decreased precipitation occurred southeast of Lake Baikal and in Sichuan Province in China, and increased precipitation occurred in the middle and lower Yangtze Rivers, although this was not statistically significant (Figure 7b). It is worth noting that the influence of the AD anomalies on precipitation in East Asia in the more recent period was significantly weakened.

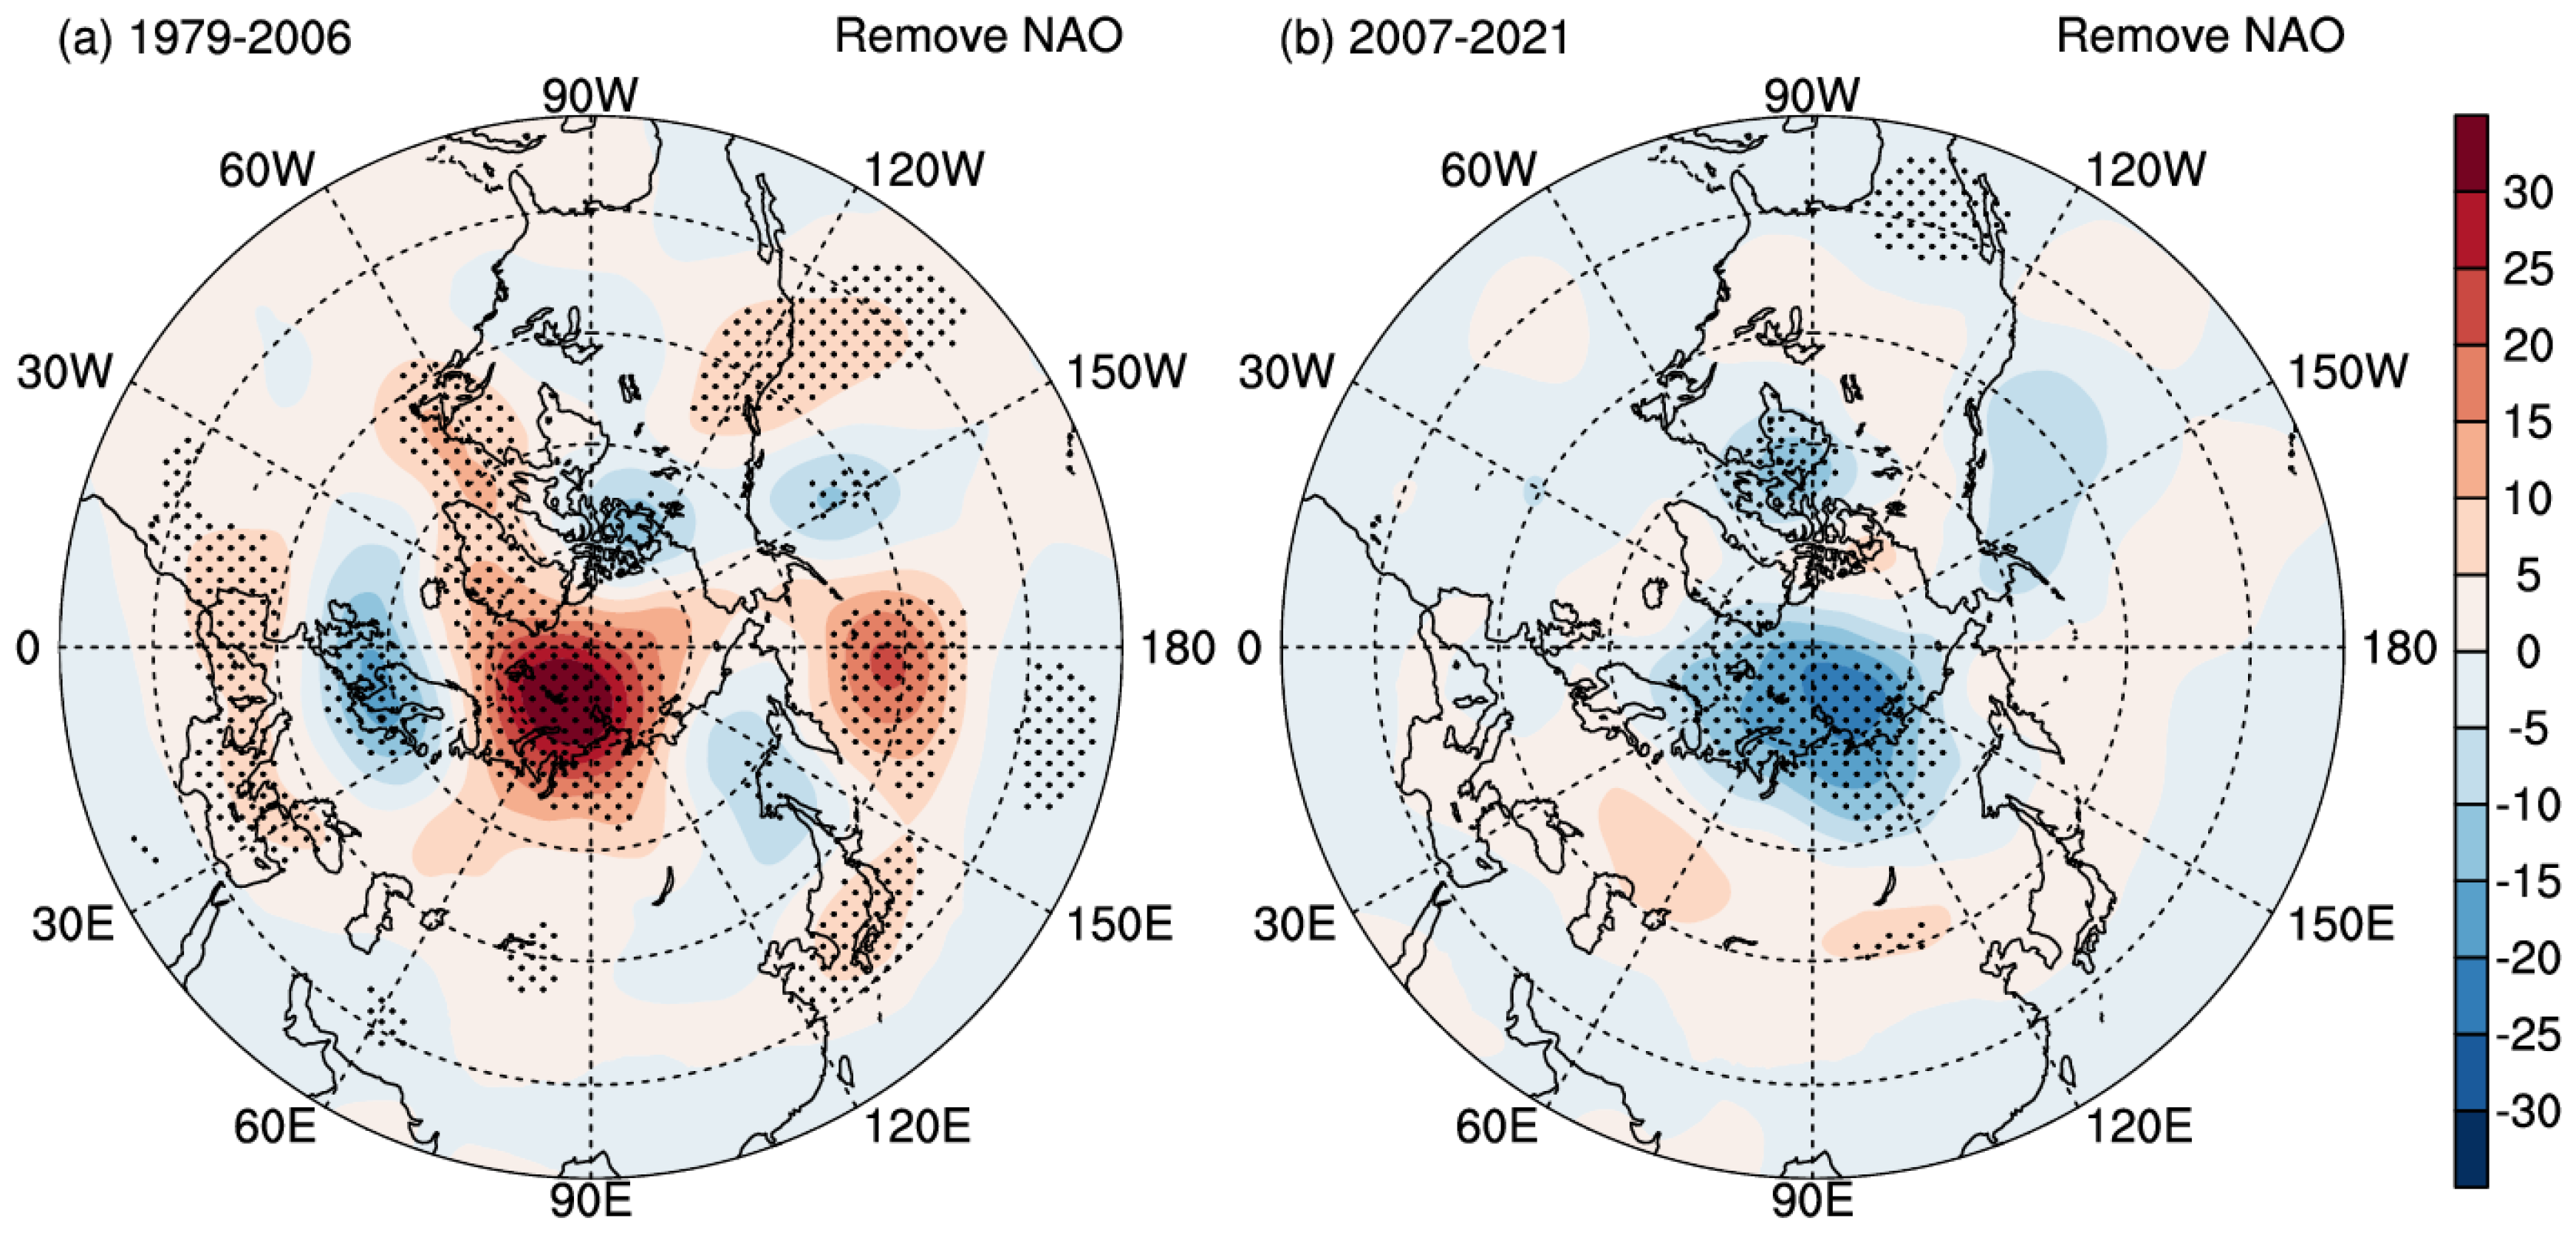
3.3. Possible Mechanisms for the Relationship between AD and Climate Variability in Eurasia

Although the above analyses suggested that the AD anomaly could affect the variability in atmospheric circulation over the mid-lower latitudes, an accompanying issue to be addressed is the following: What is the possible pathway through which the AD anomaly influences the SAT and precipitation in Eurasia? Thus, firstly, we employed the wave activity flux [36] to characterize the horizontal propagation of atmospheric Rossby waves. In the earlier period, the corresponding wave activity flux indicated that there was a quasi-stationary planetary wave train from Western Europe traveling southeastward to East Asia (Figure 5c). It was noted that the atmospheric circulation anomalies over Eurasia were largely similar to the pattern in the British–Baikal Corridor (BBC) [20]. Chen et al. [20] demonstrated that the pattern in the BBC consisted of four geographically fixed centers over the west of the British Isles: the Baltic Sea, western Siberia, and Lake Baikal, respectively. This atmospheric circulation teleconnection pattern could result in local warm and wet (cool and dry) anomalies over northern Russia and East Asia (Western Europe and the Far East). In the more recent period, an atmospheric wave train originating from Greenland extended southeastward through Europe to southern Central Asia (Figure 5d), consequently influencing the climatic variability in these regions. Therefore, it can be inferred that the impact of the Rossby waves on the climatic variability in East Asia was relatively minimal.
To further address the other possible pathway through which the AD anomaly affected the climatic variability in Eurasia, we calculated the regressions of 500 hPa zonal wind anomalies with respect to the AD during the two periods (Figure 8). The results showed that the corresponding zonal wind anomalies related to the AD were completely different during the two periods. Before the mid-2000s, the pattern of zonal wind anomalies in the middle troposphere presented a wave train structure from the Arctic to East Asia, and negative anomalies occurred in the Arctic and mid-lower regions of the Yangtze River (Figure 8a). As the Arctic SAT decreased, the baroclinicity increased, which could have led to the enhancement of the zonal wind in the middle troposphere over the Arctic. Easterly anomalies were significantly enhanced in northern Europe, and this corresponded to cold anomalies in Europe (Figure 6a). These results are consistent with those of Screen [37], who found that a southward shift of the summer jet stream over Europe affected its climatological position and increased northern European precipitation. In particular, the strengthening of zonal winds over the central region of East Asia (Figure 8a) was not conducive to the southward movement of cold air from the mid-high latitudes, causing warm anomalies in the Yangtze River Basin in China (Figure 6a). After the mid-2000s, the zonal wind anomalies presented a belt structure in the middle level with an easterly wind anomaly over 50° N–80° N and 20° N–30° N and westerly wind anomalies south of 30° N–40° N (Figure 5d). The westerly anomalies were significantly weakened in central Eurasia, corresponding to cold anomalies in south-central Eurasia (Figure 4b). Additionally, the zonal winds in the mid-lower latitudes of East Asia were weakened (strengthened) in the earlier period (more recent period), which was conducive to the strengthening (weakening) of the East Asian summer monsoon [38]. This led to more (or less) water vapor being transported to Northeast China [39], causing increased (or decreased) precipitation there (Figure 7).

4. Conclusions and Discussion

This study focused on the second mode (EOF2) of the mean summer SLP north of 70° N from 1979 to 2021, which represents the summer AD anomaly. The spatiotemporal features of the summer AD anomaly were examined in detail with ERA5 reanalysis data. One of its two anomalous centers was stably located between the Kara Sea and the Laptev Sea, and the other was situated on the Canadian Archipelago through Greenland and extended southeastward to the Nordic Seas. During the period of 1979–2021, a significant connection existed between the summer AD anomaly and PC2 of the EOF analysis of the summer SLP variability over different domains. Thus, although the summer AD anomaly was a ‘‘local’’ pattern north of 60° N, it also displayed a close association with the variability in atmospheric circulation over the mid-lower latitudes relative to the Arctic. This result is similar to those of a previous study by Wu et al. [18], who generally considered that the summer AD anomaly could be closely related to the winter Siberian high.
The possible mechanisms for the summer AD anomaly’s effect on the variability in the Eurasian climate are discussed. The centers of positive (negative) SLP anomalies tended to shift westward (eastward) in the more recent (earlier) period, with the anomalous centers shifting from the vicinity of the Canadian archipelago (the Laptev Sea and the Kara Sea) in the earlier period to Greenland (the Laptev Sea and the East Siberian Sea) in the more recent period (Figure 5a,b). The movement of the center of the AD anomaly in the more recent period may have resulted in different pathways for the ADs effect on variability in the SAT in Eurasia. In the earlier period, a quasi-stationary planetary wave train propagated from Western Europe southeastward to East Asia (Figure 7a), causing cool (warm) anomalies over northern Russia and East Asia (Western Europe and the Far East).
Additionally, the meridional temperature gradient (MTG) increased in northern Europe and decreased in southern Europe (Figure 9a), which caused zonal wind increases in northern Europe and decreases in southern Europe (Figure 8a). This wind pattern was conducive to the southward movement of cold air from the Arctic to Europe, causing cooling in Europe (Figure 6a). After the mid-2000s (since 2007), the MTG increased on the south side of the Arctic and in the middle of Eurasia and decreased in the north of Eurasia (Figure 9b). This pattern was conducive to the zonal distribution of zonal wind, causing the zonal wind to be strengthened in the high latitudes of Eurasia and weakened in the middle latitudes. These changes were accompanied by Eurasian (especially East Asian) cooling in the mid-lower latitudes since the mid-2000s. However, the cooling effect of the meridional wave train in East Asia in the second phase (2007–2021) was smaller than the effect of the zonal wave train in the first phase (1979–2006). When the AD was in a positive phase, the middle-level westerly jet was weakened over the Northeast region but was intensified over the Yangtze River Plain and the East China Sea (Figure 8b); the East Asian Summer Monsoon tended to be weakened [40]. The decreased upper-level westerly winds over northeastern China implied a weakened upper-level divergence that favored a decrease in precipitation in this area (Figure 7b).
In the North Atlantic sector, significantly negative geopotential height anomalies occupied Western Europe, and positive geopotential height anomalies covered Greenland during 2007–2021, resembling the NAO (Figure 5d). To further differentiate the relationship between the AD anomaly and NAO, we used the 11-year moving sliding correlation method to analyze the possible relationships between them. The results showed that the summer AD–NAO linkage had been enhanced since the mid-2000s. Other lengths of running windows (such as 9 and 13 years) yielded similar results (not shown). To better understand the relationship between the AD anomaly and atmospheric circulation anomalies in Eurasia, the results were further analyzed after removing the variability in the NAO. After removing the NAO signal, the 500 hPa geopotential height anomalies showed a zonal wave train structure over Eurasia during 1979–2006 and a meridional wave train structure over the northern hemisphere during 2007–2021 (Figure 10). However, the amplitude of the geopotential height anomalies at 500 hPa linked to the AD anomaly after removing the NAO signal was small relative to the results obtained with the AD index (Figure 5). Previous studies pointed out that the summer NAO also played an important role in influencing the SAT variability in East Asia since the mid-2000s [27,28,40,41]. Although the AD anomaly and the NAO could influence climate change in summer in Eurasia, the AD could influence climate change in Eurasia independently of the NAO.
The AD anomaly experienced an interdecadal change after the summer of 2006, which was verified with a moving t-test (not shown), indicating that the AD shifted to a positive phase relative to that before 2007. The possible mechanisms for this decadal change were also discussed. Previous studies found that the variability in the SIE became more connected with AD in recent periods [19,34,42]. They found that the total Arctic sea ice cover and the area of Arctic sea ice melting for the post-2007 period were characterized by a low extent and a remarkable increase in the amplitude of the annual cycle, which dynamically corresponded to the positive phase of the summer AD anomaly. Thus, we calculated the correlation between the summer AD anomaly and the summer Arctic SIE for this study period. After removing the linear trend, the correlation coefficient between the AD anomaly and the summer mean SIE was 0.01 during 1979–2006 but changed to −0.52 (at the 95% confidence levels) during 2007–2021. These results suggest that the AD anomaly was closely associated with summer Arctic sea ice in the more recent period (2007–2021). Although previous studies implied that summer Arctic sea ice loss may have contributed to recent AD anomalies [19,33,42], the relative contributions and physical mechanisms are still unclear. Additionally, it is also a challenge to distinguish between the common influences of the AD anomaly and the NAO on the climatic variability over Eurasia. Thus, the conclusions here are still preliminary and need to be further investigated in the future.

Author Contributions

Investigation, writing—original draft preparation, X.Z. (Xuanwen Zhang); investigation and editing, X.P. and X.Z. (Xiang Zhang); editing and original draft preparation, B.W. All authors have read and agreed to the published version of the manuscript.

Funding

This study was supported by the National Key Basic Research Project of China (2019YFA0607002), the National Key Research and Development Project of China (2022YFF0801701), the National Natural Science Foundation of China (42375023, 41905058), and the Research Foundation of Chengdu University of Information Technology (KYTZ202212).

Institutional Review Board Statement

Not applicable.

Informed Consent Statement

Not applicable.

Data Availability Statement

The data presented in this study are available in the article.

Conflicts of Interest

The authors declare no conflict of interest.

References

  1. Wettstein, J.J.; Deser, C. Internal Variability in Projections of Twenty-First-Century Arctic Sea Ice Loss: Role of the Large-Scale Atmospheric Circulation. J. Clim. 2014, 27, 527–550. [Google Scholar] [CrossRef]
  2. Zhou, F.; Liu, M.-H.; Shi, J.; Zhao, M.-Y. Long-Lasting Impact of Winter North Atlantic Oscillation on Barents-Kara Sea Ice Anomaly in Recent Decades. Environ. Res. Lett. 2023, 18, 044015. [Google Scholar] [CrossRef]
  3. Thompson, D.W.J.; Wallace, J.M. The Arctic Oscillation Signature in the Wintertime Geopotential Height and Temperature Fields. Geophys. Res. Lett. 1998, 25, 1297–1300. [Google Scholar] [CrossRef]
  4. Mori, M.; Watanabe, M.; Shiogama, H.; Inoue, J.; Kimoto, M. Robust Arctic Sea-Ice Influence on the Frequent Eurasian Cold Winters in Past Decades. Nat. Geosci. 2014, 7, 869–873. [Google Scholar] [CrossRef]
  5. Kim, B.M.; Son, S.W.; Min, S.K.; Jeong, J.H.; Kim, S.J.; Zhang, X.; Shim, T.; Yoon, J.H. Weakening of the Stratospheric Polar Vortex by Arctic Sea-Ice Loss. Nat. Commun. 2014, 5, 4646. [Google Scholar] [CrossRef] [PubMed]
  6. Wu, B.; Wang, J.; Walsh, J.E. Dipole Anomaly in the Winter Arctic Atmosphere and Its Association with Sea Ice Motion. J. Clim. 2006, 19, 210–225. [Google Scholar] [CrossRef]
  7. Overland, J.E.; Francis, J.A.; Hanna, E.; Wang, M. The Recent Shift in Early Summer Arctic Atmospheric Circulation. Geophys. Res. Lett. 2012, 39, L19804. [Google Scholar] [CrossRef]
  8. Cai, L.; Alexeev, V.A.; Walsh, J.E.; Bhatt, U.S. Patterns, Impacts, and Future Projections of Summer Variability in the Arctic from CMIP5 Models. J. Clim. 2018, 31, 9815–9833. [Google Scholar] [CrossRef]
  9. Fan, T.; Huang, F.; Zhou, X. Response of the Dominant Modes of Atmospheric Circulation in the Northern Hemisphere to a Projected Arctic Sea Ice Loss in 2007. J. Ocean Univ. China 2019, 18, 589–595. [Google Scholar] [CrossRef]
  10. Zhang, R. Mechanisms for Low-Frequency Variability of Summer Arctic Sea Ice Extent. Proc. Natl. Acad. Sci. USA 2015, 112, 4570–4575. [Google Scholar] [CrossRef]
  11. Overland, J.E.; Wood, K.R.; Wang, M. Warm Arctic-Cold Continents: Climate Impacts of the Newly Open Arctic Sea. Polar Res. 2011, 30, 15787. [Google Scholar] [CrossRef]
  12. Alexeev, V.A.; Walsh, J.E.; Ivanov, V.V.; Semenov, V.A.; Smirnov, A.V. Warming in the Nordic Seas, North Atlantic Storms and Thinning Arctic Sea Ice. Environ. Res. Lett. 2017, 12, 084011. [Google Scholar] [CrossRef]
  13. Wang, J.; Zhang, J.; Watanabe, E.; Ikeda, M.; Mizobata, K.; Walsh, J.E.; Bai, X.; Wu, B. Is the Dipole Anomaly a Major Driver to Record Lows in Arctic Summer Sea Ice Extent? Geophys. Res. Lett. 2009, 36, L05706. [Google Scholar] [CrossRef]
  14. Wu, B.; Overland, J.E.; D’Arrigo, R. Anomalous Arctic Surface Wind Patterns and Their Impacts on September Sea Ice Minima and Trend. Tellus A Dyn. Meteorol. Oceanogr. 2012, 64, 18590. [Google Scholar] [CrossRef]
  15. Stroeve, J.C.; Kattsov, V.; Barrett, A.; Serreze, M.; Pavlova, T.; Holland, M.; Meier, W.N. Trends in Arctic Sea Ice Extent from CMIP5, CMIP3 and Observations. Geophys. Res. Lett. 2012, 39, L16502. [Google Scholar] [CrossRef]
  16. Coumou, D.; Rahmstorf, S. A Decade of Weather Extremes. Nat. Clim. Chang. 2012, 2, 491–496. [Google Scholar] [CrossRef]
  17. Yu, L.; Yang, Q.; Zhou, M.; Zeng, X.; Lenschow, D.H.; Wang, X.; Han, B. The Intraseasonal and Interannual Variability of Arctic Temperature and Specific Humidity Inversions. Atmosphere 2019, 10, 214. [Google Scholar] [CrossRef]
  18. Wu, B.; Yang, K.; Francis, J.A. Summer Arctic Dipole Wind Pattern Affects the Winter Siberian High. Int. J. Climatol. 2016, 36, 4187–4201. [Google Scholar] [CrossRef]
  19. Polyakov, I.V.; Ingvaldsen, R.B.; Pnyushkov, A.V.; Bhatt, U.S.; Francis, J.A.; Janout, M.; Kwok, R.; Skagseth, Ø. Fluctuating Atlantic Inflows Modulate Arctic Atlantification. Science 2023, 979, 972–979. [Google Scholar] [CrossRef]
  20. Chen, S.; Wu, R.; Chen, W.; Yu, B. Influence of Winter Arctic Sea Ice Concentration Change on the El Niño–Southern Oscillation in the Following Winter. Clim. Dyn. 2020, 54, 741–757. [Google Scholar] [CrossRef]
  21. Screen, J.A. Far-Flung Effects of Arctic Warming. Nat. Geosci. 2017, 10, 253–254. [Google Scholar] [CrossRef]
  22. Coumou, D.; Di Capua, G.; Vavrus, S.; Wang, L.; Wang, S. The Influence of Arctic Amplification on Mid-Latitude Summer Circulation. Nat. Commun. 2018, 9, 2959. [Google Scholar] [CrossRef] [PubMed]
  23. Ding, S.; Wu, B.; Chen, W. Dominant Characteristics of Early Autumn Arctic Sea Ice Variability and Its Impact on Winter Eurasian Climate. J. Clim. 2021, 34, 1825–1846. [Google Scholar] [CrossRef]
  24. Tang, Q.; Zhang, X.; Francis, J.A. Extreme Summer Weather in Northern Mid-Latitudes Linked to a Vanishing Cryosphere. Nat. Clim. Chang. 2014, 4, 45–50. [Google Scholar] [CrossRef]
  25. Liu, L.; Wu, B.; Ding, S. On the Association of the Summertime Shortwave Cloud Radiative Effect in Northern Russia with Atmospheric Circulation and Climate over East Asia. Geophys. Res. Lett. 2022, 49, e2021GL096606. [Google Scholar] [CrossRef]
  26. Du, Y.; Zhang, J.; Zhao, S.; Chen, Z. A Mechanism of Spring Barents Sea Ice Effect on the Extreme Summer Droughts in Northeastern China. Clim. Dyn. 2021, 58, 1033–1048. [Google Scholar] [CrossRef]
  27. Li, J.; Zheng, F.; Sun, C.; Feng, J.; Wang, J. Pathways of Influence of the Northern Hemisphere Mid-High Latitudes on East Asian Climate: A Review. Adv. Atmos. Sci. 2019, 36, 902–921. [Google Scholar] [CrossRef]
  28. Peng, Y. Simulated Interannual Teleconnection between the Summer North Atlantic Oscillation and Summer Precipitation in Eastern China During the Last Millennium. Geophys. Res. Lett. 2018, 45, 7741–7747. [Google Scholar] [CrossRef]
  29. Liu, L.; Wu, B.; Ding, S. Combined Impact of Summer NAO and Northern Russian Shortwave Cloud Radiative Effect on Eurasian Atmospheric Circulation. Environ. Res. Lett. 2023, 18, 14015. [Google Scholar] [CrossRef]
  30. Hersbach, H.; Bell, B.; Berrisford, P.; Hirahara, S.; Horányi, A.; Muñoz-Sabater, J.; Nicolas, J.; Peubey, C.; Radu, R.; Schepers, D.; et al. The ERA5 Global Reanalysis. Q. J. R. Meteorol. Soc. 2020, 146, 1999–2049. [Google Scholar] [CrossRef]
  31. North, G.R.; Bell, T.L.; Cahalan, R.F.; Moeng, F.J. Sampling Errors in the Estimation of Empirical Orthogonal Functions. Mon. Weather Rev. 1982, 110, 699–706. [Google Scholar] [CrossRef]
  32. Choi, N.; Kim, K.M.; Lim, Y.K.; Lee, M.I. Decadal Changes in the Leading Patterns of Sea Level Pressure in the Arctic and Their Impacts on the Sea Ice Variability in Boreal Summer. Cryosphere 2019, 13, 3007–3021. [Google Scholar] [CrossRef]
  33. Serreze, M.C.; Stroeve, J.; Barrett, A.P.; Boisvert, L.N. Summer Atmospheric Circulation Anomalies over the Arctic Ocean and Their Influences on September Sea Ice Extent: A Cautionary Tale. J. Geophys. Res. Atmos. 2016, 121, 11–463. [Google Scholar] [CrossRef]
  34. Wu, B.; Li, Z. Possible Impacts of Anomalous Arctic Sea Ice Melting on Summer Atmosphere. Int. J. Climatol. 2022, 42, 1818–1827. [Google Scholar] [CrossRef]
  35. Wu, B. Winter Atmospheric Circulation Anomaly Associated with Recent Arctic Winter Warm Anomalies. J. Clim. 2017, 30, 8469–8479. [Google Scholar] [CrossRef]
  36. Takaya, K.; Nakamura, H. A Formulation of a Phase-Independent Wave-Activity Flux for Stationary and Migratory Quasigeostrophic Eddies on a Zonally Varying Basic Flow. J. Atmos. Sci. 2001, 58, 608–627. [Google Scholar] [CrossRef]
  37. Screen, J.A. Influence of Arctic Sea Ice on European Summer Precipitation. Environ. Res. Lett. 2013, 8, 044015. [Google Scholar] [CrossRef]
  38. Wang, B.; Wu, R.; Lau, K.M. Interannual Variability of the Asian Summer Monsoon: Contrasts between the Indian and the Western North Pacific-East Asian Monsoons. J. Clim. 2001, 14, 4073–4090. [Google Scholar] [CrossRef]
  39. Sun, L.; Shen, B.; Sui, B.; Huang, B. The Influences of East Asian Monsoon on Summer Precipitation in Northeast China. Clim. Dyn. 2017, 48, 1647–1659. [Google Scholar] [CrossRef]
  40. Hong, X.; Lu, R.; Chen, S.; Li, S. The Relationship between the North Atlantic Oscillation and the Silk Road Pattern in Summer. J. Clim. 2022, 35, 3091–3102. [Google Scholar] [CrossRef]
  41. Zheng, F.; Li, J.; Li, Y.; Zhao, S.; Deng, D. Influence of the Summer NAO on the Spring-NAO-Based Predictability of the East Asian Summer Monsoon. J. Appl. Meteorol. Climatol. 2016, 55, 1459–1476. [Google Scholar] [CrossRef]
  42. Yang, X.Y.; Wang, G.; Keenlyside, N. The Arctic Sea Ice Extent Change Connected to Pacific Decadal Variability. Cryosphere 2020, 14, 693–708. [Google Scholar] [CrossRef]
Figure 1. Mean (June–August) SLP anomalies in the summer (a,c) (shading, unit: hPa) regressed upon the normalized principal component time series corresponding to (a) EOF1 and (b) EOF2 for the interannual component of the Arctic (north of 70° N) summer SLP anomalies during 1979–2021. Stippling is used to denote statistically significant regions at the 90% confidence level according to Student’s t-test. (c,d) The normalized PC time series corresponding to EOF1 and EOF2, respectively. The first two patterns, respectively, account for 60.5% and 14.1% of the total variance. The map begins at 70° N, with dotted lines indicating latitudes separated by 5 degrees.
Atmosphere 15 00071 g001
Figure 2. Mean summer SLP anomalies (relative to the summer mean averaged over 1979–2021) for individual years since 2007. The map begins at 60° N, with dotted lines indicating latitudes separated by 10 degrees.
Atmosphere 15 00071 g002
Figure 3. Differences in mean summer (a) SLP and (b) 500 hPa geopotential heights between the period of 1979–2006 and the period of 2007–2021 (the latter minus the former); stippling is used to denote statistically significant regions at the 90% confidence level according to Student’s t-test. The map begins at 20° N, with dotted lines indicating latitudes separated by 10 degrees.
Atmosphere 15 00071 g003
Figure 4. Summer SLP anomalies derived from a linear regression on the normalized PC2 time series over different domains north of (a) 70°, (b) 60°, (c) 50°, (d) 40°, (e) 30°, and (f) 20° N. Stippling is used to denote statistically significant regions at the 90% confidence level according to Student’s t-test. The map begins at 20° N, with dotted lines indicating latitudes separated by 10 degrees.
Atmosphere 15 00071 g004
Figure 5. Regression of SLP (shading; unit: hPa) anomalies in summer on the normalized AD− time series during (a) 1979–2006 and on the normalized AD+ time series in (b) 2007–2021. (c,d) The same as in (a) and (b), but for the 500 hPa geopotential heights (shading; unit: gpm) and the corresponding horizontal wave activity flux (purple vector; unit: m s−1) anomalies. Stippling is used to denote statistically significant regions at the 90% confidence level according to Student’s t-test. The map begins at 20° N, with dotted lines indicating latitudes separated by 10 degrees.
Atmosphere 15 00071 g005
Figure 6. Regression of SAT (unit: °C) anomalies in summer on the normalized AD− time series during (a) 1979–2006 and the normalized AD+ time series in (b) 2007–2021. Stippling is used to denote statistically significant regions at the 90% confidence level according to Student’s t-test.
Atmosphere 15 00071 g006
Figure 7. Regression of summer precipitation (unit: mm) anomalies on the normalized AD− time series during (a) 1979–2006 and on the normalized AD+ time series in (b) 2007–2021. Stippling is used to denote statistically significant regions at the 90% confidence level according to Student’s t-test.
Atmosphere 15 00071 g007
Figure 8. Regression of 500 hPa zonal wind (shading, unit: m/s) anomalies in summer on the normalized AD− time series during (a) 1979–2006 and on the normalized AD+ time series in (b) 2007–2021. Purple contours indicate the climatological mean zonal wind at 500 hPa during 1979–2021. Stippling is used to denote statistically significant regions at the 90% confidence level according to Student’s t-test. The map begins at 20° N, with dotted lines indicating latitudes separated by 10 degrees.
Atmosphere 15 00071 g008
Figure 9. Regression of 1000 hPa meridional temperature gradient (MTG, unit: °C/°lat) anomalies in summer on the normalized AD− time series during (a) 1979–2006 and on the normalized AD+ time series in (b) 2007–2021. Stippling is used to denote statistically significant regions at the 90% confidence level according to Student’s t-test.
Atmosphere 15 00071 g009
Figure 10. Regression of 500 hPa geopotential height (shading, unit: gpm) anomalies in summer on the normalized AD− time series in (a) 1979–2006 and on the normalized AD+ time series in (b) 2007–2021 after removing the NAO variability. Stippling is used to denote statistically significant regions at the 90% confidence level according to Student’s t-test. The map begins at 20° N, with dotted lines indicating latitudes separated by 10 degrees.
Atmosphere 15 00071 g010
Disclaimer/Publisher’s Note: The statements, opinions and data contained in all publications are solely those of the individual author(s) and contributor(s) and not of MDPI and/or the editor(s). MDPI and/or the editor(s) disclaim responsibility for any injury to people or property resulting from any ideas, methods, instructions or products referred to in the content.

