Abstract
Changes in temperature seasonality influence a wide range of societal and natural activities. The characteristics of the temperature/thermal seasons in the Arabian Peninsula and how the seasons have changed remain unclear. Using observational and reanalysis data (1985–2022), this research (1) introduces a new approach to define seasons based on a hybrid hierarchical k-means clustering method, (2) documents the characteristics of temperature/thermal seasons, and (3) examines changes in the timings (onset and end) and lengths of the temperature seasons in the Peninsula. The results indicate that summer is the longest season (165 days), with the onset ranging from mid- to late April in the southern and northern Arabian Peninsula, respectively. Winter begins in late November and lasts until late February, with a length averaging around 92 days. Spring and autumn are the shortest seasons, lasting for about 52 days. The seasons demonstrate latitudinal patterns in their timings that correspond well to the seasonal changes in solar inclination. A trend analysis shows that summer is extending and becoming warmer, particularly at night. Winter is becoming shorter, with higher temperatures during both the day and night. Spring is starting and ending earlier, with a higher increase in the daytime temperature. The results of this research will be valuable in various applications relevant to sustainable ecosystems and human well-being.
1. Introduction
The ongoing changes in the Earth’s climate have been associated with changes in the timing and duration of the seasons [1], and many ecological and physical systems have been disrupted [2]. As the global mean temperature rises, many places are subjected not only to warmer temperatures but also the earlier arrival of spring and summer and delayed or shorter winters. Changes in climatological seasons have a wide range of impacts on human society, including on food production, health, energy demand, working hours, water resources, tourism, and many socioeconomic sectors [3,4,5]. This has led to a growing interest in monitoring the seasons and the related changes and impacts. Previous research has defined seasons using different approaches that can be categorized into five types [5]: synoptic-pattern-based, astronomical, meteorological, biological, and temperature-based. The synoptic-pattern-based approach defines seasons based on the variability in atmospheric circulation patterns using mutable upper-level meteorological variables. However, the use of upper-air measurements to define seasons is more suitable for application at a larger spatial scale but not at the subregional or individual location level [1,6].
The temperature-based approach involves the use of temperature thresholds. A common threshold is the 75th (25th) percentile to represent summer (winter) and accounts for spatial differences (e.g., Refs. [1,2]). That is, summer (winter) starts when the temperature is higher (lower) than the 75th (25th) percentile and ends when the temperature is lower (higher) than the 75th (25th) percentile. However, this approach assumes normality in the distribution of temperature across time and space. Surface air temperature has high temporal and spatial variability due to different climate regimes (e.g., desert or mountain climate) and local factors such as distance to a sea and urbanization [1,7]. Other studies have relied on fixed or absolute thresholds (e.g., Ref. [5]), an approach that is suitable for particular homogeneous climates or specific applications (e.g., plant phenology). Another temperature-based approach is to define the summer (winter) season using the warmest (coldest) consecutive 90 days or quarter of the year (e.g., Refs. [8,9]). However, this approach is more suitable for examining extreme summers/winters [10]. Furthermore, it suggests that summer and winter have identical lengths across time and space. As Allen and Sheridan [1] discussed, all four seasons may not necessarily exist at all locations, and the seasons may not be of equal length (three months) due to differences in the response of temperature to local factors. For example, Ref. [6] reported that summer can last for up to 5 months along the southeast coast of the USA. They also showed that the mid-Atlantic region is characterized by two longer seasons (summer and winter, averaging around 4 months each) and two shorter seasons (spring and autumn, averaging around 2 months each). In the Mediterranean region, winter has been found be the longest season, lasting about 4 months, with autumn lasting for 2.5 months [7,11]. This variation in season length poses a further challenge regarding the selection of temperature thresholds (e.g., 75th and 25th percentiles). For instance, the 75th percentile is commonly used based on the assumption that this threshold represents the warmest quarter of the year [1,12]; thus, the annual temperature cycle is divided into four periods of equal length. Likewise, both astronomical and meteorological seasons are arbitrary, as they do not reflect spatial variations and do not capture many regional ecological patterns well [6].
Summer in the Arabian Peninsula is commonly understood to be the longest season. Studies have shown that the Peninsula has been experiencing high rates of warming, and temperatures are projected to increase at a greater rate by the end of this century [13,14]. The Peninsula is characterized by a challenging dry and hot climate, making it more vulnerable to risks imposed by climate change. Arid and semi-arid environments are particularly sensitive to climate change due to the already hot temperatures and limited water resources [15]. Yet, research on the Peninsula’s seasons is limited to only one study [16]. The work of Ajjur and Al-Ghamdi [16] is the only detailed analysis of the seasons over the Peninsula to date and showed that during the period of 1950–2019, spring was the longest season (111 days) followed by summer (106 days) and winter (91 days). However, when only the most recent period 1990–2019 was considered, summer was found to be the longest season (126 days) followed by spring (83 days) and autumn (80 days). These results differ from the commonly hypothesized definition of seasons in the peninsula, in which summer is the longest season and spring and autumn are the shortest [17,18]. Ajjur and Al-Ghamdi’s results are based on the use of multiple variables, many of which are upper-level variables (i.e., synoptic-pattern-based). Incorporating different atmospheric variables (e.g., precipitation, surface air temperature, upper air temperature, and geopotential height) assumes homogeneous spatiotemporal characteristics in these variables, even though they can be related to different mechanisms and have different seasonality. For example, Ajjur and Al-Ghamdi [16] included three precipitation-related variables, and precipitation in the Peninsula occurs during two main seasons with high spatial variability [13]. Furthermore, the synoptic-pattern-based approach does not allow seasons to vary spatially, which is a key climatological characteristic of seasons [1]. Thus, the findings from [16] assume spatial homogeneous seasonal characteristics.
The characteristics of temperature seasons in the Peninsula and how the seasons have changed remain unclear. This research (1) introduces a new approach based on a hierarchical-based k-means method (hybrid clustering), (2) documents the characteristics of the temperature/thermal seasons, and (3) examines changes in the timings and durations of the temperature seasons in the Peninsula from 1985 to 2022. The developed approach makes no prior assumptions about the number of seasons and their length and allows seasons to vary spatially and temporally.
2. Data and Methods
2.1. Study Area and Data
The Arabian Peninsula lies in the southwestern part of Asia, bounded by the Arabian Gulf to the east, the Arabian Sea to the south, and the Red Sea to the west. The Peninsula extends approximately from 34.5° to 60° E longitude and from 12.5° to 32.5° N latitude, and the topography decreases from southwest to east (Figure 1). Much of the Peninsula is characterized by hot and arid climate conditions, excluding the southwest mountain region, which is hot and semi-arid. The annual mean rainfall ranges from 25 mm over the northwest areas to 230 mm over the southwest mountain areas, with two predominant rain seasons [13]: wet (October–May) and dry (June–September). The region is experiencing increasing trends in temperatures along with more frequent extreme hot events, and water resources, the energy sector, and human health are at higher risk [19].
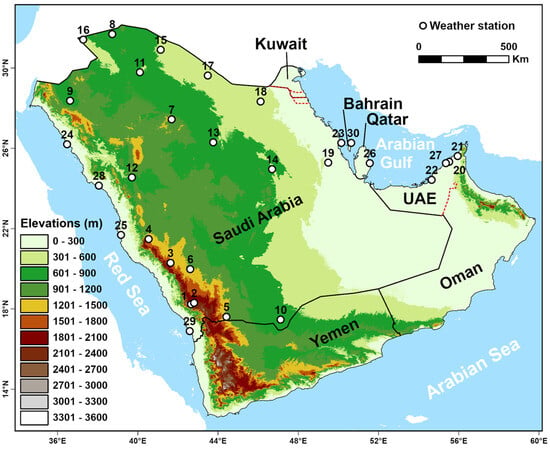
Figure 1.
A map showing the study area with elevations (in m) and weather stations’ IDs utilized in this work. Elevation data were used to number stations from high to low elevation. For stations’ names and other relative information refer to Table S1.
In this research, hourly air-temperature data for the period of 1985–2022 were acquired from observations and reanalysis data. Using hourly observations from the Hadley Centre Integrated Surface Database (HadISD) (Dunn et al. 2012), daily mean (Tmean), maximum (Tmax), and minimum (Tmin) temperatures were calculated for days with eight or more hourly observations. Stations with homogeneous series for 1985–2022 and less than 5% missing data annually were selected. The homogeneity of the station series was examined based on the penalized maximal F (PMF) test [20,21]. These quality control procedures resulted in the selection of 30 out of 70 stations (Figure 1 and Table S1). The HadISD data were used to develop a method for defining seasons and to evaluate its suitability. To allow for a more detailed spatial investigation, Tmean, Tmax, and Tmin were calculated from the fifth-generation ECMWF reanalysis ERA5-Land dataset (1985–2022). This dataset was selected because it has enhanced spatial (0.1° × 0.1°) and temporal (hourly) resolutions and provides a good representation of the temperature climatology over the Arabian Peninsula (Figure S1). Air-temperature observations (HadISD) and estimates (ERA5-Land) on February 29 were not included in this analysis.
2.2. Definition of Seasons
In order to find the most spatially and temporally relevant seasons, the seasons have to be defined in a way that accounts for differences in climate regimes, with no prior assumptions made about the annual cycle of temperature (i.e., number of seasons). Thus, an approach based on hybrid clustering was developed to split daily temperatures into k clusters (i.e., seasons) by grouping days with similar temperatures into clusters. Cluster analysis has long been successfully used in various meteorological and climatological applications and can be applied at the local scale to find groups/patterns (through time or space) without making any assumption about the number of groups. These two advantages are of particular importance when defining seasons in different climate regimes. Cluster analysis aims to divide unlabeled objects within data into a number of meaningful groups (i.e., seasons in this work). K-means and hierarchical clustering are the most widely used methods, and in this work, a hybrid hierarchical k-means clustering approach was implemented to combine the best of both methods. K-means clustering starts by initializing k cluster centroids/means using a random set of observations. Then, the algorithm iterates over the data to assign each data point to its nearest k-center, and cluster centers are updated until the lowest within-cluster variance for a given k is achieved. However, different runs of k-means can generate different cluster solutions due to the random initial placement of the cluster centroids, which can also result in the initiation of two centroids from two observations that are close together [22]. To address this limitation of initialization, a hierarchical-based k-means method was adapted based on Euclidean distance measure as follows [22]:
- Applying the agglomerative hierarchical clustering algorithm;
- Cutting the resulting tree into k clusters;
- Computing the centroid/center of each cluster;
- Applying the k-means clustering algorithm using the computed centroids (step 3) as the initial centroids/centers.
To find the suitable number of clusters (i.e., seasons), different k solutions were examined with the goal of driving groups (clusters) that best represent the annual structure of the temperature (i.e., number of seasons). A k solution that achieved the lowest (highest) within-cluster (between-cluster) variance was selected. To identify seasons, the cluster into which cold (warm) days were grouped was counted as winter (summer). Using the summer and winter clusters as controls, spring (autumn) clusters were considered to follow winter (summer).
The Tmean, Tmax, Tmin, and day length data were used to carry out the cluster analysis. The length of day (in hours) was calculated for each day of the year by finding the difference between sunrise and sunset times using the updated version of the US National Oceanic and Atmospheric Administration’s (NOAA) solar calculator methodology. Multiple temperature variables were used to capture multiple aspects of the thermal climatology. An initial analysis showed that all of the four variables provided comparable contributions to the clustering process (Figure S2). Before the analysis, daily temperature data were smoothed using a third-degree polynomial fitting to account for day-to-day temperature fluctuations and reduce the influence of outliers. This type of smoothing is commonly applied when defining temperature seasons (e.g., Refs. [2,12]). Then, the variables were scaled. Cluster analysis was applied at the local level (i.e., independently at each station/grid) to allow for spatial variation in the seasons [1].
2.3. Seasonal Indices and Trend Analysis
Three seasonal indices were used to document and study the temperature seasonality: start of season (SOS), end of season (EOS), and length of season (LOS). The SOS was defined as the date when the season starts. The EOS was defined as the last day of the season. The LOS was defined as the difference between the EOS and SOS. Before the trend analysis, the SOS and EOS indices were converted to the day number of the year, using January 1 as day 1 and December 31 as day 365. Thus, a positive (negative) trend in SOS indicates a later (earlier) start date. Linear regression was applied to assess the temporal trends when time series demonstrated a normal distribution. For time series with non-normal distributions, the Mann–Kendall (MK) test with Sen’s slope estimator was used. To account for the effects of serial autocorrelation on the power of the MK test, a time series with serial autocorrelation was pre-whitened [23]. Otherwise, the MK test was applied directly. This framework was applied to seasonal indices and seasonal temperatures at a significance level of α = 0.05.
3. Results and Discussion
3.1. Evaluation of Clustering
The proposed approach was evaluated based on the objective of detecting groups (clusters) that would best represent the annual structure of the temperature (i.e., its seasonality). This evaluation was based on the selected HadISD stations. Figure 2 illustrates an example of cluster analysis using five k solutions (2–6 k) at three weather stations. When a two-cluster solution was used, the annual cycle of temperature was grouped into two groups, corresponding to warm and cold periods. This suggests that cluster analysis with a two-cluster solution can be used when the goal is to distinguish warm and cold periods. The use of a three-cluster solution resulted in the annual cycle being classified into three groups, in which days with low temperatures and days with high temperatures were classified into two clusters (A and C, respectively), and days with temperatures in between were grouped into an independent cluster (B). Studies that defined seasons based on the percentile threshold (e.g., Refs. [1,2]) obtained similar results, with three main groups/seasons (winter, summer, and transition). In these studies, winter includes days with low temperatures (<25th) and summer includes days with high temperatures (<75th). Spring (autumn) is regarded as the transition from winter (summer) to summer (winter). Following this framework, the three-cluster solution results obtained in this research can be used to identify three main seasons. Cluster A was considered as winter as it contained days with low temperatures. Cluster C was regarded as summer as it included days with high temperatures. Cluster B was counted as a transitional season, with the early transition period (after winter) representing spring and the later transition period (after summer) representing autumn.
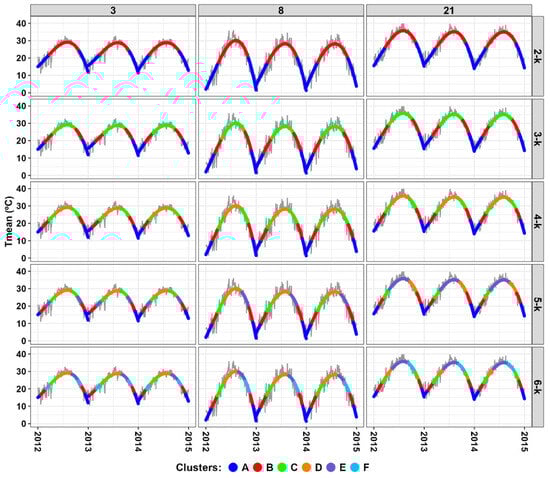
Figure 2.
Examples of using different clustering solutions (k) at three weather stations (IDs 3, 8, and 21). Gray solid line represents raw Tmean data.
Compared to the three-cluster solution, the four-cluster solution further divided the transition season (cluster B) into two new clusters: early spring/autumn and late spring/autumn (Figure 2). The additional cluster tended to include fewer days from summer and winter, with the transitional cluster contributing the most days. Solutions with five and six clusters further divided the additional cluster created by the four-cluster solution into further new clusters of seasons. This indicates that when the number of clusters is increased beyond three, additional new clusters only provide more details about transitional days that are close in distance and have homogeneous temporal behavior (i.e., similar in temperature magnitude). This suggests that using more clusters (≥4) provides very little improvement in minimizing (maximizing) within-cluster (between-cluster) variance. The analysis of the total within-cluster variance confirmed no significant improvement in homogeneity within clusters when the number of clusters increased beyond three across all of the selected HadISD stations (Figure S3). That is, the total within-cluster variance decreased remarkably for up to three clusters and then no substantial improvement was achieved (Figure S3). Similarly, little improvement in separation between clusters was achieved after three clusters as indicated by the total between-cluster variance (Figure S3).
In all the examined clustering solutions, it was noted that the temperatures at which the warmest periods started and ended differed (Figure 2). A further analysis (Figure S4) showed that the temperature changed (decreased) at a faster rate during the last third of the year compared to the first third of the year (increased) at most stations. That is, while the temperature increases gradually as summer approaches, it decreases remarkably as winter approaches (Figure S4). This supports the proposed approach and suggests that the use of a constant threshold (e.g., 75th percentile) would not account for this pattern as it assumes similarities in temperature magnitudes at the start and end of seasons. The established approach was also able to account and allow for temporal and spatial variability. The seasonal starting/ending temperatures shown in Figure 2 varied not only among stations (spatially) but also across years (temporally) at individual locations. When the annual cycles of temperature differed between years at a location, the approach was able to account for this when distinguishing different seasons. For instance, during a warm year, the cluster that represents summer tended to include additional days from early months (April and May) and/or late months (September and October). A similar but inverse situation was found during years with less warming. As [1] argued, seasons do vary through both space and time due to differences in local factors and the nature of the climate system. The obtained results support the developed approach as it allowed the seasons to vary spatially and temporally. Given the hotness and aridity of this region, variability in seasons has important implications for different sectors (such as electricity demands for cooling and water demands for irrigation).
3.2. Seasons’ Climatology
According to the above analysis, a three-cluster solution was selected to group the annual cycle of temperatures into three main clusters (using Tmean, Tmax, Tmin, and length of day): winter, summer, and transition. Winter (summer) was defined as the cluster into which cold (warm) days were grouped. For the transition cluster, the early transition period (after winter) was considered to represent spring and the later transition period (after summer) to represent autumn.
The latest seasonal start and end times were averaged at coastal stations, while the earliest start and end times were averaged at highland stations (Figure 3). Commonly, seasons tended to start first at stations in the southwestern region, followed by stations in the northern region and the east and northwest coasts, with average lags of 6–9 days. For instance, the mean SOS for spring was around the third week of February over the southwestern highlands, the last week of February over the northern parts, the first week of March along the east coast, and the second week of March along the northwest coast. The EOS showed a similar pattern, with lags averaging around 7 days. Autumn was the shortest season (47 days on average) and tended to start by early to mid-October and continue until late November or the first week of December. Spring was the second shortest season (55 days on average), extending from late February or early March until late April or early May. The average length of winter was 94 days, and it was shorter (longer) at high-elevation (coastal) stations. Summer had the longest average LOS, ranging from 162 to 167 days. These results agree with the commonly hypothesized definition of seasons in the Peninsula, where summer is the longest and spring and autumn are the shortest [17,18].
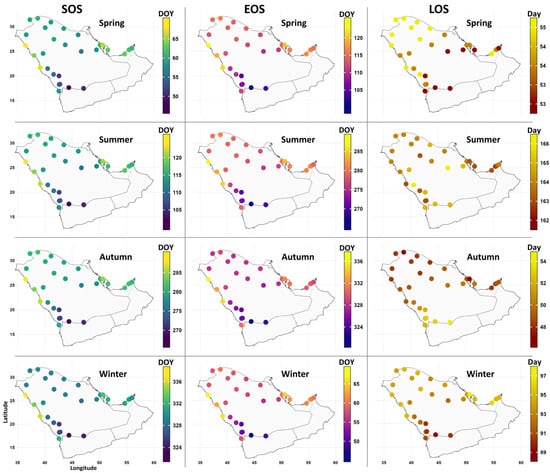
Figure 3.
Spatial distribution patterns for seasonal average SOS (left, in day of the year (DOY)), EOS (middle, in DOY), and LOS (right, in day) obtained from the HadISD dataset (1985–2022).
The results from Figure 3 seem to suggest latitudinal patterns of early SOSs and EOSs, particularly when coastal stations are excluded. That is, seasons tend to start/end first at stations at lower latitudes, and then at stations at higher latitudes. For further spatial analysis, Figure 4 displays the average SOS, EOS, and LOS using the ERA5-Land data from 1985 to 2022. The overall results confirm the latitudinal patterns in the SOS and EOS. This spatial pattern can be explained by the seasonal changes in solar inclination. As the sun passes over the equator northward, spring arrives earlier over the southern regions of the Peninsula. This early start of spring marks the early end of winter over the southern peninsula. This pattern was confirmed by an analysis of downwelling solar radiation (DSR) at the surface, as the southern peninsula receives higher DSR earlier in the year than the northern parts (Figure S5). The analysis illustrates that the annual cycle of near-surface temperature follows changes in the annual insolation, with a lag of around two months between maximum insolation and maximum temperature (Figure S5b). DSR reaches its maximum over the southern region of the Peninsula earlier in May (Figure S5b); consequently, summer starts earlier in that region. Summer over the mountainous southwest region and along the southern coast of Oman ends early, as this region experiences an early negative DSR anomaly. This can be explained by the onset of the monsoon season over the Arabian Sea. As the monsoon season develops in June, cloud cover increases; thus, downwelling solar radiation reaching the surface decreases over the southern peninsula (Figure S6), leading to an early ending of summer and the onset of autumn. The EOS in autumn and SOS in winter do not indicate higher spatial variability over most of the Peninsula except along coastal areas (Figure 4). For the LOS, the northern parts of the Peninsula were characterized by longer winters and springs, and shorter autumns and summers compared to the southern parts. The longer winters over the northern peninsula can be explained by the lower, negative DSR persisting longer (until March) in this area (Figure S5a).
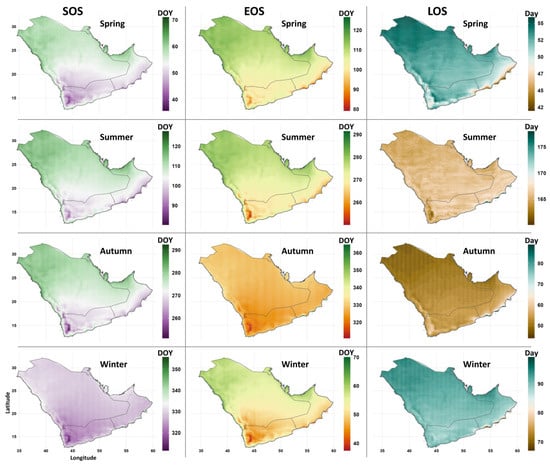
Figure 4.
As in Figure 3 but obtained from the ERA5-Land dataset (1985–2022).
The above analysis (Figure 3 and Figure 4) shows notable spatial differences in the SOS and EOS on both the local and regional scales, which can be attributed to the distances to water bodies, elevation, and seasonal changes in solar inclination. Locations along the east and west coasts had the latest starts (SOS) and ends (EOS) on average, and previous studies have indicated the importance of the proximity to water [1,6], as the temperature demonstrates a more gradual response to solar insolation over water bodies than over land [24]. Thus, temperatures over costal land tend to lag further behind solar insolation [16]. The southwest coast did not demonstrate constant patterns throughout the seasons, which may be linked to monsoon effects and the Arabian Sea being a more open water body compared to the Red Sea. Another possible factor is elevation, as the stations at higher elevations showed earlier SOSs and EOSs for all seasons (Figure 3). The ERA5-Land data also demonstrate earlier start and end dates in the southwest mountain area compared to the surrounding areas (Figure 4).
The overall results highlight the effectiveness of the proposed method. Given the agreement between the station data and reanalysis data, with the latter providing more spatial coverage, the regional mean statistics for 1985–2022 for two geographical areas, the southern peninsula (<23.5 °N) and the northern peninsula (≥23.5 °N), are summarized in Table 1. This latitudinal distinction was made based on the use of the tropical boundary (23.5 °N) and is supported by the spatial patterns shown in Figure 4. The seasons started and ended about one week earlier in the southern peninsula, with the exception of the EOS in autumn and the SOS in winter (for which there was a 3-day lag). Although the southern peninsula is expected to receive higher solar radiation as it is geographically closer to the equator region, seasons started and ended earlier compared to the northern peninsula. This can be attributed to the frequent presence of cloud cover due to monsoon effects and the fact that this subregion is characterized as having a longer wet season [25]. This in turn can explain the lower DSR intensity over the southern peninsula (Figure S5b). While autumn and spring were the shortest seasons, with an average length of about 50 days, summer was the longest season in both subregions. The onset and end of the warm seasons (spring and summer) tended to have higher temporal variability compared to autumn and winter. The lengths of summer and winter varied more, which may be due to their longer duration.

Table 1.
Mean start of season (SOS) dates, end of season (EOS) dates, and lengths of seasons (LOS, in days) along with standard deviations, between parentheses in days, (1985–2022).
3.3. Seasonal Temperature
Given the good representation of the temperature climatology provided by the ERA5-Land dataset, and to provide a detailed spatial assessment, temperatures from the ERA5-Land dataset were analyzed (Figure 5). During winter and spring, the west coast and southeast of the Peninsula had higher temperatures, and lower averages were largely confined to the southwest mountains and northern parts. During summer, the mountain ranges and some parts along the Arabian Sea coast exhibited lower daytime averages (Tmax). However, summer nighttime temperatures (Tmin) were lower over the mountain ranges and northern parts. Nights during spring and autumn tended to be colder over much of the peninsula, except along the west and south coasts and Rub Al-Khali.
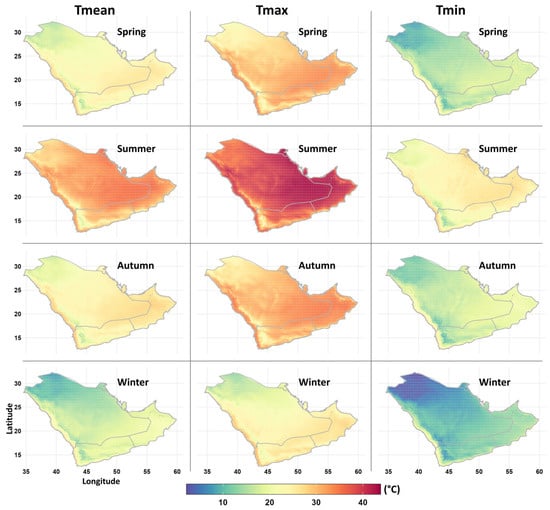
Figure 5.
Spatial distribution patterns for seasonal average mean (Tmean), maximum (Tmax), and minimum (Tmin) temperatures (°C) obtained from the ERA5-Land dataset (1985–2022).
The overall results indicate that lower temperatures were confined to the mountainous areas and the northern part of the peninsula, whereas the west and south coasts and the eastern parts were characterized by higher temperatures. This is consistent with previous studies [26,27,28]. The northern part showed the lowest average temperatures due to its close proximity to the influences of the Siberian high, Mediterranean cyclones, and cold fronts associated with the Shamal winds [27]. Table 2 summarizes the average temperatures over the last 38 years (1985–2023) for the southern and northern subregions. Average temperatures were higher for the southern peninsula than the northern peninsula, as the former is largely characterized by areas with higher temperatures (e.g., Rub Al-Khali; Figure 5). Studies have shown that the Rub Al-Khali desert is the hottest place in the Arabian Peninsula [26,27].
Table 2.
Average seasonal mean (Tmean), maximum (Tmax), and minimum (Tmin) temperatures (°C) along with standard deviations (between parentheses) obtained from the ERA5-Land dataset (1985–2022).
3.4. Trends
Figure 6 and Figure 7 display the spatial distributions of the temporal trends in the SOS, EOS, and LOS (1985–2022). There is agreement between the station data (i.e., the HadISD dataset) and the ERA5-Land data on the trend directions, with small differences in the magnitudes of trends. Together, they showed that spring and summer experienced downward trends in the SOS (excluding most of the southern region), indicating earlier start dates. Autumn and winter showed positive trends in the SOS across most of the peninsula, indicating a shift toward a delayed onset. For the EOS, spring and winter demonstrated negative trends (i.e., early end dates), except over the southern part. Summer and autumn showed a significant trend toward delayed end dates. As the start and end of seasons changed, so did the length, especially summer and winter. As summer started earlier and ended later, its length extended with rising temperatures (Figure 8). On the other hand, winter trended toward a shorter length, as spring started earlier and autumn ended later. Spring and autumn did not show a significant change in length at most of the locations, implying that the timing of both seasons shifted without the duration changing.
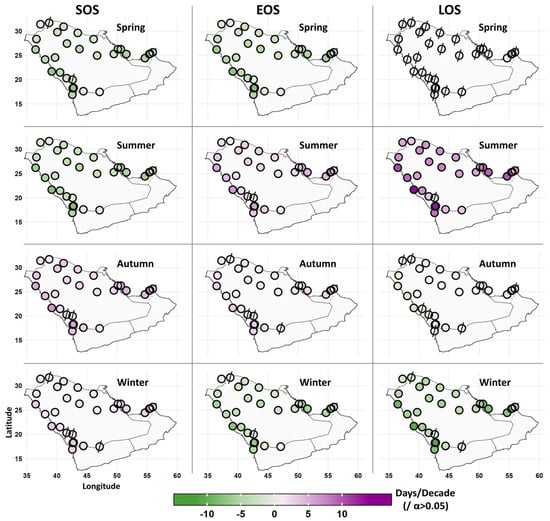
Figure 6.
Spatial distributions of decadal trends in start (SOS), end (EOS), and length (LOS) of the four seasons during the period of 1985–2022 obtained from the HadISD dataset. Stations with “/” had no statistically significant trends at the 5% level. Negative trends indicate earlier start dates, while upward trends indicate later start dates.
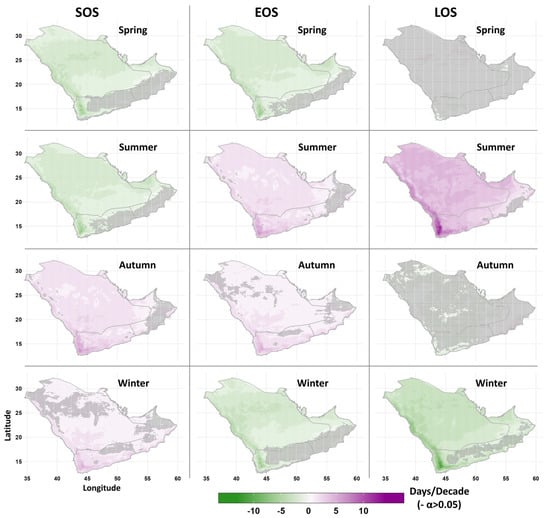
Figure 7.
Spatial distributions of decadal trends in start (SOS), end (EOS), and length (LOS) of the four seasons during the period of 1985–2022 obtained from the ERA5-Land dataset. Locations with “−” had no statistically significant trends at the 5% level. Negative trends indicate earlier start dates, while upward trends indicate later start dates.
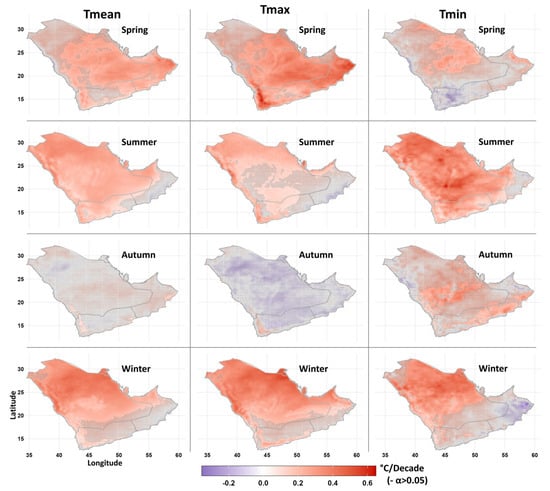
Figure 8.
Spatial distributions of decadal trends in seasonal average mean (Tmean), maximum (Tmax), and minimum (Tmin) temperatures of the four seasons during the period of 1985–2022 obtained from the ERA5-Land dataset. Locations with “−” had no statistically significant trends at the 5% level.
The mean temperature (Tmean) in winter demonstrated the highest warming over much of the northern parts, over which both Tmax and Tmin showed increasing trends (Figure 8). While summer experienced more warming in the Tmin across most of the Peninsula, spring had a higher increasing trend for Tmax, largely over the southern parts. Table 3 provides the regional average trends over the southern and northern areas of the Peninsula. The highest rate of change was in the length of summer in both subregions (4.3 and 4.6 days/decade). Tmin had the highest warming rate during summer over both subregions. The length of winter had the second highest rate of change; it was shortened by 4.2 and 3.5 days/decade. Winter in the northern peninsula showed the highest increases in Tmean and Tmax. The SOS and EOS demonstrated significant changes in both subregions with varying trend magnitudes. Compared to the southern region, the northern peninsula showed a larger trend toward an early onset during the warm seasons (spring and summer) and a smaller shift toward an early onset during autumn and winter.
Table 3.
Decadal-based temporal trends (1985–2022) for SOS, EOS, LOS (in days), and temperatures (in °C) of the four seasons. Significant values (α = 0.05) are represented by an asterisk.
4. Summary and Conclusions
Changes in seasonal temperature influence a wide range of human and natural activities. Using observational and reanalysis data from 1985 to 2022, this research developed a new approach using hybrid clustering to identify temperature/thermal seasons and document their characteristics and changes in the Arabian Peninsula. The results support the proposed approach, which detected four temperature seasons. Summer was found to be the longest season, extending over 165 days, with its onset ranging from mid-April over the southern part (southern peninsula) to late April over the northern part (northern peninsula). Winter began in late November and lasted until late February (92 days). Spring and autumn were the shortest seasons, extending for about 52 days on average. These results agree with the commonly hypothesized definition of seasons in the Peninsula, where summer is the longest and spring and autumn are the shortest [17,18]. However, the obtained characteristics of temperature seasons obtained in this analysis differ from those described in the work by Ajjur and Al-Ghamdi [16], the only detailed analysis of seasons over the Peninsula to date. Their analysis showed that spring was the longest season (111 days) followed by summer (106 days) during the period 1950–2019, and that summer was the longest season (126 days) followed by spring (83 days) when only the most recent period 1990–2019 was considered. Ajjur and Al-Ghamdi’s results are based on a synoptic-pattern-based method, which is more suitable for application at a larger spatial scale but not at the subregional or individual location level [1,6]. This is because a synoptic-pattern-based approach does not allow for spatial variation among seasons [1], unlike the approach developed here.
This work provided additional detailed spatial analysis using an approach that allows seasons to vary spatially and temporally, and demonstrated that summer is extending and becoming warmer, particularly at night. Spring is starting and ending earlier, with more warming in the daytime. Autumn is starting later, with no change in temperature. Winter is becoming shorter, with higher temperatures during the day and night. These results largely agree with those of [16], despite the difference in the methodology. Both analyses showed that the starts and ends of seasons over the Peninsula are changing and that summer is extending, whereas winter is becoming shorter. These findings agree with other studies carried out in different regions (e.g., Refs. [1,2,3,5,7]) and coincide with ongoing changes in the Earth’s climate.
Temperatures over the Arabian Peninsula are projected to increase at a greater rate by the end of this century [13]. Under such a projection, and with summers already getting longer and warmer and winters getting shorter and hotter, both societal and natural systems are vulnerable to greater risks. Compound changes (e.g., hotter and longer summers) lead to intense impacts on several socioeconomic sectors, including health, energy demand, and water resources. Further investigations into the implications of seasonal changes in the Arabian Peninsula are urgently needed in order to develop better adaptation strategies. This research contributes to such efforts by introducing a method to define seasons. This research highlighted the effects of water bodies, elevation, and monsoon. Additional analyses are needed to understand the mechanisms of variability and change in seasonal temperature to facilitate even better adaptation strategies. For example, identifying factors that lead to earlier or delayed onset would improve seasonal forecasting, allowing for effective planning.
Supplementary Materials
The following supporting information can be downloaded at: https://www.mdpi.com/article/10.3390/atmos15010026/s1. Figure S1: Taylor diagram showing the performance of the ERA5-Land dataset in representing Tmax, Tmean, and Tmin, climatology in comparison with observations at 30 weather stations (1985-2022); Figure S2: Boxplot of the contribution of variables to clusters at different weather stations using a 3-cluster solution at 30 weather stations. Contribution values (x-axis) were calculated from the permutation misclassification rate for individual variable using the mean misclassification rate over 50 iterations. See [29] for more details. Tmin: minimum temperature; Tmean: mean temperature; Tmax: maximum temperature; and LOD: length of day. For stations’ names, IDs, and relative information refer to Figure 1 and Table S1; Figure S3: Total within-cluster (upper) and between-cluster (lower) variances for different numbers of clusters (k) at all weather stations (30) used in this work. For stations’ names, IDs, and relative information refer to Figure 1 and Table S1; Figure S4: Change in mean temperatures (y-axis) during the first third (red) and last third (green) of the year on long scales at different weather stations. Days were ordered according to their sequences during each period (1st, 2nd, 3rd … day in each period). Rates of changes (values inside each panel in °C/day) were calculated using liner regression before plotting. For stations’ names, IDs, and relative information refer to Figure 1 and Table S1. Note data presented are before the cluster analysis; Figure S5: Spatial distribution of monthly anomalies (1985–2021) of surface solar radiation downwards (a) and averaged monthly mean temperature and surface solar radiation downwards over southern and northern parts of the Arabian Peninsula (b). Data were obtained from ERA5-Land dataset; Figure S6: May–Oct monthly cloud fraction (%) climatology (1987–2018) along with wind direction and speed at 950 hPa over the Arabian Sea region. Cloud data were obtained from ECMWF derived from AVHRR on multiple satellites. Wind data were obtained from ERA5-Land dataset. Table S1: List of stations used in this research obtained from the Hadley Centre Integrated Surface Database. Stations were ordered according to elevations from high to low elevation (ID).
Funding
This work was funded by the Deputyship for Research and Innovation, “Ministry of Education” in Saudi Arabia (IFKSUOR3-254-1).
Institutional Review Board Statement
Not applicable.
Informed Consent Statement
Not applicable.
Data Availability Statement
The HadISD dataset can be accessed from the Met Office Hadley Centre observations datasets (https://www.metoffice.gov.uk/hadobs/index.html, (accessed on 20 November 2023)). The ERA5-Land dataset can be accessed from the European Centre for Medium-Range Weather Forecasts (https://www.ecmwf.int/en/forecasts/dataset/ecmwf-reanalysis-v5-land, (accessed on 20 November 2023)).
Conflicts of Interest
The author declares no conflict of interest.
References
- Allen, M.J.; Sheridan, S.C. Evaluating changes in season length, onset, and end dates across the United States (1948–2012). Int. J. Clim. 2016, 36, 1268–1277. [Google Scholar]
- Wang, J.; Guan, Y.; Wu, L.; Guan, X.; Cai, W.; Huang, J.; Dong, W.; Zhang, B. Changing Lengths of the Four Seasons by Global Warming. Geophys. Res. Lett. 2021, 48, e2020GL091753. [Google Scholar] [CrossRef]
- Christidis, N.; Stott, P.A.; Brown, S.; Karoly, D.J.; Caesar, J. Human Contribution to the Lengthening of the Growing Season during 1950–1999. J. Clim. 2007, 20, 5441–5454. [Google Scholar] [CrossRef]
- Franchini, M.; Mannucci, P.M. Impact on human health of climate changes. Eur. J. Intern. Med. 2015, 26, 1–5. [Google Scholar] [CrossRef] [PubMed]
- Lee, E.; Im, A.; Oh, J.; Song, M.; Choi, Y.; Choi, D. Improved seasonal definition and projected future seasons in South Korea. Meteorol. Appl. 2022, 29, e2110. [Google Scholar] [CrossRef]
- Cheng, S.; Kalkstein, L.S. Determination of climatological seasons for the East Coast of the U.S. using an air mass-based classification. Clim. Res. 1997, 8, 107–116. [Google Scholar] [CrossRef][Green Version]
- Alpert, P.; Osetinsky, I.; Ziv, B.; Shafir, H. A new seasons definition based on classified daily synoptic systems: An example for the eastern Mediterranean. Int. J. Clim. 2004, 24, 1013–1021. [Google Scholar] [CrossRef]
- Dong, W.; Jiang, Y.; Yang, S. Response of the starting dates and the lengths of seasons in Mainland China to global warming. Clim. Chang. 2010, 99, 81–91. [Google Scholar] [CrossRef]
- Hekmatzadeh, A.A.; Kaboli, S.; Torabi Haghighi, A. New indices for assessing changes in seasons and in timing characteristics of air temperature. Theor. Appl. Clim. 2020, 140, 1247–1261. [Google Scholar] [CrossRef]
- Yan, Z.; Xia, J.; Qian, C.; Zhou, W. Changes in seasonal cycle and extremes in China during the period 1960–2008. Adv. Atmos. Sci. 2011, 28, 269–283. [Google Scholar] [CrossRef]
- Kotsias, G.; Lolis, C.J.; Hatzianastassiou, N.; Lionello, P.; Bartzokas, A. An objective definition of seasons for the Mediterranean region. Int. J. Clim. 2020, 41, E1889–E1905. [Google Scholar] [CrossRef]
- Park, B.J.; Kim, Y.H.; Min, S.K.; Lim, E.P. Anthropogenic and Natural Contributions to the Lengthening of the Summer Season in the Northern Hemisphere. J. Clim. 2018, 31, 6803–6819. [Google Scholar] [CrossRef]
- Almazroui, M.; Islam, M.N.; Saeed, S.; Saeed, F.; Ismail, M. Future Changes in Climate over the Arabian Peninsula based on CMIP6 Multimodel Simulations. Earth Syst. Environ. 2020, 4, 611–630. [Google Scholar] [CrossRef]
- Almazroui, M.; Khalid, M.S.; Islam, M.N.; Saeed, S. Seasonal and regional changes in temperature projections over the Arabian Peninsula based on the CMIP5 multi-model ensemble dataset. Atmos. Res. 2020, 239, 104913. [Google Scholar] [CrossRef]
- Singh, P.K.; Chudasama, H. Pathways for climate change adaptations in arid and semi-arid regions. J. Clean. Prod. 2021, 284, 124744. [Google Scholar] [CrossRef]
- Ajjur, S.B.; Al-Ghamdi, S.G. Seventy-year disruption of seasons characteristics in the Arabian Peninsula. Int. J. Clim. 2021, 41, 5920–5937. [Google Scholar] [CrossRef]
- Ali, A.H. Wind Regime of the Arabian Gulf. In The Gulf War and the Environment, 1st ed.; Taylor & Francis Group: Abingdon, UK, 1994; pp. 31–48. [Google Scholar]
- Alkolibi, F.M.A. Mid-Tropospheric Geopotential Height Patterns as Related to Temperature and Precipitation in Saudi Arabia. Ph.D. Thesis, ETD Collection for University of Nebraska, Lincoln, NE, USA, 1995; pp. 1–188. [Google Scholar]
- Rashid, I.U.; Almazroui, M.; Saeed, S.; Atif, R.M. Analysis of extreme summer temperatures in Saudi Arabia and the association with large-scale atmospheric circulation. Atmos. Res. 2020, 231, 104659. [Google Scholar] [CrossRef]
- Wang, X.L. Penalized Maximal F Test for Detecting Undocumented Mean Shift without Trend Change. J. Atmos. Ocean. Technol. 2008, 25, 368–384. [Google Scholar] [CrossRef]
- Wang, X.L. Accounting for Autocorrelation in Detecting Mean Shifts in Climate Data Series Using the Penalized Maximal t or F Test. J. Appl. Meteorol. Clim. 2008, 47, 2423–2444. [Google Scholar] [CrossRef]
- Chen, B.; Tai, P.C.; Harrison, R.; Pan, Y. Novel hybrid hierarchical-K-means clustering method (H-K-means) for microarray analysis. In Proceedings of the 2005 IEEE Computational Systems Bioinformatics—Workshops (CSBW’05), Stanford, CA, USA, 8–12 August 2005; pp. 105–108. [Google Scholar]
- Yue, S.; Pilon, P.; Phinney, B.; Cavadias, G. The influence of autocorrelation on the ability to detect trend in hydrological series. Hydrol. Process. 2002, 16, 1807–1829. [Google Scholar] [CrossRef]
- Dwyer, J.G.; Biasutti, M.; Sobel, A.H. Projected Changes in the Seasonal Cycle of Surface Temperature. J. Clim. 2012, 25, 6359–6374. [Google Scholar] [CrossRef]
- Alsaaran, N.A.; Alghamdi, A.S. Precipitation climatology and spatiotemporal trends over the Arabian Peninsula. Theor. Appl. Clim. 2022, 147, 1133–1149. [Google Scholar] [CrossRef]
- Almazroui, M.; Nazrul Islam, M.; Athar, H.; Jones, P.D.; Rahman, M.A. Recent climate change in the Arabian Peninsula: Annual rainfall and temperature analysis of Saudi Arabia for 1978–2009. Int. J. Clim. 2012, 32, 953–966. [Google Scholar] [CrossRef]
- Patlakas, P.; Stathopoulos, C.; Flocas, H.; Kalogeri, C.; Kallos, G. Regional Climatic Features of the Arabian Peninsula. Atmosphere 2019, 10, 220. [Google Scholar] [CrossRef]
- Almazroui, M. Changes in Temperature Trends and Extremes over Saudi Arabia for the Period 1978–2019. Adv. Meteorol. 2020, 2020, 8828421. [Google Scholar] [CrossRef]
- Pfaffel, O. FeatureImpCluster: Feature Importance for Partitional Clustering. 2021. Available online: cran.r-project.org/ (accessed on 4 October 2023).
Disclaimer/Publisher’s Note: The statements, opinions and data contained in all publications are solely those of the individual author(s) and contributor(s) and not of MDPI and/or the editor(s). MDPI and/or the editor(s) disclaim responsibility for any injury to people or property resulting from any ideas, methods, instructions or products referred to in the content. |
© 2023 by the author. Licensee MDPI, Basel, Switzerland. This article is an open access article distributed under the terms and conditions of the Creative Commons Attribution (CC BY) license (https://creativecommons.org/licenses/by/4.0/).