Article

The Importance of Wind Simulations over Dried Lake Beds for Dust Emissions in the Middle East

by
Nasim Hossein Hamzeh
1,
Abbas Ranjbar Saadat Abadi
2,
Dimitris G. Kaskaoutis
3,*,
Ebrahim Mirzaei
2,
Karim Abdukhakimovich Shukurov
4,
Rafaella-Eleni P. Sotiropoulou
5 and
Efthimios Tagaris
3
1
Department Meteorology, Air and Climate Technology Company (ACTC), Tehran 15996-16313, Iran
2
Department of Meteorology, Atmospheric Science & Meteorological Research Center (ASMERC), Tehran 14977-16385, Iran
3
Department of Chemical Engineering, University of Western Macedonia, 50100 Kozani, Greece
4
A.M. Obukhov Institute of Atmospheric Physics, Russian Academy of Sciences, 119017 Moscow, Russia
5
Department of Mechanical Engineering, University of Western Macedonia, 50100 Kozani, Greece
*
Author to whom correspondence should be addressed.
Atmosphere 2024, 15(1), 24; https://doi.org/10.3390/atmos15010024
Submission received: 6 October 2023 / Revised: 6 December 2023 / Accepted: 21 December 2023 / Published: 24 December 2023
(This article belongs to the Section Air Quality)

Abstract

:
Dust storms are one of the major environmental hazards affecting the Middle East countries, and largely originate in vast deserts and narrow dried lake beds. This study analyzes the inter-annual variation in dust weather conditions from 2000 to 2020 using data obtained from ten meteorological stations located around dried (completely or partly) lakes in Northwest (Urmia Lake) and South (Bakhtegan Lake) Iran. Since the wind regime is one of the most important factors controlling dust emissions in the dust source areas, wind speed simulations from the Weather Research and Forecasting (WRF) Model for 134,113 grid points covering the Middle East area, with a resolution of 5 km, were analyzed and compared with wind measurements at the stations around Urmia and Bakhtegan Lakes from 2005 to 2015. The analysis shows that the annual number of dust days was highly variable, presenting a significant increase at the stations around Urmia Lake during 2008–2011 and at the stations around Bakhtegan Lake in 2007–2012. Eleven years of WRF simulations of the mean diurnal wind patterns revealed that the highest 10 m wind speed occurred mostly around the local noon (12 to 15 UTC), generally coinciding with the majority of the reported dust codes within this time frame, as a result of the association between wind speed and dust emissions (dust weather conditions) around these lake basins. Consequently, accurate wind simulation has high importance for unbiased numerical prediction and forecasting of dust conditions. The comparison between the measured mean monthly 10 m wind speed and WRF-simulated 10 m wind speed revealed that the model overestimated wind data in all the stations around the Bakhtegan Lake but performed better at reconstructing the wind speeds at stations around Urmia Lake. Furthermore, notable differences were observed between measured and simulated wind directions, thus leading to uncertainties in the simulations of the dust-plume transport.

1. Introduction

Dust particles are one of the most important atmospheric pollutants, with multiple effects on air quality [1,2,3], radiative forcing and climate [4,5,6,7], cloud condensation nuclei and the hydrological cycle [5], atmospheric and environmental processes [8,9,10], snow cover and melting glaciers [11,12], ecosystems [13], and human life and welfare [14,15,16]. Desert areas are the main global dust sources [17], while dried lake beds in the continental interior may also significantly contribute to local and regional dust emissions [18,19,20,21]. Due to climate change, intense human intervention, and improper operation and management, many wetlands have been transformed into dry lake beds and dust sources in the last two decades [22,23,24]. Most of these dried beds emit saline dust storms, with varying dust chemical composition [25,26]. As a result, wetlands, a source of life and a major part of the ecosystem and biodiversity, have been converted into a disaster for the regional environment and human health [27,28].
The Middle East is the second largest dust source in the world after North Africa, contributing 15–20% to the global dust emissions [29,30]. Most dust particles originate from deserts in this area, such as Rub-Al Khali, An Nafud, and Al-Dhana Deserts in Saudi Arabia, Kavir and Lut Deserts in Iran, the Syrian–Iraqi Desert, and the Mesopotamian alluvial plains in Iraq [29,31]. Apart from the sandy deserts that contribute most dust emissions, the contribution from several dried beds is also important and cannot be ignored, and is a natural threat for people who live in the Middle East region [32,33,34].
Located between Uzbekistan and Kazakhstan in Central Asia, the Aral Sea is one of the most famous desiccated lakes in the world [27,35], and the dust storms originating from the lake’s dried parts highly affect the local regions, as well as neighboring and far countries [36,37,38,39,40,41]. In addition, some lakes in Iran that have dried sharply in recent decades are Jazmurian Lake in Southeast Iran [23] and Bakhtegan Lake in Southwest Iran, while the Hamouns in the Sistan Basin, East Iran, have been recognized as one of the most active dust sources in Southwest Asia [33,38]. Although the recent drought events in the Middle East region [24,42] have had a significant effect on the drying up of Bakhtegan Lake, the excessive consumption of water and the withdrawal of underground aquifers, illegal and unauthorized drilling of agricultural wells, and destruction and seizure of national lands had a significant impact on the dryness of the lake [43,44,45]. Urmia Lake is the largest lake in Iran that has mostly been transformed into a dried lake bed in the last two decades [46,47]. The main reasons for the lake’s desiccation are various anthropogenic activities, which can explain around 80% of the dryness, while the remaining 20% is due to climatic factors. Consequently, dust storms and PM concentrations in the surrounding regions have displayed a notable increase [48,49]. Due to the high salt concentration in the lake’s water and halite minerals in the dried beds, the dust outflows that originate from the lake beds are characterized as saline dust storms that damage the ecosystems in Urmia Basin [50,51]. Additionally, high water vaporization decreased the water level and enhanced the dust emissions from the lake’s bed in spring and summer [49].
Dust concentrations near the surface, as well as dust transport and deposition rates, are highly controlled by dust emission rates and the dynamics of a source to emit dust under favorable meteorological conditions [18]. Dust emission is highly variable and depends on several land surface, topographic, and meteorological factors [52,53], in which the wind, with various expressions such as wind shear, threshold friction velocity, synoptic wind patterns, and low-level jet, plays an important role [54,55,56]. Therefore, wind simulation is a critical issue for unbiased model predictions of dust emissions, concentrations, and lifecycle. However, its specific role and representation in meteorological and climate models for simulations of dust emissions are very challenging, especially for small (local) dust sources with specific characteristics such as dried lake beds [57,58,59,60,61,62].
In this study, the annual number of dust days in the period 2000–2020 (21 years) and the aerosol optical depth (AOD) of MODIS/Terra were briefly analyzed around two desiccated lakes in Iran (Urmia Lake and Bakhtegan Lake). The inter-annual and spatio-temporal evolutions of the number of dust days during the studied period were investigated at certain weather stations around the dried lake beds. The presence of dust at the meteorological stations was associated with the measured and simulated wind speed, aiming to explore its driving effect on dust activity in both lake basins. In the next step, the Weather Research and Forecasting (WRF) model was run for simulations of the 10 m wind speed and direction around the wetlands during 2005–2015 (11 years) and its outputs were compared against measured wind speeds and directions, aiming to investigate the accuracy of the WRF performance. Although previous studies have separately analyzed long-term changes in dust presence over these two dried lake beds [63,64,65,66,67], the current work provides a comprehensive analysis combining ground data and the WRF model’s simulated wind for a long period, aiming to ascertain the role of wind on dust emissions, as well as the accuracy of the wind simulations.

2. Study Area and Dust Storms

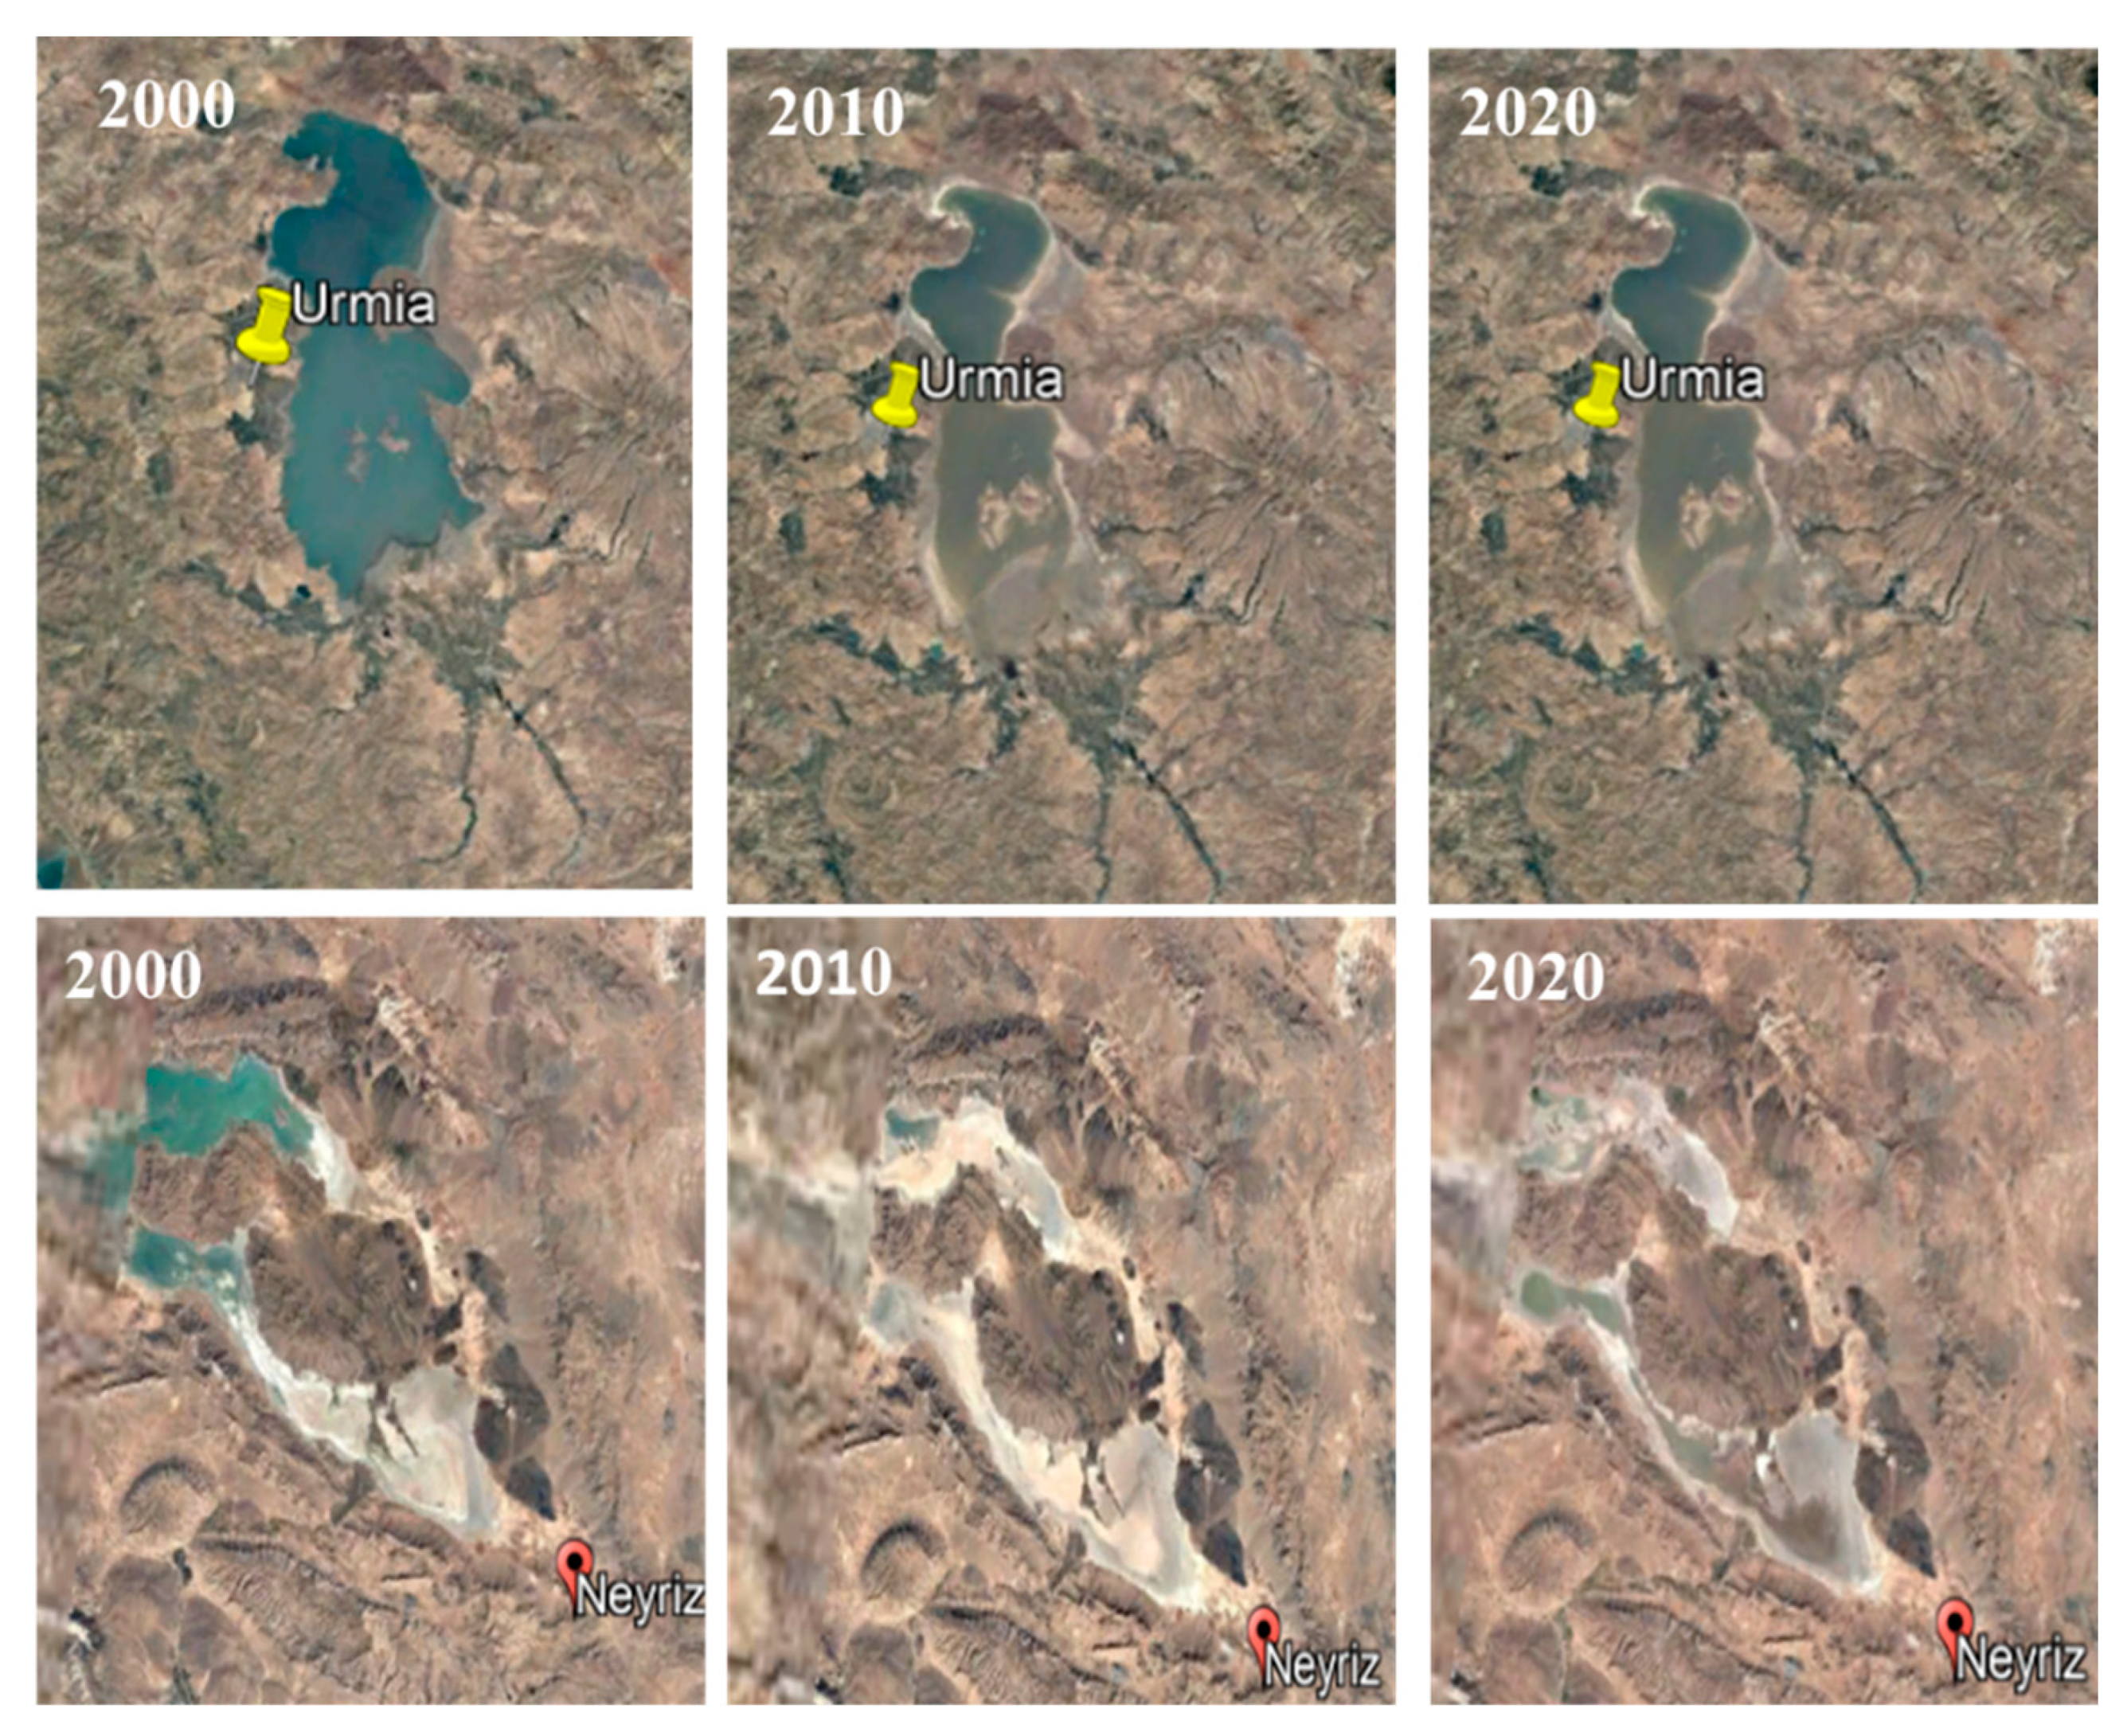
Urmia Lake (37–38.5° N, 45–46° E, 1273 m asl) in Northwest Iran and Bakhtegan Lake (29.1–29.55° N, 53.15–54.12° E, 1500 m asl) in the south, are the largest and second largest lakes in Iran, respectively. Recently, however, both have lost most of their water volume [68,69,70] (Figure 1 and Figure 2), and consequently, saline dust storms raised from the lake’s dried beds are affecting the surrounding areas [51]. Recent studies showed that the main cause of the water body loss is the construction of more than 50 dams over the rivers that nourish Urmia Lake, while climatic factors (temperature increase, droughts) contributed less [71,72,73]. Similarly, the construction of two big dams in neighboring rivers decreased the water body in Bakhtegan Lake, while climatic change and drought played a dual role in the disaster and desiccation of the lake, causing a substantial increase in toxic metals and in total dissolved solids [43].
In this analysis, we selected five dust-affected cities around Urmia Lake and the five dustiest weather stations around Bakhtegan Lake (Figure 1 and Table 1), to provide data on dust days, wind speed, and direction. Tabriz (46°14′ E, 38°04′ N; 1300 m asl) is the capital of East Azerbaijan Province and the largest industrial city in NW Iran, with about 1,774,000 habitants, while the saline dust storms that originate from Urmia Lake mostly affect this city due to dominant southwesterly winds [49]. Urmia city (45°04′ E, 37°32′ N; 1332 m asl) is the capital of West Azerbaijan province, with a population of about 786,000 habitants. The distance between the city and Urmia Lake is about 30 km. Nonetheless, Urmia city is less affected by saline dust storms compared to the eastern lake sites due to the prevailing wind direction in Urmia Basin [32].
In addition, Shiraz (52°32′ E, 29°37′ N; 1486 m asl) is the capital and largest city of Fars Province in South Iran, with a population of 1,887,000. Although it is near the dried Bakhtegan Lake, most of the dust storms impacting the city (see Table 1), as well as this southern Iran region, originate from the deserts in Saudi Arabia, coastal Persian Gulf, and Iraq [74,75].

3. Dataset and Methodology

3.1. Synoptic Weather Station Dataset

This study briefly analyzes the annual frequency of dust events from 2000 to 2020 at the weather stations in NW and southern parts of Iran, surrounding the two lake basins. This period was selected to study long-term variability in dust frequency and the substantial and reversing decadal trends in dust aerosols over the Middle East. This analysis aims to present the variability in dust activity, which is more or less affected by the local dust emissions from the dried lake beds. Table 1 summarizes the geographical characteristics (longitude, latitude, elevation) and the mean annual number of dust days at the selected meteorological stations. Dust events or days were identified by examining meteorological stations’ reports within a 24-h period, specifically focusing on the presence of at least one of the WMO’s synoptic codes associated with dust (06, 07, 30 to 35) [32,48]. The temporal resolution of these data is 3 h. Furthermore, 10 m wind speed (m/s) and direction are recorded at six synoptic stations around the two lakes every 3 h (8 times per day); however, in Bonab station around Urmia Lake, and Neyriz, Arsanjan, and Estahban around Bakhtegan Lake, the wind speed measurement happens from 6 UTC to 15 UTC (only 4 times in a day). The wind data were used in the analysis to evaluate the WRF simulations. The dust events and wind speed data were collected at the weather stations in accordance with WMO recommendations for meteorological measurements.
In Urmia Basin, the annual mean number of dust days was highest in Tabriz compared to the other stations in this region. The synoptic wind pattern during dust events is mostly southwesterly, and therefore, the downwind Tabriz station is mostly affected by the local/regional dust emissions originating from the dried Urmia playas [32,46]. In the stations around Bakhtegan Lake, the annual mean number of dust days was highest in Shiraz and Fasa. It should be noted that Bakhtegan Lake is highly affected by dust plumes transported from the Arabian Peninsula and the arid coastal areas near the Persian Gulf [74,76], while the desiccation of the lake also contributes to local/regional dust emissions, which affect the stations around the basin under certain weather conditions, depending on wind direction.

3.2. WRF Model Description

WRF is a regional atmospheric modeling system for meteorological research and numerical weather predictions [77,78,79], with Lambert projection and two nested grids. The model allows simulations of wind speed, among other meteorological parameters, on the spatial scales from ten meters to thousands of kilometers and from the surface air layer to the stratosphere. The WRF model is widely used for investigations of local and regional weather conditions [80,81]. In Iran the model has been used for investigations of rainfall, evaporation, and dust concentrations [82,83,84]. In this study, the model area was centered at 32° N and 55° W. For the best model performance, initially, different planetary boundary layer (PBL) schemes were coupled in the WRF model, and then the best evaluation between them (quasi-normal scale elimination scheme; QNSE PBL) was chosen for the long-term runs of WRF. In this analysis, we applied the WRF model version 3.9 to simulate eleven years (2005–2015) of wind speed and direction, temperature, and precipitation across Iran using the super-computing system provided by the Tehran Atmospheric Science and Meteorology Research Center (ASMERC). This period was characterized by large changes in atmospheric conditions, dust presence, droughts, and meteorological dynamics over the Middle East and seems to be ideal for evaluating the model’s performance over dried lake beds.

WRF Model Setup

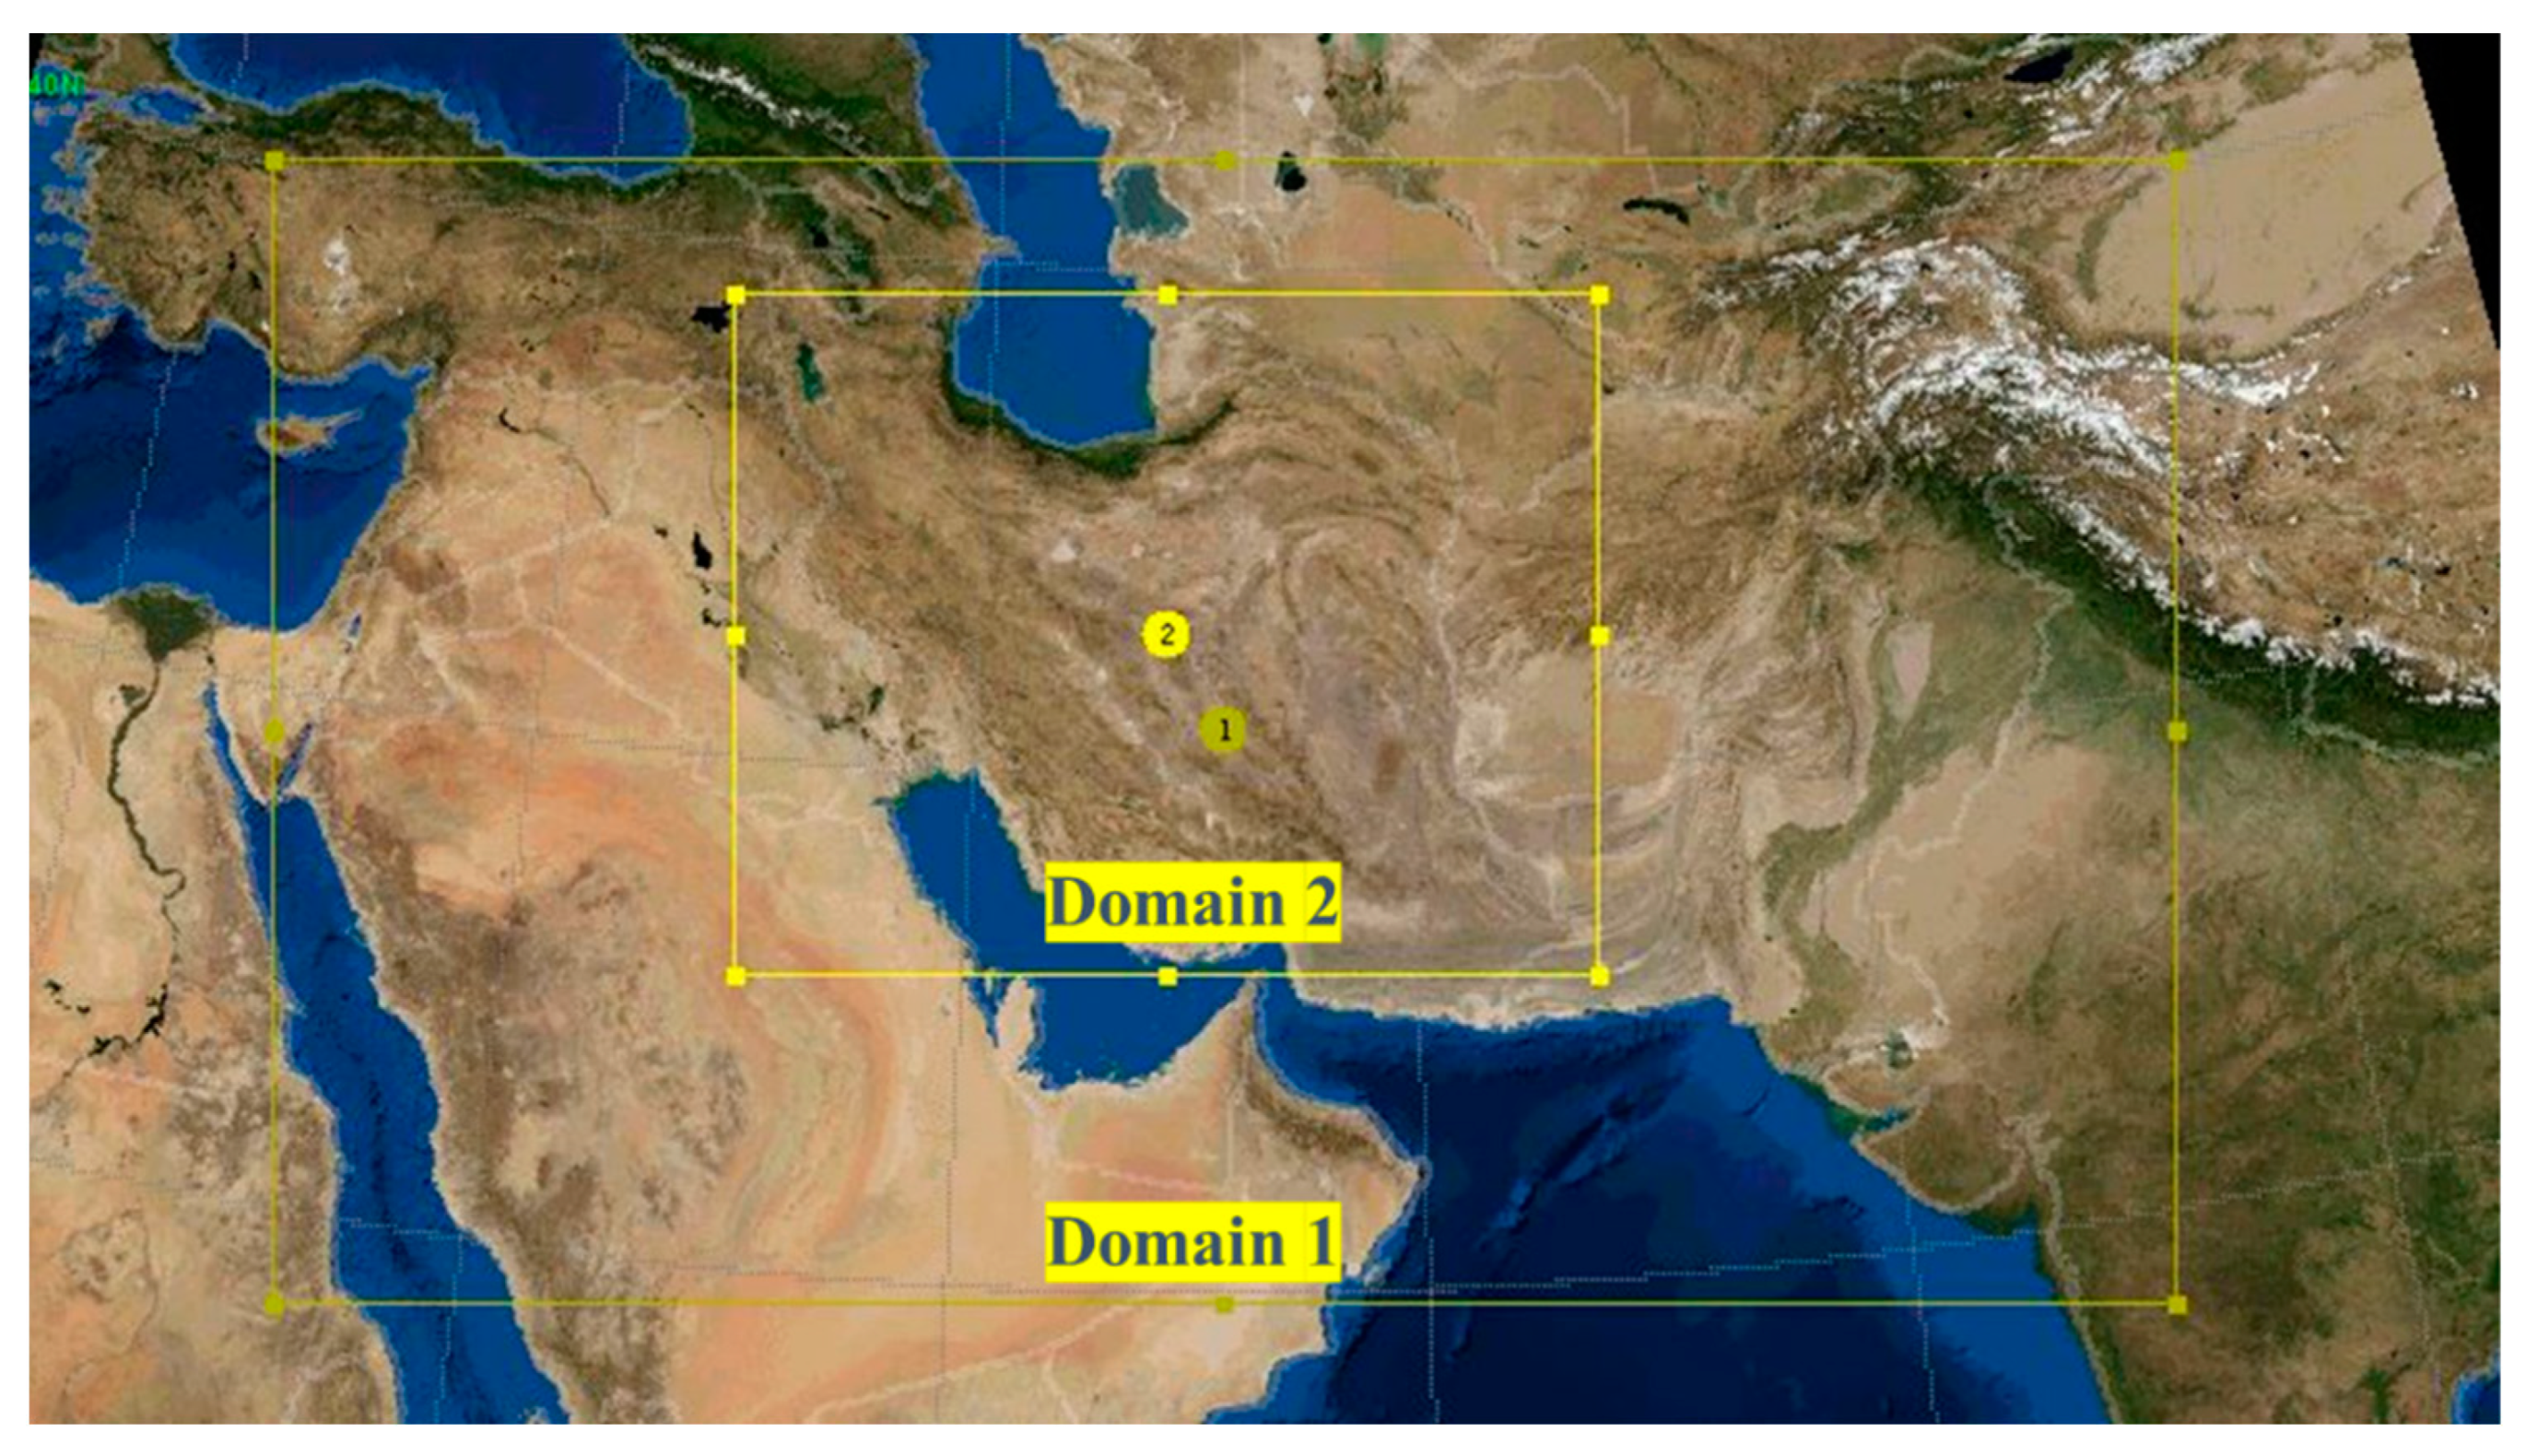
More specifically, two nested domains were used in this study, with spatial resolutions of 15 km for the first domain and 5 km for the second (Figure 3; Table 2). In the WRF model, 39 vertical levels are defined from the surface to the 100 hPa pressure level. ECMWF (European Centre for Medium-range Weather Forecasts) Era-Interim reanalysis (6 hourly data; 0.75° × 0.75° spatial horizontal resolution; 60 vertical levels up to 0.1 hPa) [81] covering the period from 1979 to the present was used for initial and boundary conditions. The terrestrial data for the model, including land mask, land use, topography, and albedo, were obtained from the United States Geological Service (USGS) database [85].
The WRF simulations were restarted every 2 days at 00 UTC, and the first 12 h of each simulation were moved as the spin-up. To estimate the best performance of the model in the simulation of the near-surface (10 m) wind speed and direction, a preliminary evaluation was carried out by a model-to-data comparison with five planetary boundary layer (PBL) and surface layer (SL) parameterizations during January (the coldest month) and July (the warmest month) in 2013. After the best configuration was detected, a simulation for one-year period was initially carried out to investigate the wind field in the study area.
Dust rising or emitted from desert and semi-arid areas strongly depends on 10 m wind speed over the dust sources [53,55,56]. In the WRF-Chem model, the dust flux depends on the horizontal wind speed at 10 m ( u 10 ) and on the threshold horizontal friction velocity ( u t ) [38,48]. In the GOCART dust scheme used here, the dust flux ( F P ) of a particle size class p is interpreted as follows:
F P = C S S P u 10 m 2 u 10 m u t    i f    u 10 m > u t 0    o t h e r w i s e
where S is the source function and C is a dimensional factor equal to 1 μ g   S 2   m 5 . Table 2 shows the details of the WRF configuration, including the model parameterizations used in this study.

3.3. MODIS (MODerate Resolution Imaging Spectroradiometer) Data

In this study we used data of aerosol optical depth at 550 nm (AOD550) measured in 2000–2020 by a MODIS sensor onboard the NASA/CNES Terra satellite. The used data (Deep-Blue Land only v. 6.1) were obtained using online tools at the GIOVANNI website [89]. The Terra satellite overpasses Urmia Lake and Bakhtegan Lake at ~10:10 (UTC ~06:40) providing measurements of AOD550 every day under cloud-free sky conditions. We used only the Deep-Blue Land algorithm because it is most appropriate for AOD investigation over arid lands near the ephemeral water bodies. AOD550 was averaged over the areas of 37–39° N, 44–45° E in the case of Urmia Lake and 29–30° N, 53–54° E in the case of Bakhtegan Lake.

4. Results and Discussion

4.1. Evolution of Dust Events in the Two Lake Basins

This section analyzes the evolution of the dust events/days on an annual basis using meteorological observations (WMO dust codes) at the synoptic weather stations around the two lakes in South and Northwest Iran from 2000 to 2020.
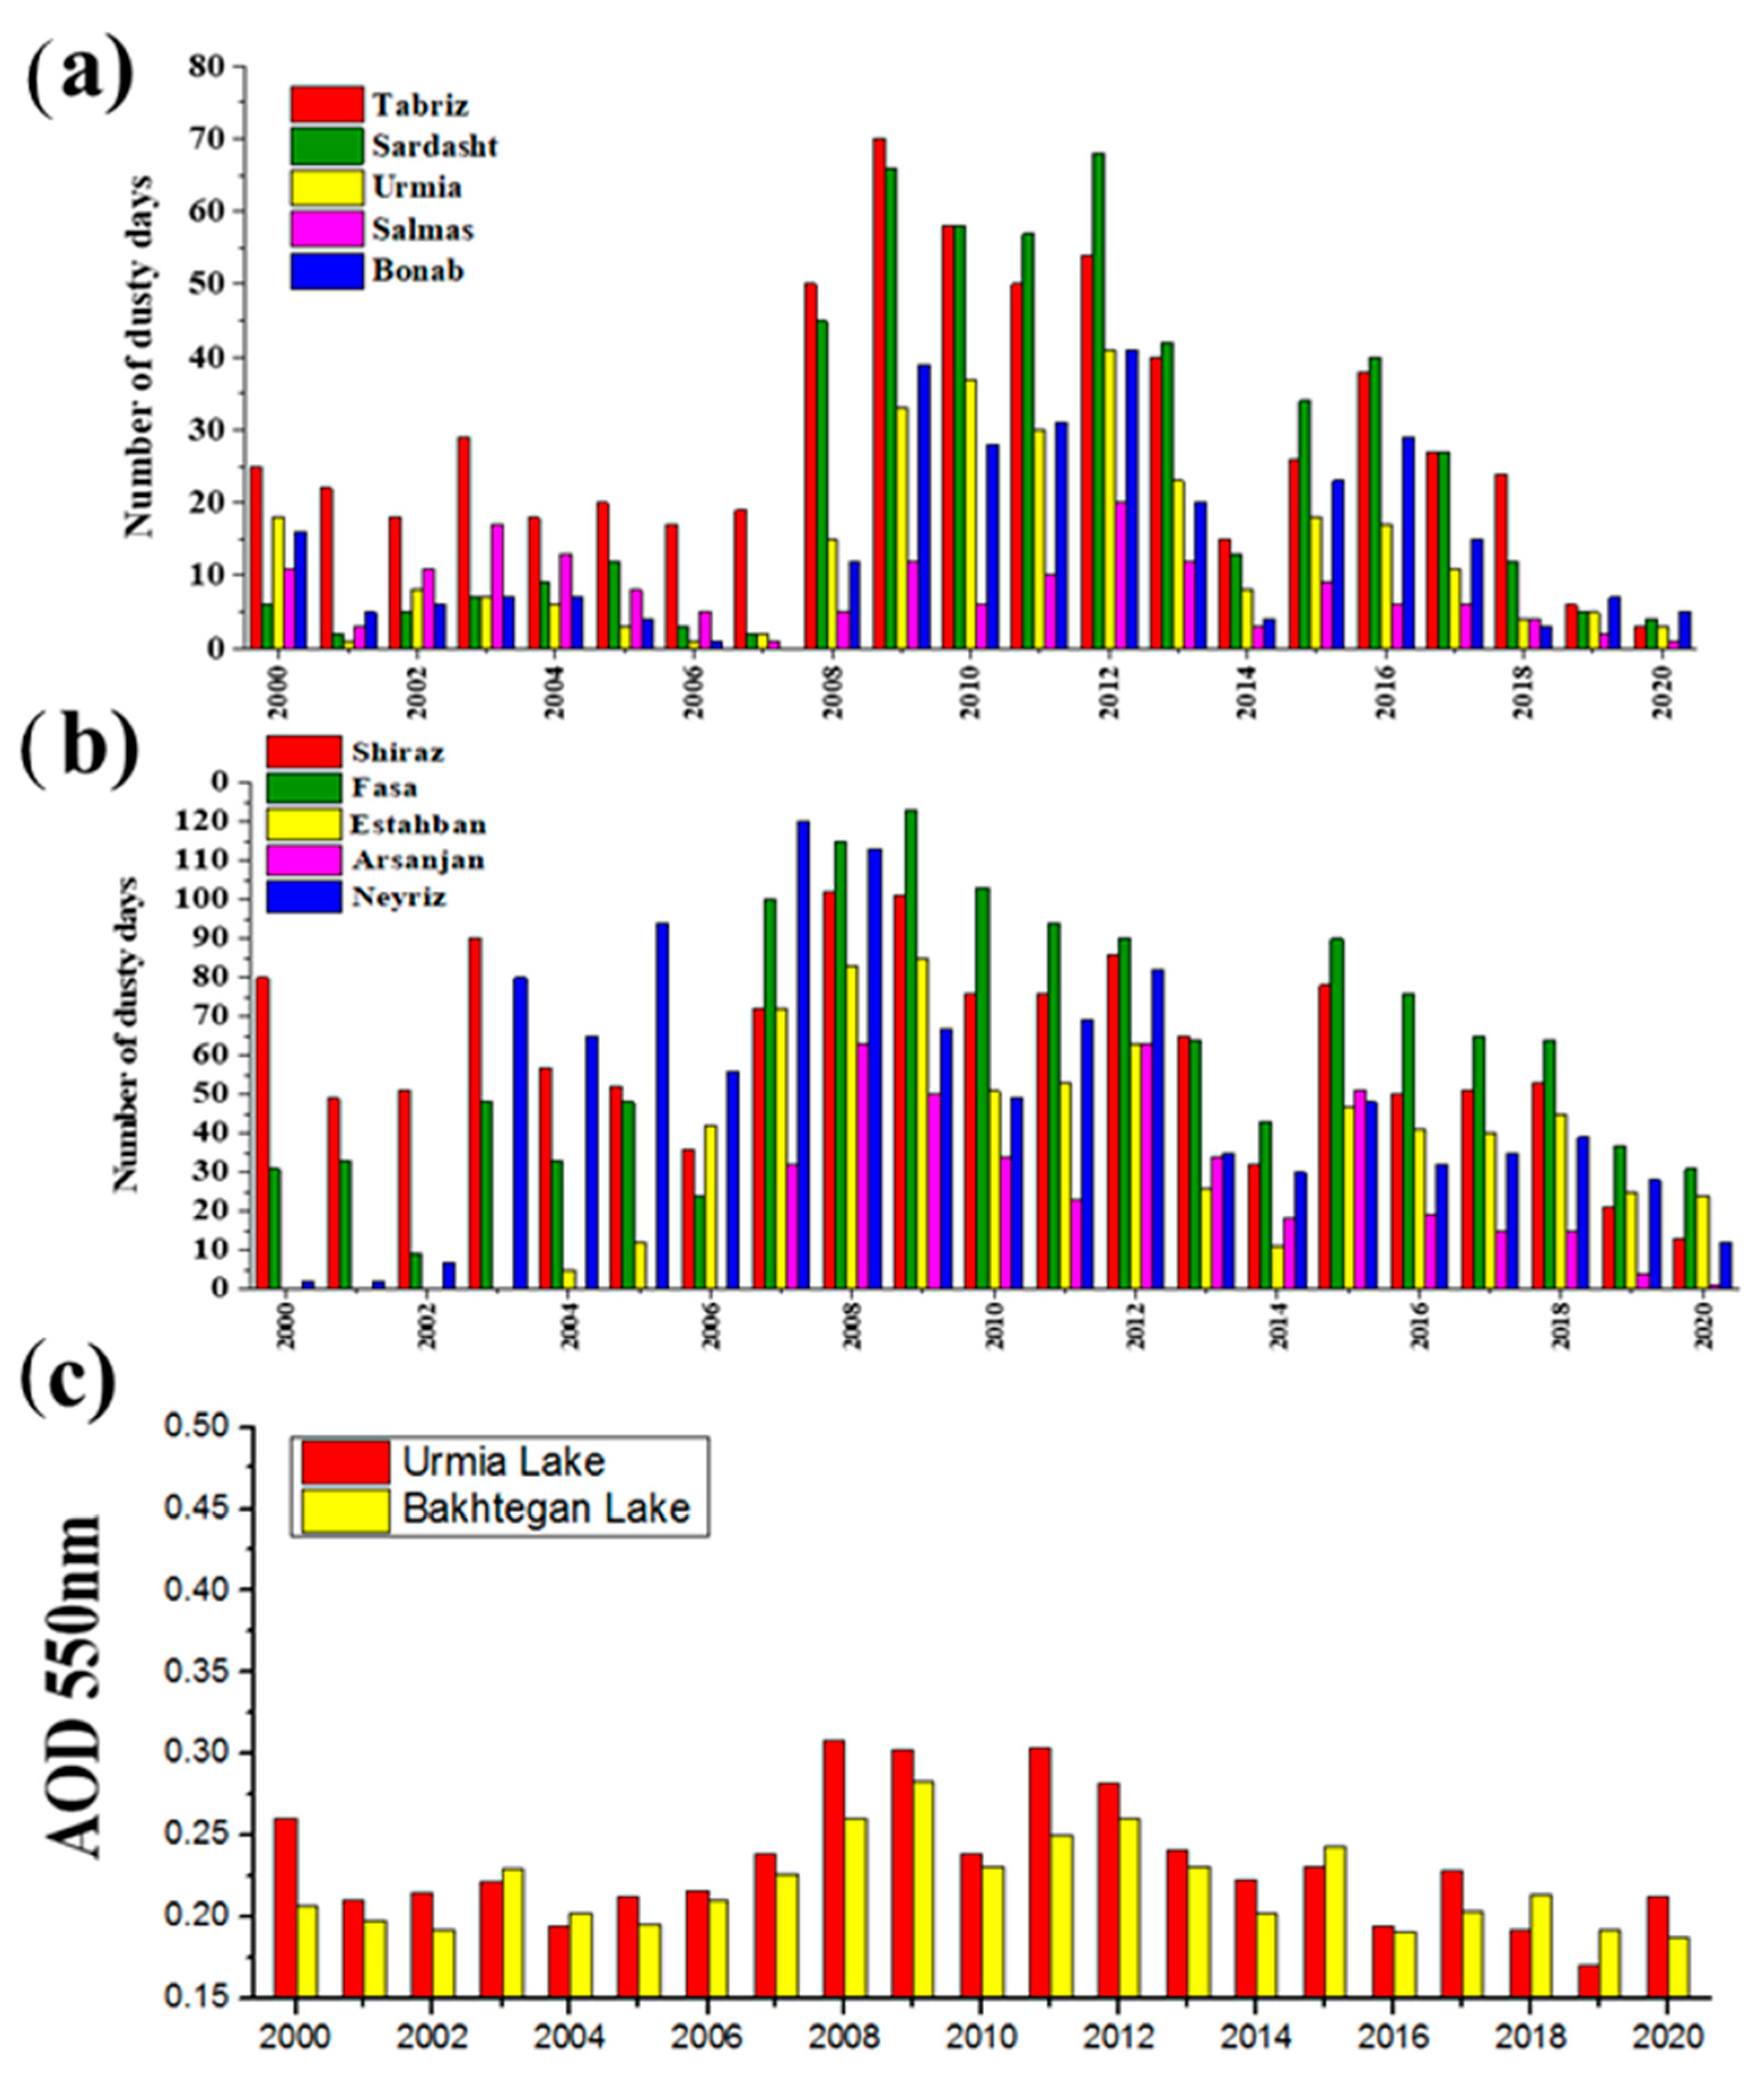
Figure 4a shows the annual mean number of dust days detected at the five stations around Urmia Lake. The dust activity during 2008–2012 was significantly enhanced compared to that during 2000–2007. This period coincided with the phase of frequent and intense dust storms in West and Southwest Iran [90,91], following the drought in Iraq and Syria [92,93]. As shown in Figure 4a, in almost every year of 2000–2020 the Tabriz station was more affected by dust compared to the Urmia station, despite the distance between the stations being only about 130 km. The difference in the annual number of dusty days could be explained by the local dust emissions from the dried bed of Urmia Lake, which has a greater impact on the lands at the eastern shore of the lake than the western lands. High dust activity and an increased number of dust days were also observed during this period (i.e., 2007–2013) in the stations around Bakhtegan Lake (Figure 4b). This is also mostly attributed to transported dust from the desert regions in Iraq and Syria during the drought period. However, a notable spatial variation in detected dust events at the stations located around Bakhtegan Lake (Figure 4b) is likely attributed to local dust (code 07) from the dried lake beds, especially for Shiraz station, which is located downwind of the lake. The annual variation in the Terra-MODIS (AOD550s) above both lake basins in 2000–2020 is presented in Figure 4c. The spatially averaged mean AOD550 was slightly higher over Urmia Basin in comparison with the Bakhtegan Lake Basin. The mean AOD550s notably increased since 2008 over both lakes, consistent with the enhanced dust presence reported at the meteorological stations. In Bakhtegan Lake, AOD550 decreased from 2017 to 2020 (following a similar trend to that in Urmia), which is coincident with a decreasing trend in the annual number of dust days reported at the five stations. However, AOD550 was higher in 2020 in comparison to 2019 in Urmia Basin, which did not coincide with the number of dust reports at the surrounding stations. Any inconsistency between the annual patterns of AOD550 and dust days may be explained by the fact that the dust events are related to surface observations, while AOD550 is related to the total column in the atmosphere. Other reasons are the different temporal resolution between AOD550 and meteorological observations, the lack of MODIS data under cloudy conditions, and the possible presence of dust only at elevated layers in the atmosphere. Furthermore, dust events are observed during the whole day, while Terra overpasses the stations once a day. Despite some inconsistencies between the columnar AOD550s and the number of dust days at the ground stations, the general view is an unprecedented increase in dust activity during 2008–2012, which was well documented in previous works [90,91,92,93].
The dust events over the two lakes are attributed to local emissions from the dry lake beds and to transported dust from various distant sources in Iran and in the Middle East. For example, Sardasht station to the southwest of Urmia Lake is located at the border between Iran and Iraq and is mostly affected by dust storms from the Mesopotamian plains and deserts in Iraq and Syria. Since the wind direction is mostly southwesterly during dust events in the Urmia Lake region, this station located southwest (upwind) of the lake is less affected by saline dust storms originating from the dried lake beds [32,34,94]. Additionally, dust storms originating from sources in the coastal area of the Persian Gulf mostly affected the stations around the Bakhtegan Lake [75]. Therefore, apart from the local winds, accurate simulations of the synoptic weather conditions, atmospheric circulation, and wind patterns are necessary for assessment of dust activity and prediction of the transported dust plumes [95,96,97,98]. The slight difference in the temporal variability and the maximum number of dust days between the two examined regions is due to different meteorological patterns and dust sources that mainly affect NW and southern parts of Iran [99]. For example, dust storms originating from the dust sources in Saudi Arabia, Kuwait, and the southern and northern coasts of the Persian Gulf rarely affect Urmia Basin, but they frequently affect Bakhtegan Lake, thus resulting in the highest number of dust days (Figure 4).
Table 3 shows the slope values of the linear regression trends of the annual number of dust days from 2000 to 2020 at the meteorological stations. We separated the whole period into two decades i.e., 2000–2010 and 2011–2020, also taking into consideration the peak in dust activity during ~2008–2012. The period from 2000 to 2010 showed a pronounced positive trend in dust occurrence at all stations (except Salmas in NW Urmia Lake). However, from 2010 to 2020, negative trends were observed around Urmia and Bakhtegan Lakes, since all the stations reported a decrease in the number of dust days. Therefore, the dusty period between 2008 and 2012 in the Middle East region is the major regulatory factor for the frequency, long-term variations, and trends of dust phenomena in the two lake basins. The analysis of Terra-MODIS AOD550 over the two lakes also showed a positive trend in the first decade and a negative trend afterwards, similar to dust days, and to several previous studies in the Middle East [100,101].

4.2. WRF Model Simulations

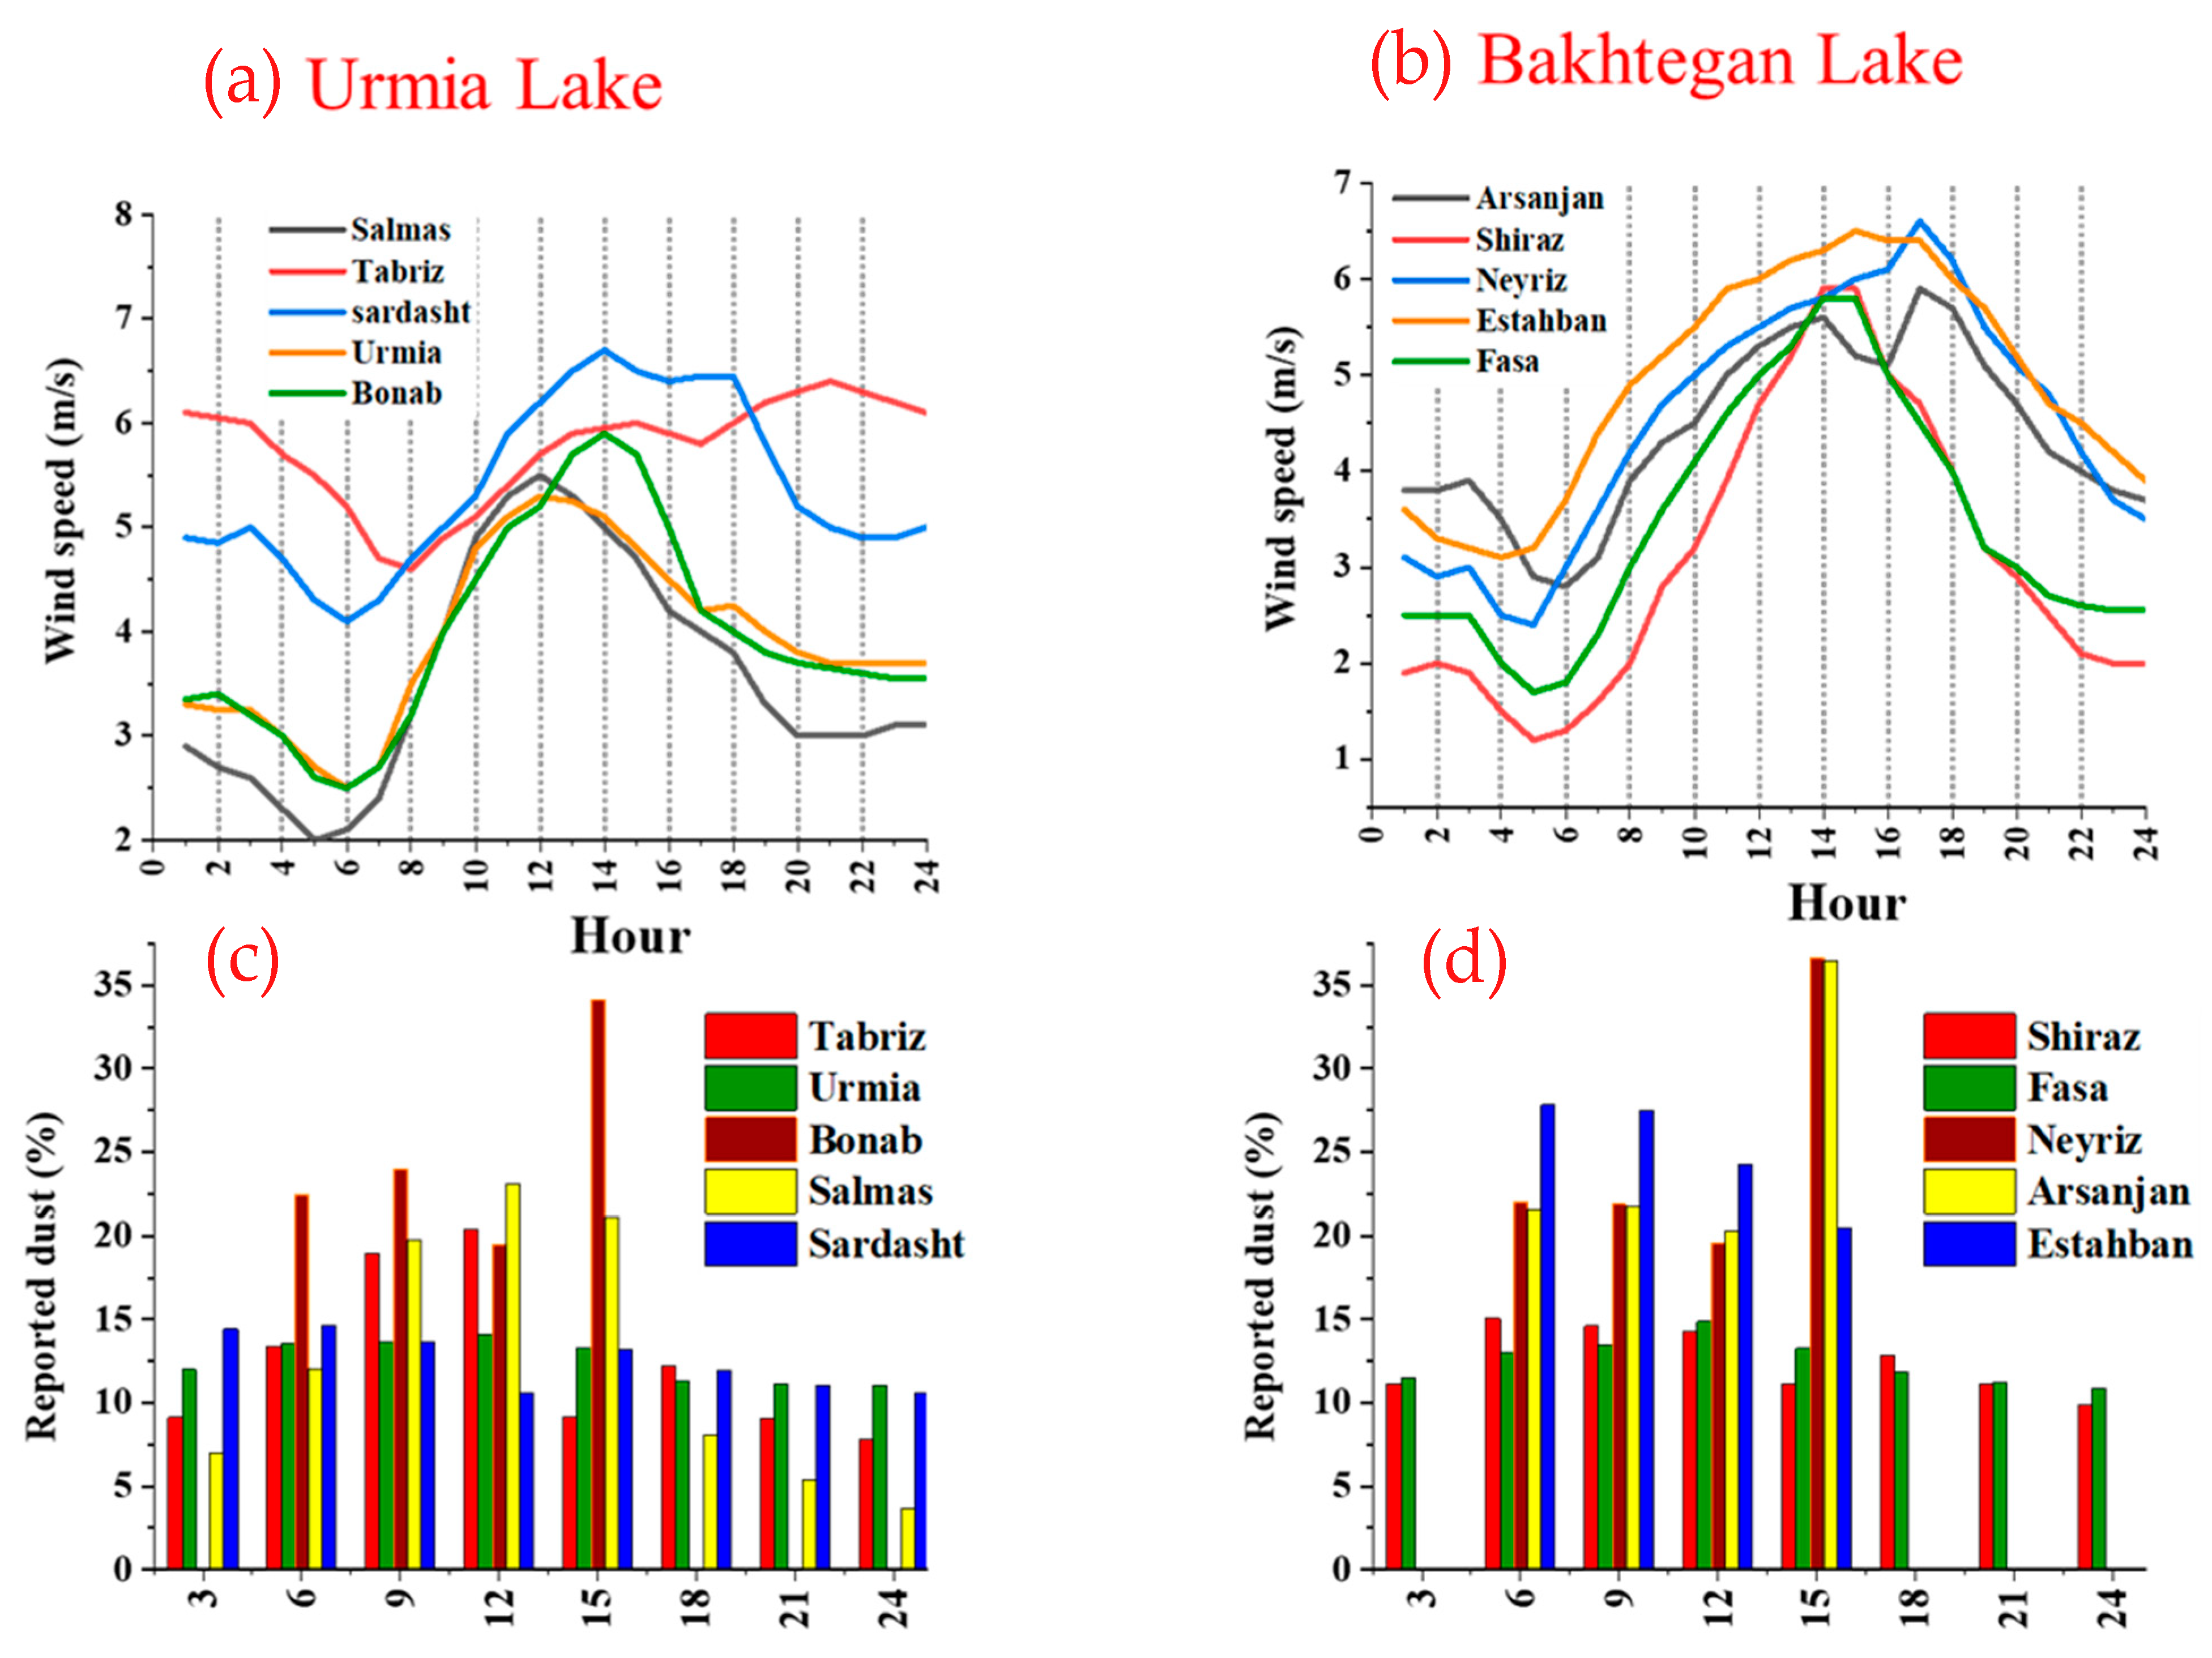
Figure 5a,b show the mean 11-year diurnal variations of the WRF model simulations for the 10 m wind speed (m/s) at the study sites surrounding Urmia and Bakhtegan Lakes. The WRF simulations showed a highest wind speed of 5.9 m/s (at 14 UTC) at Bonab station, 5.4 m/s (at 12 UTC) at Urmia station, 6.6 m/s (at 14 UTC) at Sardasht station, 6.3 m/s (at 21 UTC) in Tabriz, and 5.5 m/s (at 12 UTC) in Salmas. Although the model simulated a secondary maximum of 6 m/s at 15 UTC in Tabriz, it was not so expected that the highest wind speed was simulated at night (21 UTC). Around Bakhtegan Lake, the maximum WRF-simulated mean wind speed was 5.9 m/s (14 and 15 UTC) at Fasa, 6.5 m/s (12 UTC) at Estahban, 6.6 m/s (17 UTC) at Neyriz, 5.9 m/s (14 UTC) at Shiraz, and 5.8 m/s (17 UTC) at Arsanjan stations. Therefore, the WRF model simulated the highest wind speeds in the afternoon hours, between 12 and 15 UTC (+3:30 LST), at the examined stations in both lake basins. Furthermore, the wind regime according to WRF simulations is more uniform at the stations around Bakhtegan Lake, but quite different and variable between the stations in Urmia Basin, where the hourly wind speeds in Sardasht (SW) and Tabriz (NW) are markedly higher than those in the other stations.
Stronger winds during daytime are likely associated with local atmospheric dynamics and thermodynamics processes and the development of local cells in the lake basins [98,102]. Due to thermal heating of the surface, turbulent kinetic energy and convection increase as the day progresses and this thermodynamic process enhances the wind speed during noon to early afternoon hours over the desert arid terrains. In this respect, a series of previous studies also reported maximum wind speeds during the noon to early-afternoon hours in Iranian cities. Mohammadi and Mostafaeipour [103] investigated 10 m wind speed at Zarrineh station in NW Iran from 2004 to 2009 and showed that the maximum mean wind speed was 6.3 m/s at 12 UTC. Mostafaeipour et al. [104] reported a highest annual mean 10 m wind speed of 6.52 m/s at 15 UTC at Binalood station (NE Iran) in 2007–2010, while Pishgar-Komleh et al. [105] also showed that the maximum wind speed (6.55 m/s) occurred in the afternoon (12 to 15 UTC) from 2001 to 2010 at Firouzkooh station (80 km east of Tehran). Early-afternoon maximums of the wind speed were also observed in Zahedan [106] and Zabol [107], which are dusty environments in SE Iran.
Figure 5c,d show the relative (percentage) mean diurnal pattern of the reported dust hours at the ten stations around Urmia and Bakhtegan Lakes. The synoptic stations mostly reported weather codes eight times per day (every three hours) but some of them (such as Bonab in Urmia Basin, and Arsanjan, Neyriz and Estahban around Bakhtegan Lake) only reported weather codes four times per day, from 06 UTC to 15 UTC (9:30 a.m. to 18:30 p.m. local time). Thus, the percentage contributions of the dust codes are higher in these stations. In general, the dust presence around each station exhibits an increasing tendency from 06 UTC to 15 UTC, and this pattern is consistent with the hourly diurnal cycle of the simulated wind speeds. Therefore, as should be expected for arid environments with nearby dust sources, there is evidence that enhanced winds (measured and simulated) are associated with increased dust presence, suggesting favorable meteorological conditions for dust emissions over the stations. In the examined stations, this association is not very strong, as the reported dust events mostly present a small diurnal cycle. Furthermore, as stated above, stations may be influenced by other distant dust sources and not exclusively from the dried beds of Urmia and Bakhtegan. Note also that wind simulations are continuous during the whole examined period (2005–2015), while the reported dust days constitute only a small fraction of the total days with wind simulations.
Rashki et al. [106] found a notable consistency between the seasonal mean wind diurnal patterns and the respective PM10 concentrations in Zahedan, SE Iran, with highest wind speeds and PM10 levels during noon to early-afternoon hours, since that station was affected by a well-defined dust source (Sistan Basin) and under the influence of steady northern wind (Levar). Therefore, a general finding is that wind is a major regulatory factor for dust emissions, which is also verified at narrow dust sources such as dried lake beds. Consequently, accurate model wind simulation is a major deterministic factor for the assessment of dust emissions and concentrations over these regions. Previous studies also showed that the effect of wind on dust particle size is especially important for parameterization of dust emissions. Thus, accurate numerical simulations of the wind regime, dust particle size distribution, and soil and topographic characteristics are needed [53,57,108,109,110].
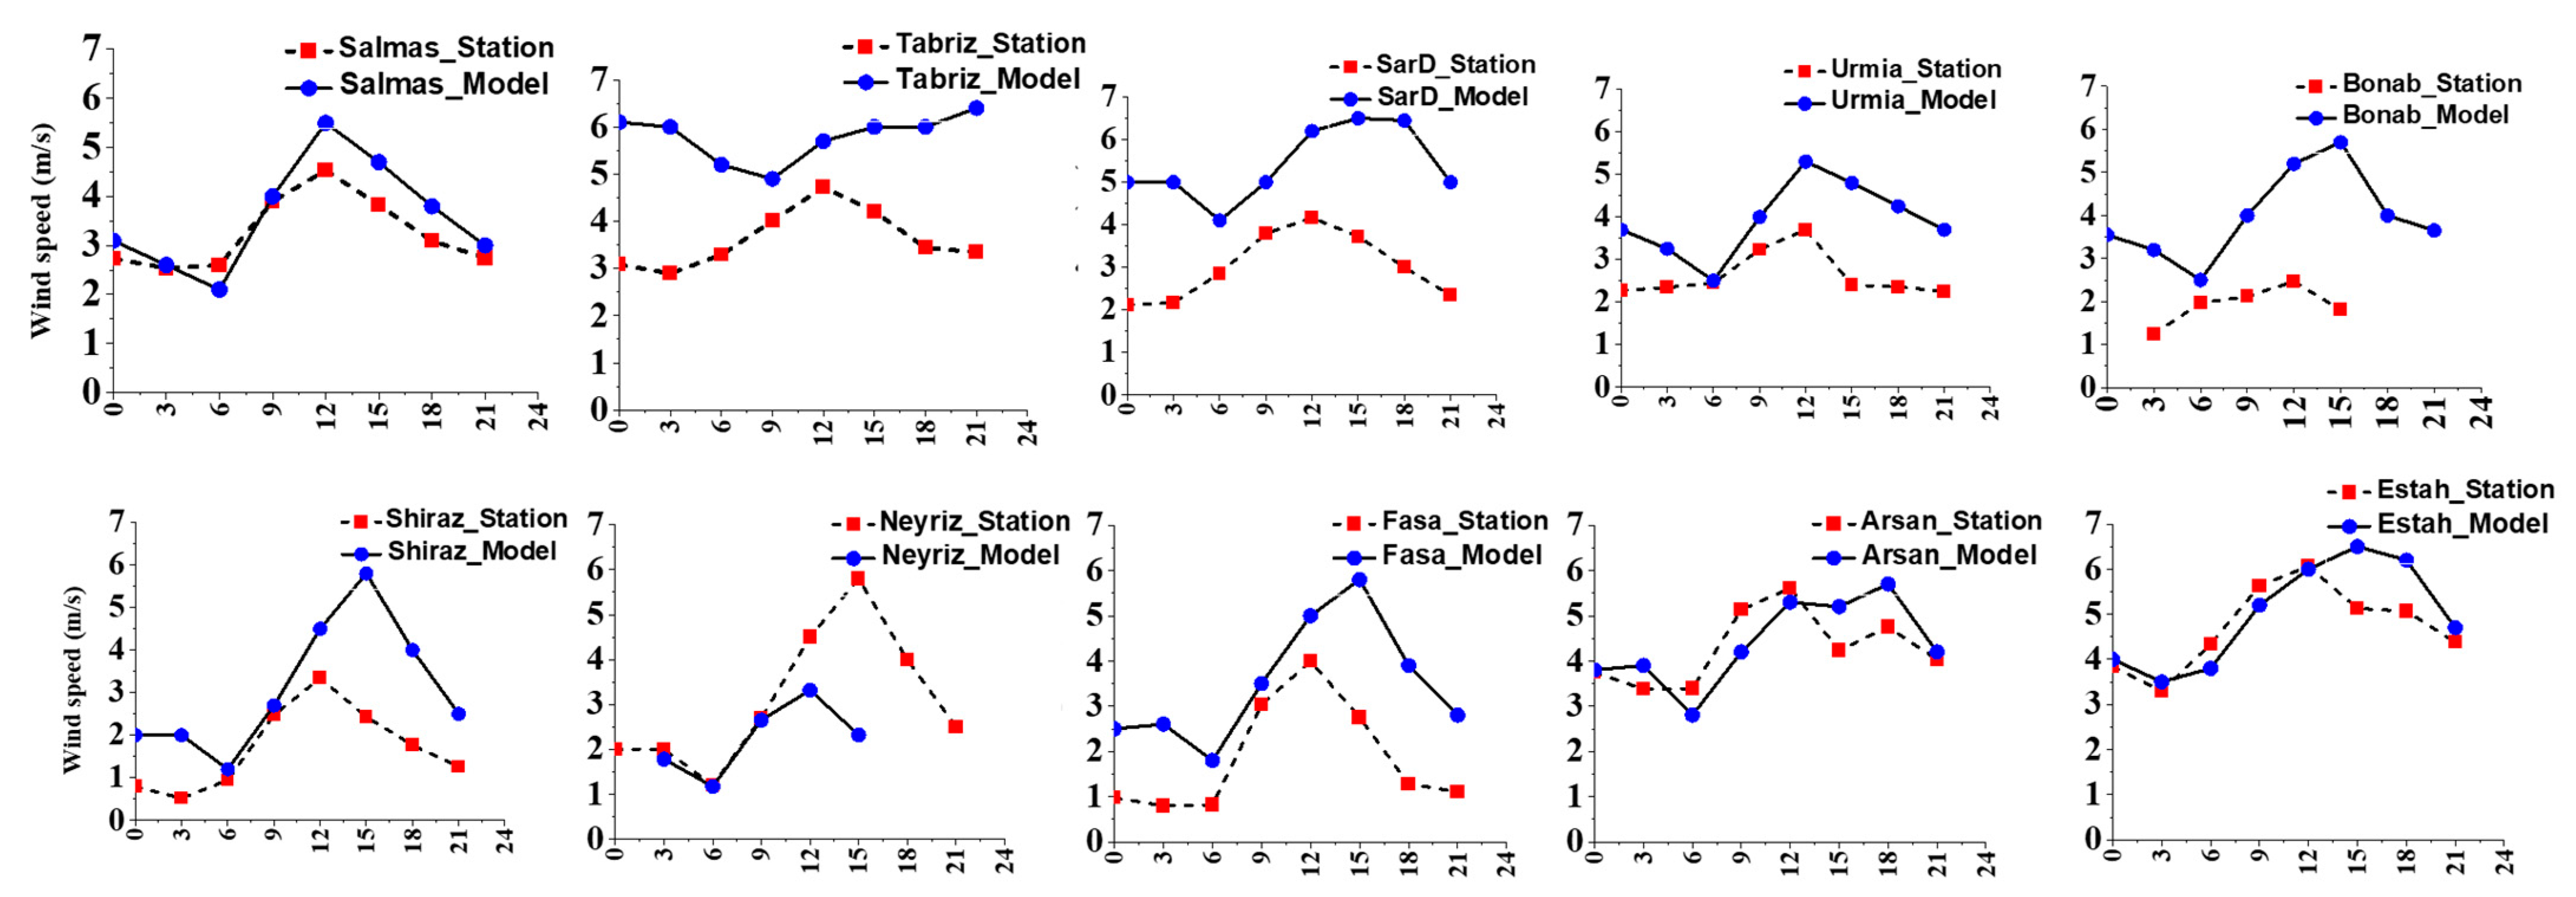
Figure 6 compares the mean diurnal patterns of the measured and WRF-simulated 10 m wind speeds at the ten meteorological stations during 2005–2015. As the measured wind speeds are given at 3 hrs intervals, the WRF outputs were temporally averaged at the same time frames. This comparison clearly reveals that the simulated wind speeds overestimate the measured values in all the examined stations, with highest discrepancies noted in Tabriz, Sardasht, Shiraz, Fasa, and Neyriz, while in Salmas, Estahban, and Arsanjan, the two diurnal patterns display great consistency. Another interesting result is that the model simulations systematically predict lowest winds, close to the measured ones, during the morning hours (~6 UTC) and a distinct diurnal cycle with maximum wind speeds in the afternoon (mostly at 15:00 UTC; 18:30 LST). These, however, are significantly higher than the measured winds, although the latter generally exhibit a similar pattern with enhanced intensities at noon and afternoon hours. However, in Tabriz, the model diurnal fluctuation is totally different from the measured data. Another important difference between the model’s outputs and the station data is the shift in the maximum wind speed from 12 UTC (measured data) to 15 UTC, as observed in most of the modeled results. This may lead to a time shift in predicting dust emissions from local sources, as also observed in Zabol and Sistan during an intense dust storm [38]. Overall, the results show that beyond a rather satisfactory representation of the diurnal wind cycle, the WRF model exhibits notable biases in the accurate simulation of the wind intensity by significantly overestimating it at noon and afternoon hours, during the peak of the wind flow.
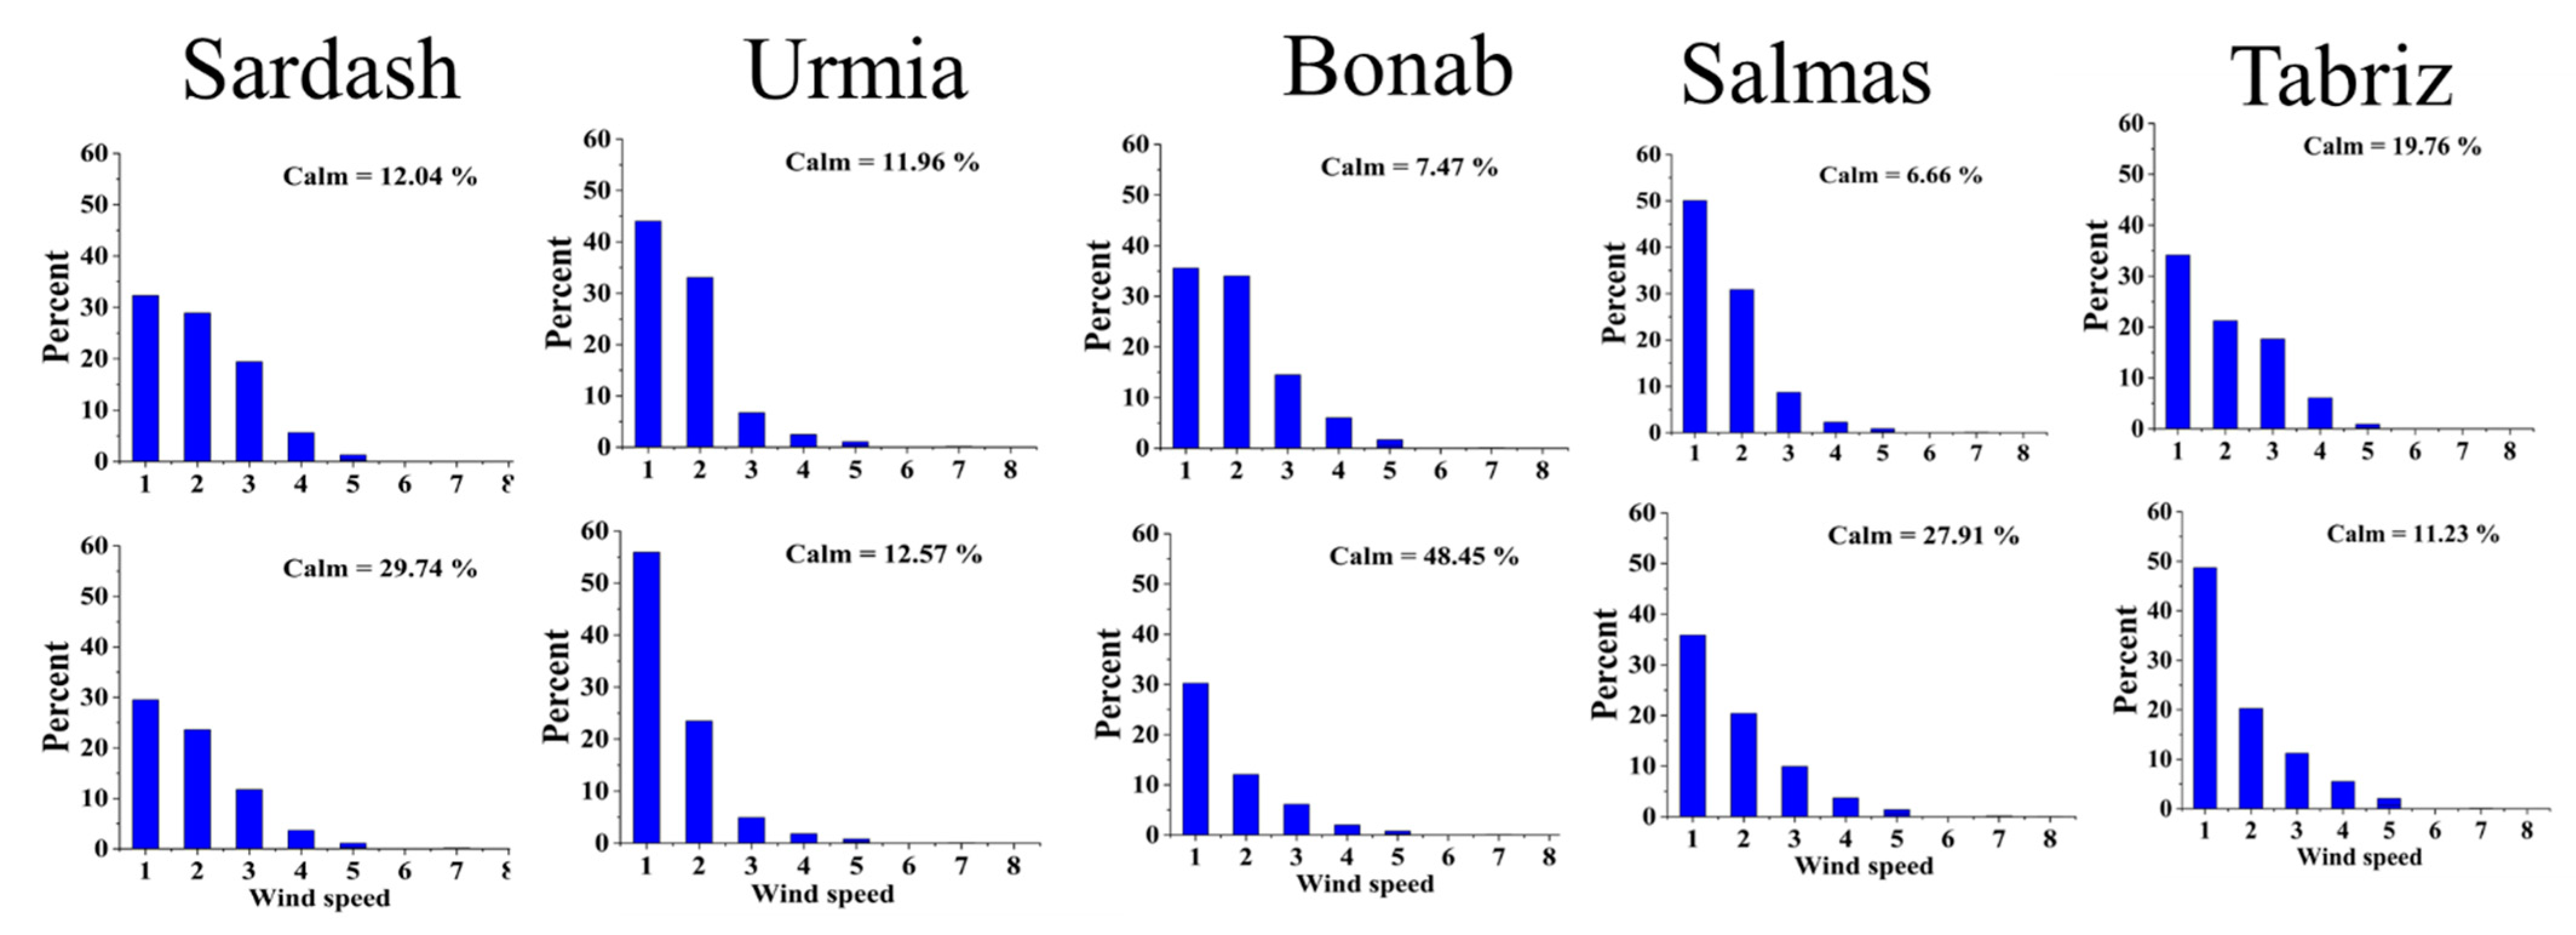
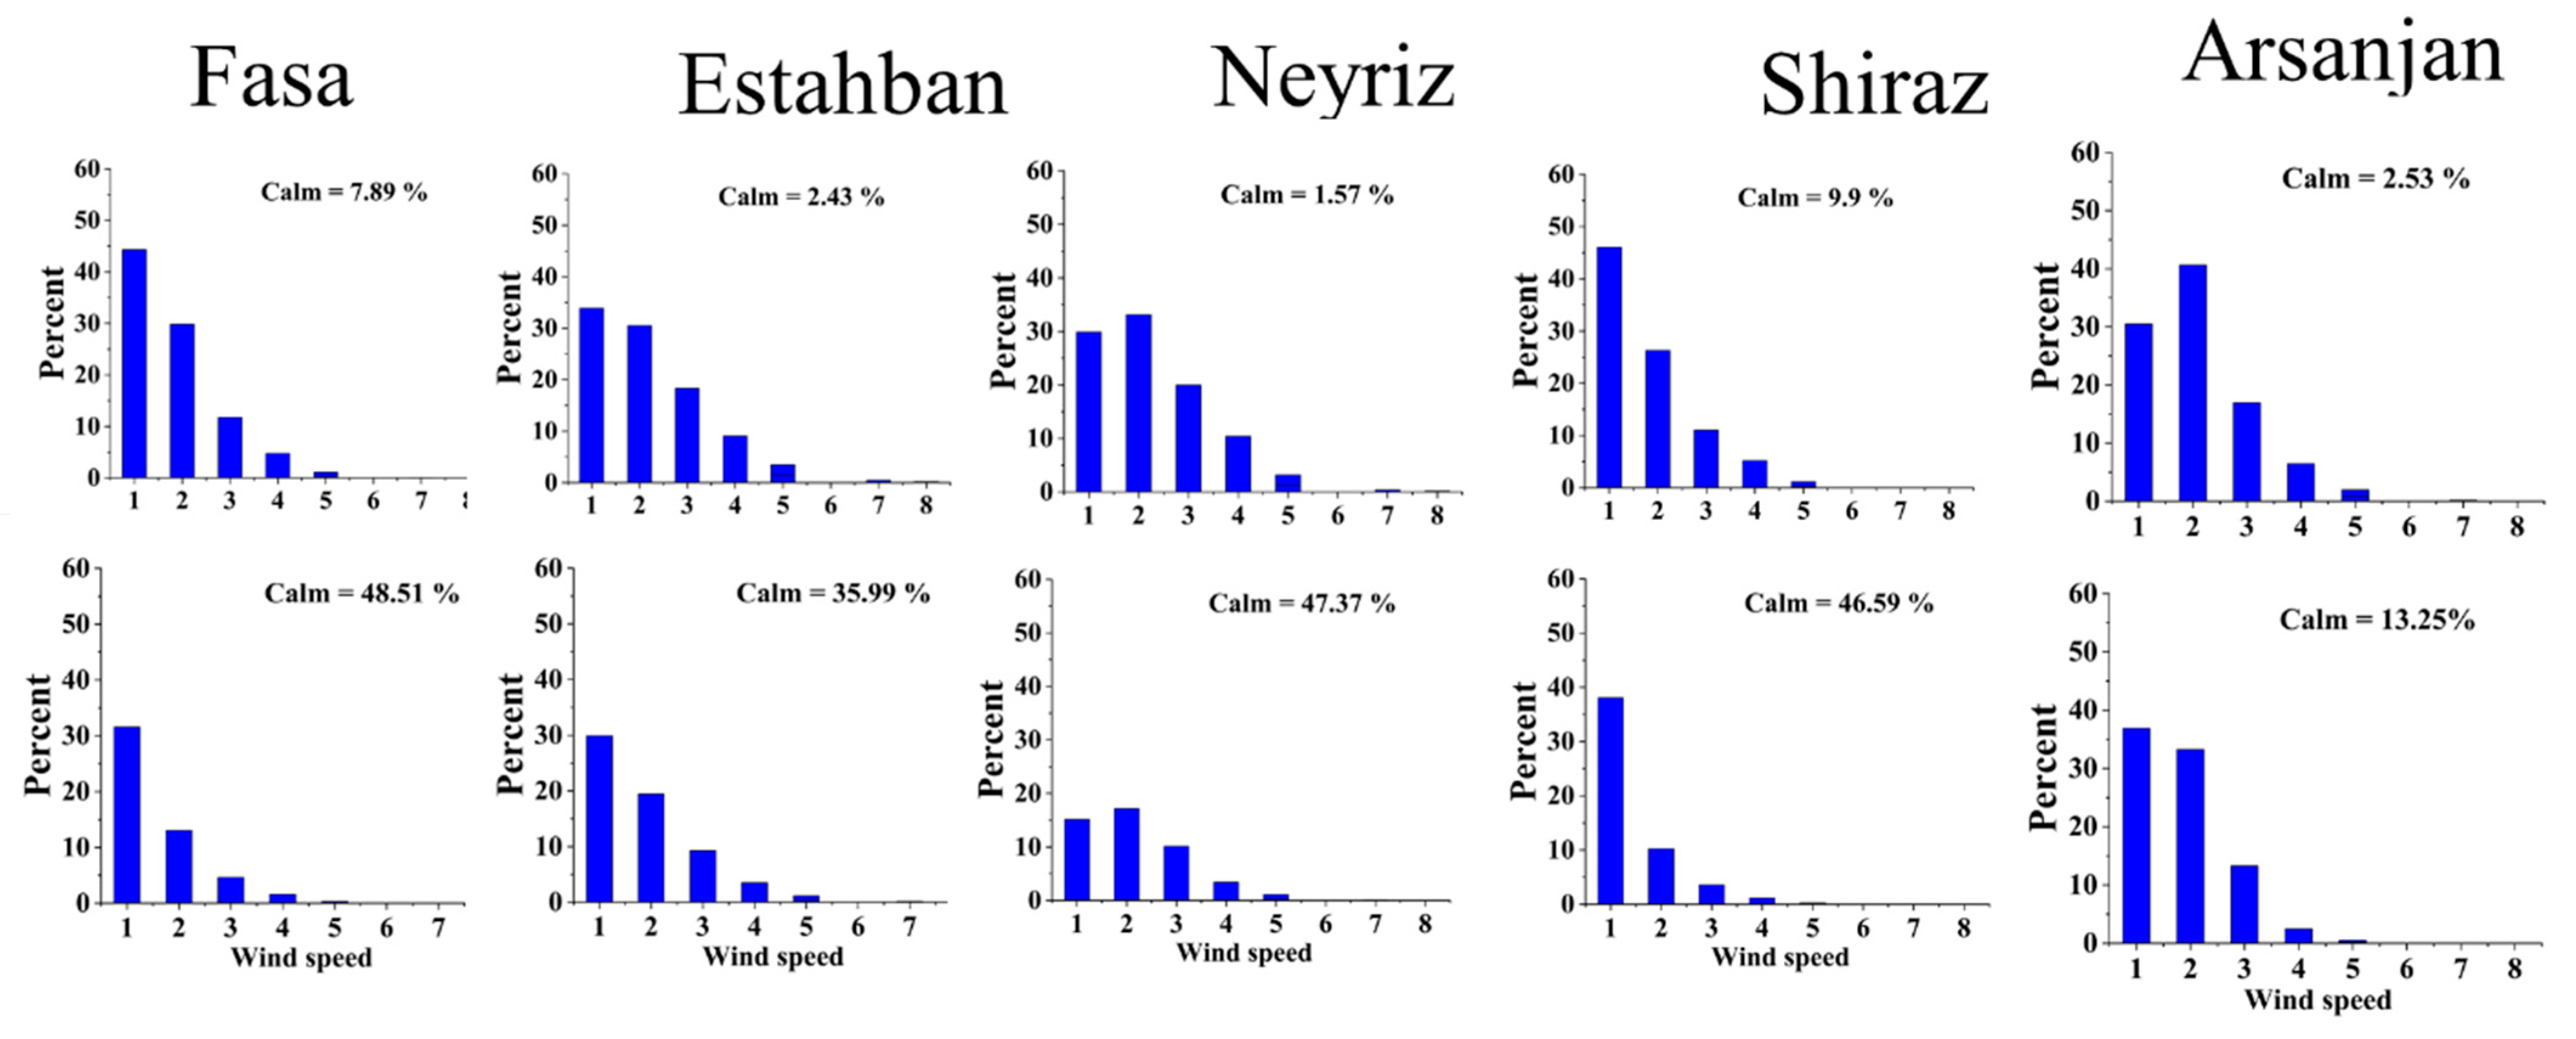
Figure 7 and Figure 8 show the histograms of the probability density functions of the WRF-simulated and measured 10 m wind speeds at the five stations around Urmia and Bakhtegan Lakes, respectively. All the histograms’ probability functions related to WRF model are asymmetric, uni- or multi-modal Gaussian distributions stretched to the right. Most stations around both lakes reported a high percentage of calm periods (zero wind speeds), as well as a significant discrepancy between the WRF simulations and the station data regarding the calm winds. In all the stations, the measured data exhibited higher percentages of calm periods compared to model simulations, except in Tabriz, where the WRF-simulated calm periods accounted for 19.8%, while those of the reported data accounted for 11.2%.
The most frequent wind speed for the stations around Urmia Lake, according to WRF simulations and the station data, was 1 m/s, with 32.3% (model) and 29.6% (measured) frequencies at Sardasht, 44.0% (model) and 55.9% (measured) at Urmia, and 35.6% (model) and 30.2% (measured) at Bonab, while similar results were observed for the other stations (Figure 7). In addition, the WRF model displays a larger probability for higher simulated wind speeds at Sardasht and Tabriz stations. On the contrary, the measured data show larger frequencies of calm winds at specific stations such as Sardasht (29.7%), Bonab (48.2%), and Salmas (27.9%).
For Bakhtegan Lake’s stations (Figure 8), the most frequently simulated wind speeds were 1 m/s at four stations (Fasa, Estahban, Shiraz, and Arsanjan) and 2 m/s at Neyriz station (33.2% model and 17.2% measured). On the other hand, the station data show that the most frequent occurrence was observed for calm winds at four stations (Fasa: 48.5%, Neyriz: 52.9%, Shiraz: 48.4%, and Estahban: 38.3%). Overall, WRF simulations exhibit a notable shift to higher wind speeds compared to the measurements, which may result in increased simulations of dust emissions from local/regional dust sources and an overestimation in the predicted dust loading.
The large differences in the simulations of dust emissions and spatial distribution of dust among various models are attributed to different dust emission schemes, topographic and soil characteristics, threshold friction velocities, dust size distribution, and wind and synoptic weather patterns that are used in each model [48,60,111]. Since giant dust particles (r > 10 μm) are neglected in most models, the dust loading, large-particle deposition, and dust AOD are significantly underestimated near the source regions [34,112,113].
Table 4 summarizes the descriptive statistics (highest frequency, average, maximum, standard deviation, asymmetry, and kurtosis) of the modeled distribution functions for the wind speeds at the stations around Urmia and Bakhtegan Lakes. Urmia, Salmas, and Shiraz stations exhibited the highest asymmetry from the normal distribution, while the high kurtosis values for these stations indicate a long tail towards high wind speeds (Figure 7 and Figure 8). On the other hand, Tabriz exhibits the most symmetric distribution function for the wind speed.
For evaluation of the WRF model against measured wind data, statistical indicators were used, such as the Pearson correlation coefficient (R), the root-mean-square error (RMSE), the mean bias error (MBE), and the Nash–Sutcliffe Efficiency (NSE):
R = i = 1 N x i o b s x i o b s ¯ x i m o d x i m o d ¯ i = 1 N   x i o b s x i o b s ¯ 2 i = 1 N   x i m o d x i m o d ¯ 2
R M S E = i = 1 N   ( I m o d I o b s ) 2 N t
M B E = i = 1 N ( I m o d   I o b s   ) N t
N S E = 1 i = 1 N   ( I m o d I o b s ) 2 i = 1 N   ( I o b s I o b s ¯ ) 2
where Iobs and Imod are the observed and modeled wind data, respectively.
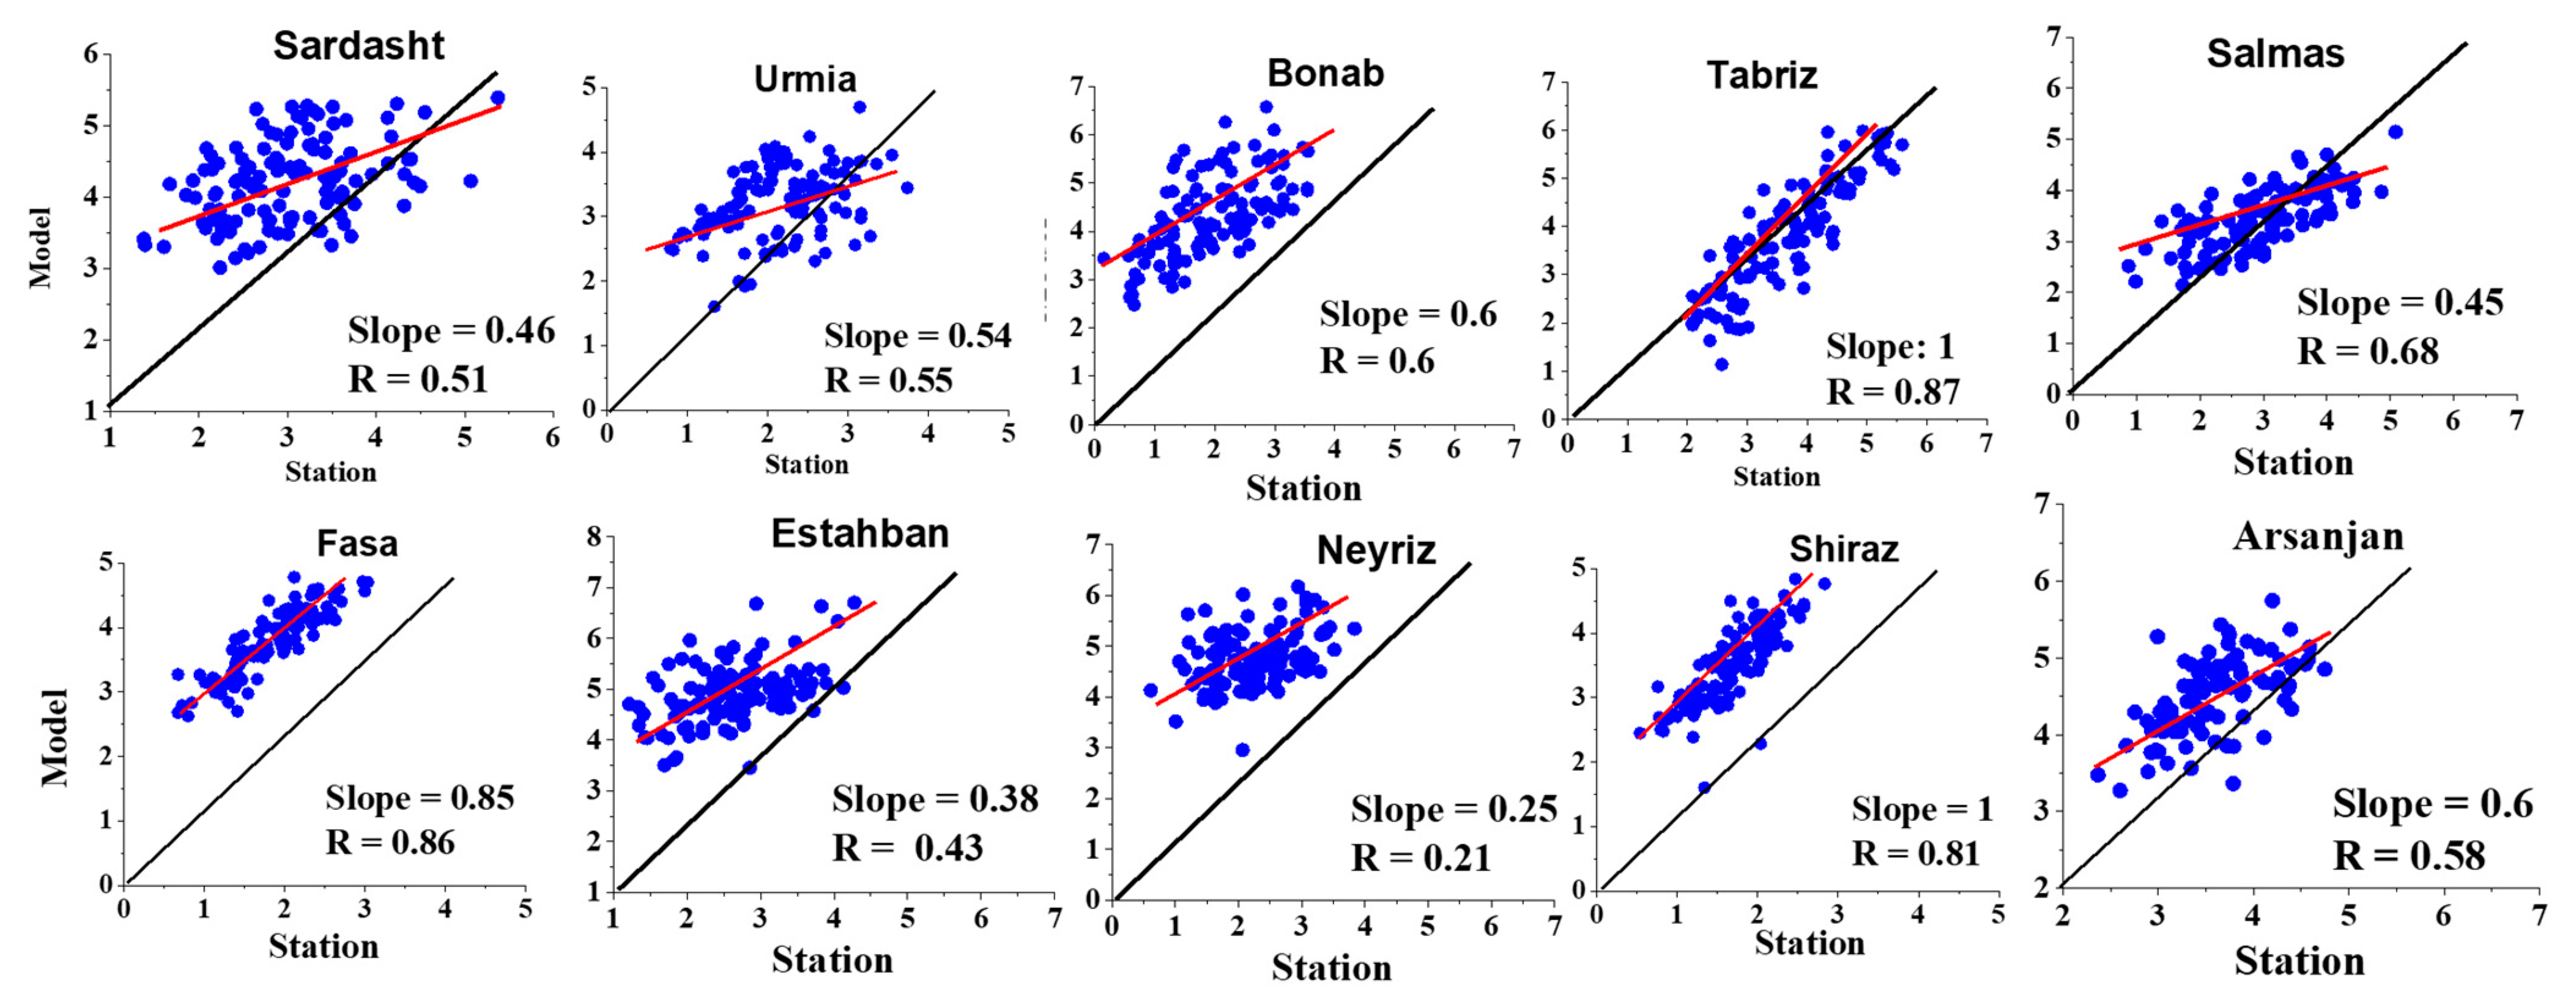
Figure 9 shows the correlation diagrams between monthly mean WRF-simulated and measured wind speeds at the examined weather stations. The analysis shows that the model outputs highly overestimated the 10 m wind data in all the examined stations, but the overestimations are generally higher at the stations around Bakhtegan Lake. High model overestimation was also observed in Bonab station to the SE of Urmia Lake, while better simulations, mostly lying close to the 1–1 line, were observed for Salmas and Tabriz stations, which also exhibited the highest R2 values (R2 = 0.87). Overall, the graph reveals a remarkable inconsistency between measured and model simulated winds. These simulation errors may be influenced by various factors, including physical parameterizations, complex topography, initial and boundary conditions, and generalization [48,55,57,111].
Table 5 summarizes the statistical indicators (MBE, RMSE, NSE) obtained from the comparison between WRF model and measured wind data at synoptic stations around Urmia and Bakhtegan Lakes. The positive MBE values indicate the model’s overestimation at all stations, while the lowest RMSE and NSE values, suggesting better model performance, are observed in Tabriz, Salmas, and Urmia stations. On the contrary, WRF simulations depart far from the measured wind data in Fasa and Shiraz.
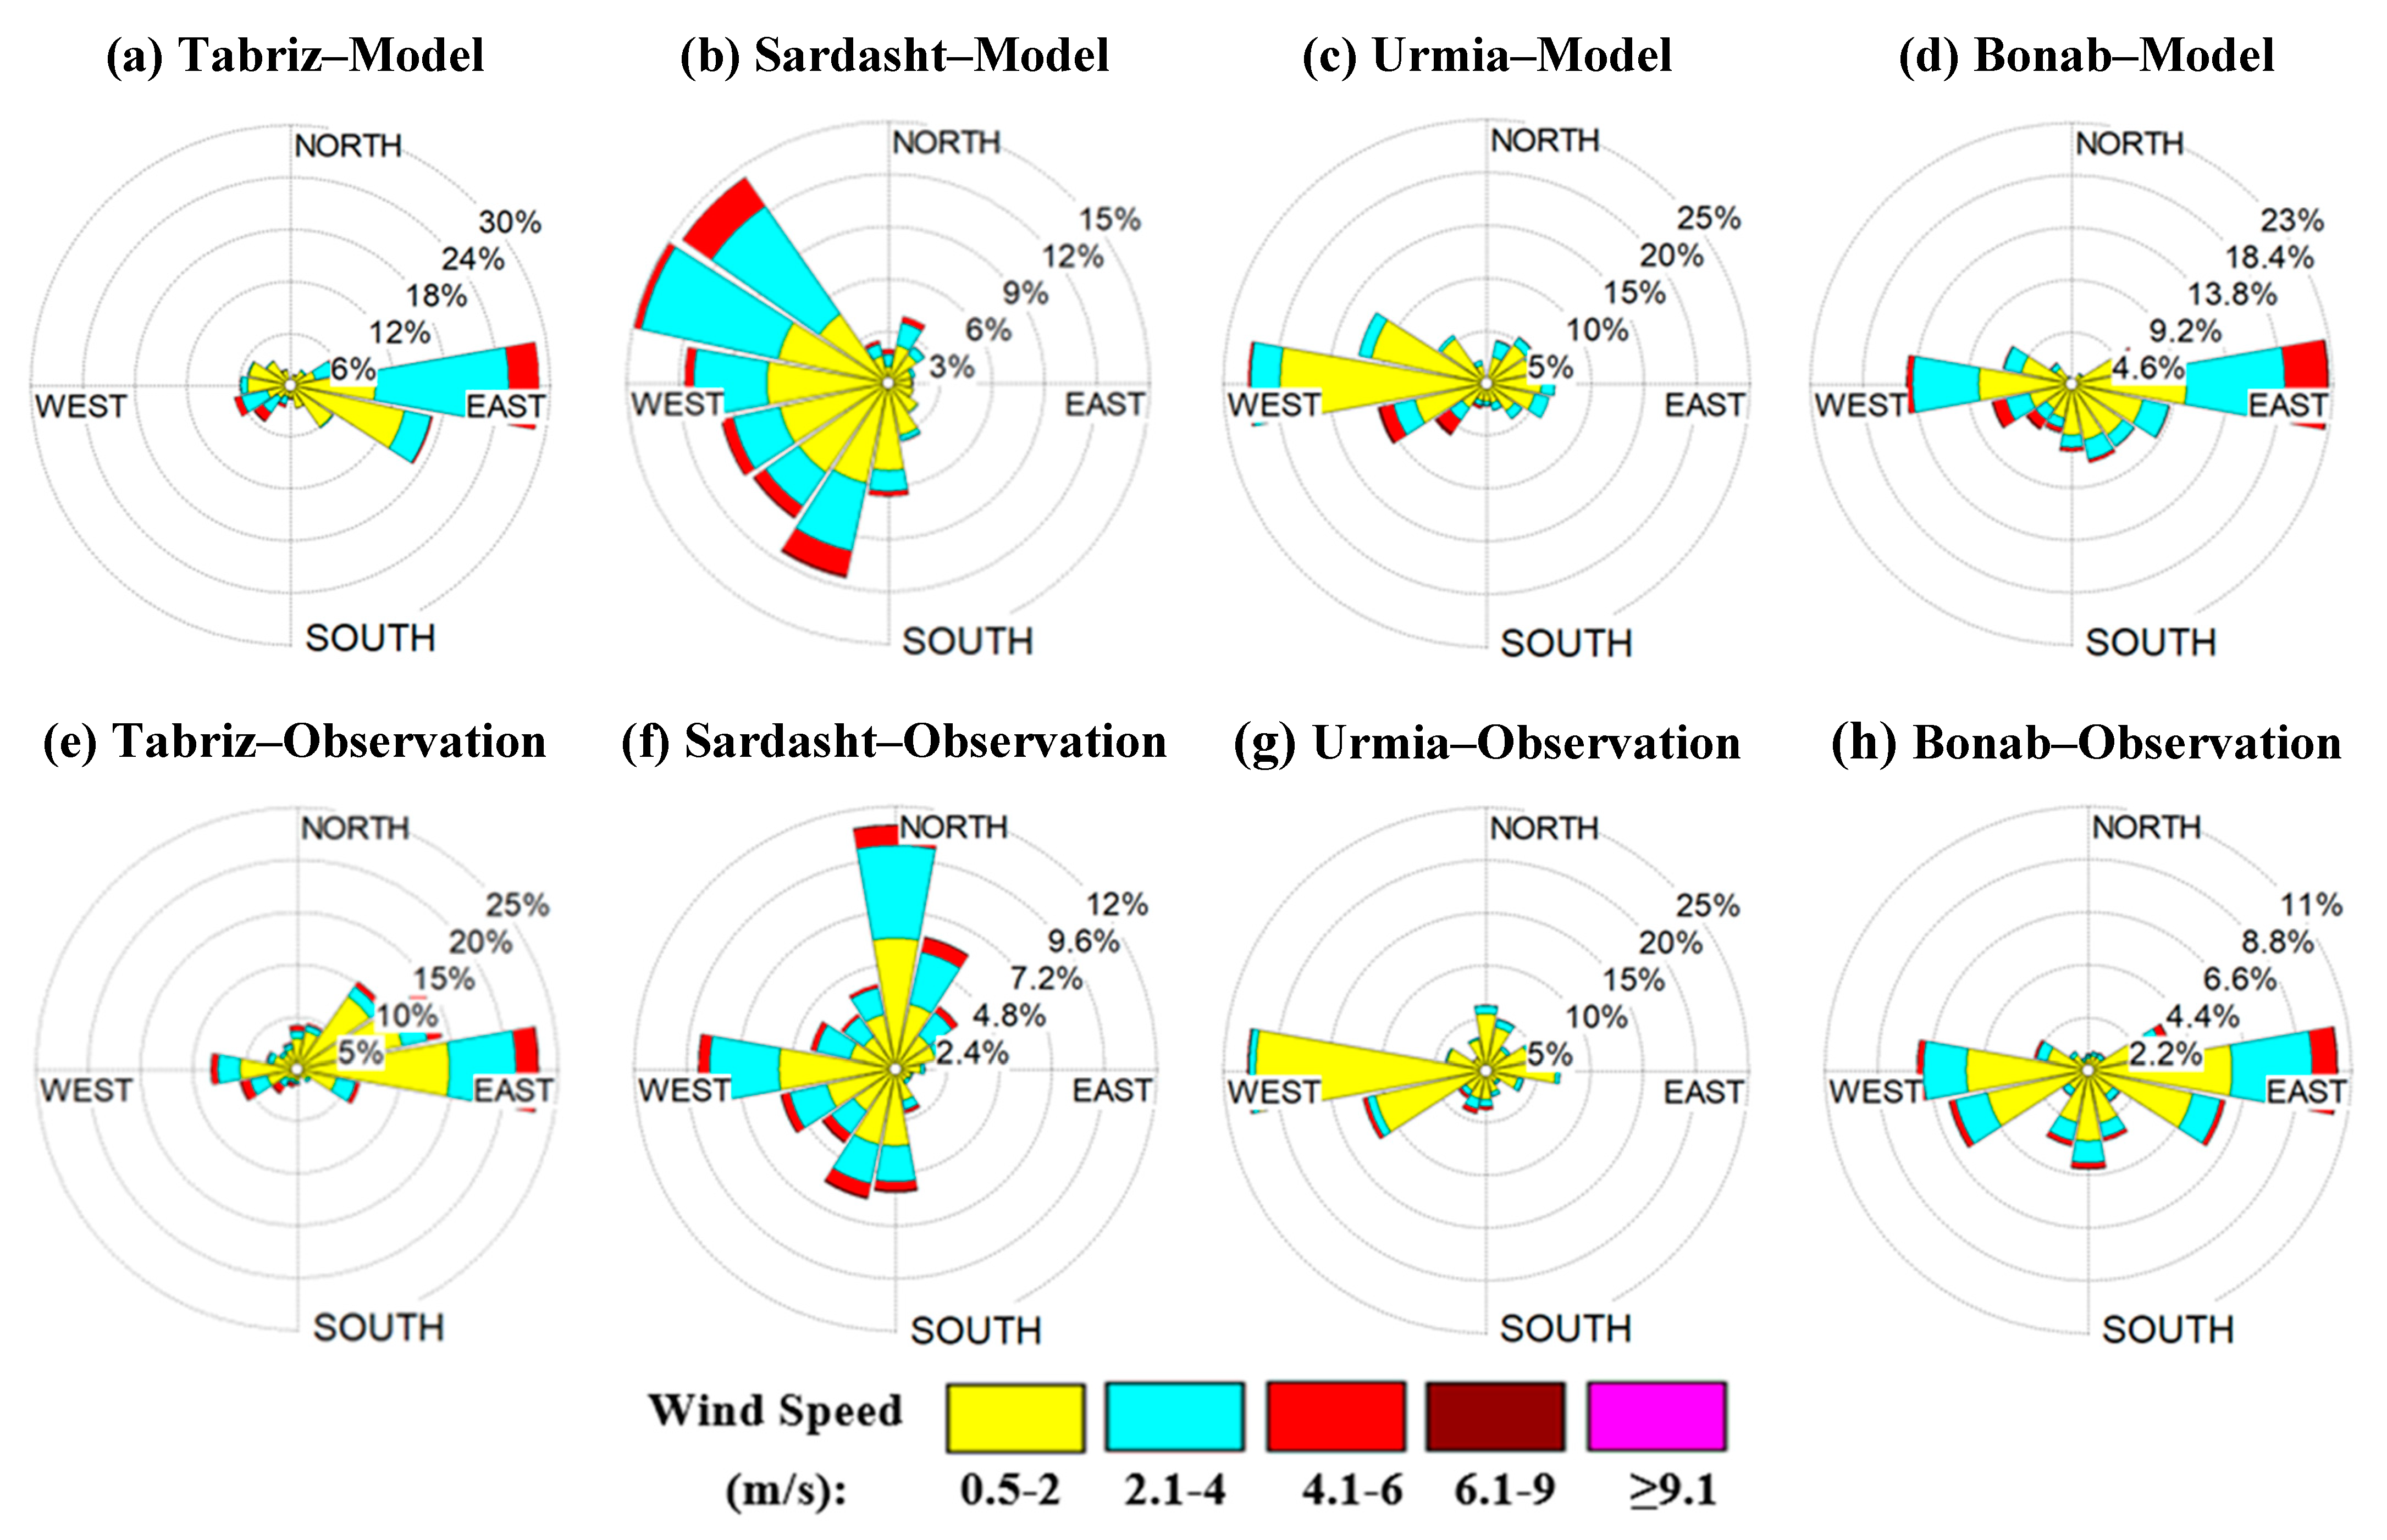
Although the wind speed is a regulatory factor for dust emissions in the arid and semi-arid areas [114,115,116], and its simulation performance is of high importance for dust–climate model predictions [97,108,117], the accurate representation of the wind direction is also necessary for forecasting the dust plume transport, as well as for the determination of the downwind affected areas [118,119]. In this respect, Figure 10 shows the wind rose outputs from WRF model simulations and the respective measured wind data reported at four stations around Urmia Lake in 2005–2015. In Tabriz station, the WRF model simulated a dominant easterly wind direction (Figure 10a), which is consistent with the station data (Figure 10e). In Sardasht, the WRF model simulated western to northwestern winds (mostly), which presented stonger intensities compared to the other directions, while strong southwesterlies were also simulated (Figure 10b). The easterlies were very rare, including in the station data, while strong northerlies were recorded, which however, were not well-represented by WRF. Therefore, in Shardasht station, WRF fails to reproduce the northerlies, while it simulates increased northwesterlies, thus overestimating the measured data (Figure 10f). This city is located SW of Urmia Lake, so the dominant wind roses suggest that the station is rarely affected by dust storms originating from the Urmia dried beds, but is mostly affected by dust sources in Iraq, Syria, and the Mesopotamian Plain. In Urmia station, both wind roses show dominant wind directions from the west and southwest, while the winds are rare from the other sectors and of low intensity. In general terms, WRF represents rather satisfactorily the wind roses in Urmia, while the dominant WSW flow transports dust from the Iraqi plains over the station. In Bonab station, the two wind roses show dominant easterly and westerly winds, with higher intensity from the eastern directions, while moderate-to-weak and rather rare southerlies were satisfactorily represented by the model. Overall, despite the large overestimation of the afternoon wind speeds from the WRF simulations, the model represents fairly well the wind directions, which are of high importance for the pathways of the locally generated and long-range transported dust plumes over Urmia Basin.
The intensity of the near-surface wind plays an important role in dust emissions from sources susceptible to Aeolian erosion terrains, when the wind velocity exceeds a threshold value, which is highly variable and region-specific, depending on surface characteristics [53,55]. Therefore, the quantitative and accurate representation of the wind regime over dust-source areas and dried lake beds would improve the model’s performance in simulations of dust emissions, dust surface concentrations, dust loading, and deposition rates, especially in areas close to the source. These numerical simulations are especially important for atmospheric dynamics, public health, ecosystems, photovoltaic production, and climate change in the Middle East region [24,120,121,122].
Dryness of the ephemeral lakes due to climate change and human interference in the Middle East is an important environmental hazard with negative impacts on atmospheric environment, air quality, ecosystems, biodiversity, and human health [123,124]. Numerical modeling is especially important for systematic monitoring of all these phenomena and for more accurate climatic projections. Although dust numerical modeling has been significantly improved during the last decade, large differences between the model outputs still exist, while biases in the representation of atmospheric and meteorological dynamics, along with errors in parameterization of surface and soil characteristics and lack of surface data, are the main sources of uncertainty [62,98,122]. Expansion of monitoring networks is necessary in this region, due to scarce ground data, which will help in better assessment of the dust–climate implications, validation of satellite observations, and numerical simulations. Furthermore, the following suggestions are proposed for the improvement in numerical simulations of the wind regime and dust emissions: (i) updating ground-level land use and topography data with high resolution using field measurements; (ii) adding local meteorological data such as temperature, wind, and relative humidity in the pre-processing stage of the boundary and initial conditions in the model computations; (iii) using an ensemble system with different combinations of boundary layer schemes and physical models instead of using a single configuration; (iv) increasing the spatial resolution of the model and the number of near-surface layers for both the ground and boundary layers; and, finally, (v) using higher-resolution data for initial and boundary conditions [58,111]. All these suggestions are in the direction of improving the model simulations over narrow and topographic-low basins that are significant sources of dust in the arid lands.

5. Conclusions

This study analyzed the long-term (2000–2020) variation in dust days around the two largest lakes in Iran, which have been significantly desiccated during recent decades, being transformed to local dust sources. The dust events were identified from the dust-related codes (06, 07, and 30 to 35) at ten meteorological stations around Urmia Lake and near Bakhtegan Lake. The analysis showed that the annual mean number of dust days was maximized in Tabriz (30 days) for the stations around Urmia Lake, while around Bakhtegan Lake, Shiraz and Fasa stations presented the highest frequency of dust days (61–63 days). In both lake basins, the long-term variation in the dust days exhibited an increased frequency during the 2008–2012 period, which was associated with an increase in AOD values and attributed to the drought shift and increased dust activity in the Iraqi plains and in a large part of the Middle East.
Eleven years of WRF simulations of the 10 m wind speed at the examined meteorological stations showed the highest simulated wind speeds in the 12–15 UTC time interval (afternoon hours in local time; +3:30). The WRF simulations revealed a systematic overestimation of the noon-to-early afternoon wind speed in all stations, compared to the measured data, while the minimum wind speeds were detected in the morning hours. Furthermore, the frequency distribution functions of the WRF-simulated wind speeds are shifted towards higher values compared to the station data. Correlation analysis of the monthly mean wind speeds justified the significant WRF overestimation, while better simulations were observed in Tabriz and Salmas stations in Urmia Basin (R2 = 0.68–0.87), which exhibited lowest RMSE and NSE values. Apart from the significant overestimation in the wind speeds, the WRF model represented fairly well the wind direction, despite some discrepancies, as shown via comparison of the wind roses at four stations in Urmia Basin. As the wind speed is a major contributing factor for the correct simulations of dust emissions and transport from the arid and semi-arid lands, systematic errors in the simulations of the wind regime may contribute to high biases in numerical dust predictions. Another error maybe related to the WRF model run with a resolution of 5 km, and the station may also not be located in the exact grid point of the model. The development of a dense ground network for monitoring of dust emissions in specific hot-spot areas and for further modeling efforts to reduce the uncertainties of dust–climate interactions will be advances for future studies.

Author Contributions

Conceptualization, N.H.H., A.R.S.A. and D.G.K.; methodology, N.H.H. and K.A.S.; software, N.H.H., E.M. and K.A.S.; validation, N.H.H., K.A.S. and R.-E.P.S. and A.R.S.A.; formal analysis, N.H.H., K.A.S., E.M., A.R.S.A. and K.A.S.; resources, N.H.H., E.M. and K.A.S.; data curation, N.H.H. and A.R.S.A.; writing—original draft preparation, K.A.S. and D.G.K.; writing—review and editing, A.R.S.A., D.G.K., K.A.S., E.T. and R.-E.P.S.; visualization, N.H.H., E.M., A.R.S.A. and K.A.S.; supervision, A.R.S.A. and D.G.K. All authors have read and agreed to the published version of the manuscript.

Funding

The analysis of Terra-MODIS AOD is funded by the Russian Foundation for Basic Research and the Iran National Science Foundation, grant number 20-55-56028.

Institutional Review Board Statement

Not applicable.

Informed Consent Statement

Not applicable.

Data Availability Statement

Datasets supporting reported results are: MODIS via Giovanni (https://giovanni.sci.gsfc.nasa.gov/giovanni/, accessed on 20 April 2023).

Acknowledgments

We are thankful for MODIS retrievals used in this study via Giovanni visualization tool (https://giovanni.sci.gsfc.nasa.gov/giovanni/, accessed on 5 December 2023). The authors are greatly thankful to the Iranian meteorological organization (IRIMO) and atmospheric science and meteorology research center (ASMERC) for WRF model running.

Conflicts of Interest

Nasim Hossein Hamzeh are employee of Air and Climate Technology Company (ACTC). The paper reflects the views of the scientists and not the company. The authors declare no conflict of interest.

References

  1. Querol, X.; Tobías, A.; Pérez, N.; Karanasiou, A.; Amato, F.; Stafoggia, M.; García-Pando, C.P.; Ginoux, P.; Forastiere, F.; Gumy, S.; et al. Monitoring the impact of desert dust outbreaks for air quality for health studies. Environ. Int. 2019, 130, 104867. [Google Scholar] [CrossRef] [PubMed]
  2. Shahsavani, A.; Naddafi, K.; Haghighifard, N.J.; Mesdaghinia, A.; Yunesian, M.; Nabizadeh, R.; Arhami, M.; Yarahmadi, M.; Sowlat, M.H.; Ghani, M.; et al. Characterization of ionic composition of TSP and PM10 during the Middle Eastern Dust (MED) storms in Ahvaz, Iran. Environ. Monit. Assess. 2011, 184, 6683–6692. [Google Scholar] [CrossRef] [PubMed]
  3. Behrooz, R.D.; Mohammadpour, K.; Broomandi, P.; Kosmopoulos, P.G.; Gholami, H.; Kaskaoutis, D.G. Long-term (2012–2020) PM10 concentrations and increasing trends in the Sistan Basin: The role of Levar wind and synoptic meteorology. Atmos. Pollut. Res. 2022, 13, 101460. [Google Scholar] [CrossRef]
  4. Miller, R.L.; Knippertz, P.; Pérez García-Pando, C.; Perlwitz, J.P.; Tegen, I. Impact of dust radiative forcing upon climate. In Mineral Dust; Springer: Dordrecht, The Netherlands, 2014; pp. 327–357. [Google Scholar]
  5. Miller, R.L.; Tegen, I.; Perlwitz, J. Surface radiative forcing by soil dust aerosols and the hydrologic cycle. J. Geophys. Res. Atmos. 2004, 109, 4203. [Google Scholar] [CrossRef]
  6. Liao, H.; Seinfeld, J.H. Radiative forcing by mineral dust aerosols: Sensitivity to key variables. J. Geophys. Res. Atmos. 1998, 103, 31637–31645. [Google Scholar] [CrossRef]
  7. Jish Prakash, P.; Stenchikov, G.; Kalenderski, S.; Osipov, S.; Bangalath, H. The impact of dust storms on the Arabian Peninsula and the Red Sea. Atmos. Chem. Phys. 2015, 15, 199–222. [Google Scholar] [CrossRef]
  8. Karydis, V.A.; Kumar, P.; Barahona, D.; Sokolik, I.N.; Nenes, A. On the effect of dust particles on global cloud condensation nuclei and cloud droplet number. J. Geophys. Res. Atmos. 2011, 116, 1–16. [Google Scholar] [CrossRef]
  9. Spyrou, C.; Mitsakou, C.; Kallos, G.; Louka, P.; Vlastou, G. An improved limited area model for describing the dust cycle in the atmosphere. J. Geophys. Res. Atmos. 2010, 115, 1–19. [Google Scholar] [CrossRef]
  10. Mahowald, N.; Ward, D.S.; Kloster, S.; Flanner, M.G.; Heald, C.L.; Heavens, N.G.; Hess, P.G.; Lamarque, J.-F.; Chuang, P.Y. Aerosol impacts on climate and biogeochemistry. Annu. Rev. Environ. Resour. 2011, 36, 45–74. [Google Scholar] [CrossRef]
  11. Prospero, J.M. Long-range transport of mineral dust in the global atmosphere: Impact of African dust on the environment of the southeastern United States. Proc. Natl. Acad. Sci. USA 1999, 96, 3396–3403. [Google Scholar] [CrossRef]
  12. Tentyukov, M.P.; Shukurov, K.A.; Belan, B.D.; Simonenkov, D.V.; Yazikov, E.G.; Mikhailov, V.I.; Buchelnikov, V.S. Coupled Analysis of Granulometric Composition of Aerosol Substance in Surface Air and Snow Cover: Effect of Air Masses on Aerosol Particle Distribution. Atmos. Ocean. Opt. 2021, 34, 586–595. [Google Scholar] [CrossRef]
  13. Kutuzov, S.; Mikhalenko, V.; Toropov, P.; Legrand, M.; Preunkert, S.; Ginot, P.; Shukurov, K.; Poliukhov, A. The Elbrus (Caucasus, Russia) ice core record—Part 2: History of desert dust deposition. Atmos. Chem. Phys. 2019, 19, 14133–14148. [Google Scholar] [CrossRef]
  14. Pewe, T.L. Desert dust: An overview. In Desert Dust: Origin, Characteristics, and Effect on Man; Geological Society of America: Boulder, CO, USA, 1981; Volume 186, pp. 1–10. [Google Scholar]
  15. Morman, S.A.; Plumlee, G.S. Dust and human health. In Mineral Dust; Springer: Dordrecht, The Netherlands, 2014; pp. 385–409. [Google Scholar]
  16. Kosmopoulos, P.G.; Kazadzis, S.; El-Askary, H.; Taylor, M.; Gkikas, A.; Proestakis, E.; Kontoes, C.; El-Khayat, M.M. Earth-Observation-Based Estimation and Forecasting of Particulate Matter Impact on Solar Energy in Egypt. Remote Sens. 2018, 10, 1870. [Google Scholar] [CrossRef]
  17. Goudie, A.S. Desert dust and human health disorders. Environ. Int. 2014, 63, 101–113. [Google Scholar] [CrossRef] [PubMed]
  18. Kok, J.F.; Adebiyi, A.A.; Albani, S.; Balkanski, Y.; Checa-Garcia, R.; Chin, M.; Colarco, P.R.; Hamilton, D.S.; Huang, Y.; Ito, A.; et al. Contribution of the world’s main dust source regions to the global cycle of desert dust. Atmos. Chem. Phys. 2021, 21, 8169–8193. [Google Scholar] [CrossRef]
  19. Darvishi Boloorani, A.; Papi, R.; Soleimani, M.; Karami, L.; Amiri, F.; Samany, N.N. Water bodies changes in Tigris and Euphrates basin has impacted dust storms phenomena. Aeolian Res. 2021, 50, 100698. [Google Scholar] [CrossRef]
  20. Banks, J.R.; Heinold, B.; Schepanski, K. Impacts of the Desiccation of the Aral Sea on the Central Asian Dust Life-Cycle. J. Geophys. Res. 2022, 127, e2022JD036618. [Google Scholar] [CrossRef]
  21. Ge, Y.; Wu, N.; Abuduwaili, J.; Kulmatov, R.; Issanova, G.; Saparov, G. Identifying Seasonal and Diurnal Variations and the Most Frequently Impacted Zone of Aerosols in the Aral Sea Region. Int. J. Environ. Res. Public Health 2022, 19, 14144. [Google Scholar] [CrossRef]
  22. Tegen, I.; Harrison, S.P.; Kohfeld, K.; Prentice, I.C.; Coe, M.; Heimann, M. Impact of vegetation and preferential source areas on global dust aerosol: Results from a model study. J. Geophys. Res. Atmos. 2002, 107, AAC 14-1–AAC 14-27. [Google Scholar] [CrossRef]
  23. Rashki, A.; Arjmand, M.; Kaskaoutis, D.G. Assessment of dust activity and dust-plume pathways over Jazmurian Basin, southeast Iran. Aeolian Res. 2017, 24, 145–160. [Google Scholar] [CrossRef]
  24. Akasha, H.; Ghaffarpasand, O.; Pope, F.D. Climate Change, Air Pollution and the Associated Burden of Disease in the Arabian Peninsula and Neighbouring Regions: A Critical Review of the Literature. Sustainability 2023, 15, 3766. [Google Scholar] [CrossRef]
  25. Tussupova, K.; Hjorth, P.; Moravej, M. Drying lakes: A review on the applied restoration strategies and health conditions in contiguous Areas. Water 2020, 12, 749. [Google Scholar] [CrossRef]
  26. Golreyhan, F.; Kamran, K.V.; Mokhtari, D.; Rasouli, A.-A. Examining the Effect of Salt Dust Storms of Lake Urmia on Vegetation. J. Hydraul. Struct. 2021, 7, 60–71. [Google Scholar] [CrossRef]
  27. Abuduwaili, J.; Liu, D.; Wu, G. Saline dust storms and their ecological impacts in arid regions. J. Arid Land 2010, 2, 144–150. [Google Scholar] [CrossRef]
  28. Opp, C.; Wagemann, J.; Banedjshafi, S.; Abbasi, H.R. Aral Sea Syndrome and Lake Urmia crisis. A Comparison of causes, effects and strategies for problem solutions. In Geoparks and Geotourism in Iran. Schriften zur Internationalen Entwicklungs- und Umweltforschung; Dittmann, A., Ed.; Zentrum für Internationale Entwicklungs- und Umweltforschung, Universität Gießen: Gießen, Germany, 2017; Volume 34, pp. 169–183. [Google Scholar]
  29. Shao, Y.; Wyrwoll, K.H.; Chappell, A.; Huang, J.; Lin, Z.; McTainsh, G.H.; Mikami, M.; Tanaka, T.Y.; Wang, X.; Yoon, S. Dust cycle: An emerging core theme in Earth system science. Aeolian Res. 2011, 2, 181–204. [Google Scholar] [CrossRef]
  30. Tanaka, T.Y.; Chiba, M. A numerical study of the contributions of dust source regions to the global dust budget. Glob. Planet. Chang. 2006, 52, 88–104. [Google Scholar] [CrossRef]
  31. Al-Hemoud, A.; Al-Dashti, H.; Al-Saleh, A.; Petrov, P.; Malek, M.; Elhamoud, E.; Al-Khafaji, S.; Li, J.; Koutrakis, P.; Doronzo, D.; et al. Dust storm ‘hot spots’ and transport pathways affecting the Arabian Peninsula. J. Atmos. Sol.-Terr. Phys. 2022, 238, 105932. [Google Scholar] [CrossRef]
  32. Hamzeh, N.H.; Shukurov, K.; Mohammadpour, K.; Kaskaoutis, D.G.; Abadi, A.R.S.; Shahabi, H. A comprehensive investigation of the causes of drying and increasing saline dust in the Urmia Lake, northwest Iran, via ground and satellite observations, synoptic analysis and machine learning models. Ecol. Inform. 2023, 78, 102355. [Google Scholar] [CrossRef]
  33. Middleton, N.J. Dust storms in the Middle East. J. Arid Environ. 1986, 10, 83–96. [Google Scholar] [CrossRef]
  34. Hamzeh, N.H.; Ranjbar, A.S.; Gee, M.O.; Habibi, M.; Schöner, W. Analyses of a Lake Dust Source in the Middle East through Models Performance. Remote Sens. 2022, 50, 2145. [Google Scholar] [CrossRef]
  35. Micklin, P. The Aral Sea disaster. Annu. Rev. Earth Planet. Sci. 2007, 35, 47–72. [Google Scholar] [CrossRef]
  36. Issanova, G.; Abuduwaili, J.; Galayeva, O.; Semenov, O.; Bazarbayeva, T. Aeolian transportation of sand and dust in the Aral Sea region. Int. J. Environ. Sci. Technol. 2015, 12, 3213–3224. [Google Scholar] [CrossRef]
  37. Opp, C.; Groll, M.; Aslanov, I.; Lotz, T.; Vereshagina, N. Aeolian dust deposition in the Southern Aral Sea region (Uzbekistan)—Ground-based monitoring results from the LUCA project. Quat. Int. 2016, 429, 86–99. [Google Scholar] [CrossRef]
  38. Karami, S.; Hamzeh, N.H.; Kaskaoutis, D.G.; Rashki, A.; Alam, K.; Ranjbar, A. Numerical simulations of dust storms originated from dried lakes in central and southwest Asia: The case of Aral Sea and Sistan Basin. Aeolian Res. 2021, 50, 100679. [Google Scholar] [CrossRef]
  39. Wiggs, G.F.; O’hara, S.L.; Wegerdt, J.; Van Der Meer, J.; Small, I.; Hubbard, R. The dynamics and characteristics of aeolian dust in dryland Central Asia: Possible impacts on human exposure and respiratory health in the Aral Sea basin. Geograph. J. 2003, 169, 142–157. [Google Scholar] [CrossRef]
  40. Micklin, P. The Aral Sea crisis. In Dying and Dead Seas Climatic Versus Anthropic Causes; Springer: Dordrecht, The Netherlands, 2004; pp. 99–123. [Google Scholar]
  41. Tositti, L.; Brattich, E.; Cassardo, C.; Morozzi, P.; Bracci, A.; Marinoni, A.; Di Sabatino, S.; Porcù, F.; Zappi, A. Development and evolution of an anomalous Asian dust event across Europe in March 2020. Atmos. Chem. Phys. 2022, 22, 4047–4073. [Google Scholar] [CrossRef]
  42. Zittis, G.; Almazroui, M.; Alpert, P.; Ciais, P.; Cramer, W.; Dahdal, Y.; Fnais, M.; Francis, D.; Hadjinicolaou, P.; Howari, F.; et al. Climate change and weather extremes in the Eastern Mediterranean and Middle East. Rev. Geophys. 2022, 60, e2021RG000762. [Google Scholar] [CrossRef]
  43. Vahidipour, M.; Raeisi, E.; van der Zee, S.E. Potentially toxic metals in sediments, lake water and groundwater of the Ramsar wetlands Bakhtegan–Tashk, South Iran: Distribution and source assessment. Environ. Technol. Innov. 2022, 28, 102789. [Google Scholar] [CrossRef]
  44. Karimzadeh, S.; Taghizadeh, M.M. Potential of dust emission resources using small wind tunnel and GIS: Case study of Bakhtegan playa, Iran. Appl. Water Sci. 2019, 9, 174. [Google Scholar] [CrossRef]
  45. Sajedipour, S.; Zarei, H.; Oryan, S. Estimation of environmental water requirements via an ecological approach: A case study of Bakhtegan Lake, Iran. Ecol. Eng. 2017, 100, 246–255. [Google Scholar] [CrossRef]
  46. Abadi, A.R.S.; Hamzeh, N.H.; Shukurov, K.; Opp, C.; Dumka, U.C. Long-Term Investigation of Aerosols in the Urmia Lake Region in the Middle East by Ground-Based and Satellite Data in 2000–2021. Remote Sens. 2022, 14, 3827. [Google Scholar] [CrossRef]
  47. Ghale, Y.A.G.; Tayanc, M.; Unal, A. Dried bottom of Urmia Lake as a new source of dust in the northwestern Iran: Understanding the impacts on local and regional air quality. Atmos. Environ. 2021, 262, 118635. [Google Scholar] [CrossRef]
  48. Hamzeh, N.H.; Karami, S.; Kaskaoutis, D.G.; Tegen, I.; Moradi, M.; Opp, C. Atmospheric dynamics and numerical simulations of six frontal dust storms in the Middle East region. Atmosphere 2021, 12, 125. [Google Scholar] [CrossRef]
  49. Gholampour, A.; Nabizadeh, R.; Naseri, S.; Yunesian, M.; Taghipour, H.; Rastkari, N.; Nazmara, S.; Faridi, S.; Mahvi, A.H. Exposure and health impacts of outdoor particulate matter in two urban and industrialized area of Tabriz, Iran. J. Environ. Health Sci. Eng. 2014, 12, 27. [Google Scholar] [CrossRef]
  50. Hamzehpour, N.; Marcolli, C.; Pashai, S.; Klumpp, K.; Peter, T. Measurement report: The Urmia playa as a source of airborne dust and ice-nucleating particles–Part 1: Correlation between soils and airborne samples. Atmos. Chem. Phys. 2022, 22, 14905–14930. [Google Scholar] [CrossRef]
  51. Mohammadi, A.; Hajizadeh, Y.; Taghipour, H.; Mosleh Arani, A.; Mokhtari, M.; Fallahzadeh, H. Assessment of metals in agricultural soil of surrounding areas of Urmia Lake, northwest Iran: A preliminary ecological risk assessment and source identification. Hum. Ecol. Risk Assess. Int. J. 2018, 24, 2070–2087. [Google Scholar] [CrossRef]
  52. Arjmand, M.; Rashki, A.; Sargazi, H. Monitoring of spatial and temporal variability of desert dust over the Hamoun e Jazmurian, Southeast of Iran based on the Satellite Data. Sci. Res. Q. Geograph. Data 2018, 27, 153–168. [Google Scholar]
  53. Parajuli, S.P.; Yang, Z.L.; Kocurek, G. Mapping erodibility in dust source regions based on geomorphology, meteorology, and remote sensing. J. Geophys. Res. Earth Surf. 2014, 119, 1977–1994. [Google Scholar] [CrossRef]
  54. Francis, D.; Alshamsi, N.; Cuesta, J.; Isik, A.G.; Dundar, C. Cyclogenesis and Density Currents in the Middle East and the Associated Dust Activity in September 2015. Geosciences 2019, 9, 376. [Google Scholar] [CrossRef]
  55. Parajuli, S.P.; Stenchikov, G.L.; Ukhov, A.; Kim, H. Dust emission modeling using a new high-resolution dust source function in WRF-Chem with implications for air quality. J. Geophys. Res. Atmos. 2019, 124, 10109–10133. [Google Scholar] [CrossRef]
  56. Gholami, H.; Mohamadifar, A.; Rahimi, S.; Kaskaoutis, D.G.; Collins, A.L. Predicting land susceptibility to atmospheric dust emissions in central Iran by combining integrated data mining and a regional climate model. Atmos. Pollut. Res. 2021, 12, 172–187. [Google Scholar] [CrossRef]
  57. Chen, Y.; Zhang, Y.; Chen, S.; Yang, B.; Yan, H.; Li, J.; Zhang, C.; Lou, G.; Chen, J.; Lian, L.; et al. Impacts of dynamic dust sources coupled with WRF-Chem 3.9.1 on the dust simulation over East Asia. Geosci. Model Dev. Discuss. 2023. in review. [Google Scholar] [CrossRef]
  58. Solomos, S.; Kallos, G.; Mavromatidis, E.; Kushta, J. Density currents as a desert dust mobilization mechanism. Atmos. Chem. Phys. 2012, 12, 11199–11211. [Google Scholar] [CrossRef]
  59. Krasnov, H.; Katra, I.; Friger, M. Increase in dust storm related PM10 concentrations: A time series analysis of 2001–2015. Environ. Pollut. 2016, 213, 36–42. [Google Scholar] [CrossRef]
  60. Todd, M.C.; Bou Karam, D.; Cavazos, C.; Bouet, C.; Heinold, B.; Baldasano, J.M.; Cautenet, G.; Koren, I.; Perez, C.; Solmon, F.; et al. Quantifying uncertainty in estimates of mineral dust flux: An intercomparison of model performance over the Bodélé Depression, northern Chad. J. Geophys. Res. Atmos. 2008, 113, 1–22. [Google Scholar] [CrossRef]
  61. Alizadeh Choobari, O.; Zawar-Reza, P.; Sturman, A. Low level jet intensification by mineral dust aerosols. Ann. Geophys. 2013, 31, 625–632. [Google Scholar] [CrossRef]
  62. Anisimov, A.; Axisa, D.; Kucera, P.A.; Mostamandi, S.; Stenchikov, G. 780 Observations and cloud-resolving modeling of haboob dust storms over the 781 Arabian Peninsula. J. Geophys. Res. Atmos. 2018, 123, 12–147. [Google Scholar] [CrossRef]
  63. Ahmady-Birgani, H.; Ravan, P.; Schlosser, J.S.; Cuevas-Robles, A.; AzadiAghdam, M.; Sorooshian, A. On the chemical nature of wet deposition over a major desiccated lake: Case study for Lake Urmia basin. Atmos. Res. 2020, 234, 104762–104774. [Google Scholar] [CrossRef]
  64. Ghafarian, P.; Tajbakhsh, S.; Delju, A.H. Analysis of the long-term trend of temperature, precipitation, and dominant atmospheric phenomena in Lake Urmia. In Lake Urmia; Springer: Cham, Switzerland, 2021. [Google Scholar]
  65. Mahmoudi, P.; Chahi, A.R. Analyzing the time series changes trend of the Aerosol Optical Depth (AOD) index of Terra satellite’s MODIS sensor for Jazmorian basin in the southeast of Iran during 2000-2018. In Proceedings of the International Conference on Dust Storm in Southwestern Asia, Zabol, Iran, 23 April 2019. [Google Scholar]
  66. Mozafari, M.; Hosseini, Z.; Fijani, E.; Eskandari, R.; Siahpoush, S.; Ghader, F. Effects of climate change and human activity on lake drying in Bakhtegan Basin, southwest Iran. Sustain. Water Resour. Manag. 2022, 8, 109. [Google Scholar] [CrossRef]
  67. Gharechaei, H.; Moghaddam Nia, A.; Malekian, A.; Ahmadi, A. Separation of the effects of climate variability and human activities on runoff of Bakhtegan Basin. Iran. J. Ecohydrol. 2015, 2, 445–454. [Google Scholar]
  68. Hassanzadeh, E.; Zarghami, M.; Hassanzadeh, Y. Determining the main factors in declining the Urmia Lake level by using system dynamics modeling. Water Resour. Manag. 2012, 26, 129–145. [Google Scholar] [CrossRef]
  69. Sattari, M.T.; Mirabbasi, R.; Jarhan, S.; Shaker Sureh, F.; Ahmad, S. Trend and abrupt change analysis in water quality of Urmia Lake in comparison with changes in lake water level. Environ. Monit. Assess. 2020, 192, 623. [Google Scholar] [CrossRef]
  70. Kafilzadeh, F.; Javid, H.; Kargar, M. Isolation of halophilic and halotolerant microorganisms from the Bakhtegan lake and the effect of physicochemical factors on their frequency. Water Wastewater 2007, 18, 81–87. [Google Scholar]
  71. Soudi, M.; Ahmadi, H.; Yasi, M.; Hamidi, S.A. Sustainable restoration of the Urmia Lake: History, threats, opportunities and challenges. Eur. Water 2017, 60, 341–347. [Google Scholar]
  72. Ahmadaali, J.; Barani, G.A.; Qaderi, K.; Hessari, B. Analysis of the effects of water management strategies and climate change on the environmental and agricultural sustainability of Urmia Lake Basin, Iran. Water 2018, 10, 160. [Google Scholar] [CrossRef]
  73. Helali, J.; Asaadi, S.; Jafarie, T.; Habibi, M.; Salimi, S.; Momenpour, S.E.; Shahmoradi, S.; Hosseini, S.A.; Hessari, B.; Saeidi, V. Drought monitoring and its effects on vegetation and water extent changes using remote sensing data in Urmia Lake watershed, Iran. J. Water Clim. Chang. 2022, 13, 2107–2128. [Google Scholar] [CrossRef]
  74. Karami, S.; Hamzeh, N.H.; Alam, K.; Noori, F.; Abadi, A.R.S. Spatio-temporal and synoptic changes in dust at the three islands in the Persian Gulf region. J. Atmos. Sol.-Terr. Phys. 2021, 214, 105539. [Google Scholar] [CrossRef]
  75. Omidvar, K.; Omidi, Z. The analysis of dust phenomenon in the southern and central Fars province. J. Geogr. Res. Desert Areas 2013, 1, 85–114. [Google Scholar]
  76. Mohammadi, A. Aeolian and fluvial processes influence on dust storms of Hormuz Strait and Makran coastal plains (SE Iran); insight from geomorphic landforms, and sediment texture and mineralogy. Int. J. Earth Sci. 2023, 112, 1973–1987. [Google Scholar] [CrossRef]
  77. Taraphdar, S.; Pauluis, O.M.; Xue, L.; Liu, C.; Rasmussen, R.; Ajayamohan, R.S.; Tessendorf, S.; Jing, X.; Chen, S.; Grabowski, W.W. WRF Gray-Zone Simulations of Precipitation Over the Middle-East and the UAE: Impacts of Physical Parameterizations and Resolution. J. Geophys. Res. Atmos. 2021, 126, 2021JD034648. [Google Scholar] [CrossRef]
  78. Sathe, Y.; Kulkarni, S.; Gupta, P.; Kaginalkar, A.; Islam, S.; Gargava, P. Application of Moderate Resolution Imaging Spectroradiometer (MODIS) Aerosol Optical Depth (AOD) and Weather Research Forecasting (WRF) model meteorological data for assessment of fine particulate matter (PM2.5) over India. Atmos. Pollut. Res. 2018, 10, 418–434. [Google Scholar] [CrossRef]
  79. Karegar, E.; Hamzeh, N.H.; Jamali, J.B.; Abadi, A.R.S.; Moeinaddini, M.; Goshtasb, H. Numerical simulation of extreme dust storms in east of Iran by the WRF-Chem model. Nat. Hazards 2019, 99, 769–796. [Google Scholar] [CrossRef]
  80. Ali, G.; Bao, Y.; Asmerom, B.; Ullah, W.; Ullah, S.; Arshad, M. Assessment of the simulated aerosol optical properties and regional meteorology using WRF-Chem model. Arab. J. Geosci. 2021, 14, 1871. [Google Scholar] [CrossRef]
  81. Berrisford, P.; Dee, D.; Poli, P.; Brugge, R.; Fielding, K.; Fuentes, M.; Kallberg, P.; Kobayashi, S.; Uppala, S.; Simmons, A. The ERA-Interim archive, version 2.0. ERA Rep. Ser. 2011, 1, 23. Available online: https://www.ecmwf.int/node/8174 (accessed on 22 May 2023).
  82. Foroushani, M.A.; Opp, C.; Groll, M.; Nikfal, A. Evaluation of WRF-Chem Predictions for Dust Deposition in Southwestern Iran. Atmosphere 2020, 11, 757. [Google Scholar] [CrossRef]
  83. Gholami, H.; Mohamadifar, A.; Collins, A.L. Spatial mapping of the provenance of storm dust: Application of data mining and ensemble modelling. Atmos. Res. 2019, 233, 104716. [Google Scholar] [CrossRef]
  84. Abbasi, E.; Etemadi, H.; Smoak, J.M.; Amouniya, H.; Mahoutchi, M.H. Dust storm source detection using ANP and WRF models in southwest of Iran. Arab. J. Geosci. 2021, 14, 1–15. [Google Scholar] [CrossRef]
  85. Available online: https://www.usgs.gov/products/maps (accessed on 10 July 2022).
  86. Lin, Y.L.; Farley, R.D.; Orville, H.D. Bulk parameterization of the snow field in a cloud model. J. Appl. Meteorol. Climatol. 1983, 22, 1065–1092. [Google Scholar] [CrossRef]
  87. Dudhia, J. Numerical study of convection observed during the winter monsoon experiment using a mesoscale two-dimensional model. J. Atmos. Sci. 1989, 46, 3077–3107. [Google Scholar] [CrossRef]
  88. Niu, G.Y.; Yang, Z.L.; Mitchell, K.E.; Chen, F.; Ek, M.B.; Barlage, M.; Kumar, A.; Manning, K.; Niyogi, D.; Rosero, E.; et al. The community Noah land surface model with multiparameterization options (Noah-MP): 1. Model description and evaluation with local-scale measurements. J. Geophys. Res. Atmos. 2011, 116, 1–19. [Google Scholar] [CrossRef]
  89. Available online: https://giovanni.gsfc.nasa.gov/giovanni (accessed on 12 July 2023).
  90. Hamzeh, N.H.; Kaskaoutis, D.G.; Rashki, A.; Mohammadpour, K. Long-Term Variability of Dust Events in Southwestern Iran and Its Relationship with the Drought. Atmosphere 2021, 12, 1350. [Google Scholar] [CrossRef]
  91. Hamzeh, N.H.; Karami, S.; Opp, C.; Fattahi, E.; Jean-François, V. Spatial and temporal variability in dust storms in the Middle East, 2002–2018: Three case studies in July 2009. Arab. J. Geosci. 2021, 14, 538. [Google Scholar] [CrossRef]
  92. Notaro, M.; Yu, Y.; Kalashnikova, O.V. Regime shift in Arabian dust activity, triggered by persistent Fertile Crescent drought. J. Geophys. Res. Atmos. 2015, 120, 10–229. [Google Scholar] [CrossRef]
  93. Yu, Y.; Notaro, M.; Liu, Z.; Wang, F.; Alkolibi, F.; Fadda, E.; Bakhrjy, F. Climatic Controls on the Interannual to Decadal Variability in Saudi Arabian Dust Activity: Toward the Development of a Seasonal Dust Prediction Model: Saudi Arabian Dust Prediction. J. Geophys. Res. 2015, 120, 1739–1758. [Google Scholar] [CrossRef]
  94. Shukurov, K.A.; Simonenkov, D.V.; Nevzorov, A.V.; Rashki, A.; Hamzeh, N.H.; Abdullaev, S.F.; Shukurova, L.M.; Chkhetiani, O.G. CALIOP-Based Evaluation of Dust Emissions and Long-Range Transport of the Dust from the Aral−Caspian Arid Region by 3D-Source Potential Impact (3D-SPI) Method. Remote Sens. 2023, 15, 2819. [Google Scholar] [CrossRef]
  95. Ghaheri, M.; Baghal-Vayjooee, M.H.; Naziri, J. Lake Urmia, Iran: A summary review. Int. J. Salt Lake Res. 1999, 8, 19–22. [Google Scholar] [CrossRef]
  96. Kumar, R.; Barth, M.C.; Pfister, G.G.; Naja, M.; Brasseur, G.P. WRF-Chem simulations of a typical pre-monsoon dust storm in northern India: Influences on aerosol optical properties and radiation budget. Atmos. Chem. Phys. 2014, 14, 2431–2446. [Google Scholar] [CrossRef]
  97. Saeed, T.M.; Al-Dashti, H.; Spyrou, C. Aerosols optical and physical characteristics and direct radiative forcing during a “Shamal” dust storm, a case study. Atmos. Chem. Phys. 2014, 14, 3751–3769. [Google Scholar] [CrossRef]
  98. Karami, S.; Kaskaoutis, D.G.; Kashani, S.S.; Rahnama, M.; Rashki, A. Evaluation of Nine Operational Models in Forecasting Different Types of Synoptic Dust Events in the Middle East. Geosciences 2021, 11, 458. [Google Scholar] [CrossRef]
  99. Mohammadpour, K.; Sciortino, M.; Saligheh, M.; Raziei, T.; Darvishi Boloorani, A. Spatiotemporal regionalization of atmospheric dust based on multivariate analysis of MACC model over Iran. Atmos. Res. 2020, 249, 105322. [Google Scholar] [CrossRef]
  100. Klingmüller, K.; Pozzer, A.; Metzger, S.; Stenchikov, G.L.; Lelieveld, J. Aerosol optical depth trend over the Middle East. Atmos. Chem. Phys. 2016, 16, 5063–5073. [Google Scholar] [CrossRef]
  101. Shaheen, A.; Wu, R.; Yousefi, R.; Wang, F.; Ge, Q.; Kaskaoutis, D.G.; Wang, J.; Alpert, P.; Munawar, I. Spatio-temporal changes of spring-summer dust AOD over the Eastern Mediterranean and the Middle East: Reversal of dust trends and associated meteorological effects. Atmos. Res. 2023, 281, 106509. [Google Scholar] [CrossRef]
  102. Kaskaoutis, D.G.; Rashki, A.; Houssos, E.E.; Mofidi, A.; Goto, D.; Bartzokas, A.; Francois, P.; Legrand, M. Meteorological aspects associated with dust storms in the Sistan region, southeastern Iran. Clim. Dyn. 2015, 45, 407–424. [Google Scholar] [CrossRef]
  103. Mohammadi, K.; Mostafaeipour, A. Using different methods for comprehensive study of wind turbine utilization in Zarrineh, Iran. Energy Convers. Manag. 2013, 65, 463–470. [Google Scholar] [CrossRef]
  104. Mostafaeipour, A.; Sedaghat, A.; Ghalishooyan, M.; Dinpashoh, Y.; Mirhosseini, M.; Sefid, M.; Pour-Rezaei, M. Evaluation of wind energy potential as a power generation source for electricity production in Binalood, Iran. Renew. Energy 2013, 52, 222–229. [Google Scholar] [CrossRef]
  105. Pishgar-Komleh, S.H.; Keyhani, A.; Sefeedpari, P. Wind speed and power density analysis based on Weibull and Rayleigh distributions (a case study: Firouzkooh county of Iran). Renew. Sustain. Energy Rev. 2015, 42, 313–322. [Google Scholar] [CrossRef]
  106. Rashki, A.; deW Rautenbach, C.J.; Eriksson, P.G.; Kaskaoutis, D.G.; Gupta, P. Temporal changes of particulate concentration in the ambient air over the city of Zahedan, Iran. Air Qual. Atmos. Health 2013, 6, 123–135. [Google Scholar] [CrossRef]
  107. Rashki, A.; Kaskaoutis, D.G.; deW Rautenbach, C.J.; Eriksson, P.G.; Qiang, M.; Gupta, P. Dust storms and their horizontal dust loading in the Sistan region, Iran. Aeolian Res. 2012, 5, 51–62. [Google Scholar] [CrossRef]
  108. Kok, J.F.; Ridley, D.A.; Zhou, Q.; Miller, R.L.; Zhao, C.; Heald, C.L.; Ward, D.S.; Albani, S.; Haustein, K. Smaller desert dust cooling effect estimated from analysis of dust size and abundance. Nat. Geosci. 2017, 10, 274–278. [Google Scholar] [CrossRef]
  109. Kalenderski, S.; Stenchikov, G.L.; Zhao, C. Modeling a typical winter time dust event over the Arabian Peninsula and the Red Sea. Atmos. Chem. Phys. 2013, 13, 1999–2014. [Google Scholar] [CrossRef]
  110. Ukhov, A.; Mostamandi, S.; da Silva, A.; Flemming, J.; Alshehri, Y.; Shevchenko, I.; Stenchikov, G. Assessment of natural and anthropogenic aerosol air pollution in the middle east using MERRA-2, CAMS data assimilation products, and high-resolution WRF-chem model simulations. Atmos. Chem. Phys. 2020, 20, 9281–9310. [Google Scholar] [CrossRef]
  111. Basart, S.; Vendrell, L.; Baldasano, J.M. High-resolution dust modelling over complex terrains in West Asia. Aeolian Res. 2016, 23, 37–50. [Google Scholar] [CrossRef]
  112. Adebiyi, A.; Kok, J.F. Climate models miss most of the coarse dust in the atmosphere. Sci. Adv. 2020, 6, eaaz9507. [Google Scholar] [CrossRef]
  113. Shevchenko, I.; Engelbrecht, J.P.; Mostamandi, S.; Stenchikov, G. Evaluation of minerals being deposited in the Red Sea using gravimetric, size distribution, and mineralogical analysis of dust deposition samples collected along the Red Sea coastal plain. Aeolian Res. 2021, 52, 100717. [Google Scholar] [CrossRef]
  114. Menut, L. Sensitivity of hourly Saharan dust emissions to NCEP and ECMWF modeled wind speed. J. Geophys. Res. Atmos. 2008, 113, D16201. [Google Scholar] [CrossRef]
  115. Cowie, S.M.; Marsham, J.H.; Knippertz, P. The importance of rare, high-wind events for dust uplift in northern Africa. Geophys. Res. Lett. 2015, 42, 8208–8215. [Google Scholar] [CrossRef]
  116. Wu, J.; Zha, J.; Zhao, D. Estimating the impact of the changes in land use and cover on the surface wind speed over the East China Plain during the period 1980–2011. Clim. Dyn. 2016, 46, 847–863. [Google Scholar] [CrossRef]
  117. Kontos, S.; Liora, N.; Giannaros, C.; Kakosimos, K.; Poupkou, A.; Melas, D. Modeling natural dust emissions in the central Middle East: Parameterizations and sensitivity. Atmos. Environ. 2018, 190, 294–307. [Google Scholar] [CrossRef]
  118. Gholami, H.; Rahimi, S.; Fathabadi, A.; Habibi, S.; Collins, A.L. Mapping the spatial sources of atmospheric dust using GLUE and Monte Carlo simulation. Sci. Total Environ. 2020, 723, 138090. [Google Scholar] [CrossRef] [PubMed]
  119. Ukhov, A.; Ahmadov, R.; Grell, G.; Stenchikov, G. Improving dust simulations in WRF-Chem v4. 1.3 coupled with the GOCART aerosol module. Geosci. Model Dev. 2021, 14, 473–493. [Google Scholar] [CrossRef]
  120. Neira, M.; Erguler, K.; Ahmady-Birgani, H.; AL-Hmoud, N.D.; Fears, R.; Gogos, C.; Hobbhahn, N.; Koliou, M.; Kostrikis, L.G.; Lelieveld, J.; et al. Climate change and human health in the Eastern Mediterranean and middle east: Literature review, research priorities and policy suggestions. Environ. Res. 2023, 216, 114537. [Google Scholar] [CrossRef]
  121. Gholami, A.; Ameri, M.; Zandi, M.; Ghoachani, R.G.; Eslami, S.; Pierfederici, S. Photovoltaic Potential Assessment and Dust Impacts on Photovoltaic Systems in Iran: Review Paper. IEEE J. Photovolt. 2020, 10, 824–837. [Google Scholar] [CrossRef]
  122. Karami, S.; Kaskaoutis, D.G.; Ghassabi, Z.; Khansalari, S. Investigation and model simulation of dry and moist (haboob) convective dust storms in Yazd Province, central Iranian plateau. Arab. J. Geosci. 2023, 16, 241. [Google Scholar] [CrossRef]
  123. Abbasi, H.R.; Opp, C.; Groll, M.; Rohipour, H.; Khosroshahi, M.; Khaksarian, F.; Gohardoust, A. Spatial and temporal variation of the aeolian sediment transport in the ephemeral Baringak Lake (Sistan Plain, Iran) using field measurements and geostatistical analyses. Z. Geomorphol. 2018, 61, 315–326. [Google Scholar] [CrossRef]
  124. Goudie, A. Dust storms and ephemeral lakes. Desert 2018, 23, 153–164. [Google Scholar]
Figure 1. Topography of the study areas in Urmia (NW Iran) and Bakhtegan (South Iran) Basins with the synoptic weather stations used in the analysis. Arrows show the predominant wind in the stations.
Atmosphere 15 00024 g001
Figure 2. Combined MODIS Terra and Aqua True-color satellite images (courtesy of NASA Worldview at https://worldview.earthdata.nasa.gov, accessed on 5 December 2023) of Urmia Lake and Bakhtegan Lake water coverage in December of 2000, 2010, and 2020.
Atmosphere 15 00024 g002
Figure 3. The two domains used in the WRF model simulations over the Middle East (domain 1) with 134,113 grid points and Iran (domain 2) with 70,144 grid points.
Atmosphere 15 00024 g003
Figure 4. Variation in (a) the annual number of dust days at five stations around Urmia Lake, (b) five stations around Bakhtegan Lake, and (c) annual MODIS-Terra AOD over the two lake basins in 2000–2020.
Atmosphere 15 00024 g004
Figure 5. Mean diurnal variation of the simulated 10 m hy wind speed (m/s) and percentage of reported dust codes in 2005–2015 at stations around Urmia Lake (left column; (a,c)) and at stations around Bakhtegan Lake (right column; (b,d)). The hour is in UTC.
Atmosphere 15 00024 g005
Figure 6. Mean diurnal variation of the WRF model (blue circles) and the measured data (red circles) of 10 m wind speed (m/s) at the examined stations around Urmia (first row) and Bakhtegan (second row) Lakes in 2005–2015.
Atmosphere 15 00024 g006
Figure 7. Frequency distribution of WRF-simulated (first row) and measured (second row) 10 m wind speeds (in m/s) during 2005–2015 at Sardasht, Urmia, Bonab, Tabriz, and Salmas stations around Urmia Lake.
Atmosphere 15 00024 g007
Figure 8. Frequency distribution of WRF-simulated (first row) and measured (second row) 10 m wind speed (in m/s) during 2005–2015 at Fasa, Estahban, Neyriz, Shiraz, and Arsanjan stations around Bakhtegan Lake.
Atmosphere 15 00024 g008
Figure 9. Correlation analysis of the monthly mean 10 m wind speeds (m/s) from WRF simulations and measurements at the synoptic weather stations in Urmia (first row) and Bakhtegan Lakes (second row) from 2005 to 2015.
Atmosphere 15 00024 g009
Figure 10. WRF-simulated (upper row) and measured (below row) wind roses in Tabriz (first column), Sardasht (second column), Urmia (third column), and Bonab (fourth column) stations from 2005 to 2011.
Atmosphere 15 00024 g010
Table 1. The selected meteorological stations around the wetlands in NW and South Iran and the total number of dust days during 2000–2020.
Synoptic StationLongitude
°C
Latitude
°C
Elevation
M
Mean Annual Number of Dust Days
Urmia45.0537.65132813.85
Tabriz46.2438.12136129.95
Bonab46.0537.37128114.42
Salmas44.8438.2113937.85
Sardasht45.4736151556.824.62
Shiraz52.6029.56148861.48
Fasa53.7228.89126862.90
Neyriz54.3529.18163250.71
Estahban54.0429.14169042.64
Arsanjan53.2829.93167630.14
Table 2. Summary of WRF model setup used for the current simulations.
Model Setup
WRF Version 3.9
Domain 1: 274 × 256 grid points and 15 km grid spacing;
Domain 2: 391 × 343 and 5 km grid spacing. 39 vertical levels up to the top of 100 hPa.
Simulation setup
Initial and boundary conditions: ECMWF ERA-Interim reanalysis of 0.75° × 0.75° horizontal resolution
Spin-up: 12 h
Physical parameterizations
Microphysics: Lin et al. scheme [86]
Longwave Radiation: RRTM scheme; Shortwave Radiation: Dudhia scheme [87]
Land Surface: Noah Land Surface Model [88]
Table 3. Slope values of the linear regression trends in the annual number of dust days at stations near Urmia and Bakhtegan lakes and in Terra-MODIS AOD over the two lakes from 2000 to 2020.
Synoptic Station K 2000 2010 K 2011 2020
Urmia2.08−3.5
Tabriz3.92−4.8
Bonab1.76−3.14
Salmas−0.4−1.45
Sardasht4.89−5.15
AOD Urmia Lake0.0055−0.011
Shiraz2.58−6.38
Fasa 10.3 −5.37
Neyriz 8.04 −5.28
Estahban 11.6 −2.12
Arsanjan-−4.5
AOD Bakhtegan Lake0.006−0.007
Table 4. Statistical parameters of the WRF-simulated 10 m wind speed distributions in 2005–2015 for the stations near Urmia and the Bakhtegan lakes: most frequent wind speed, VMF [m/s], average wind speed, VAVE [m/s], maximum wind speed, VMAX [m/s], standard deviation, σ, asymmetry, A, and kurtosis, K.
Synoptic StationVMF VAVEVMAXΣAK
Urmia2.5–3 (14%)2.625.263.651.423.94
Tabriz2.5–3 (14%)3.524.123.840.390.47
Bonab4–5 (22%)2.121.842.990.590.69
Salmas2–3 (29%)322.461.971.533.76
Sardasht5–6 (15%)320.753.250.870.76
Shiraz2.5–4.5 (27%)1.819.863.611.351.46
Fasa2–3 (25%)1.721.574.841.051.22
Neyriz2.5–3.5 (25%)2.2429.428.681.182.22
Estahban2.5–3.5 (20%)2.725.793.921.061.84
Arsanjan2.5–4.5 (27%)3.522.763.850.911.04
Table 5. Statistical indicators between WRF wind speed simulations and the measured data at the ten examined stations during 2005–2015.
Synoptic StationMBERMSENSE
Urmia0.840.95−2.25
Tabriz0.380.480.72
Bonab2.362.46−4.93
Salmas0.640.850.04
Sardasht1.241.42−1.74
Shiraz1.831.86−13.06
Fasa1.931.95−11.8
Neyriz0.221.261.87
Estahban2.232.32−9.66
Arsanjan0.740.910.50
Disclaimer/Publisher’s Note: The statements, opinions and data contained in all publications are solely those of the individual author(s) and contributor(s) and not of MDPI and/or the editor(s). MDPI and/or the editor(s) disclaim responsibility for any injury to people or property resulting from any ideas, methods, instructions or products referred to in the content.