Article

Characteristics of Absorbing Aerosols in Mexico City: A Study of Morphology and Columnar Microphysical Properties

by
Giovanni Carabali
1,*,
Faustino Juárez-Sánchez
1,
Rafael N. Liñan-Abanto
2,
Héctor Estévez
1,
Mauro Valdés-Barrón
1,
Roberto Bonifaz-Alfonso
1,
David Riveros-Rosas
1 and
Adriana González-Cabrera
1
1
Geophysics Institute, National Autonomous University of Mexico (UNAM), Mexico City 04510, Mexico
2
Departamento de Física, Facultad de Ciencias, Universidad Nacional Jorge Basadre Grohmann, Tacna 23003, Peru
*
Author to whom correspondence should be addressed.
Atmosphere 2024, 15(1), 108; https://doi.org/10.3390/atmos15010108
Submission received: 24 November 2023 / Revised: 28 December 2023 / Accepted: 30 December 2023 / Published: 16 January 2024
(This article belongs to the Topic Atmospheric Chemistry, Aging, and Dynamics)

Abstract

:
This paper presents an analysis of the morphology and columnar microphysical properties of atmospheric aerosols in Mexico City (MC) for the period 2022–2023. The morphological study focused on the structure description of soot particles and tar balls (TB). By transmission electron microscope (TEM) and scanning electrode microscope (SEM), voluminous soot aggregates mixed with TBs were observed. The chemistry shows that both soot and TBs are mostly carbonaceous species with well-defined morphologies. On the other hand, the columnar aerosol microphysical properties recovered from AERONET show that the particles have a bimodal aerosol size distribution (ASD) with two modes: fine and coarse. The ASD remains constant without showing significant seasonal changes, only with some variability for coarse particles. The aerosol optical depth (AOD) value is significantly high, typical of urban areas. The real (n) and imaginary (k) parts of the complex refractive index (CRI) were obtained from the photometric measurements. The CRI values show seasonal variations, with spring being the season with the highest values for n, while the highest values for k were measured in winter.

1. Introduction

Atmospheric aerosols are a combination of solid or liquid particles that stay suspended in the air. These particles play a crucial role in the planet’s radiation balance [1]. They scatter and absorb solar and infrared radiation in the atmosphere, leading to direct radiative forcing [1,2]. Aerosols also indirectly influence climate because they act as cloud condensation nuclei (CCN), which affect the microphysical properties of clouds [1,3]. To understand the complex interactions between aerosols, radiation, and clouds, as well as their impact on air quality, it is necessary to study their direct and indirect effects. The most effective way to understand these effects is through a detailed analysis of aerosol optical properties (AOP), which are largely dependent on key microphysical parameters, such as particle morphology, size distribution, and the complex refractive index [4,5].
The study of aerosol morphology provides valuable information about the particle structure, mixing state, and aging process [6,7,8,9]. A detailed description of the particle shape reveals information about its formation process and surface characteristics, which describes the ability to react chemically with other aerosols [8,10]. Numerous theoretical approaches have been developed to better understand the morphology of atmospheric particles. The calculation of dynamic shape factors (χ) is a frequently employed method, but it has its limitations. Specifically, it is not sensitive enough to detect the finer details of particle shapes, and it is necessary to know the particle density [11]. The methods that are effective in studying aerosol morphology involve calculating the fractal dimension (DF), which is a mathematical concept used to describe the complexity and self-similarity of irregular or fragmented geometric shapes [6,7,8,9]. In recent decades, the use of sophisticated electron microscopy techniques and the rapid advancements in computer language and image recognition techniques have made DF a widely used parameter to describe the morphology of soot particles [8]. Carabali et al. (2016, 2012) have employed the DF parameter to study aerosol transport in the MC pollutant plume and to describe the morphological distributions of soot emitted by wood-burning stoves [12,13].
The complex refractive index (CRI) is another essential microphysical parameter of aerosols, which is used in radiative transfer calculations [14,15]. CRI is generally described as m = n + ik, where n is the real part, describing the scattering characteristics of particles, while ik is the imaginary part that relates the absorption properties of aerosols. CRI is highly dependent on aerosol composition and is an important input for models simulating aerosol—electromagnetic radiation interactions. Measuring CRI for aerosols is complicated because its value can vary depending on factors such as aerosol composition, size, and atmospheric conditions [14,15]. Therefore, measurements and estimation techniques must take these variations into account to provide accurate results. A combination of spectroscopic methods (e.g., ultraviolet violet (UV) and infrared spectroscopies (IR)) and modeling is usually used to estimate the CRI in atmospheric particles [4,5]. For the MC basin, Dubovik et al. (2002) reported a mean CRI of 1.47-0.006i recovered from sun photometric measurements, while Moffet and Prather (2009) found a value of 1.49 for the n part of the CRI from theoretical Mie calculations [16,17]. These CRI values not only show a high load of these particles but also demonstrate the presence of highly scattering and absorbing aerosols in the MC atmosphere.
CRI values can be retrieved from spectral measurements of AOD, direct and diffuse radiation, using a sun photometer. This method has been successfully applied in the worldwide Robotic Aerosol Network (AERONET) [18,19]. The AERONET project, which was launched in the 1990s, is a global network that measures aerosol microphysical properties, such as aerosol size distribution, AOD, precipitable water vapor (PW), and the Angstrom exponent (AE). The primary goal of the project is to monitor AOP from the ground for the long term. Mexico City has been using a sun photometer associated with AERONET since 1999 to continuously measure AOP. This has contributed to a better understanding of air quality in the region [20].
This paper presents a study of the microphysical properties of atmospheric aerosols in MC. The morphological analysis of recently sampled particles evidences important structural details of soot and TB, the two most common types of particles in the atmosphere of the MC basin. The columnar optical properties of the aerosols were also studied. Specifically, the CRI and the ASD retrieved from the AERONET site in Mexico City were analyzed. This article is organized as follows: a brief description of the measurement site and instrumentation is presented in Section 2. The morphology and chemical characteristics of the individual particles are discussed in Section 3.1; the results obtained from the fractal distribution curves are described in Section 3.2; the optical parameters of the aerosols and their seasonal variability is presented in Section 3.3; the size distribution of the aerosols can be found in Section 3.4; a detailed description of the complex refractive index is given in Section 3.5; and in Section 3.6, an aerosol type classification based on the spectral measurements of AE and AOD retrieved from AERONET is discussed. Finally, Section 4 presents the main conclusions.

2. Materials and Methods
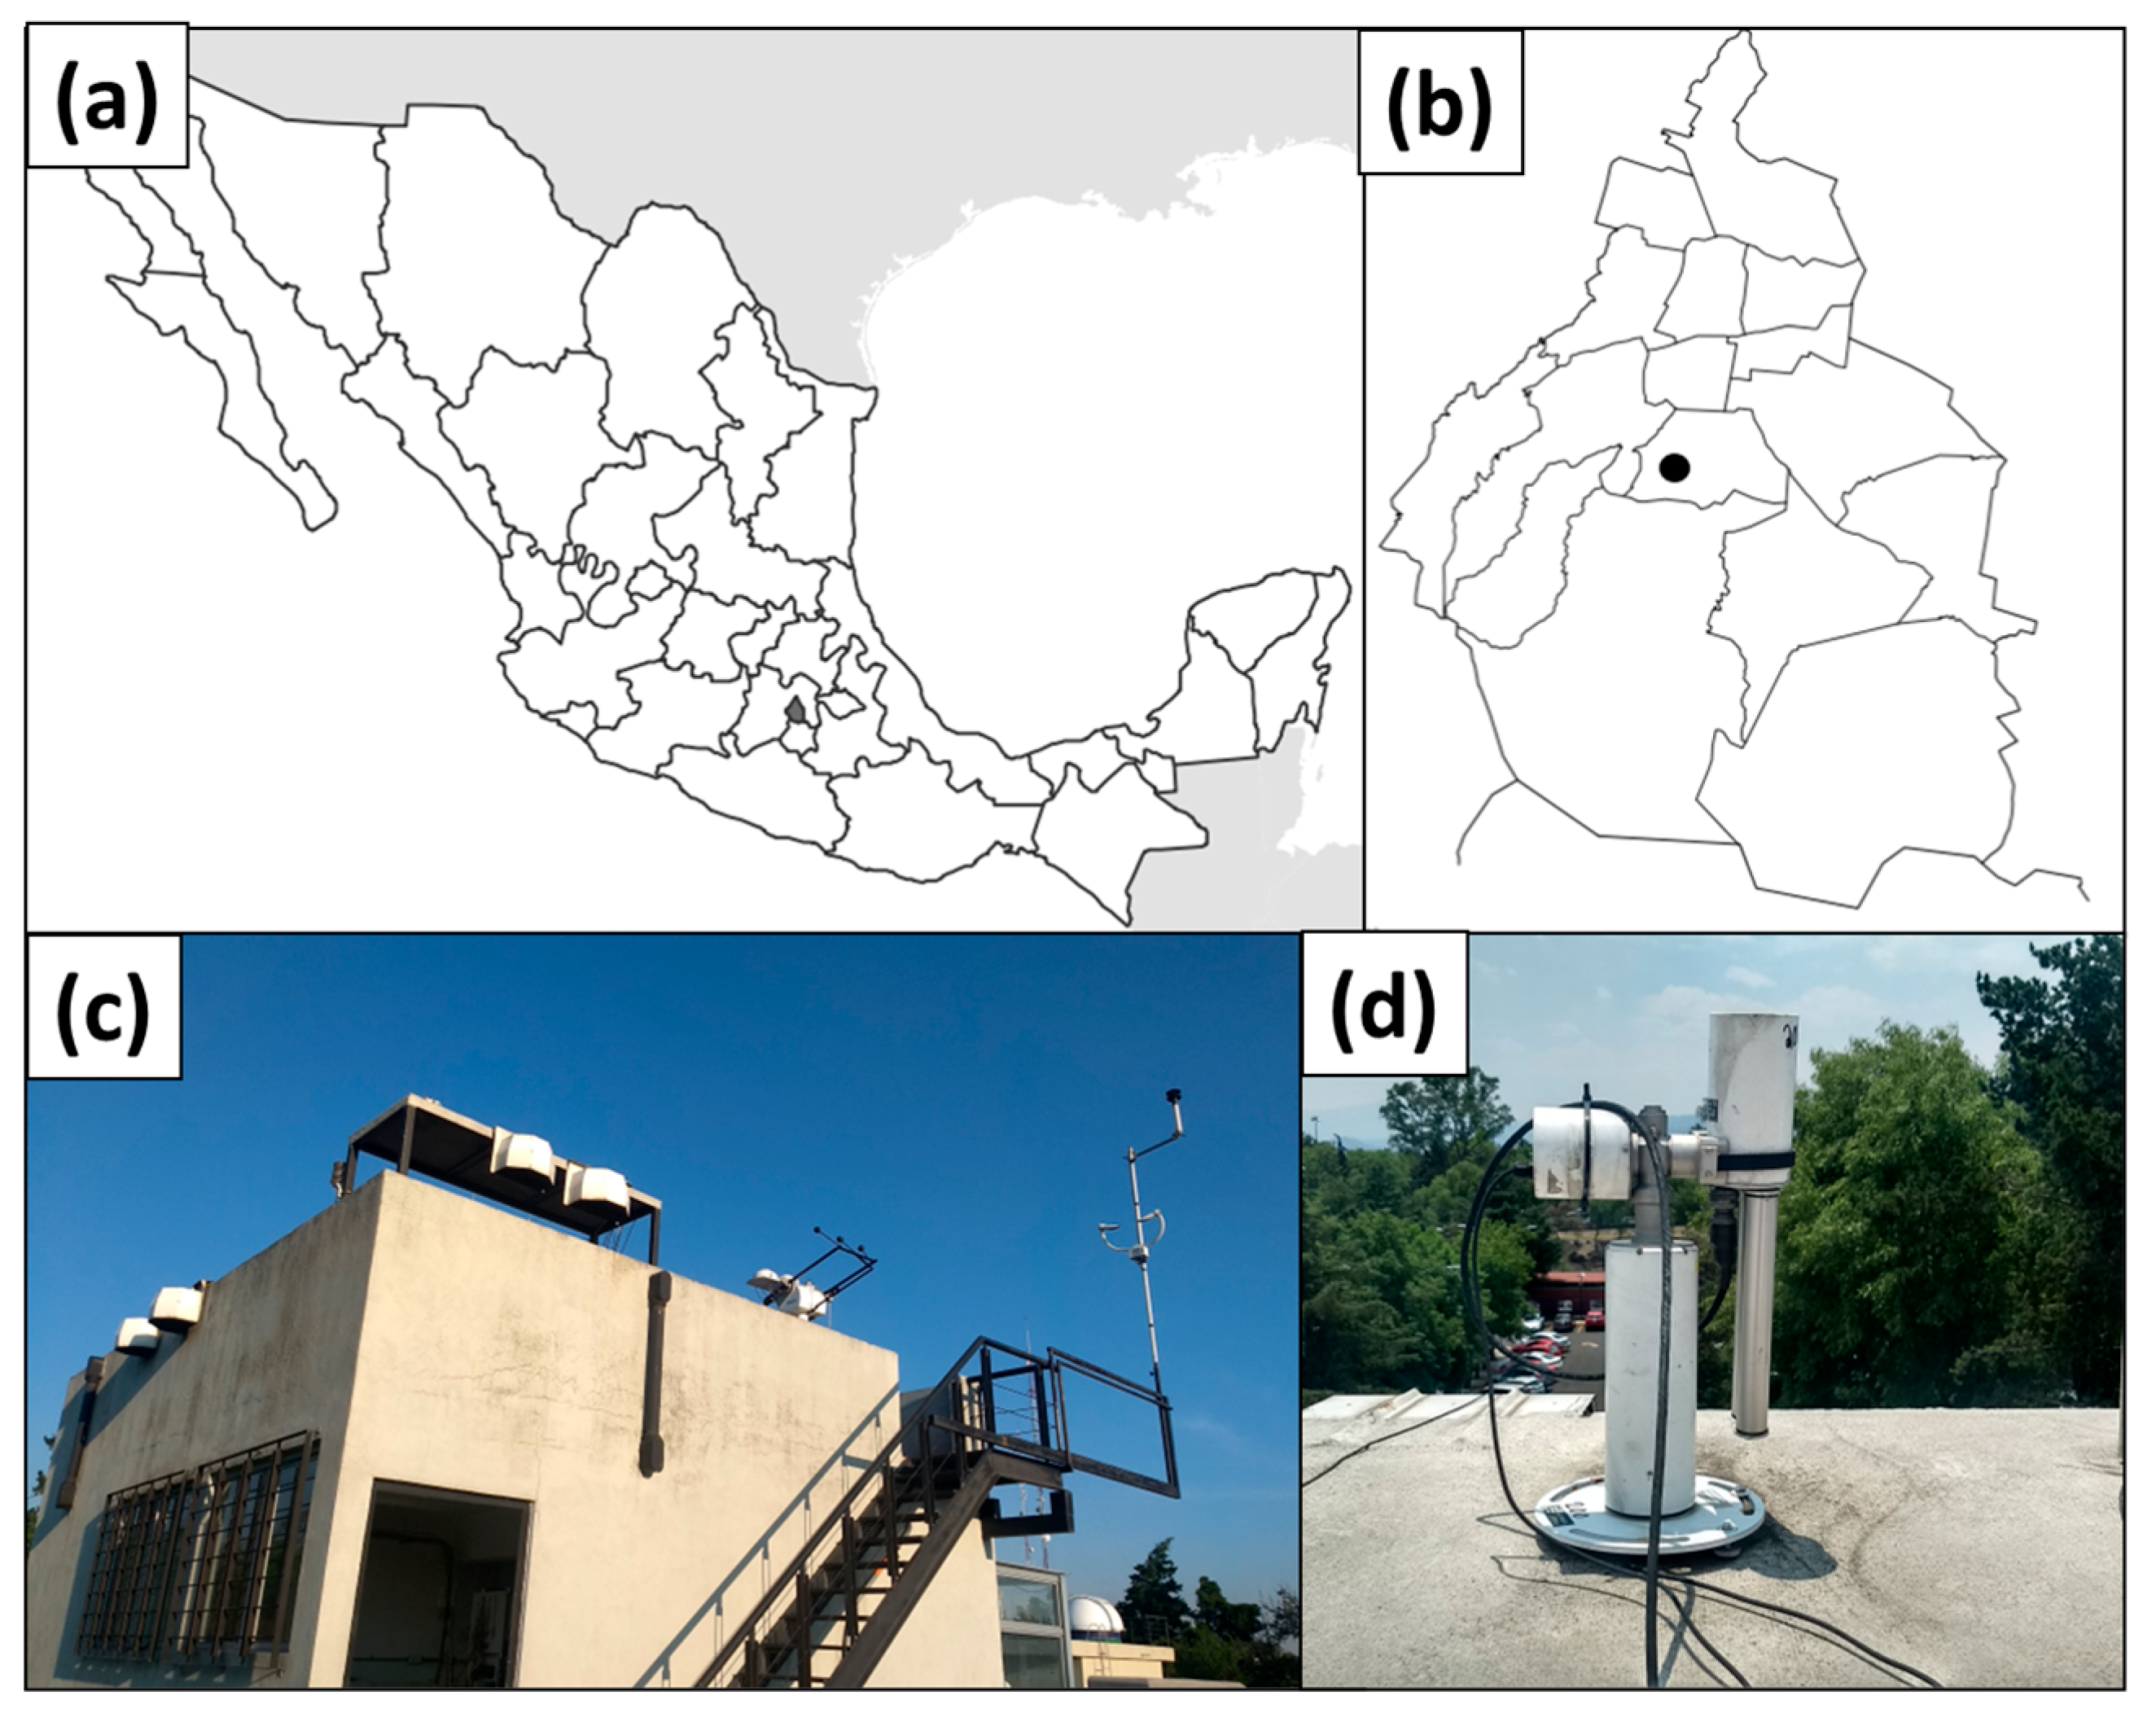
2.1. Study Region

The Mexico City (MC) Metropolitan Area, also called the MCMA, is a large region in central Mexico that includes MC and 60 other municipalities (Figure 1). With a population of over 20 million people, it is one of the largest and most densely populated metropolitan areas in the Americas [21]. This city is known for its poor air quality, which is caused by a combination of factors such as heavy traffic, industrial activities, and the city’s complex geography. The observation equipment utilized in this research was placed on the roof of the Institute of Atmospheric Sciences and Climate Change (ICACC) building at the Universidad Nacional Autónoma de México (UNAM) campus, located in southern MC (19°20′ N, 99°10′ W, 2250 m. a. s. l.). MC experiences three distinct seasonal periods, spring, winter, and rainy, due to its subtropical climate. Spring is from March to May, followed by the rainy season from June to October, and finally, winter is from November to February. While the exact dates may vary, these three seasonal periods are widely acknowledged and accepted [22,23].
MC experiences three distinct seasons throughout the year due to its location in a subtropical zone. According to several meteorological studies, MC has three seasons: winter, from November to March; the spring season, from April to May; and the rainy season, from June to October [22,23]. The winter season is characterized by a dominant westerly current that brings an anticyclonic flow and clear skies, leading to a strong nocturnal thermal inversion [22,23]. This inversion persists until several hours after sunrise, when it is eroded by turbulent mixing generated by the strong solar heating of the surface. Spring is the warmest season due to higher sunshine, which leads to an increase in temperatures and evaporation rates, ultimately resulting in a drier environment. In April and May, the temperature usually reaches 30 °C with low relative humidity. Spring is also considered a dry season because rainfall tends to be lower compared to the summer months [22,23]. During the rainy season, prevailing easterly winds interact with the mountains surrounding Mexico City, forcing upward movement and convection. Clear mornings with infrequent thermal inversions mix pollutants with turbulent eddies. Convection over the mountains dilutes pollutants with vertical updrafts within the clouds. Precipitation has a large gradient within the basin, ranging from 400 mm to 1200 mm per year [22,23].

2.2. Aerosol Sampling

Aerosol particles were sampled in an 8-stage Micro Orifice Uniform Deposit Impactor (MOUDI, Model 100, MSP Corp.) [24]. MOUDI separates aerosol particles based on their aerodynamic size using eight impactor stages. Each stage consists of a set of nozzles and impactor plates that allow particles of a certain size range (from 0.8 to 10 μm) to be collected in each stage. Copper TEM grids with 200 mesh (Ted Pella Gilder grids, LF-200-Cu) coated with a thin film of collodion polymer were used to collect atmospheric particles. These grids were attached on 47 mm aluminum foils with double-sided carbon adhesive tape. Subsequently, the impact plates of the MOUDI were coated with aluminum foils equipped with the TEM grids. The MOUDI inlet flow rate was calibrated at 30 L/min, and sampling times of 20 min were set to avoid particle saturation on the TEM grids [12,25].
To study the morphology of atmospheric particles, aerosol samples were collected in the different seasons of the year: winter, spring, and rain. Sampling was performed in periods of three days for each season of both years, 2022 and 2023. The schedule of days sampled for each year is listed in Table 1. A total of 18 TEM grids with atmospheric particulate samples were obtained. Multiple aerosols are impacted within each TEM grid, but due to the operational limitations of the TEM, it was only possible to obtain 5 particle micrographs per TEM grid. In total, thirty particle images were obtained for each season, mainly winter and spring. It was not possible to obtain good particle images for the rainy season due to technical problems associated with the rupture of the polymer coating of the TEM grid and the humidity of some samples.

2.3. TEM and SEM Micrographs

Atmospheric particle micrographs for morphology studies were performed on SEM and HRTEM microscopes. These instruments are located at the Central Microscopy Laboratory (CML) of the Physics Institute (UNAM) [25]. SEM instruments (SEM JEOL-JSM-7800F) operate with voltages that fluctuate between 1 and 10 kV and are equipped with an energy-dispersive X-ray spectrometer (EDS) (Oxford Instruments, Abingdon, Oxfordshire, UK), which uses the AZtec 2.1 software for the analysis. The HRTEM instrument (JEOL JEM-2010F) operated at 200 kV near the Scherrer focus, with a theoretical point-to-point resolution of 0.20 nm and a spherical aberration of 0.5 mm. To capture images of the aerosols, TEM grids were directly introduced into the SEM and HRTEM without any prior treatment. The images were taken with a CCD camera and further processed using the GATAN digital micrographic system (version 3.7.0, Roper Technologies, Inc., Sarasota, FL, USA).

2.4. Fractal Dimension Analysis

Fractal dimension (DF) is a mathematical tool commonly used to describe the shape of non-spherical particles [9,26]. This concept was first introduced by the mathematician Benoit Mandelbrot, who assigned the term DF to Richardson’s plot slope for the particle perimeter. The Richardson scheme or log—log plot is a graphical tool used to describe “self-similarity” and measure the perimeter of irregular shapes and objects [26]. The main characteristic of a fractal object is the self-similarity of its structure in different enlargements. This property can be studied by using the border-based fractal dimension equation [26,27].
L = K L λ L 1 D f
where KL is a constant, L is the perimeter, λL is the segment length (the length at which the perimeter is cut into small sections), and Df is the fractal dimension.
The perimeter fractal dimension (PFD) of aerosol particles was calculated from the HRTEM micrographs. The calculation process begins with the processing of the digital particle images using the free software SCION Image 4.0, which optimizes the images and extracts the particle coordinates. SCION also provides the area of the particle and the length of its perimeter in pixels. Subsequently, these results were introduced into a computer code that calculate the fractal dimension of the particles [27]. In this study, a total of 60 particles collected in both the spring and winter seasons were analyzed. In each season, 30 particles were analyzed using a computational code that calculates the DF parameter of each particle. Based on the obtained DF results, fractal distribution curves (FDC) were plotted.

2.5. AERONET Station in Mexico City

The aerosol optical parameters were measured with a CIMEL sun photometer (CE-318), which is an automatic sun—sky-scanning spectral radiometer. The CE-318 was installed at the Solar Radiation Observatory (SRO), located on the roof of the ICACC building (Figure 1). Developed by NASA in 1992, the CIMEL is a state-of-the-art instrument designed to measure the optical properties of atmospheric aerosols. This sun photometer is a multi-channel radiometer that measures the direct solar irradiance at various wavelengths (340, 380, 440, 500, 675, 870, 937, and 1020 nm). These channels cover a range of wavelengths from the ultraviolet (UV) through the visible and into the near-infrared (NIR) regions of the electromagnetic spectrum. Each channel is sensitive to different atmospheric components and aerosols, which allows for the characterization of aerosol properties and other atmospheric parameters such as the water vapor (PW) content. Numerous studies have previously described the instrumentation, data acquisition, retrieval algorithms, and calibration procedures in detail, which all conform to the rigorous standards of the AERONET global network [15,18,19,28].
The AOD values are calculated using the measurements of absorbed solar radiation in the spectral range of 340–1020 mn. This calculation is based on the Beer—Lambert—Bouguer law, which relates the attenuation of light to the concentration of absorbing and scattering particles in the atmosphere. Dubovik and King (2000) present an analysis of the uncertainty associated with the retrieval of AOD from AERONET [15]. The aerosol Ångström exponent (α440–870) (also referred to here as AE) is a parameter used to describe the spectral dependence of aerosol optical properties. It describes how the AOD changes with wavelength. The AE is calculated using measurements of aerosol optical depth at two or more wavelengths within the UV to NIR spectral range. In this work, precipitable water (PW), aerosol size distribution (ASD), and the complex refractive index (CRI) data with real (n) and imaginary (k) components were retrieved from the AERONET measurements for the studied period. For retrieving data from AERONET, there are three quality levels available: 1.0, 1.5, and 2. In this work, the level 1.5 database was utilized. This level contains raw measurements that are directly taken from the instrument, including direct sun/sky radiance and sky radiance measurements.

2.6. Aerosol Classification

The remote sensing formalism reported by Gobbi et al. (2007) was used to classify the aerosols and to know the predominant particle type in the MC atmosphere. In this method, the relationship between angstrom exponent (AE(440, 870)) and its difference dAE (AE(440, 675)—AE(675, 870)) is plotted, which generates a scheme that allows for estimating the contribution of fine aerosol to the AOD [20,29].

3. Results

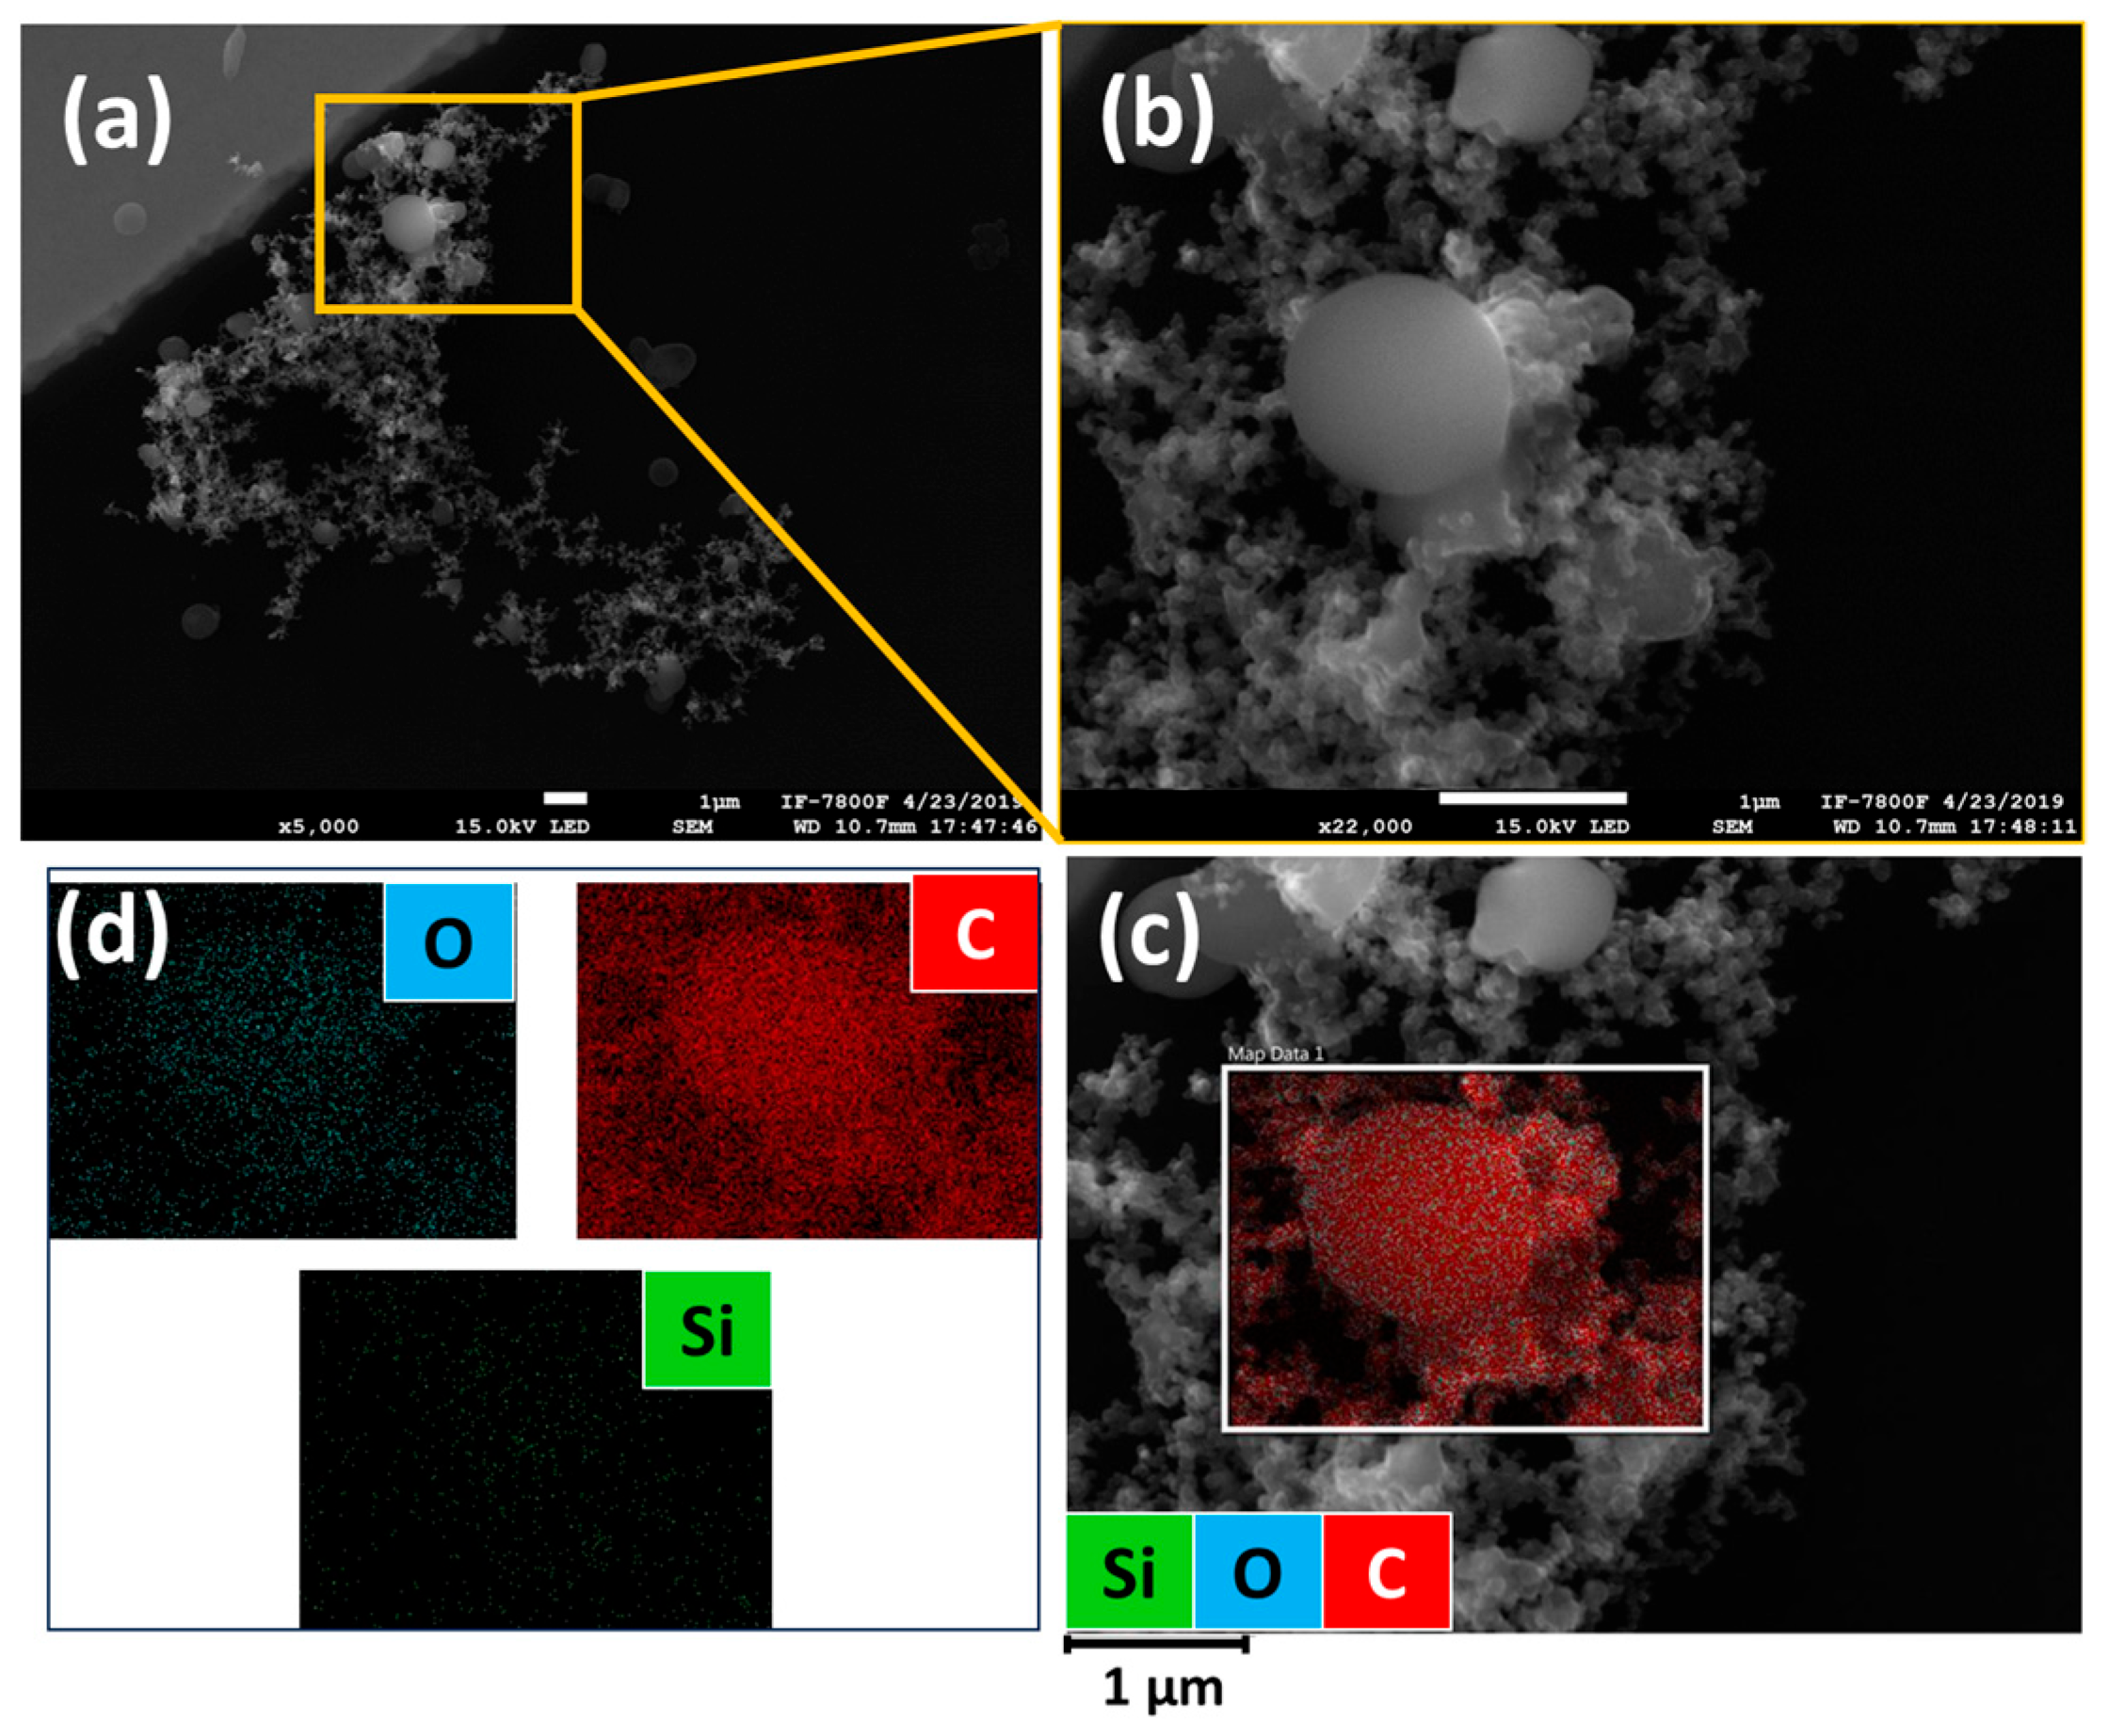
3.1. Morphology and Chemical Characteristics of Individual Particles

The study of atmospheric aerosols with high-resolution instrumentation can provide valuable insights into the particle physics characteristics that influence their optical properties and behavior in the atmosphere. Figure 2 shows the HRTEM images of aerosols that were sampled in MC’s atmosphere at different periods of the year. Figure 2a shows the HRTEM image of a soot particle sample in the winter, which has a diameter (dp) of 1.5 μm and is made up of chains of several nanometer-sized carbon particles that are interconnected. Likewise, when soot combines with larger particles, they can form more intricate structures such as agglomerates and fractal-like shapes. Figure 2b shows the HRTEM image of nanometer spherical particles (dp < 700 nm) that are bound together. These types of particles are called tarball (TB) and are known for their unique spherical shape and composition, which mostly consists of carbon and oxygen. Nevertheless, depending on the emission source and atmospheric mixing process, they may also contain minor amounts of other elements [25]. According to a study conducted by Rios et al. (2023), the spring season in Mexico City is known for having a high number of forest fires, resulting in a large amount of TB in the atmosphere [25]. These particles are primarily made up of black or brown carbon and are mainly produced from biomass burning emissions. Something important that has recently been reported is the formation of voluminous carbonaceous aggregates, where the TBs are attached to the soot chains, as shown in Figure 2c [25]. Aside from their intricate morphology, these particles are also notable for their ability to absorb solar radiation efficiently. The EDS spectrum in Figure 2d reveals the elemental composition of the TB particles joined to soot aggregate (TB—soot aggregate in Figure 2c). According to the spectrum, these particles are mainly composed of carbon (C), followed by silicon (Si), and two comparatively weaker signals of oxygen (O) and sulfur (S). This composition is characteristic of both soot and TB particles.
Figure 3 shows the SEM micrograph of the TB—soot aggregate. These types of particles were very numerous on the TEM grids. The intricate arrangement observed in the soot—TB system could have been created via a coagulation process that occurred naturally in the atmosphere (Figure 3a). It is worth noting that inter-particle collisions within the MOUDI stage cannot be completely discarded during the sampling process. To prevent collisions and avoid saturation of the TEM grids, the sampling times were programmed for 15 min. Figure 3b also shows a magnification of the TB, where its almost spherical shape is observed. The elemental composition mapping reveals that the system is only composed of carbon, oxygen, and a low percentage of silicon (Figure 3c,d).

3.2. Fractal Distribution Curves

Figure 4 shows the fractal distribution curves (FDC) of particles collected in the atmosphere of MC during spring and winter. According to the morphological model employed in this study, the fractal dimension values range from 1.00 to 1.40. Round-shaped particles tend to have DF values of around 1.00, while those with irregular shapes tend to have DF values that are close to 1.40. The FDC for the particles collected in the spring shows two modes: one at DF = 1.12 and the other at DF = 1.26. It seems that the first mode, with the high counts, corresponds to rounded-shaped particles, which might be associated with aged aerosols. On the other hand, the second mode (DF = 1.26), with a lower count value, represents particles with more complex shapes. These particles are most likely fresh emissions. The FDC for the particles collected during the winter showed two modes located at different values of the fractal scale. The first mode, at DF = 1.05, suggests a high presence of aged particles, while the second mode, around DF = 1.19—which is almost in the middle of the scale—reveals the presence of moderately irregular particles. These results suggest that the aging of aerosols is more likely to occur during winter due to favorable meteorological conditions. On the other hand, during spring, the FDCs observed a trend towards more irregular aerosol shapes, which could be attributed to the continuous pollutant emissions from forest fires. These emissions can lead to the formation of new particles that contribute to a high presence of soot and TB particles.

3.3. Aerosol Optical Parameters

This study analyzed the seasonal patterns of AE, PW, and AOD in MC during 2022 and 2023. The data were collected through 903 daily observations over two years. Figure 5 displays the time series of AE, PW, and AOD, while Figure 6 shows their monthly averages. The behavior of the AE, PW, and AOD parameters over the studied period can be observed through their respective time series. The AE, as shown in Figure 5a, is a parameter that characterizes the size distribution of atmospheric particles based on their spectral dependence on optical extinction. The AE value ranges from 0.8 to 1.9, with a mean value of 1.41. This variation in the AE value demonstrates the existence of both coarse and fine particles, the latter being the dominant type. Higher values of the AE (~1.49) measured during the spring months (March–May) indicate the dominance of fine fine-mode aerosols, which typically include particles like sulfates, nitrates, and organic matter, which are often found in higher concentrations in the atmosphere of the MC basin [30,31] The AE value (1.41) for winter was slightly lower than that obtained for the spring season. This result indicates that there is no substantial change in the particle size distribution between the winter and spring seasons despite the significant variation in weather conditions. The lowest AE value (1.37) was registered during the rainy season. The wet deposition processes during these months are highly favorable for capturing and removing aerosol particles from the atmosphere, which significantly impacts the AE value. The PW measurements in Figure 5b correspond to the total water vapor column in the atmosphere. The PW time series shows a cyclic variation, with high values registered between June and September. August has the highest PW values, with a maximum value of 1.7 cm. On the contrary, the spring and winter seasons present the lowest values of PW, with a mean of 1.0 cm.
In the case of the AOD (Figure 5c), the results show that there is a significant monthly variation. October presented the highest mean AOD value of 0.42, followed by May with a mean of 0.39. However, it should be noted that the AOD values for the rainy months of July and August were 0.36 and 0.35, respectively. These values could have been affected by the presence of clouds during these months. It is important to note that photometric measurements can be susceptible to errors during the rainy season due to the presence of cloudy days. Carabali et al. (2017) indicate that the presence of cirrus clouds can affect the accuracy of AOD measurements, resulting in an overestimation during sun photometer measurements [20]. This phenomenon is known as “cirrus contamination” and has been extensively investigated [15,32]. The results obtained in the present work are comparable with those obtained by Carabali et al. (2017), who reported a climatological study of aerosol microphysical properties for the period 1999–2014.

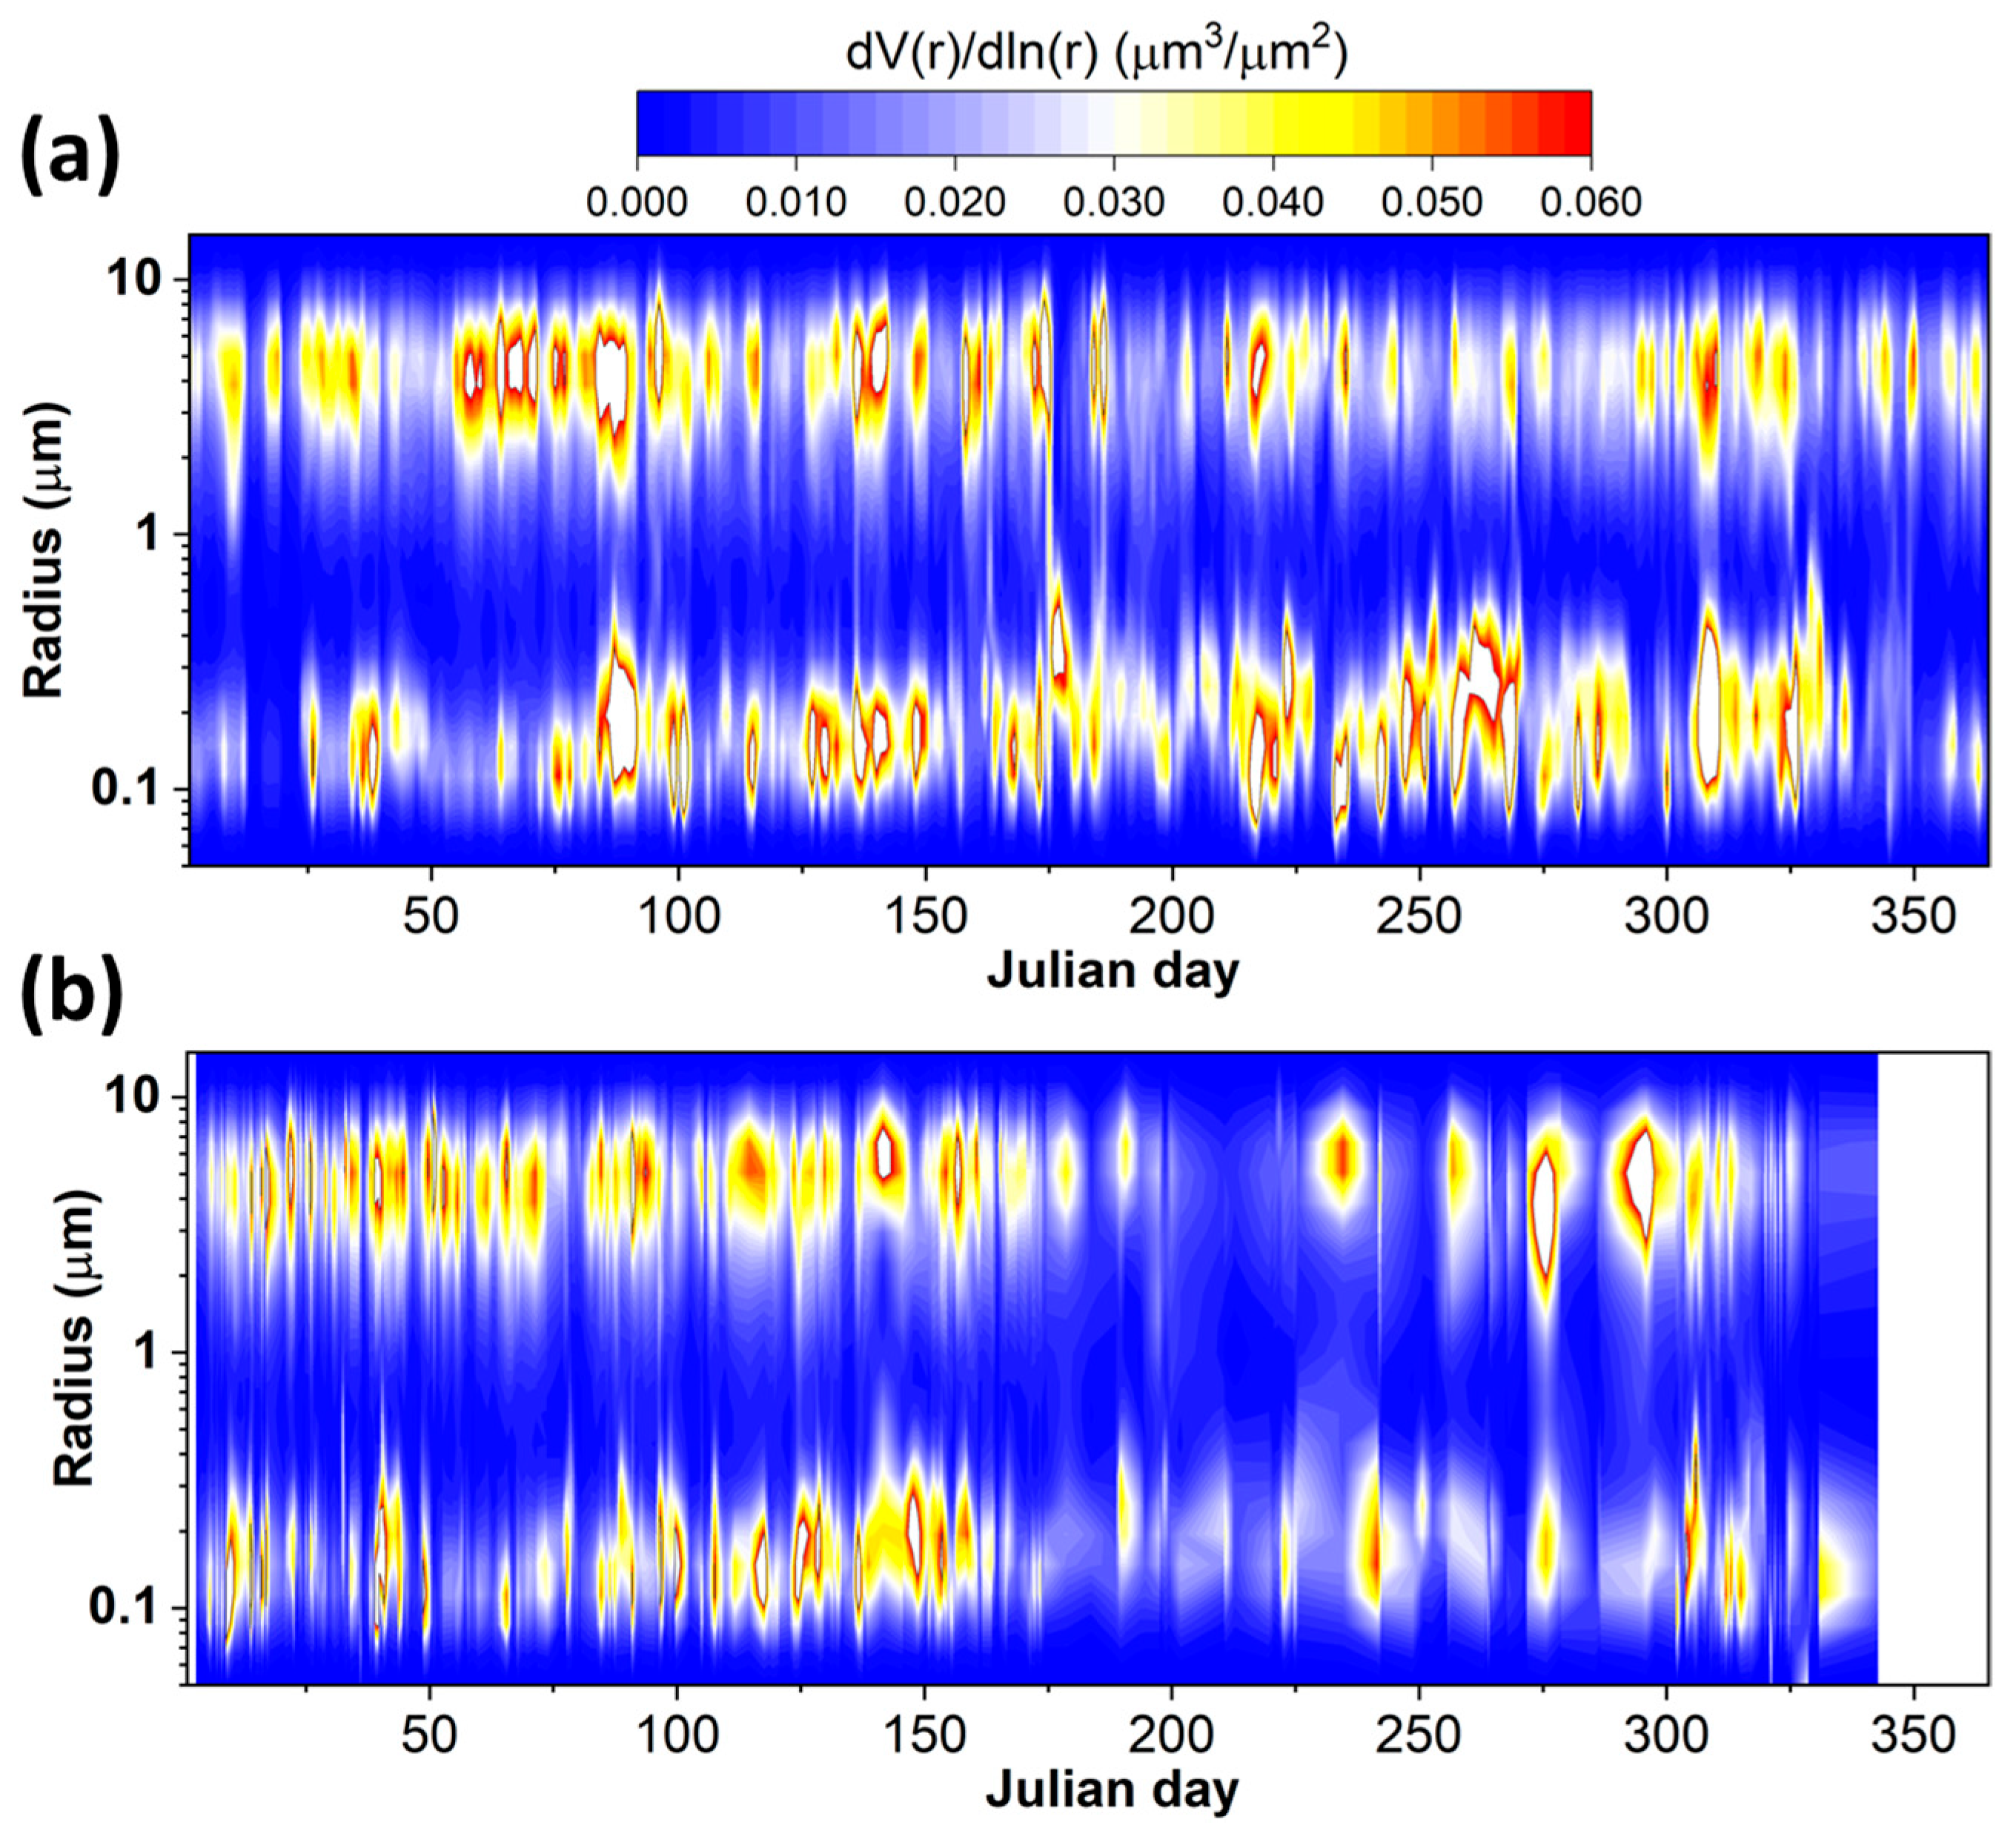
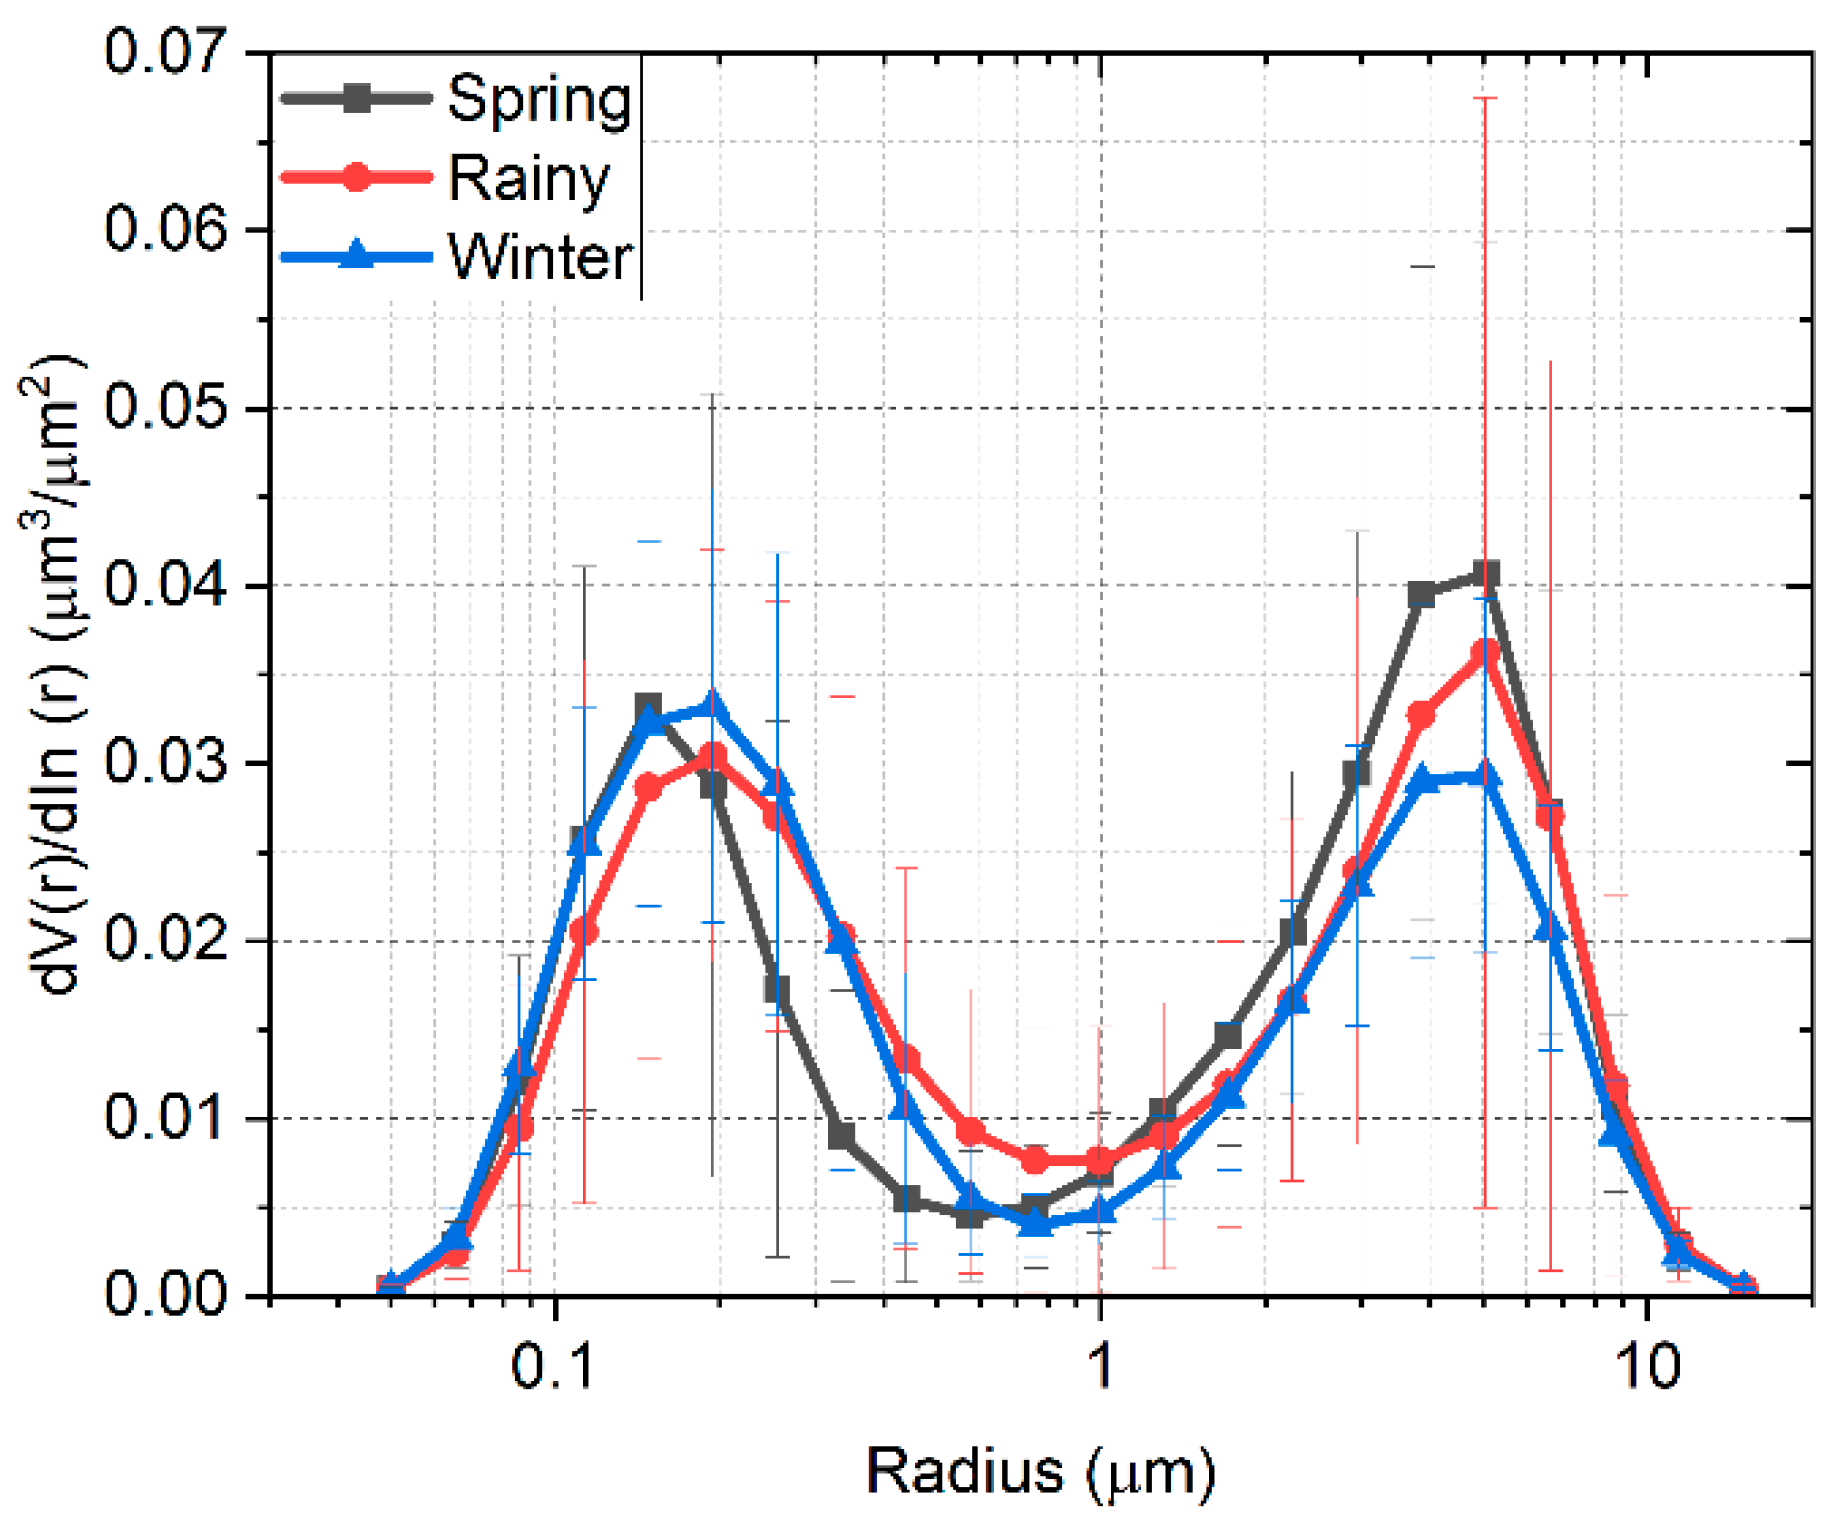
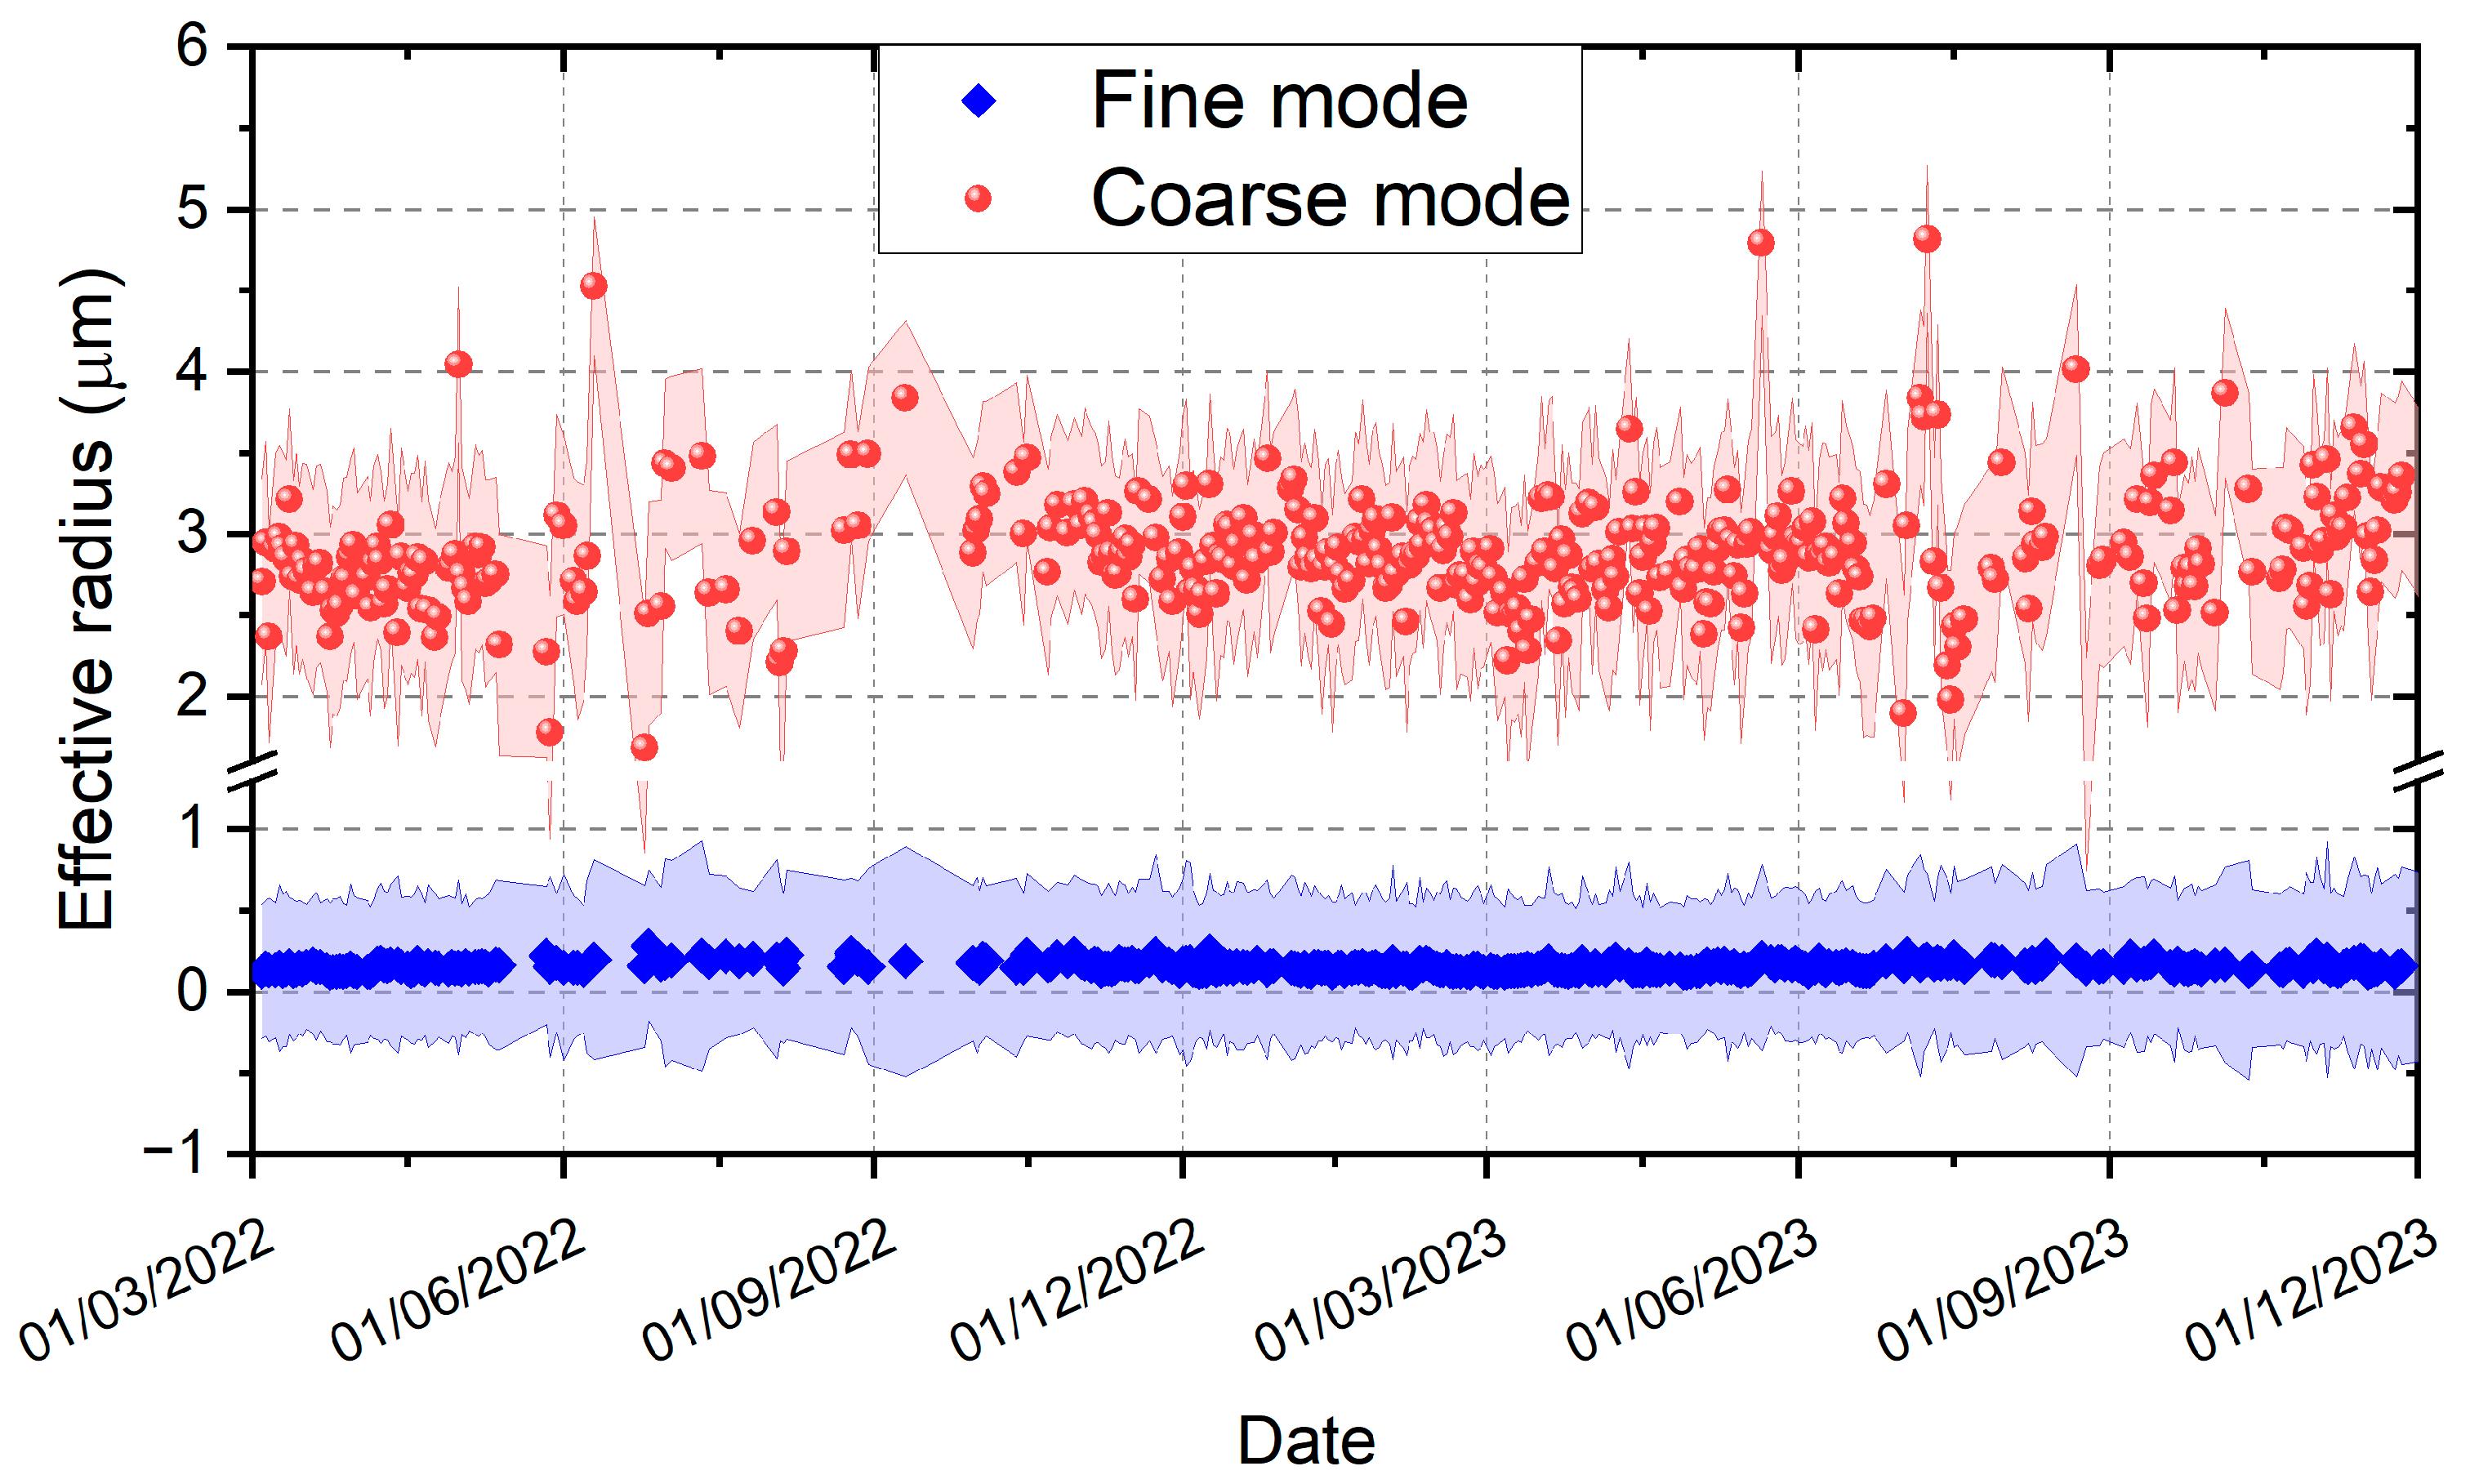
3.4. Aerosol Size Distribution

The time series of the aerosol size distribution (ASD) obtained from sun photometric measurements at the MC AERONET site during the study period is presented in Figure 7. The ASDs were derived from daily measurements, and a total of 772 observations were considered for the analysis. The ASD provides important information about the aerosol particle sizes in the entire atmospheric column. By analyzing the shape of the distribution, it is possible to identify the types of aerosols present (fine and coarse particles), their size ranges, and how these distributions change over time. The colormap used to plot the distributions has “x” and “y” coordinates for Julian days and the size, while “z” indicates the volume of each mode (fine and coarse) in the distribution. The figures show that the ASD is bimodal, with one mode for fine particles with a mean size of around 0.18 μm and another for coarse particles of around 5.05 μm. The contour maps show that both fine and coarse particle modes are present throughout the year, with a significant variation in the volumetric concentrations that may be seasonally dependent. From Figure 8, it should be noted that although the ASD curves show a predominance of coarse particles, there are certain periods of the year, such as winter, when fine particles show a dominant presence (Figure 8).
In MC, coarse particles originate mainly from dust resuspension due to soil aridity and strong winds. These results contrast those reported by Carabali et al. (2017), where the predominance of fine particles is reported for the period 1999–2014 [20]. This slight reduction in the volume of fine aerosol in the atmospheric column could be attributed to the mitigation and control measures implemented by the environmental authorities in the past, as well as the partial lockdowns due to the pandemic situation at the beginning of 2022 [33,34].
Figure 8 shows the seasonal aerosol size distributions (ASD) for the studied period. The curves show a bimodal distribution where the coarse mode volume (Vc) predominates, except for the winter, where the fine particle volume (Vf) is slightly higher. The seasonal particle volumes in the fine mode are almost comparable, and only in the rainy season was the Vf slightly lower. Precipitation during the rainy season contributes to a decrease in the amount of particulate matter in the air. The coarse mode particle volume (Vc) shows significant seasonal variations. Spring is the season with the highest particle volume, followed by the rainy season. The lowest values of Vc were registered in winter. The high values during spring are due to soil resuspension and possibly to the formation and coagulation processes that favor an increase in aerosol size.
Figure 9 shows the average hourly time series of effective fine radius (Reff) and effective coarse radius (Refc) for the studied period. The time series trends show that Reff remains stable throughout the year, maintaining a mean value of 0.16 μm. Refc, on the other hand, shows considerable variability throughout the year, with a mean value of 2.90 μm. The constant radius value in the fine mode could be an indicator of the type of sources and their particulate emission dynamics. The urban area’s high population density results in significant anthropogenic activity, which could explain the steady emission rate throughout the year. The Refc values display a significant degree of variability, which is strongly influenced by meteorological changes. These Refc fluctuations may be linked, to some extent, to the levels of precipitable water in the atmosphere. The results obtained are consistent with the findings of Saha and Moorthy (2004), who observed that changes in aerosol size are influenced by high relative humidity conditions [35].

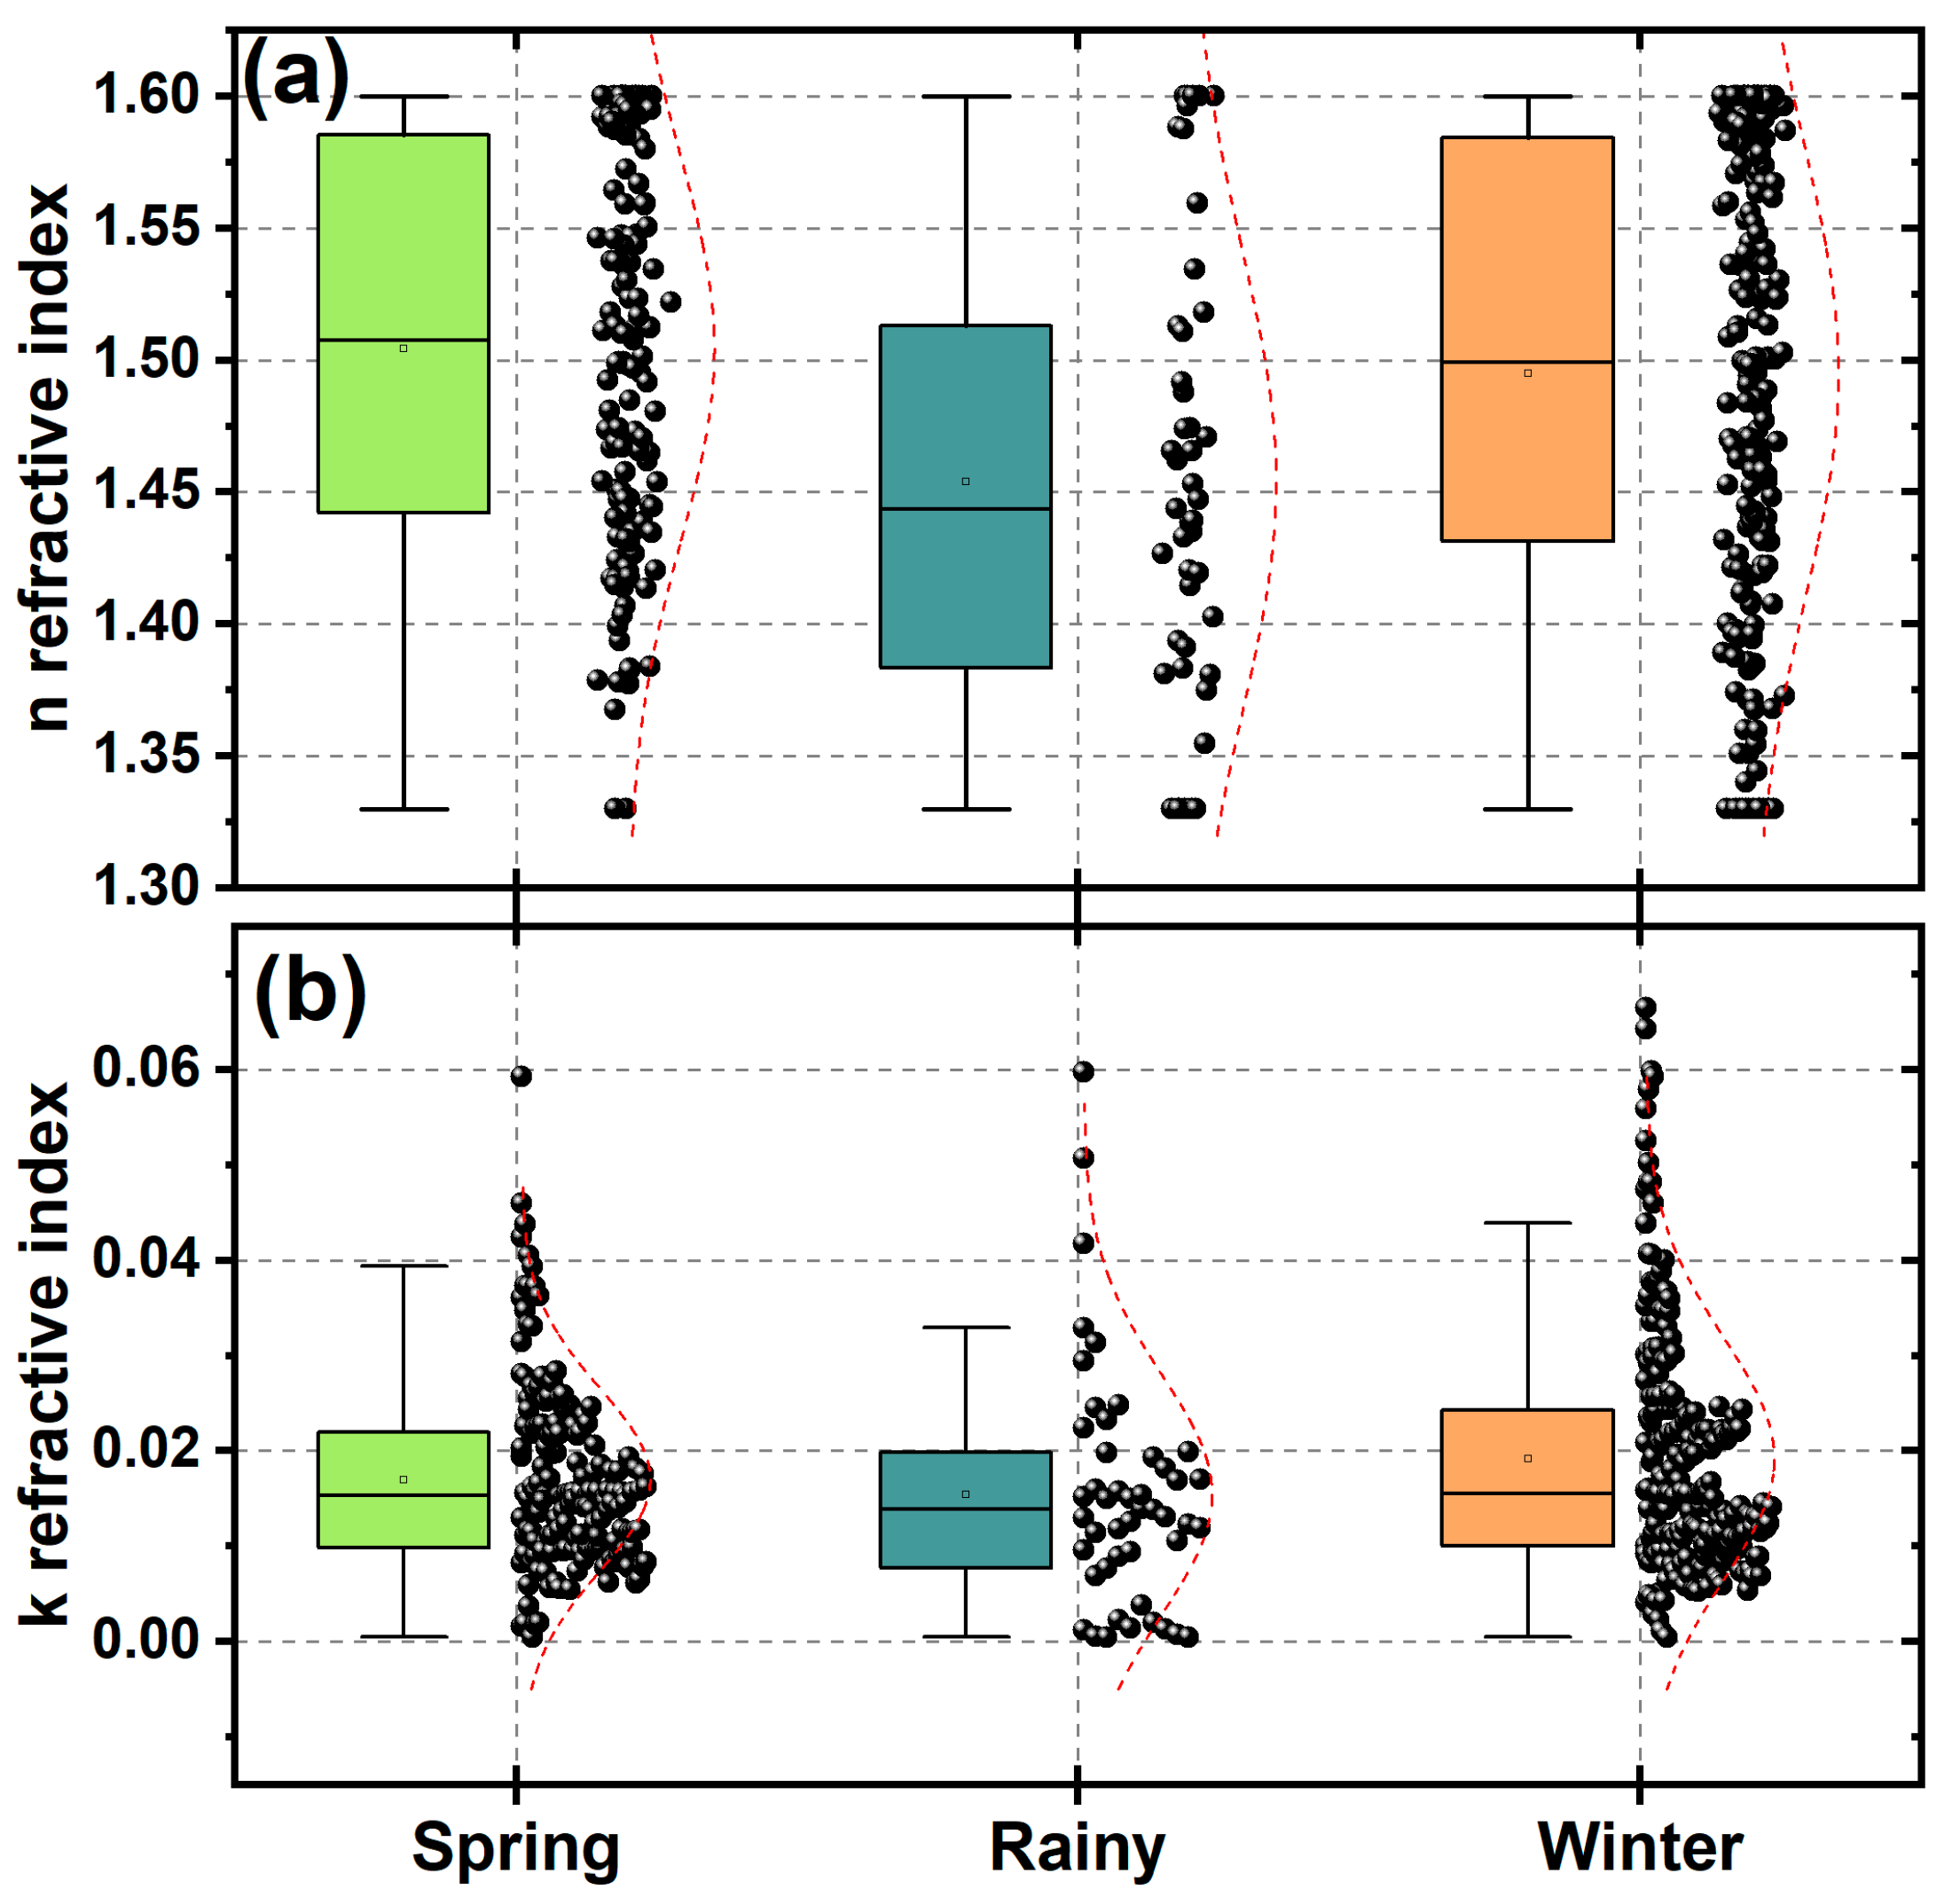
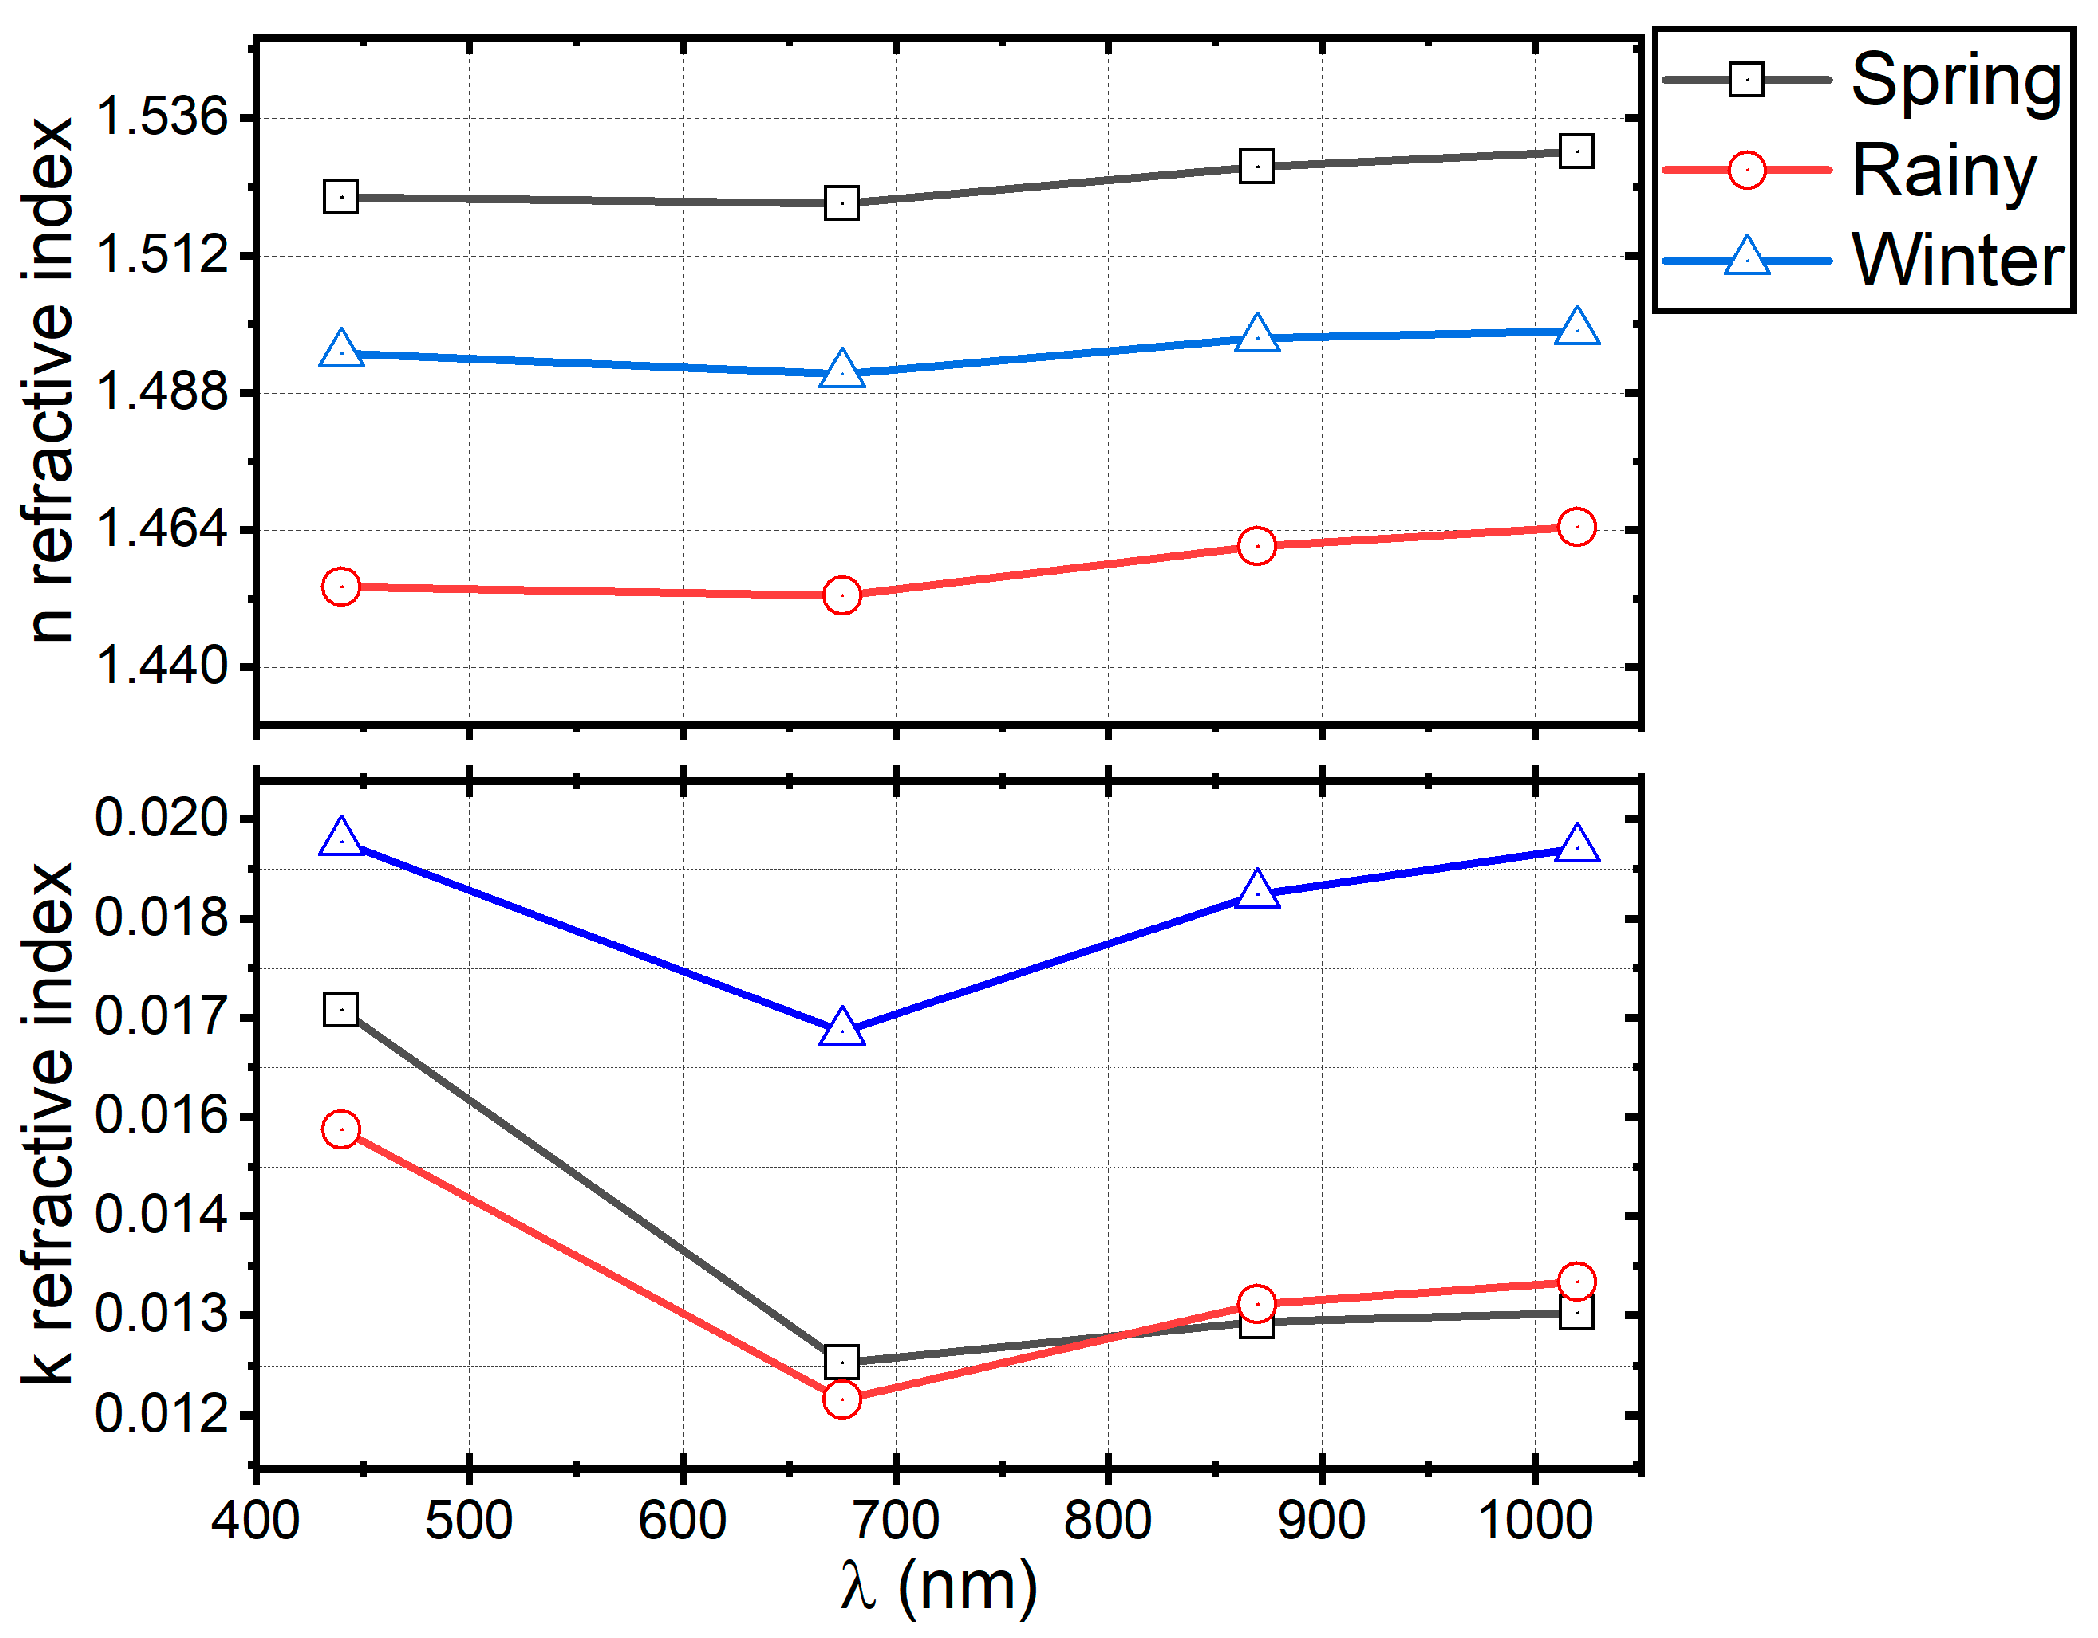
3.5. Complex Refractive Index

The optical properties of aerosols are influenced by their physical and chemical characteristics. Electromagnetic theory suggests that the CRI is a crucial physical parameter that determines how particles scatter and absorb radiation. The CRI is composed of two parts: real (n) and imaginary (k), which are values depending on the specific composition of the aerosols (e.g., dust, soot, water droplets, or various chemical compounds). Figure 10 presents the statistical analysis of the CRI measured during different seasons of the studied period. The box plots in the figure were constructed with daily observations of n and k parts of the CRI retrieved from the AERONET measurements. In addition, distribution curves are plotted next to the box plots, visually showing the dispersion of the data. The n values tend to exhibit a wider range of variations, while the k values are much more consistent. Figure 11 shows the wavelength dependence of the n and k parts of the CRI measured in the different seasons of the year. The data in Figure 11 show that the CRI has a spectral dependence, in which values for the n part tend to increase with the wavelength. It was observed that the rainy season had the lowest n values, while the highest was registered during the spring, followed by those values measured in the winter. On the other hand, the imaginary part of the complex refractive index shows a different trend, characterized by a stronger wavelength dependence, with minimum values measured at 675 nm. The highest values were obtained for the winter season, followed by those in spring. The lowest k values were measured in the rainy season, except for the values at 900 and 100 nm, which are slightly higher than those in winter.
Table 2 shows the CRI values and other optical parameters of the atmospheric aerosols (AOD and AE) measured at different locations worldwide. For comparative purposes, the mean values found in this work are also listed. The values of seasonal n reported in this study are higher than those found in other urban areas, except for Paris (France), whose value (n~1.52) was measured in a different wavelength (532 nm), and Sahara (Africa), which has the highest value (n~1.53). Beijing and Kanpur show slightly lower n values than those observed for MC. One possible reason for this could be the variety of sources emitting within MC’s urban area, which include mineral dust resuspended from soils by wind action, mainly in the spring [36]. In addition, there remains significant industrial activity within MC’s air basin, which favors the emission of inorganic matter that enhances the scattering properties of aerosols [37]. The main reason behind the high value of n that has been reported for the atmospheric particles in the Sahara is due to the dispersion characteristics of the prevailing type of aerosols in the region, whose particles are primarily mineral dust from the desert [38].
The results of this study show that the value of k is higher than those reported for the different cities (Table 2). The result obtained for MC is only comparable to that reported for Paris, although the measurement in that city was taken at 532 nm. Furthermore, the seasonal maximum value of 0.019 (440 nm) during winter in MC suggests that the k-value could potentially be influenced by weather conditions at that time of the year. During winter, the height of the boundary layer is reduced due to low temperatures, which leads to an increase in the concentration of aerosols in the vertical column of the atmosphere. These favorable conditions for aerosol mixing have a significant impact on the microphysical properties of the particles. In winter, for instance, the size distribution showed a bimodal curve dominated mainly by fine particles. Although, by definition, the CRI is an intrinsic property of the particles that do not depend directly on their concentration, its value can be influenced by the particle diameter, the degree of agglomeration of the particle, and its size distribution in the atmosphere. The high k-value found in this analysis is a clear indication of the strong absorbing nature of aerosols in MC, which poses a significant risk to the radiative balance of the urban area. In highly populated urban areas like the MC basin, the value of k is primarily attributed to the existence of soot and organic matter in the aerosol particles—as well as minerals and other compounds present in the aerosol, which contribute to a lesser extent.

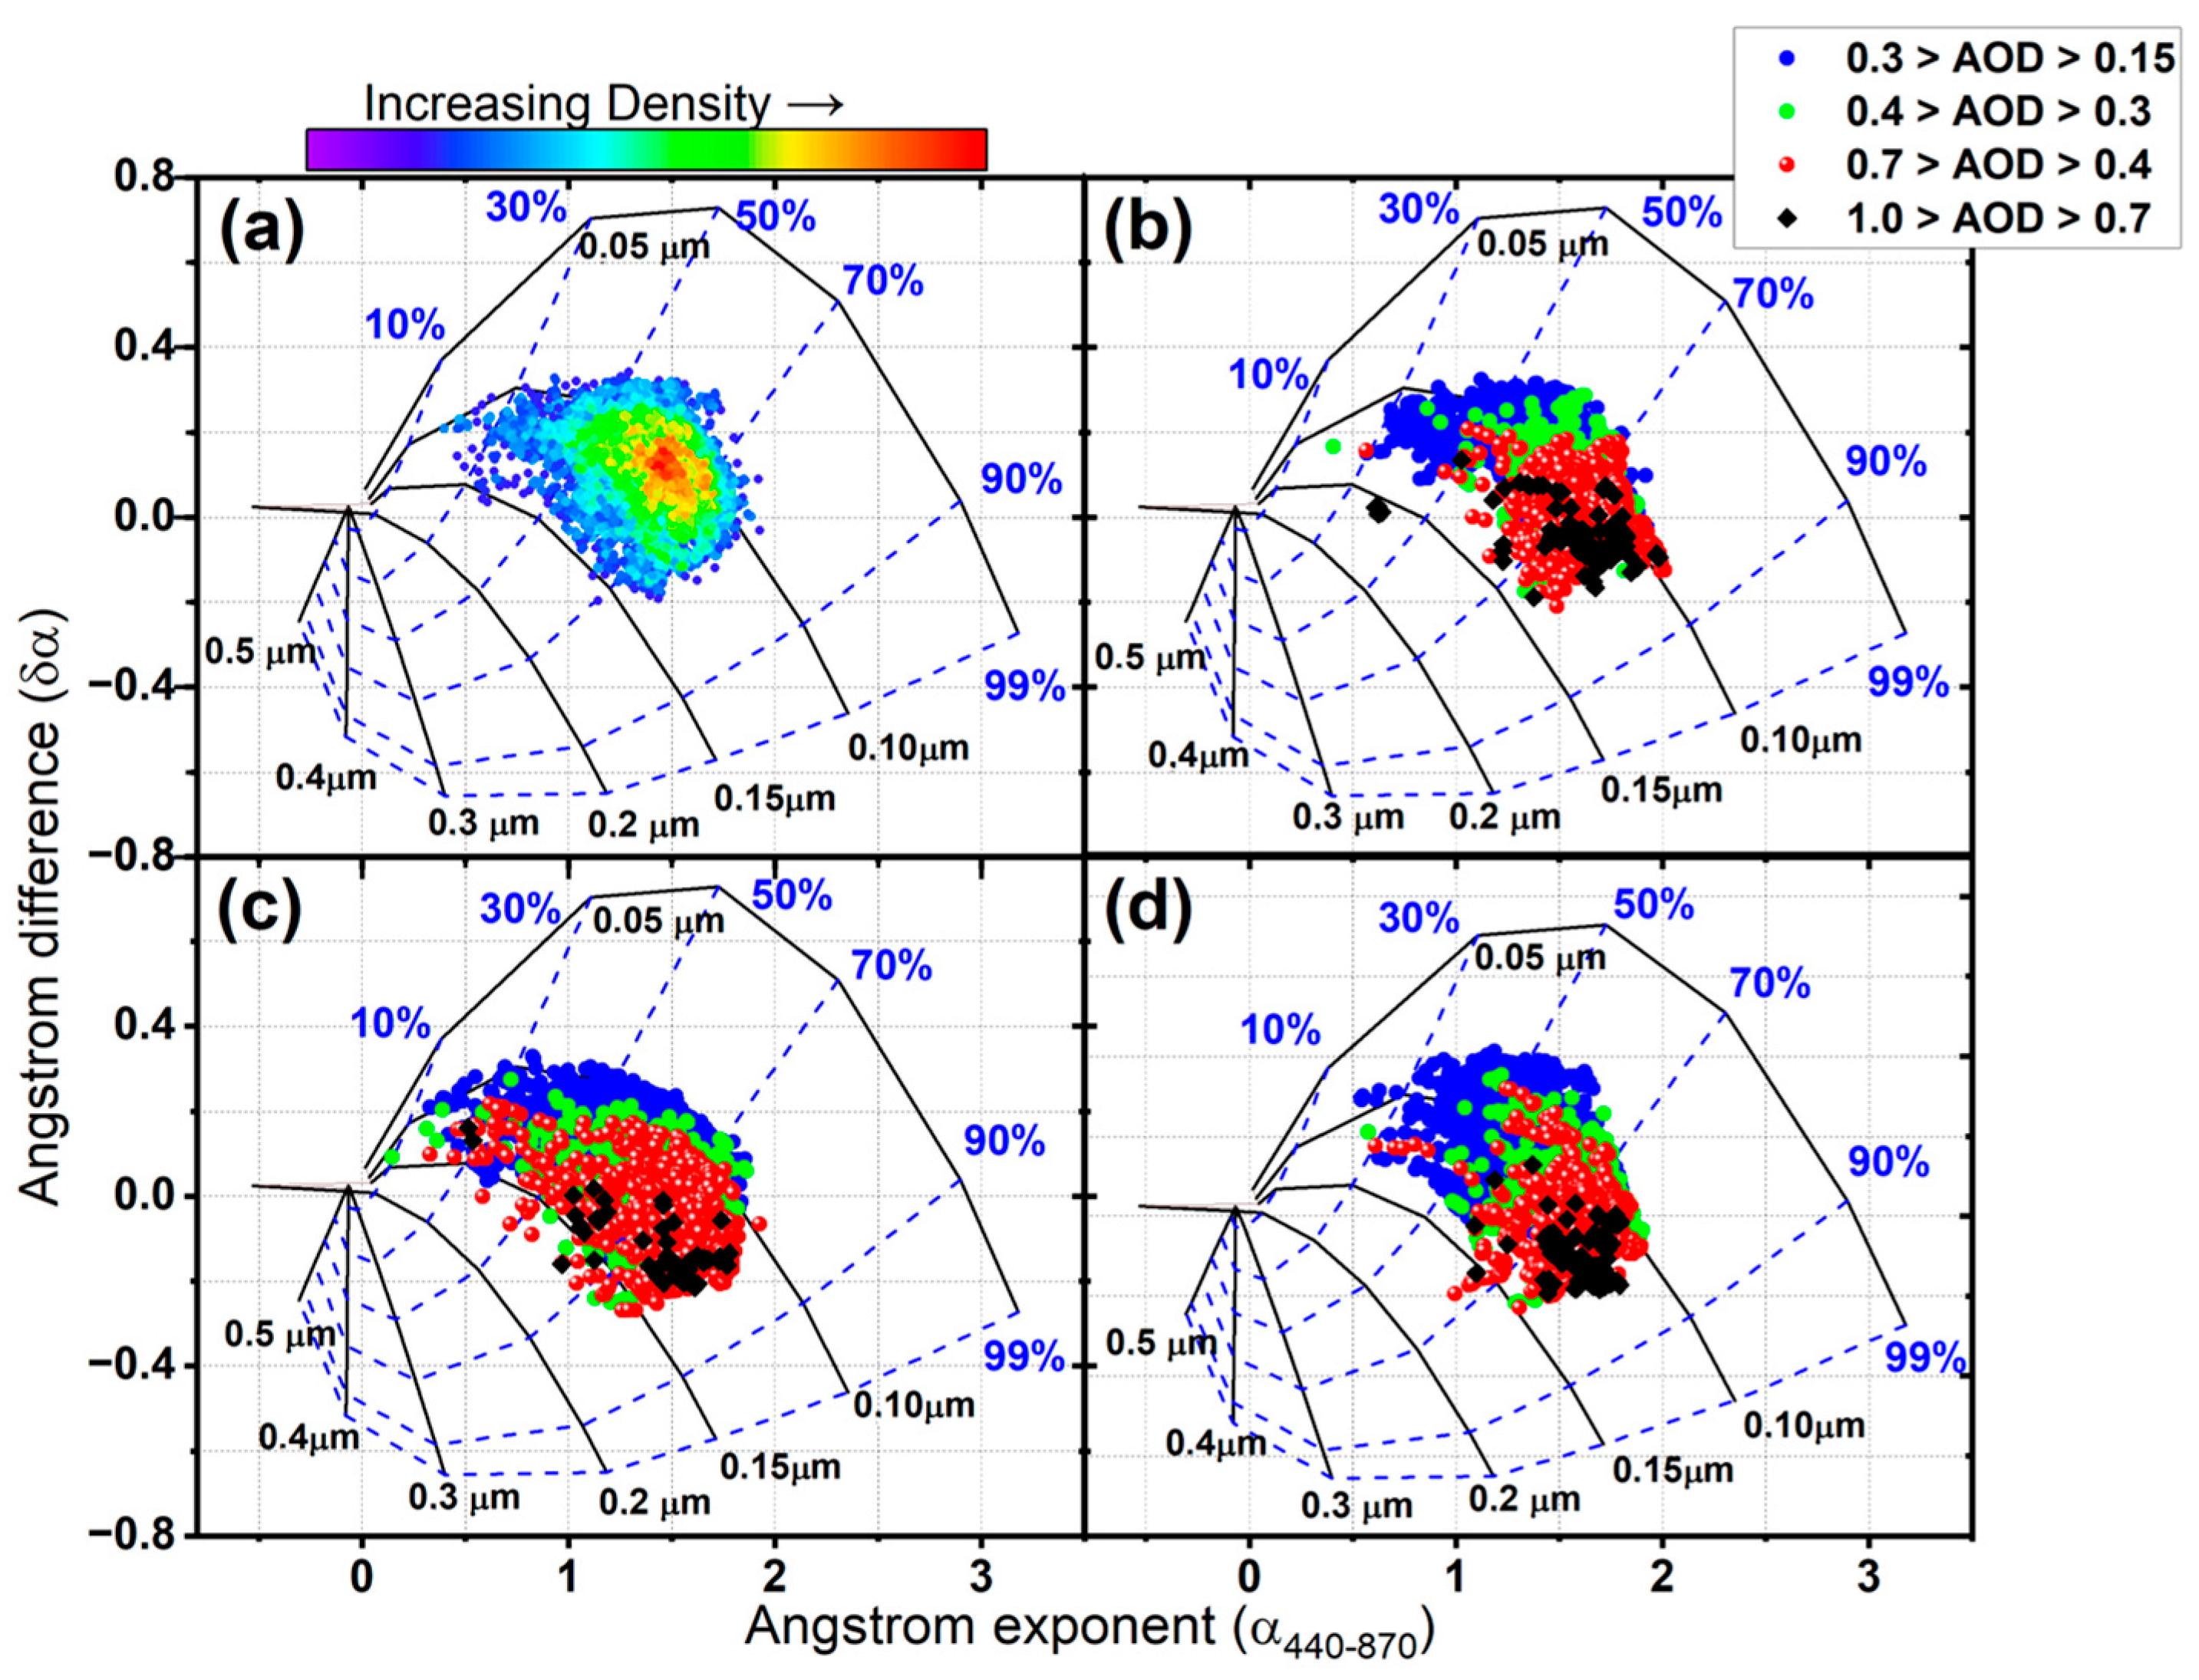
3.6. Aerosol Classification: Identification of Major Aerosol Types

The graphical method proposed by Gobbi et al. (2007) was used to classify the aerosols measured in MC during the studied period [29]. The method visually examines the relation between AE and dAE to identify the fine aerosol contribution to the AOD, which, in turn, provides the respective particle size. This information can be very useful in various applications. For instance, it can be used to track mixtures of anthropogenic aerosol with dust, discern aerosol growth from cloud contamination, and observe aerosol humidification. Additionally, negative values of the difference (dAE) in the scheme indicate the predominance of fine-mode aerosols, while positive differences demonstrate a bimodal distribution of particles [29].
The data presented in Figure 12 are derived from a comprehensive analysis of 3500 direct sun photometer observations collected at the AERONET site in MC between 2022 and 2023. By using a color-coded system, the plot clearly shows the contribution of fine particles to AOD, with the blue dots indicating AOD values ranging from 0.15 to 0.3, green dots indicating AOD values ranging from 0.3 to 0.4, red dots indicating AOD values ranging from 0.4 to 0.7, and black dots indicating AOD values ranging from 0.7 to 1.0. Additionally, the plot presents continuous black lines depicting a fixed fine-mode size (Rf), while the dashed blue lines indicate the percentage contribution of particles to the AOD.
Figure 12a depicts all the data used in the analysis. It is interesting to note that the region with the highest density of data is situated at AE~1.5 with positive values of the difference at dAE~0.12. This observation suggests that the most significant contribution to the AOD in Mexico City (which is less than 70%) is due to fine particles with an approximately fixed radius (Rf) of 0.10 μm. The positive region of dAE indicates that the aerosol size distribution tends to be bimodal. Based on the schematic in Figure 1a, it can also be inferred that the coarse mode particles contribute to approximately 30% of the AOD.
Figure 12b–d represents the aerosol classification for the spring, rain, and winter seasons, respectively. The data shown in the diagrams are significantly different in terms of the number and distribution. However, it is important to note that there are several common features present in all of the diagrams. One of the most significant features is that almost 80% of the particles in each scheme fall within the range of radii between 0.10 and 0.15 μm. Based on the analysis, it can be inferred that there is no significant temporal variation in the mean particle size. This observation is in line with the finding for the Reff, which had a nearly constant value of 0.16 throughout the analysis period. It is worth mentioning that this consistency in the mean particle size and Reff values indicates a steady particle size distribution.
Another interesting fact is that in Mexico City’s atmosphere, there are aerosols that generate AOD values of < 0.7 throughout the year, which is considered significantly high. These high extinctions indicate the absorbing nature of the aerosol and can be associated with hygroscopic growth and/or coagulation by aging of the aerosols in a fine mode [29]. However, it is important to note that some data with extinctions between 0.1 and 0.7 in the rainy season scheme are probably caused by cloud contamination effects. Carabali et al. (2017) found that there is a positive correlation between water vapor and high AOD values in the rainy season in MC [20].

4. Conclusions

The revelation of TB being attached to complex soot structures is one of the most interesting results of this work. These structures, which are referred to here as “TB-soot aggregate”, consist of voluminous carbonaceous agglomerates with intricate structures. The amount and type of emission sources, such as old diesel-burning engines and biomass burning, which are present in the MC area, along with specific meteorological conditions within the MC basin, may create a favorable environment for the TB—soot aggregate formation in the atmosphere. Despite containing lower levels of other chemical elements, these particles are predominantly composed of carbon, which evidences its absorptive characteristics.
Upon calculating the particle fractal dimension, some slight seasonal variations in the morphological behavior of the particles were observed. These variations could be attributed to the influence of meteorological conditions during different seasons. Furthermore, it was noted that during the winter season, the particles tend to undergo a more pronounced aging process. This observation may be related to an increase in particle concentration due to the low mixing layer height. During the spring season, the number of aerosol particles with irregular shapes is notably higher. This increase can be attributed to the continuous emissions of aerosol particles caused by forest fires. Furthermore, the fractal distribution curve for spring indicates that there is a significant presence of aged aerosol particles. These aged particles are more likely to form under the influence of high solar radiation intensity, which is prevalent during the spring months.
In this study, columnar optical characteristics of aerosol in MC from 2022 to 2023 were analyzed using sun photometer observations. It found that the global mean AOD (500 nm) is 0.34, which is typically observed in urban areas. The mean AE value of approximately 1.41 indicates the presence of two particle modes (fine and coarse) that remain relatively constant throughout the analyzed period. The coarse mode dominates the size distribution, except during the winter season. Further analysis reveals that the specific radii of the fine and coarse modes are 0.16 and 2.90 μm, respectively, with the latter exhibiting significant variations throughout the year. The average CRI value for the period studied was 1.49-0.017i (400 nm). For MC, the CRI presented a seasonal variation, with the highest values in winter and spring. The low values observed in the rainy season are due to a reduction in contamination.
Finally, according to the microphysical observations of aerosol in Mexico City, it can be stated that the particles tend to be significantly absorbing. This can be evidenced by the LRC, whose value (1.49-0.017i) is higher than those measured in other urban areas. In addition, it was found that fine particles with radii in the range of 0.10–0.15 μm make the most significant contribution to the AOD in Mexico City, representing almost 80% of it.

Author Contributions

Conceptualization, G.C.; methodology, R.N.L.-A., H.E, M.V.-B. and R.B.-A.; software, D.R.-R. and A.G.-C.; validation, G.C., F.J.-S. and M.V.-B.; formal analysis, G.C.; investigation, G.C.; resources, H.E.; data curation, R.B.-A.; writing—original draft preparation, G.C.; writing—review and editing, G.C.; project administration, G.C.; funding acquisition, G.C. All authors have read and agreed to the published version of the manuscript.

Funding

This research was funded by UNAM-DGAPA PAPIIT, grant IN113322 (Mexico), and partial support was provided by Instituto de Geofísica (UNAM), grant R104 (internal projects).

Institutional Review Board Statement

Not applicable.

Informed Consent Statement

Not applicable.

Data Availability Statement

The aerosol microphysical parameters were retrieved from the AERONET site in MC. The data are available at the following website: https://aeronet.gsfc.nasa.gov/ (accessed on 20 July 2023). For information about the morphological analysis code, please contact the first author.

Acknowledgments

The authors thank B. Holben and the AERONET staff for their sun photometer calibration and support. Special thanks to the CML personnel at UNAM for their support during the operation of the TEM and SEM microscopes. Also, special thanks to the chemist Maria Isabel Saavedra for her support with the filters for the aerosol sampling.

Conflicts of Interest

The authors declare no conflicts of interest.

References

  1. Bellouin, N.; Quaas, J.; Gryspeerdt, E.; Kinne, S.; Stier, P.; Watson-Parris, D.; Boucher, O.; Carslaw, K.S.; Christensen, M.; Daniau, A.L.; et al. Bounding Global Aerosol Radiative Forcing of Climate Change. Remote Sens. 2020, 58, 637. [Google Scholar] [CrossRef] [PubMed]
  2. Zhang, K.; Zhang, W.; Wan, H.; Rasch, P.J.; Ghan, S.J.; Easter, R.C.; Shi, X.; Wang, Y.; Wang, H.; Ma, P.L.; et al. Effective Radiative Forcing of Anthropogenic Aerosols in E3SM Version 1: Historical Changes, Causality, Decomposition, and Parameterization Sensitivities. Atmos. Chem. Phys. 2022, 22, 9129–9160. [Google Scholar] [CrossRef]
  3. Lohmann, U.; Feichter, J. Global Indirect Aerosol Effects: A Review. Atmos. Chem. Phys. 2005, 5, 715–737. [Google Scholar] [CrossRef]
  4. Dubovik, O.; King, M.D. A Flexible Inversion Algorithm for Retrieval of Aerosol Optical Properties from Sun and Sky Radiance Measurements. J. Geophys. Res. Atmos. 2000, 105, 20673–20696. [Google Scholar] [CrossRef]
  5. Nakayama, T.; Zhao, W.; Zhang, W. Measurements of Aerosol Optical Properties Using Spectroscopic Techniques. In Advances in Spectroscopic Monitoring of the Atmosphere; Elsevier: Amsterdam, The Netherlands, 2021; pp. 345–412. [Google Scholar] [CrossRef]
  6. Brasil, A.M.; Farias, T.L.; Carvalho, M.G. A Recipe for Image Characterization of Fractal-like Aggregates. J. Aerosol Sci. 1999, 30, 1113–1125. [Google Scholar] [CrossRef]
  7. Oh, C.; Sorensen, C.M. The Effect of Overlap between Monomers on the Determination of Fractal Cluster Morphology. J. Colloid Interface Sci. 1997, 193, 121–130. [Google Scholar] [CrossRef] [PubMed]
  8. Xiong, C.; Friedlander, S.K. Morphological Properties of Atmospheric Aerosol Aggregates. Proc. Natl. Acad. Sci. USA 2001, 98, 5825–5829. [Google Scholar] [CrossRef]
  9. Pang, Y.; Wang, Y.; Wang, Z.; Zhang, Y.; Liu, L.; Kong, S.; Liu, F.; Shi, Z.; Li, W. Quantifying the Fractal Dimension and Morphology of Individual Atmospheric Soot Aggregates. J. Geophys. Res. Atmos. 2022, 127. [Google Scholar] [CrossRef]
  10. Dye, A.L.; Rhead, M.M.; Trier, C.J. The Quantitative Morphology of Roadside and Background Urban Aerosol in Plymouth, UK. Atmos. Environ. 2000, 34, 1617–1624. [Google Scholar] [CrossRef]
  11. DeCarlo, P.F.; Slowik, J.G.; Worsnop, D.R.; Davidovits, P.; Jimenez, J.L. Particle Morphology and Density Characterization by Combined Mobility and Aerodynamic Diameter Measurements. Part 1: Theory. Aerosol Sci. Technol. 2004, 38, 1185–1205. [Google Scholar] [CrossRef]
  12. Carabali, G.; Castro, T.; De La Cruz, W.; Peralta, O.; Varela, A.; Amelines, O.; Rivera, M.; Ruiz-Suarez, G.; Torres-Jardón, R.; Martines-Quiroz, E.; et al. Morphological and Chemical Characterization of Soot Emitted during Flaming Combustion Stage of Native-Wood Species Used for Cooking Process in Western Mexico. J. Aerosol Sci. 2016, 95, 1–14. [Google Scholar] [CrossRef]
  13. Carabali, G.; Mamani-Paco, R.; Castro, T.; Peralta, O.; Herrera, E.; Trujillo, B. Optical Properties, Morphology and Elemental Composition of Atmospheric Particles at T1 Supersite on MILAGRO Campaign. Atmos. Chem. Phys. 2012, 12, 2747–2755. [Google Scholar] [CrossRef]
  14. Zhang, Y.; Li, Z.; Zhang, Y.; Li, D.; Qie, L.; Che, H.; Xu, H. Estimation of Aerosol Complex Refractive Indices for Both Fine and Coarse Modes Simultaneously Based on AERONET Remote Sensing Products. Atmos. Meas. Tech. 2017, 10, 3203–3213. [Google Scholar] [CrossRef]
  15. Smirnov, A.; Holben, B.N.; Eck, T.F.; Dubovik, O.; Slutsker, I. Cloud-Screening and Quality Control Algorithms for the AERONET Database. Remote Sens. Environ. 2000, 73, 337–349. [Google Scholar] [CrossRef]
  16. Dubovik, O.; Holben, B.; Eck, T.F.; Smirnov, A.; Kaufman, Y.J.; King, M.D.; Tanré, D.; Slutsker, I. Variability of Absorption and Optical Properties of Key Aerosol Types Observed in Worldwide Locations. J. Atmos. Sci. 2002, 59, 590–608. [Google Scholar] [CrossRef]
  17. Moffet, R.C.; Prather, K.A. In-Situ Measurements of the Mixing State and Optical Properties of Soot with Implications for Radiative Forcing Estimates. Proc. Natl. Acad. Sci. USA 2009, 106, 11872–11877. [Google Scholar] [CrossRef]
  18. Holben, B.N.; Eck, T.F.; Slutsker, I.; Tanré, D.; Buis, J.P.; Setzer, A.; Vermote, E.; Reagan, J.A.; Kaufman, Y.J.; Nakajima, T.; et al. AERONET—A Federated Instrument Network and Data Archive for Aerosol Characterization. Remote Sens. Environ. 1998, 66, 1–16. [Google Scholar] [CrossRef]
  19. Holben, B.N.; Tanré, D.; Smirnov, A.; Eck, T.F.; Slutsker, I.; Abuhassan, N.; Newcomb, W.W.; Schafer, J.S.; Chatenet, B.; Lavenu, F.; et al. An Emerging Ground-Based Aerosol Climatology: Aerosol Optical Depth from AERONET. J. Geophys. Res. Atmos. 2001, 106, 12067–12097. [Google Scholar] [CrossRef]
  20. Carabali, G.; Estévez, H.R.; Valdés-Barrón, M.; Bonifaz-Alfonzo, R.; Riveros-Rosas, D.; Velasco-Herrera, V.M.; Vázquez-Gálvez, F.A. Aerosol Climatology over the Mexico City Basin: Characterization of Optical Properties. Atmos. Res. 2017, 194, 190–201. [Google Scholar] [CrossRef]
  21. Mora, M.; Braun, R.A.; Shingler, T.; Sorooshian, A. Analysis of Remotely Sensed and Surface Data of Aerosols and Meteorology for the Mexico Megalopolis Area between 2003 and 2015. J. Geophys. Res. Atmos. 2017, 122, 8705–8723. [Google Scholar] [CrossRef]
  22. De Foy, B.; Varela, J.R.; Molina, L.T.; Molina, M.J. Rapid Ventilation of the Mexico City Basin and Regional Fate of the Urban Plume. Atmos. Chem. Phys. 2006, 6, 2321–2335. [Google Scholar] [CrossRef]
  23. Jáuregui, E. The Climate of the Mexico City Air Basin: Its Effects on the Formation and Transport of Pollutants. In Urban Air Pollution and Forests; Fenn, M.E., de Bauer, L.I., Hernández-Tejeda, T., Eds.; Ecological Studies; Springer: New York, NY, USA, 2002; Volume 156, pp. 86–117. [Google Scholar] [CrossRef]
  24. Marple, V.A.; Rubow, K.L.; Behm, S.M. A Microorifice Uniform Deposit Impactor (Moudi): Description, Calibration, and Use. Aerosol Sci. Technol. 1991, 14, 434–436. [Google Scholar] [CrossRef]
  25. Carabali, G.; Villanueva-Macias, J.; Ladino, L.A.; Álvarez-Ospina, H.; Raga, G.B.; Andraca-Ayala, G.; Miranda, J.; Grutter, M.; Silva, M.M.; Riveros-Rosas, D. Characterization of Aerosol Particles during a High Pollution Episode over Mexico City. Sci. Rep. 2021, 11, 22533. [Google Scholar] [CrossRef] [PubMed]
  26. Mandelbrot, B. How Long Is the Coast of Britain? Statistical Self-Similarity and Fractional Dimension. Science 1967, 156, 636–638. [Google Scholar] [CrossRef] [PubMed]
  27. Mamani-Paco, R.M.; Helble, J.J. Particle Size and Time of the Day Influences on the Morphology Distributions of Atmospheric Fine Particles at the Baltimore Supersite. Atmos. Environ. 2007, 41, 8021–8029. [Google Scholar] [CrossRef]
  28. Eck, T.F.; Holben, B.N.; Reid, J.S.; Mukelabai, M.M.; Piketh, S.J.; Torres, O.; Jethva, H.T.; Hyer, E.J.; Ward, D.E.; Dubovik, O.; et al. A Seasonal Trend of Single Scattering Albedo in Southern African Biomass-Burning Particles: Implications for Satellite Products and Estimates of Emissions for the World’s Largest Biomass-Burning Source. J. Geophys. Res. Atmos. 2013, 118, 6414–6432. [Google Scholar] [CrossRef]
  29. Gobbi, G.P.; Kaufman, Y.J.; Koren, I.; Eck, T.F. Classification of Aerosol Properties Derived from AERONET Direct Sun Data. Atmos. Chem. Phys. 2007, 7, 453–458. [Google Scholar] [CrossRef]
  30. Rios, B.; Díaz-Esteban, Y.; Raga, G.B. Smoke Emissions from Biomass Burning in Central Mexico and Their Impact on Air Quality in Mexico City: May 2019 Case Study. Sci. Total Environ. 2023, 904, 166912. [Google Scholar] [CrossRef]
  31. Retama, A.; Ramos-Cerón, M.; Rivera-Hernández, O.; Allen, G.; Velasco, E. Aerosol Optical Properties and Brown Carbon in Mexico City. Environ. Sci. Atmos. 2022, 2, 315–334. [Google Scholar] [CrossRef]
  32. Chew, B.N.; Campbell, J.R.; Reid, J.S.; Giles, D.M.; Welton, E.J.; Salinas, S.V.; Liew, S.C. Tropical Cirrus Cloud Contamination in Sun Photometer Data. Atmos. Environ. 2011, 45, 4041–4058. [Google Scholar] [CrossRef]
  33. Raga, G.B.; Baumgardner, D.; Castro, T.; Martínez-Arroyo, A.; Navarro-González, R. Mexico City Air Quality: A Qualitative Review of Gas and Aerosol Measurements (1960–2000). Atmos. Environ. 2001, 35, 553–562. [Google Scholar] [CrossRef]
  34. Kutralam-Muniasamy, G.; Pérez-Guevara, F.; Roy, P.D.; Elizalde-Martínez, I.; Shruti, V.C. Impacts of the COVID-19 Lockdown on Air Quality and Its Association with Human Mortality Trends in Megapolis Mexico City. Air Qual. Atmos. Health 2021, 14, 553–562. [Google Scholar] [CrossRef] [PubMed]
  35. Saha, A.; Moorthy, K.K. Impact of Precipitation on Aerosol Spectral Optical Depth and Retrieved Size Distributions: A Case Study. J. Appl. Meteorol. 2004, 43, 902–914. [Google Scholar] [CrossRef]
  36. Moffet, R.C.; de Foy, B.; Molina, L.T.; Molina, M.J.; Prather, K.A. Measurement of ambient aerosols in northern Mexico City by single particle mass spectrometry. Atmos. Chem. Phys. 2008, 8, 4499–4516. [Google Scholar] [CrossRef]
  37. Karydis, V.A.; Tsimpidi, A.P.; Lei, W.; Molina, L.T.; Pandis, S.N. Formation of Semivolatile Inorganic Aerosols in the Mexico City Metropolitan Area during the MILAGRO Campaign. Atmos. Chem. Phys. 2011, 11, 13305–13323. [Google Scholar] [CrossRef]
  38. Wagner, R.; Ajtai, T.; Kandler, K.; Lieke, K.; Linke, C.; Müller, T.; Schnaiter, M.; Vragel, M. Complex Refractive Indices of Saharan Dust Samples at Visible and near UV Wavelengths: A Laboratory Study. Atmos. Chem. Phys. 2012, 12, 2491–2512. [Google Scholar] [CrossRef]
  39. Wang, S.; Fang, L.; Gu, X.; Yu, T.; Gao, J. Comparison of Aerosol Optical Properties from Beijing and Kanpur. Atmos. Environ. 2011, 45, 7406–7414. [Google Scholar] [CrossRef]
  40. Li, Z.; Gu, X.; Wang, L.; Li, D.; Xie, Y.; Li, K.; Dubovik, O.; Schuster, G.; Goloub, P.; Zhang, Y.; et al. Aerosol Physical and Chemical Properties Retrieved from Ground-Based Remote Sensing Measurements during Heavy Haze Days in Beijing Winter. Atmos. Chem. Phys. 2013, 13, 10171–10183. [Google Scholar] [CrossRef]
  41. Cheng, T.; Xu, C.; Duan, J.; Wang, Y.; Leng, C.; Tao, J.; Che, H.; He, Q.; Wu, Y.; Zhang, R.; et al. Seasonal Variation and Difference of Aerosol Optical Properties in Columnar and Surface Atmospheres over Shanghai. Atmos. Environ. 2015, 123, 315–326. [Google Scholar] [CrossRef]
  42. McConnell, C.L.; Formenti, P.; Highwood, E.J.; Harrison, M.A.J. Using Aircraft Measurements to Determine the Refractive Index of Saharan Dust during the DODO Experiments. Atmos. Chem. Phys. 2010, 10, 3081–3098. [Google Scholar] [CrossRef]
  43. Greed, G.; Haywood, J.M.; Milton, S.; Keil, A.; Christopher, S.A.; Gupta, P.; Highwood, E.J. Aerosol Optical Depths over North Africa: 2. Modeling and Model Validation. J. Geophys. Res. Atmos. 2008, 113, D00C005. [Google Scholar] [CrossRef]
  44. Raut, J.C.; Chazette, P. Vertical Profiles of Urban Aerosol Complex Refractive Index in the Frame of ESQUIF Airborne Measurements. Atmos. Chem. Phys. 2008, 8, 901–919. [Google Scholar] [CrossRef]
  45. Beekmann, M.; Prévôt, A.S.H.; Drewnick, F.; Sciare, J.; Pandis, S.N.; Denier Van Der Gon, H.A.C.; Crippa, M.; Freutel, F.; Poulain, L.; Ghersi, V.; et al. In Situ, Satellite Measurement and Model Evidence on the Dominant Regional Contribution to Fine Particulate Matter Levels in the Paris Megacity. Atmos. Chem. Phys. 2015, 15, 9577–9591. [Google Scholar] [CrossRef]
  46. Tariq, S.; ul-Haq, Z.; Nawaz, H.; Mehmood, U.; Babar, Z. Remote Sensing of Aerosols Due to Biomass Burning over Kanpur, Sao-Paulo, Ilorin, and Canberra. J. Atmos. Chem. 2023, 80, 1–52. [Google Scholar] [CrossRef]
Figure 1. (a) Map of Mexico and geographic location of MC; (b) map of MC and location of SRO; (c) AERONET site in the SRO at UNAM main campus; and (d) image of the sun photometer CIMEL-318.
Atmosphere 15 00108 g001
Figure 2. HRTEM images of (a) a soot particle, (b) three TB particles joined, and (c) a TB—soot aggregate. Panel (d) shows the EDS spectrum of the TB—soot aggregate.
Atmosphere 15 00108 g002
Figure 3. SEM image of (a) tarballs attached to soot aggregate and (b) tarball in high magnification mode. (c,d) correspond to the EDS elemental mapping.
Atmosphere 15 00108 g003
Figure 4. Fractal distribution curves (FDC) for atmospheric particles sampled in MC during the spring and winter seasons.
Atmosphere 15 00108 g004
Figure 5. Time series of (a) precipitable water (PW), (b) Angstrom exponent (AE), and (c) aerosol optical depth (AOD) at 500 nm from direct Level 1.5 solar measurements conducted in the 2022–2023 period.
Atmosphere 15 00108 g005
Figure 6. Monthly trend of AE, PW, and AOD (500 nm) parameters.
Atmosphere 15 00108 g006
Figure 7. Aerosol size distribution (ASD) in the size range of 0.05–15.0 μm for (a) 2022 and (b) 2023.
Atmosphere 15 00108 g007
Figure 8. Seasonal ASD for the studied period.
Atmosphere 15 00108 g008
Figure 9. Average hourly time series of Reff and Refc for the studied period.
Atmosphere 15 00108 g009
Figure 10. Statistics of seasonal values of the refractive index at 400 nm for (a) real (n) and (b) imaginary (k) parts. Box charts are plotted with black dots representing the individual measurements and red lines representing their normal distribution curve.
Atmosphere 15 00108 g010
Figure 11. Wavelength dependence of the n and k parts of the CRI, measured in the different seasons of the year.
Atmosphere 15 00108 g011
Figure 12. Relationship between dAE (AE(440, 675)–AE(675, 870)) and AE(440, 870) for MC aerosol measured during (a) the whole studied period, (b) spring, (c) rainy, and (d) winter seasons.
Atmosphere 15 00108 g012
Table 1. Schedule of atmospheric aerosol sampling.
Season 20222023
WinterJanuary 18–20January 24–26
SpringMay 03–05May 7–9
RainyAugust 16–18August 15–17
Table 2. Comparison between the values of the CRI and other aerosol optical parameters obtained in this study and those determined for other sites.
SitenkAOD
(550 nm)
AEDate of StudiesReference
Beijing, China1.480.010–0.0130.56–1.580.88–1.222005–2009, 2011–2012, 2014–2015[14,39,40]
Kanpur, India1.40–1.480.014–0.0150.50–0.951.35–0422011–2012[39]
Shanghai, China1.39–1.450.007–0.0140.721.10–1.602010–2012[41]
Sahara, Africa1.530.00140.1–0.6-2006[42,43]
Paris, France1.51 (532 nm)0.017 (532 nm)0.15-2000, 2009–2010[44,45]
Sao Paulo, Brazil1.440.0140.14–0.530.85–1.582007[46]
Mexico City1.490.0170.331.41 This study
Disclaimer/Publisher’s Note: The statements, opinions and data contained in all publications are solely those of the individual author(s) and contributor(s) and not of MDPI and/or the editor(s). MDPI and/or the editor(s) disclaim responsibility for any injury to people or property resulting from any ideas, methods, instructions or products referred to in the content.

