Article

Coastal Flooding Associated with Hurricane Irma in Central Cuba (Ciego de Ávila Province)

by
Felipe Matos-Pupo
1,
Matthew C. Peros
2,
Roberto González-De Zayas
3,4,
Alexey Valero-Jorge
1,
Osvaldo E. Pérez-López
5,
Flor Álvarez-Taboada
6 and
Rogert Sorí
7,*
1
Centro Meteorológico Provincial de Ciego de Ávila, Instituto de Meteorología, Avenida de los Deportes S/N, Ciego de Ávila 65100, Cuba
2
Department of Environmental Studies and Geography, Bishop’s University, Sherbrooke, QC J1M 1Z7, Canada
3
Departamento de Ingeniería Hidráulica, Facultad de Ciencias Técnicas, Universidad de Ciego de Ávila, Ciego de Ávila 65100, Cuba
4
Centro de Estudios Geomáticos, Ambientales y Marinos (GEOMAR), Avenida Ejército Nacional 404-801, Polanco V Sección, Ciudad de Mexico 11560, Mexico
5
Instituto de Meteorología (INSMET), Loma de Casablanca, Regla, La Habana 11700, Cuba
6
Escuela de Ingeniería Agraria y Forestal, Universidad de León, 24004 León, Spain
7
Centro de Investigación Mariña, Environmental Physics Laboratory (EPhysLab), Campus As Lagoas s/n, Universidade de Vigo, 32004 Ourense, Spain
*
Author to whom correspondence should be addressed.
Atmosphere 2023, 14(9), 1445; https://doi.org/10.3390/atmos14091445
Submission received: 15 August 2023 / Revised: 6 September 2023 / Accepted: 8 September 2023 / Published: 16 September 2023
(This article belongs to the Special Issue Recent and Future Cyclonic Activity and Associated Weather Extremes)

Abstract

:
Irma was a major hurricane that developed during the 2017 season. It was a category 5 on the Saffir–Simpson Hurricane wind scale. This hurricane caused severe damage in the Caribbean area and the Florida Keys. The social, economic, and environmental impacts, mainly related to coastal flooding, were also significant in Cuba. The maximum limits of coastal flooding caused by this hurricane were determined in this research. Field trips and the use of the GPS supported our work, which focused on both the northern and southern coasts of the Ciego de Ávila province. This work has been critical for improving coastal flooding scenarios related to a strong hurricane, as it has been the first experience according to hurricane data since 1851. Results showed that the Punta Alegre and Júcaro towns were the most affected coastal towns. The locals had never seen similar flooding in these places before. The differences between flood areas associated with Hurricane Irma and previous modeled hazard scenarios were evident (the flooded areas associated with Hurricane Irma were smaller than those modeled for categories 1, 3, and 5 hurricanes). The effects of this hurricane on the most vulnerable coastal settlements, including the impacts on the archeological site “Los Buchillones”, were also assessed.

1. Introduction

The coastal zone is one of the most dynamic environments on the planet where geological, meteorological, and hydrologic factors interact on different space–time scales and magnitudes (from the daily scale to the millennial scale). Knowledge of these factors is essential to protect humans from disasters and eliminate or mitigate economic impacts. One of the phenomena that most affect these areas is coastal flooding, which can be associated with different causes, the most significant being tsunamis and hurricanes. In recent decades, coastal flooding has begun to be studied, mainly due to the changes in the global climate and the increased vulnerability/exposure of coastal communities [1]. Cuba has also been affected by these changes, due to the characteristics of small islands (the area of Cuba is 110,922 km2) [2] that make them vulnerable to the effects of climate change such as sea level rise and increase in the frequency and intensity of extreme events [1]. Floodings resulting from extreme hydrometeorological events are among the main coastal problems in Cuba. These impacts have increased the concern of our society regarding the implementation of preventive measures to mitigate social and economic losses [3,4].
Studies on coastal flooding in Cuba have not been homogeneous. The Havana Seafront (known in Spanish as Malecon Habanero) [5,6,7,8,9], Cienfuegos [10], and the coastal sector from Gibara (Holguín) to Punta de Maisí (Guantánamo) [11] have been the most studied areas. Other studies on coastal flooding have focused on the social impacts [3], methodological analysis [12], consequences to protected areas [13], and their classification [14]. However, coastal flooding has been poorly studied in the northern and southern coasts of central Cuba. The only published report on coastal flooding in the province of Ciego de Ávila addressed seven coastal flooding events that took place from 1964 onward [15]. The need to boost research on extreme past events of this kind has been stressed because they are insufficient in the study area [16]. This could enrich existing chronologies and be useful to increase the risk perception of this phenomenon.
Floods in Cuba are usually related to hurricanes, although frontal systems also cause floods [3]. The biggest flood recorded in Cuba was associated with a major hurricane (the Santa Cruz del Sur hurricane or hurricane of 1932) [17]. These authors pointed to western Cuba as the area with the highest frequency of intense hurricanes.
Some governmental actions (increasing the number of risk management centers, greater environmental controls, etc.) have contributed to building awareness of the vulnerability and risks on the coast of the Ciego de Ávila province. These actions include all the municipalities of the province where coastal flooding related to cat 1, 3, and 5 hurricanes (according to the Saffir–Simpson hurricane wind scale) were evaluated. The results of this work show that the municipalities of Chambas (northern coast) and Venezuela (southern coast) were the most vulnerable to flooding [18]. Based on these results, the Cuban government conceived the relocation of some coastal settlements of both municipalities as a national priority.
Although the frequency of intense hurricanes (categories from 3 to 5) in the Ciego de Ávila province is considered low (only seven intense hurricanes have hit the province between 1851 and 2017) [19], research to increase knowledge about coastal flooding must be prioritized. This is an extreme phenomenon that needs to be considered for two main reasons: first, due to their impact; and second, because of the large number of human settlements located in coastal zones.
During its first stage, the main objective of this research was to present the spatial behavior of coastal flooding related to Hurricane Irma in the Ciego de Ávila province. The other objectives were to compare flooding caused by Hurricane Irma with that of previous modeled scenarios and to evaluate vulnerable areas, including the Los Buchillones archeological site.

2. Materials and Methods

2.1. General Methodological Aspects
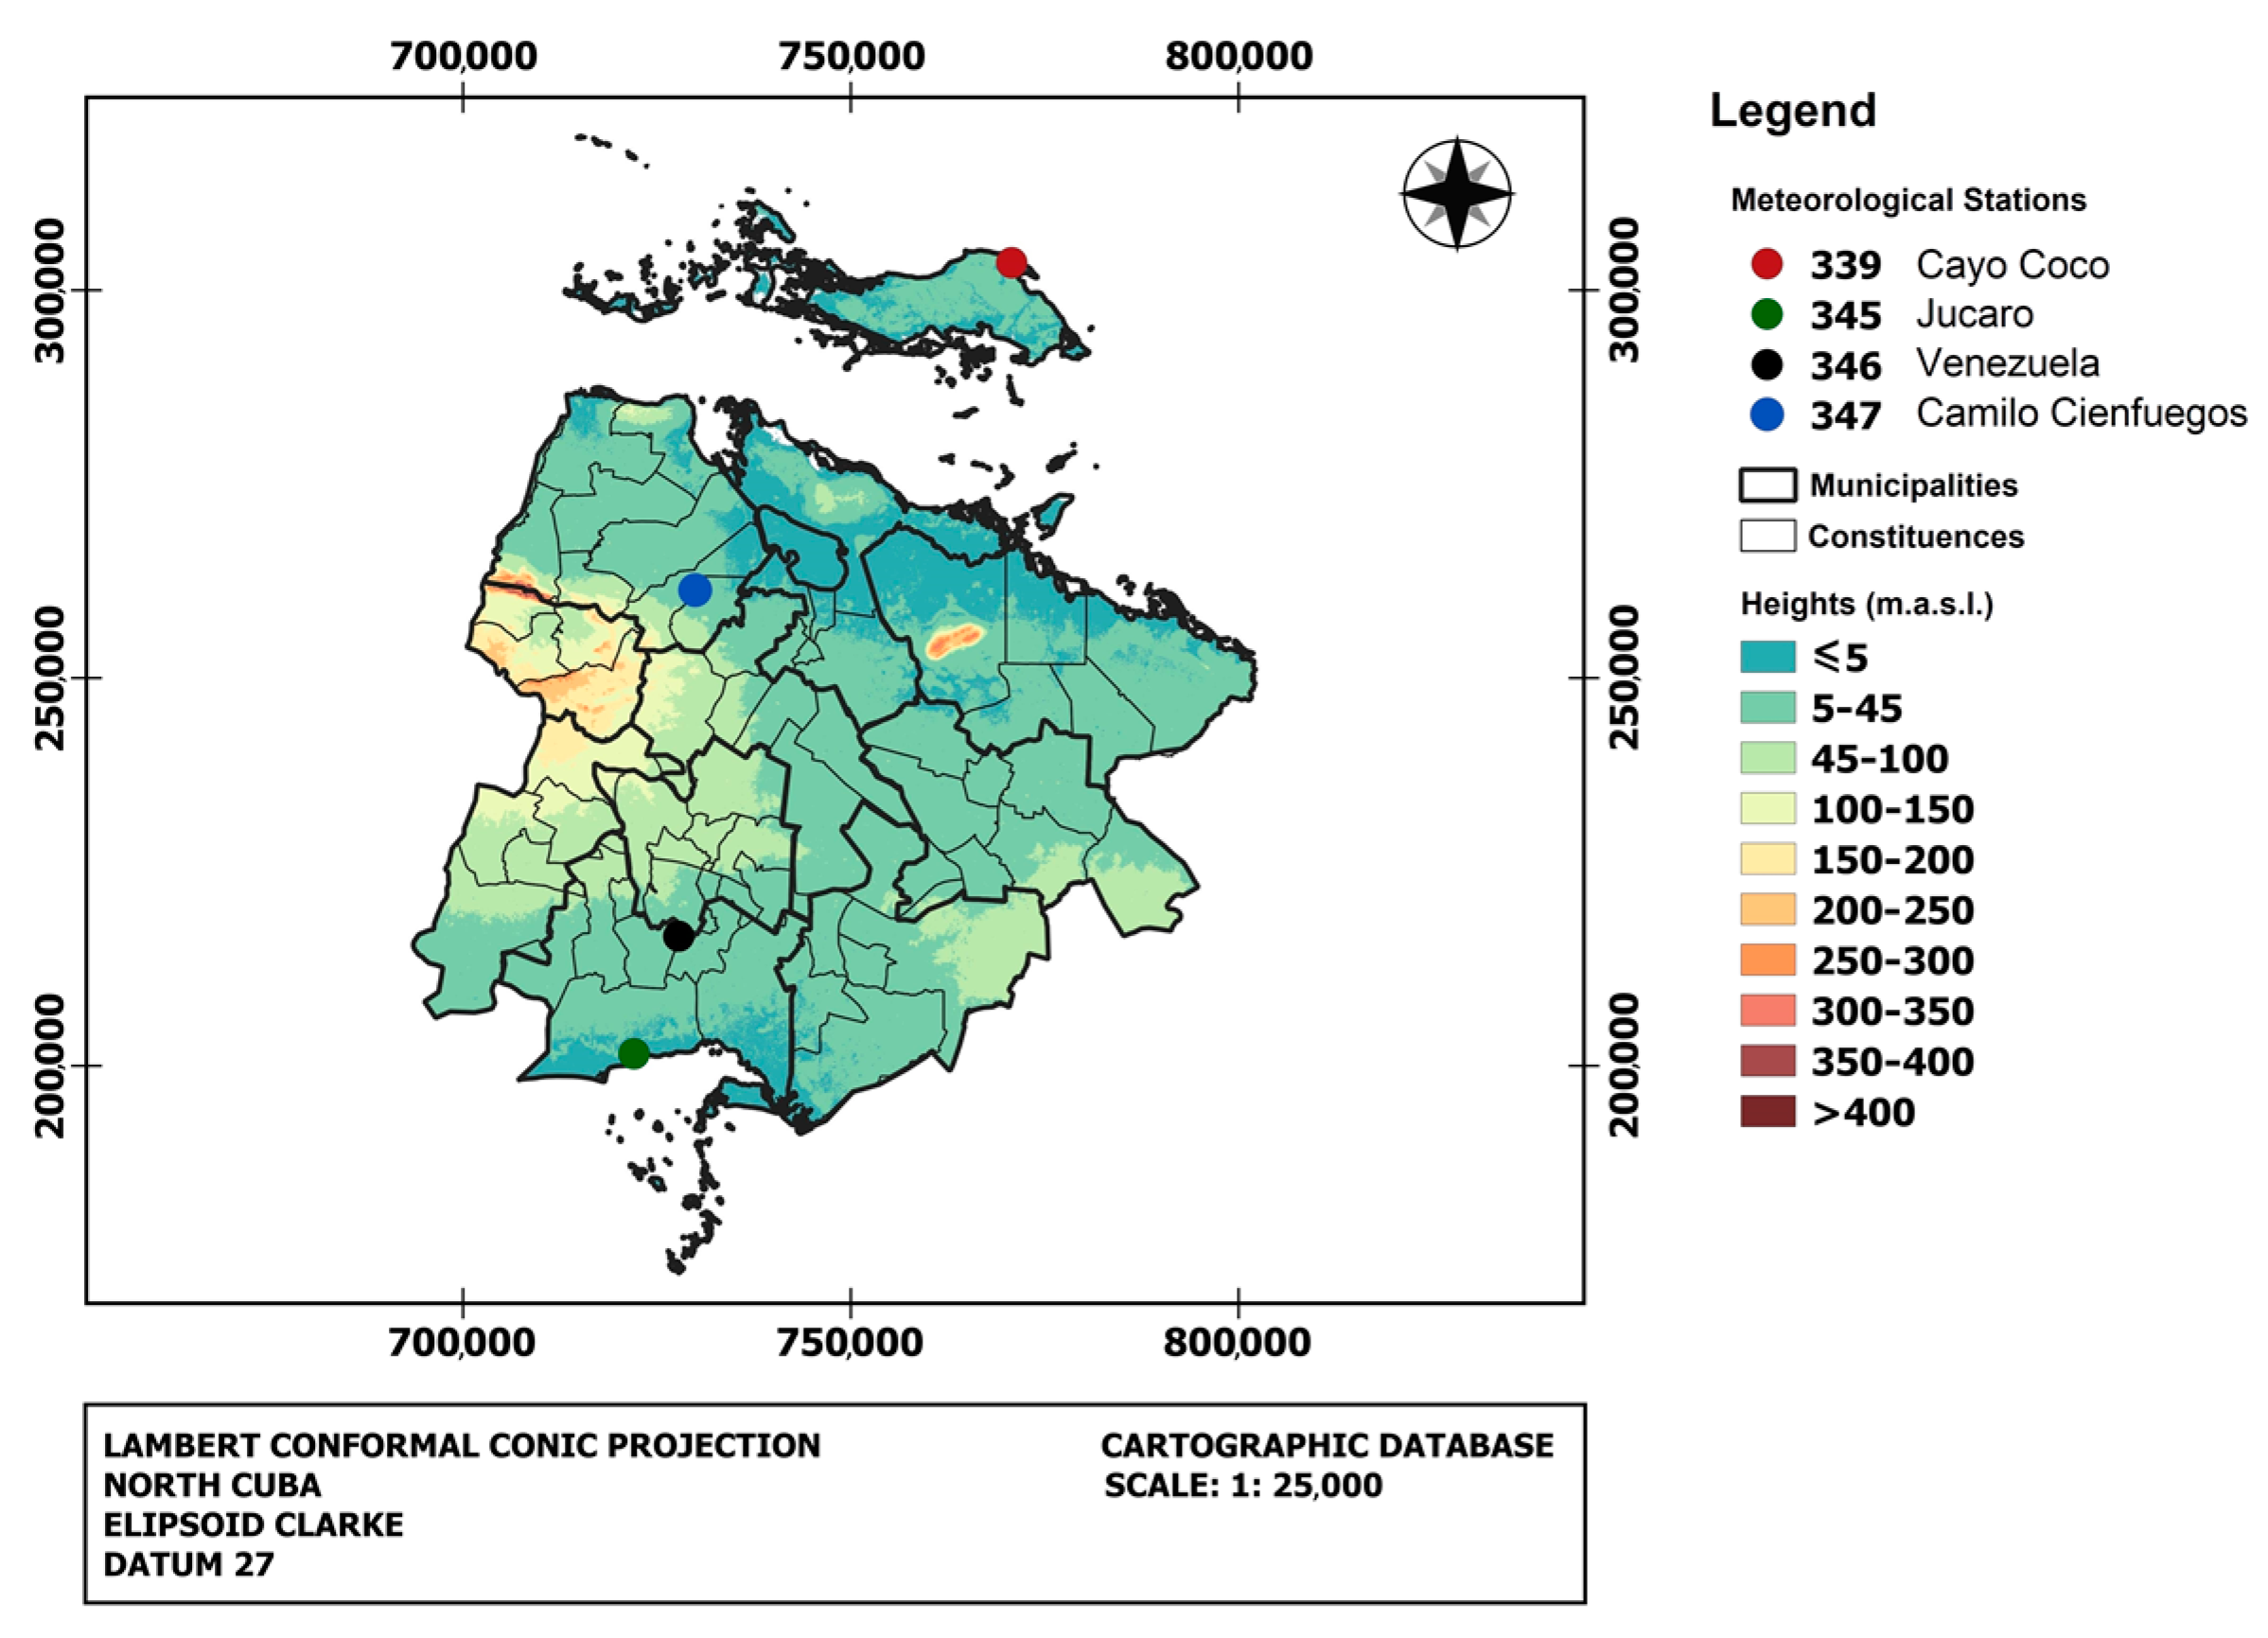
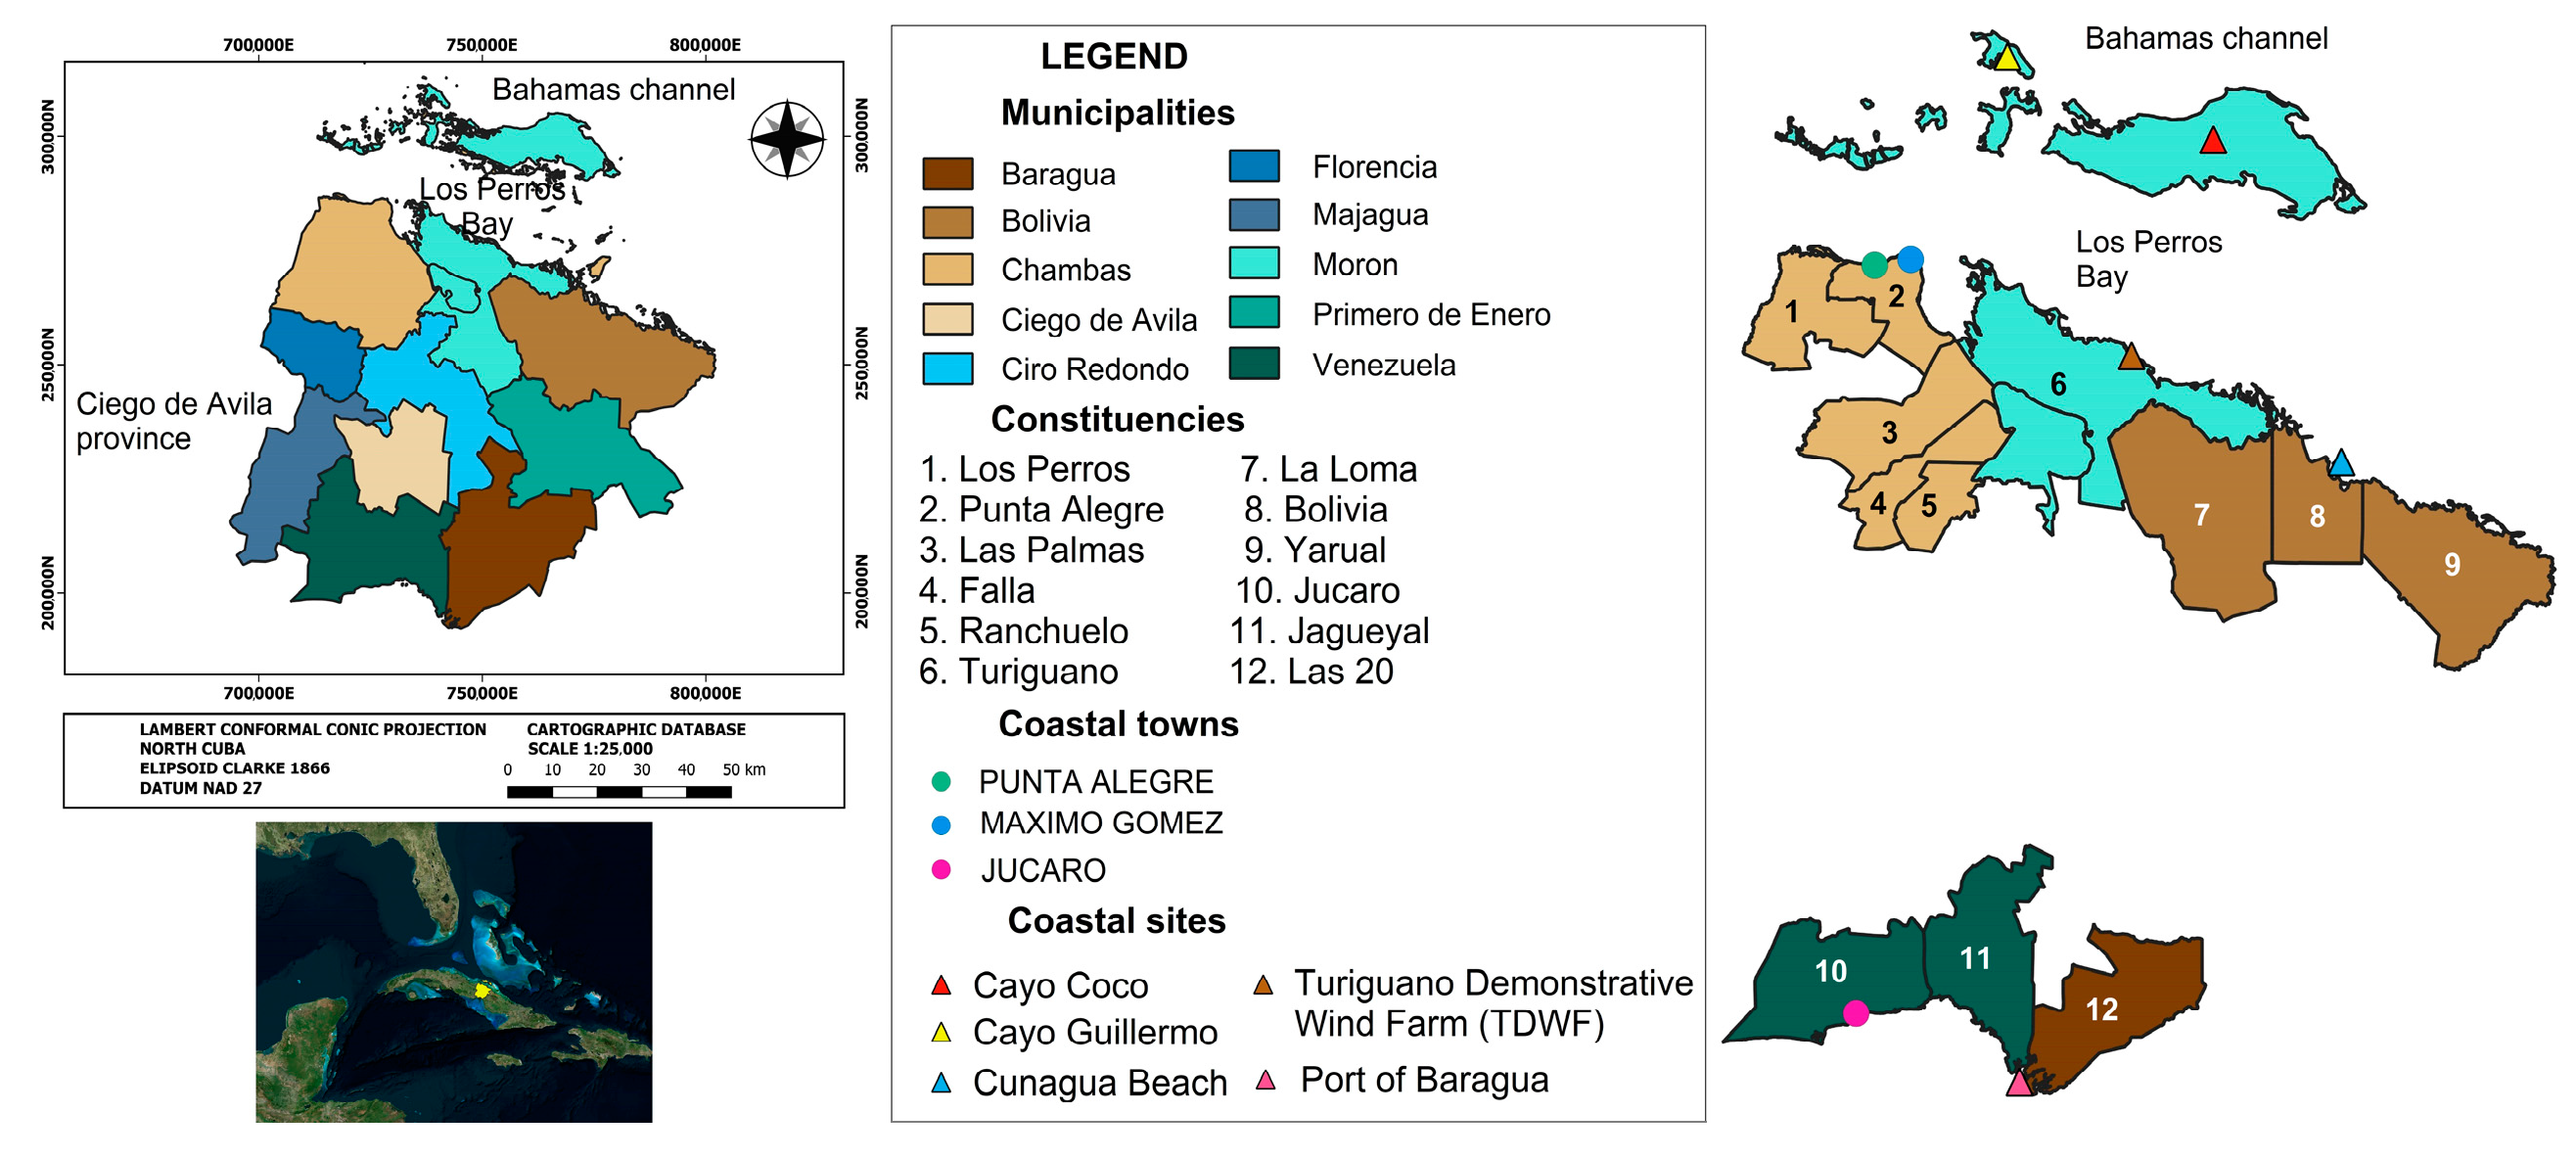
During the 2017 hurricane season, Cuba was hit by its first cat 5 hurricane since 1791, which had a very strong and direct impact on the Ciego de Ávila province [20]. After this event, local governmental and environmental authorities made an Environmental Impact Study (EIS) of this intense hurricane [21]. The study included a detailed analysis of coastal areas flooded as a result of this phenomenon. Fieldwork included interviews with locals, pictures (as graphic evidence), and evidence of the water level resulting from the event in each surveyed area.
The fieldwork lasted four days (from 13 to 15 September 2017) and included the most impacted municipalities of the province (Chambas, Morón, Bolivia, and Venezuela). The Baraguá municipality was visited on 18 September 2017. Fieldwork (visual inspections, measurements of inundation depths and the extent of the flooding, interviews with government officials, personal interviews, and damage assessment) was carried out four days after Hurricane Irma hit the province (8 and 9 September 2017) to document the evidence of coastal flooding. The Environmental Impact Assessment Guide [22] was used to assess such areas.
The direct observation of the highest water marks was the predominant research method used to evaluate flood maps. All visible marks were registered (coordinates) using a GPS (made by GARMIN, Olathe, KS, USA). The high marks were recorded at different points as some obstacles prevented us from obtaining the best measurements. The distance between visible marks ranged from 0.70 to 0.85 m and was more precise on the north coast. To evaluate flooding, marine alerts and weather reports from the National Institute of Meteorology of Cuba (INSMET in Spanish) and other graphical evidence such as videos and photos from amateur photographers were used. The coordinates of the marks were introduced in the Digital Model of Elevation (DME) to determine flood benchmarks. The flood maps were updated with the Q-GIS Software (version 3.16).
The flood maps obtained from the fieldwork after Hurricane Irma were compared with previous ones [20]. On the southern coast, this comparison was made using previous flood maps obtained for flooding related to a cat 1 hurricane, and on the northern coast, the comparison was made with maps made for cat 3 and 5 hurricanes. At the same time, the impacts of Hurricane Irma on each locality were evaluated.

2.2. Study Area

Cuba is the largest island in the Caribbean. The Ciego de Ávila province is located in central Cuba. It was created in the political and administrative division of 1976. The province sits on a large plain that stretches from north to south (Figure 1), limited in the north by the Old Bahamas Channel, in the south by the Gulf of Ana María, in the west by the province of Sancti Spíritus, and in the east by the province of Camagüey (20°50′00″ S, 22°27′00″ N, 79°07′42″ W, and 78°08′42″ E).
This study included 88% of the province’s area (Table 1) and 79% of the length of its coasts. Cuba is divided (administratively) into 15 provinces. The provinces are divided into municipalities, and the municipalities into constituencies (C). The Ciego de Ávila province consists of 10 municipalities and 62 constituencies.
The relief of the province is predominantly flat, and the Júcaro–Morón plain is a very significant element of its geography (Figure 2). The Punta Alegre, Turiguanó, and Cunagua heights and a portion of the Bamburanao–Jatibonico mountain range rise from this plain. The highest elevations of the province are in the Bamburanao–Jatibonico mountains, including the Merino Peak (the highest elevation) with 396.6 m above mean sea level (a.m.s.l.). There are four meteorological stations (339, 345, 346, and 347) in the province, all of them certified by the Institute of Meteorology (INSMET) (Figure 2).
The geology of the area is a saddle or structural depression with a predominance of wackestone from the Miocene, linking two older and more complex structures consisting of igneous, metamorphic, and sedimentary rocks toward the west and east ends of the province [23]. This structure is reflected in the spatial design of the water system because the oldest blocks of the central-west and central-east regions act as dispersion centers of the water resources, while in the karstic plain, which covers the entire central part of the province, currents are ephemeral and disappear in the karst topography [24].
The territory is an anthropic area, with an increase in land use by the agricultural and tourism sectors. Tourism activities are mostly centered on the north coast, with Jardines del Rey being one of the main tourism regions in the country [25]. Land dedicated to the development of agriculture represents 61.5% of the province’s total surface area (6783 km2) and also extends to the coastal areas [26].

3. Results

3.1. Hurricane Irma’s Path over the Study Area, Overview

Hurricane Irma was an intense hurricane (category 5 on the Saffir–Simpson wind scale) that hit some Caribbean Islands (Puerto Rico and Hispaniola), Cuba, and Florida. This hurricane is considered one of the most powerful ever of the Eastern Atlantic. Irma was the fourth hurricane of the 2017 season and the second most intense worldwide. This hurricane formed near the Cape Verde Islands (in the Eastern Atlantic) on 20 August 2017. The high sea surface temperature favored a quick intensity increase to a category 2 hurricane at first and later to categories 4 and 5 in the Saffir–Simpson wind scale.
After impacting Puerto Rico and La Hispaniola, Hurricane Irma made landfall near Cayo Romano, northern Cuba, as a category 5 hurricane on 8 September 2017 and hit the study area that same day. In the mainland, the province of Ciego de Ávila was the most severely impacted by this phenomenon (strong winds, significant rainfall, and big waves). The center of Irma passed over the Los Perros and Buenavista bays (between the mainland and the Sabana—Camagüey Archipelago) at daybreak of 9 September severely affecting the northern coastal area of the province (Figure 3). However, strong tropical storm winds (up to 100 km/h) reached the southern coast of the province.
The first evidence of weather changes in the Ciego de Ávila province was the decrease in barometric pressure to 933.1 hPa and 959 hPa, recorded at the meteorological stations of Cayo Coco and Camilo Cienfuegos, respectively. In Cayo Coco, the maximum wind speed reported was 194 km/h (NNE–NE wind direction), with gusts (intervals of 10 min) of 185 and 230 km/h. At the Camilo Cienfuegos station, the maximum wind speed was 256 km/h (the highest measured for Hurricane Irma). Simultaneously, intense rainfall was recorded at these stations (339.8 mm/day, a new record for Cayo Coco, and 250 mm/day at Camilo Cienfuegos). On the southern coast, the meteorological stations of Júcaro and Venezuela reported wind speeds of 70 km/h and 80 km/h, respectively.
The intense rainfall and winds associated with Hurricane Irma caused significant flooding, particularly on the northern coast. These meteorological and oceanographic processes pose diverse risks, mainly to the coasts of the keys (Cayo Coco, Cayo Paredón, Cayo Romano, and Cayo Guillermo) of the Sabana-Camagüey Archipelago due to the generation of big waves in the Bahamas Channel (up to 9 m near the keys).
The intensity and magnitude of flood-related impacts on each coastal portion increased with changes in the direction of the hurricane’s east–west path and changes in the position of the eye as the hurricane passed over the province. The flooding start time in each portion of the surveyed coast showed that it started on the northern coast (Table 2).

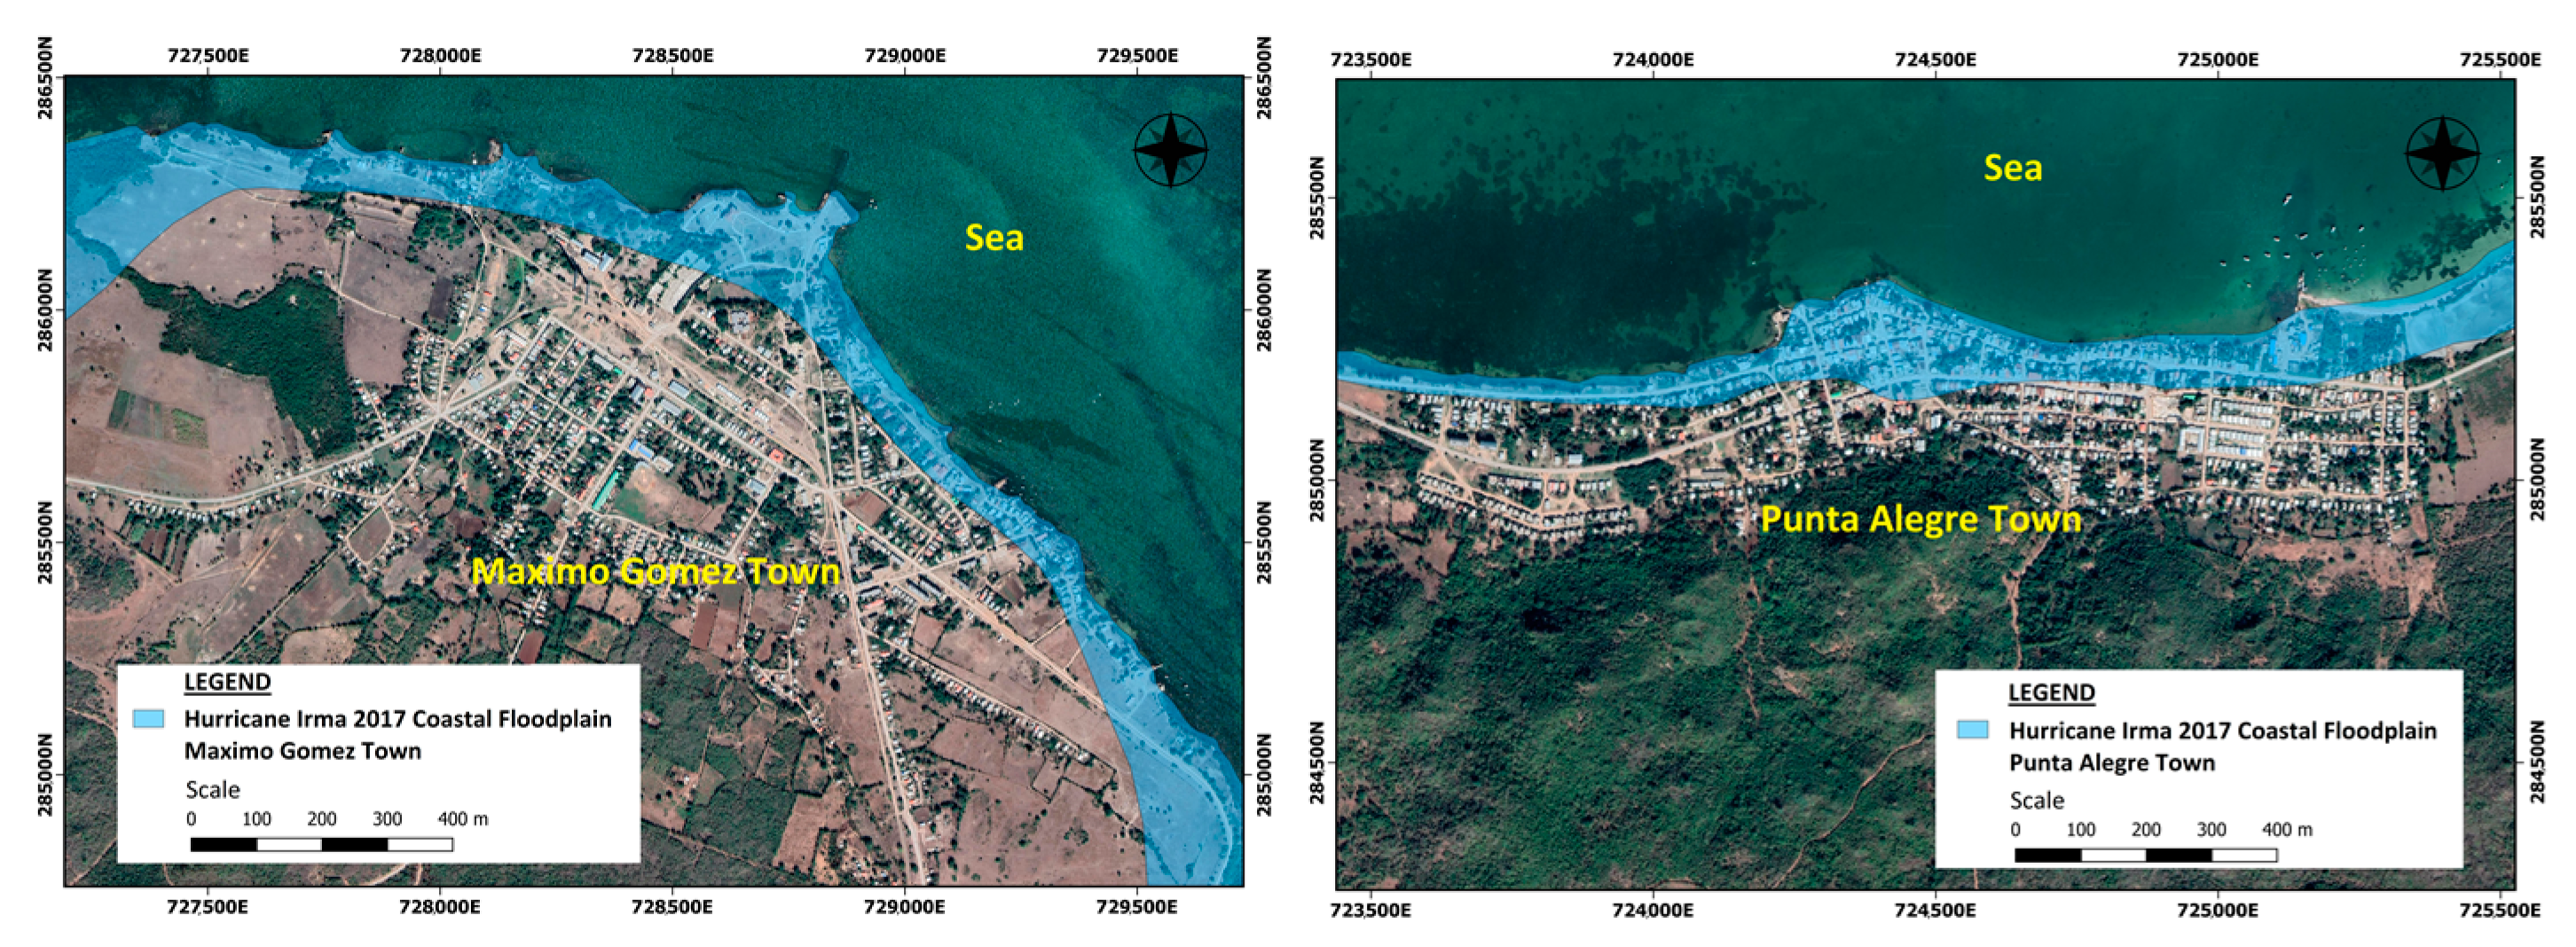
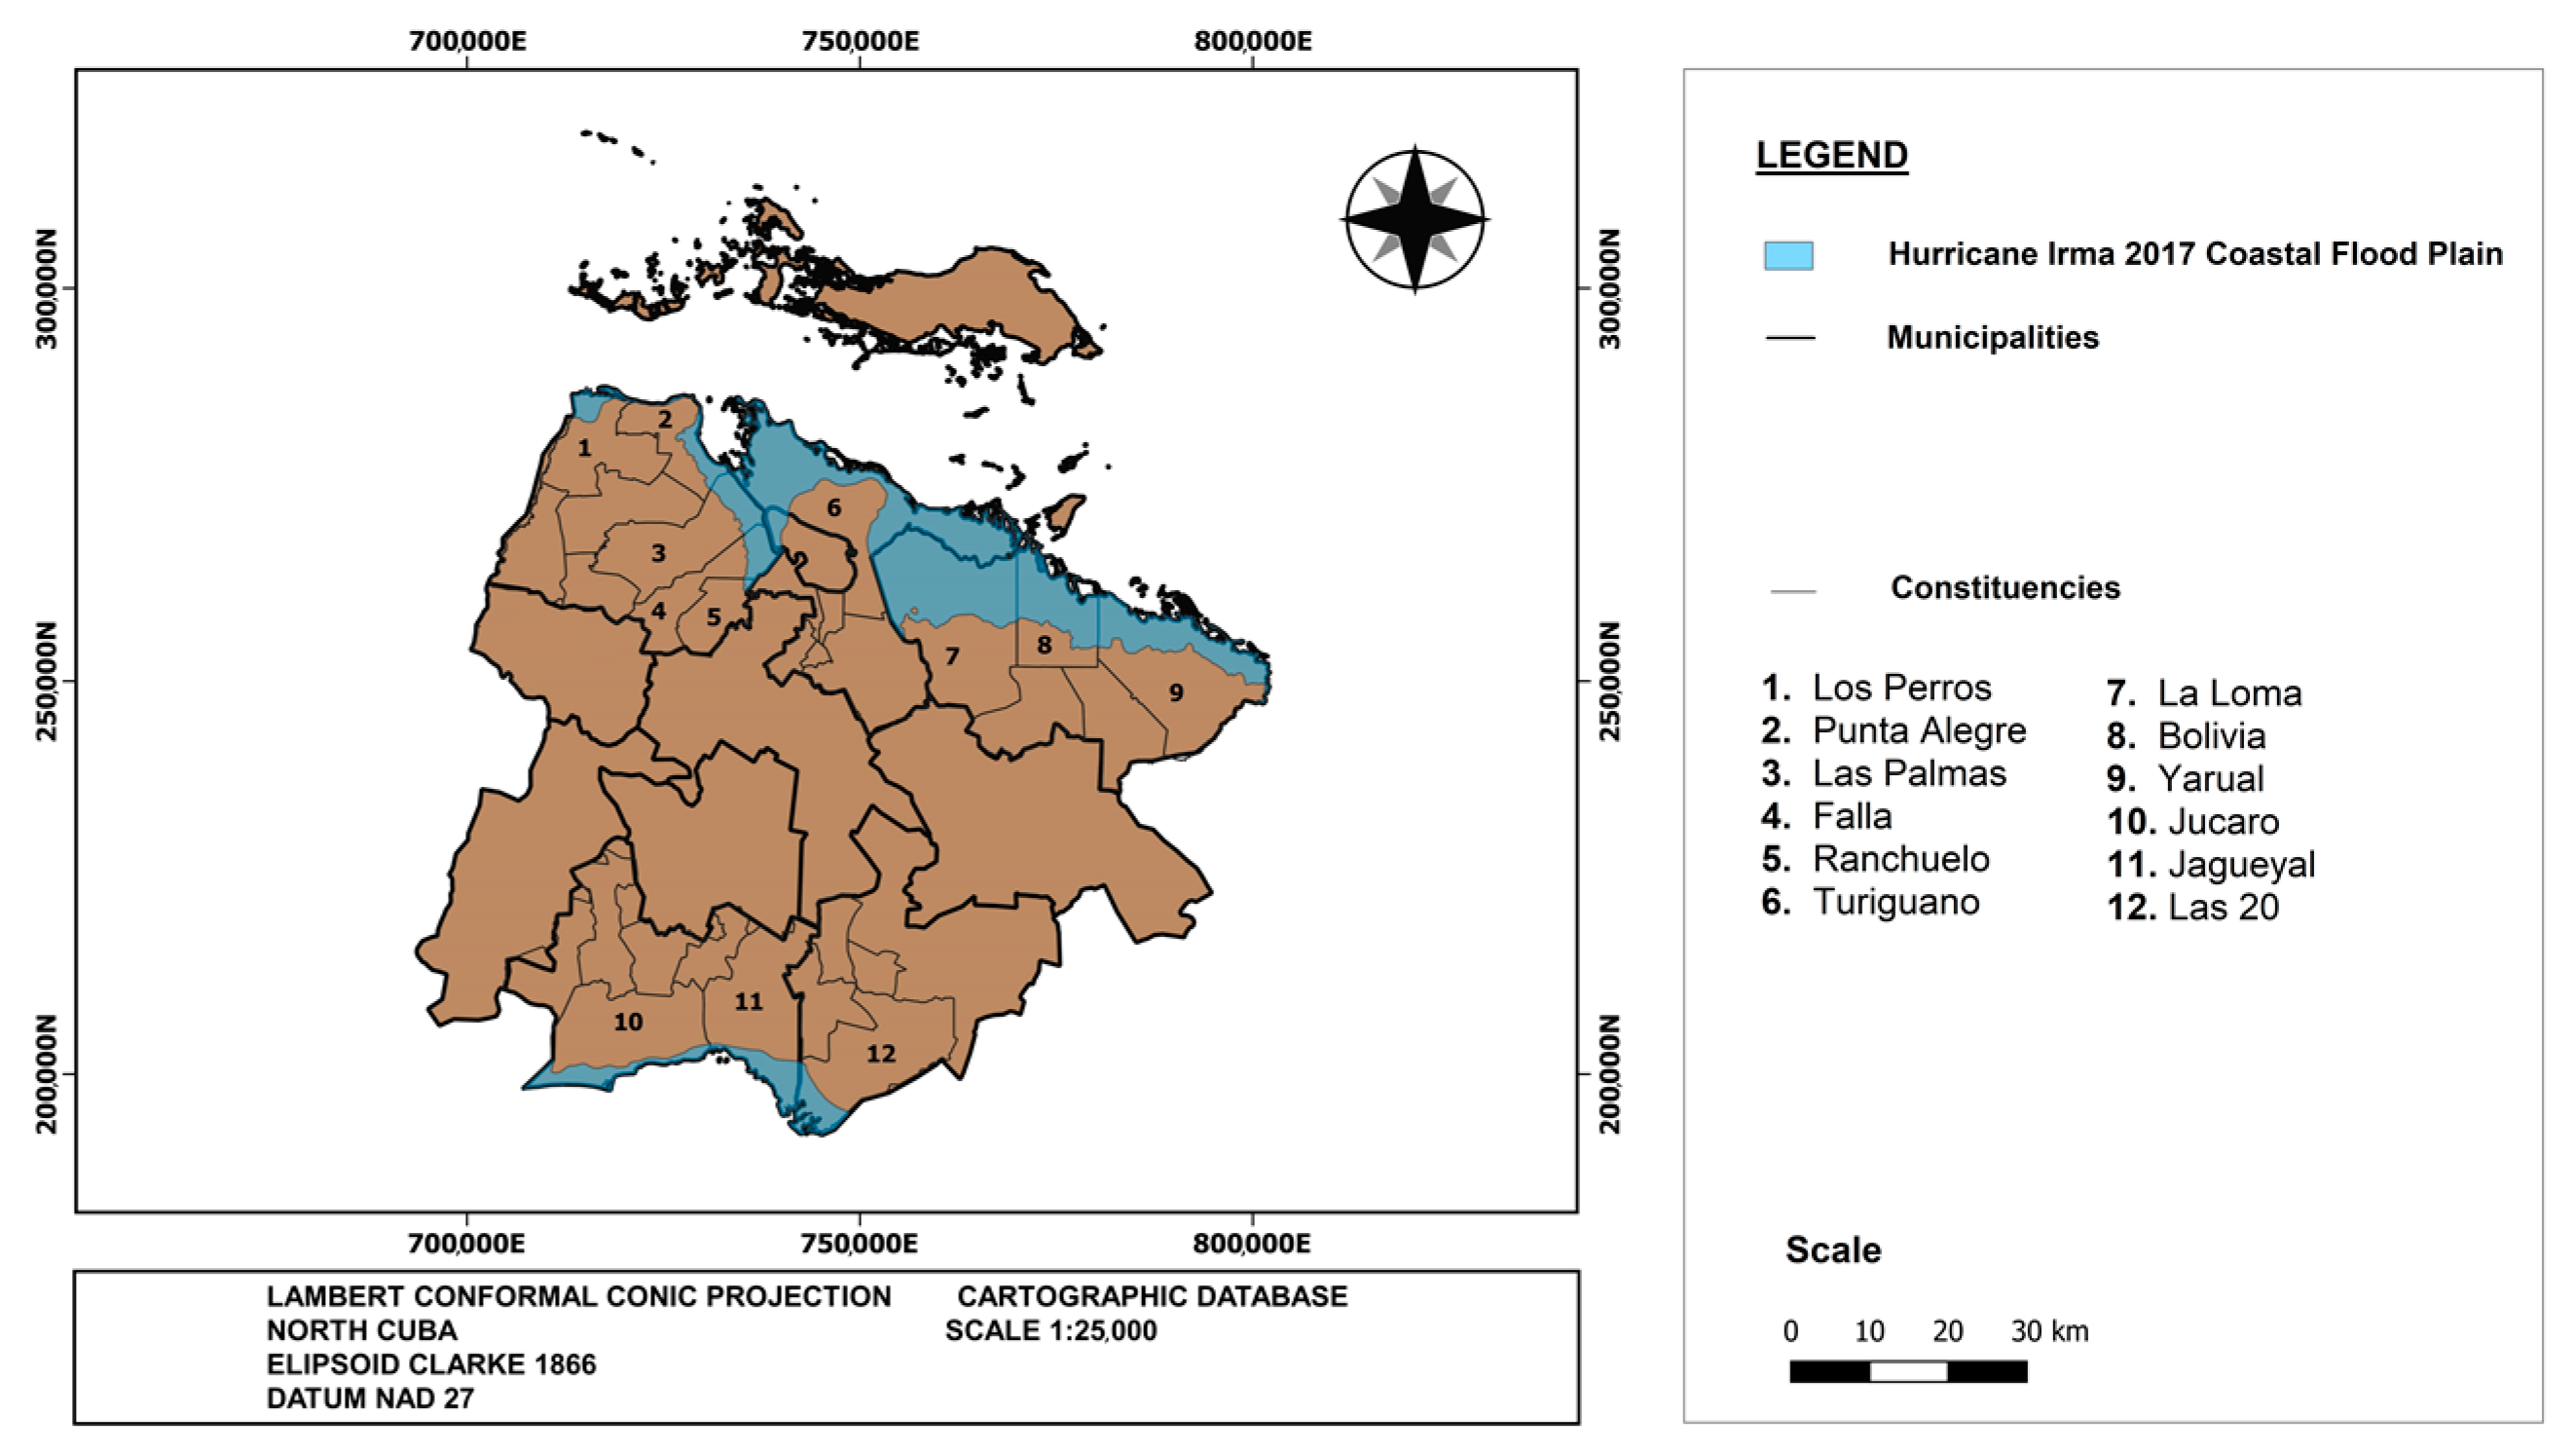
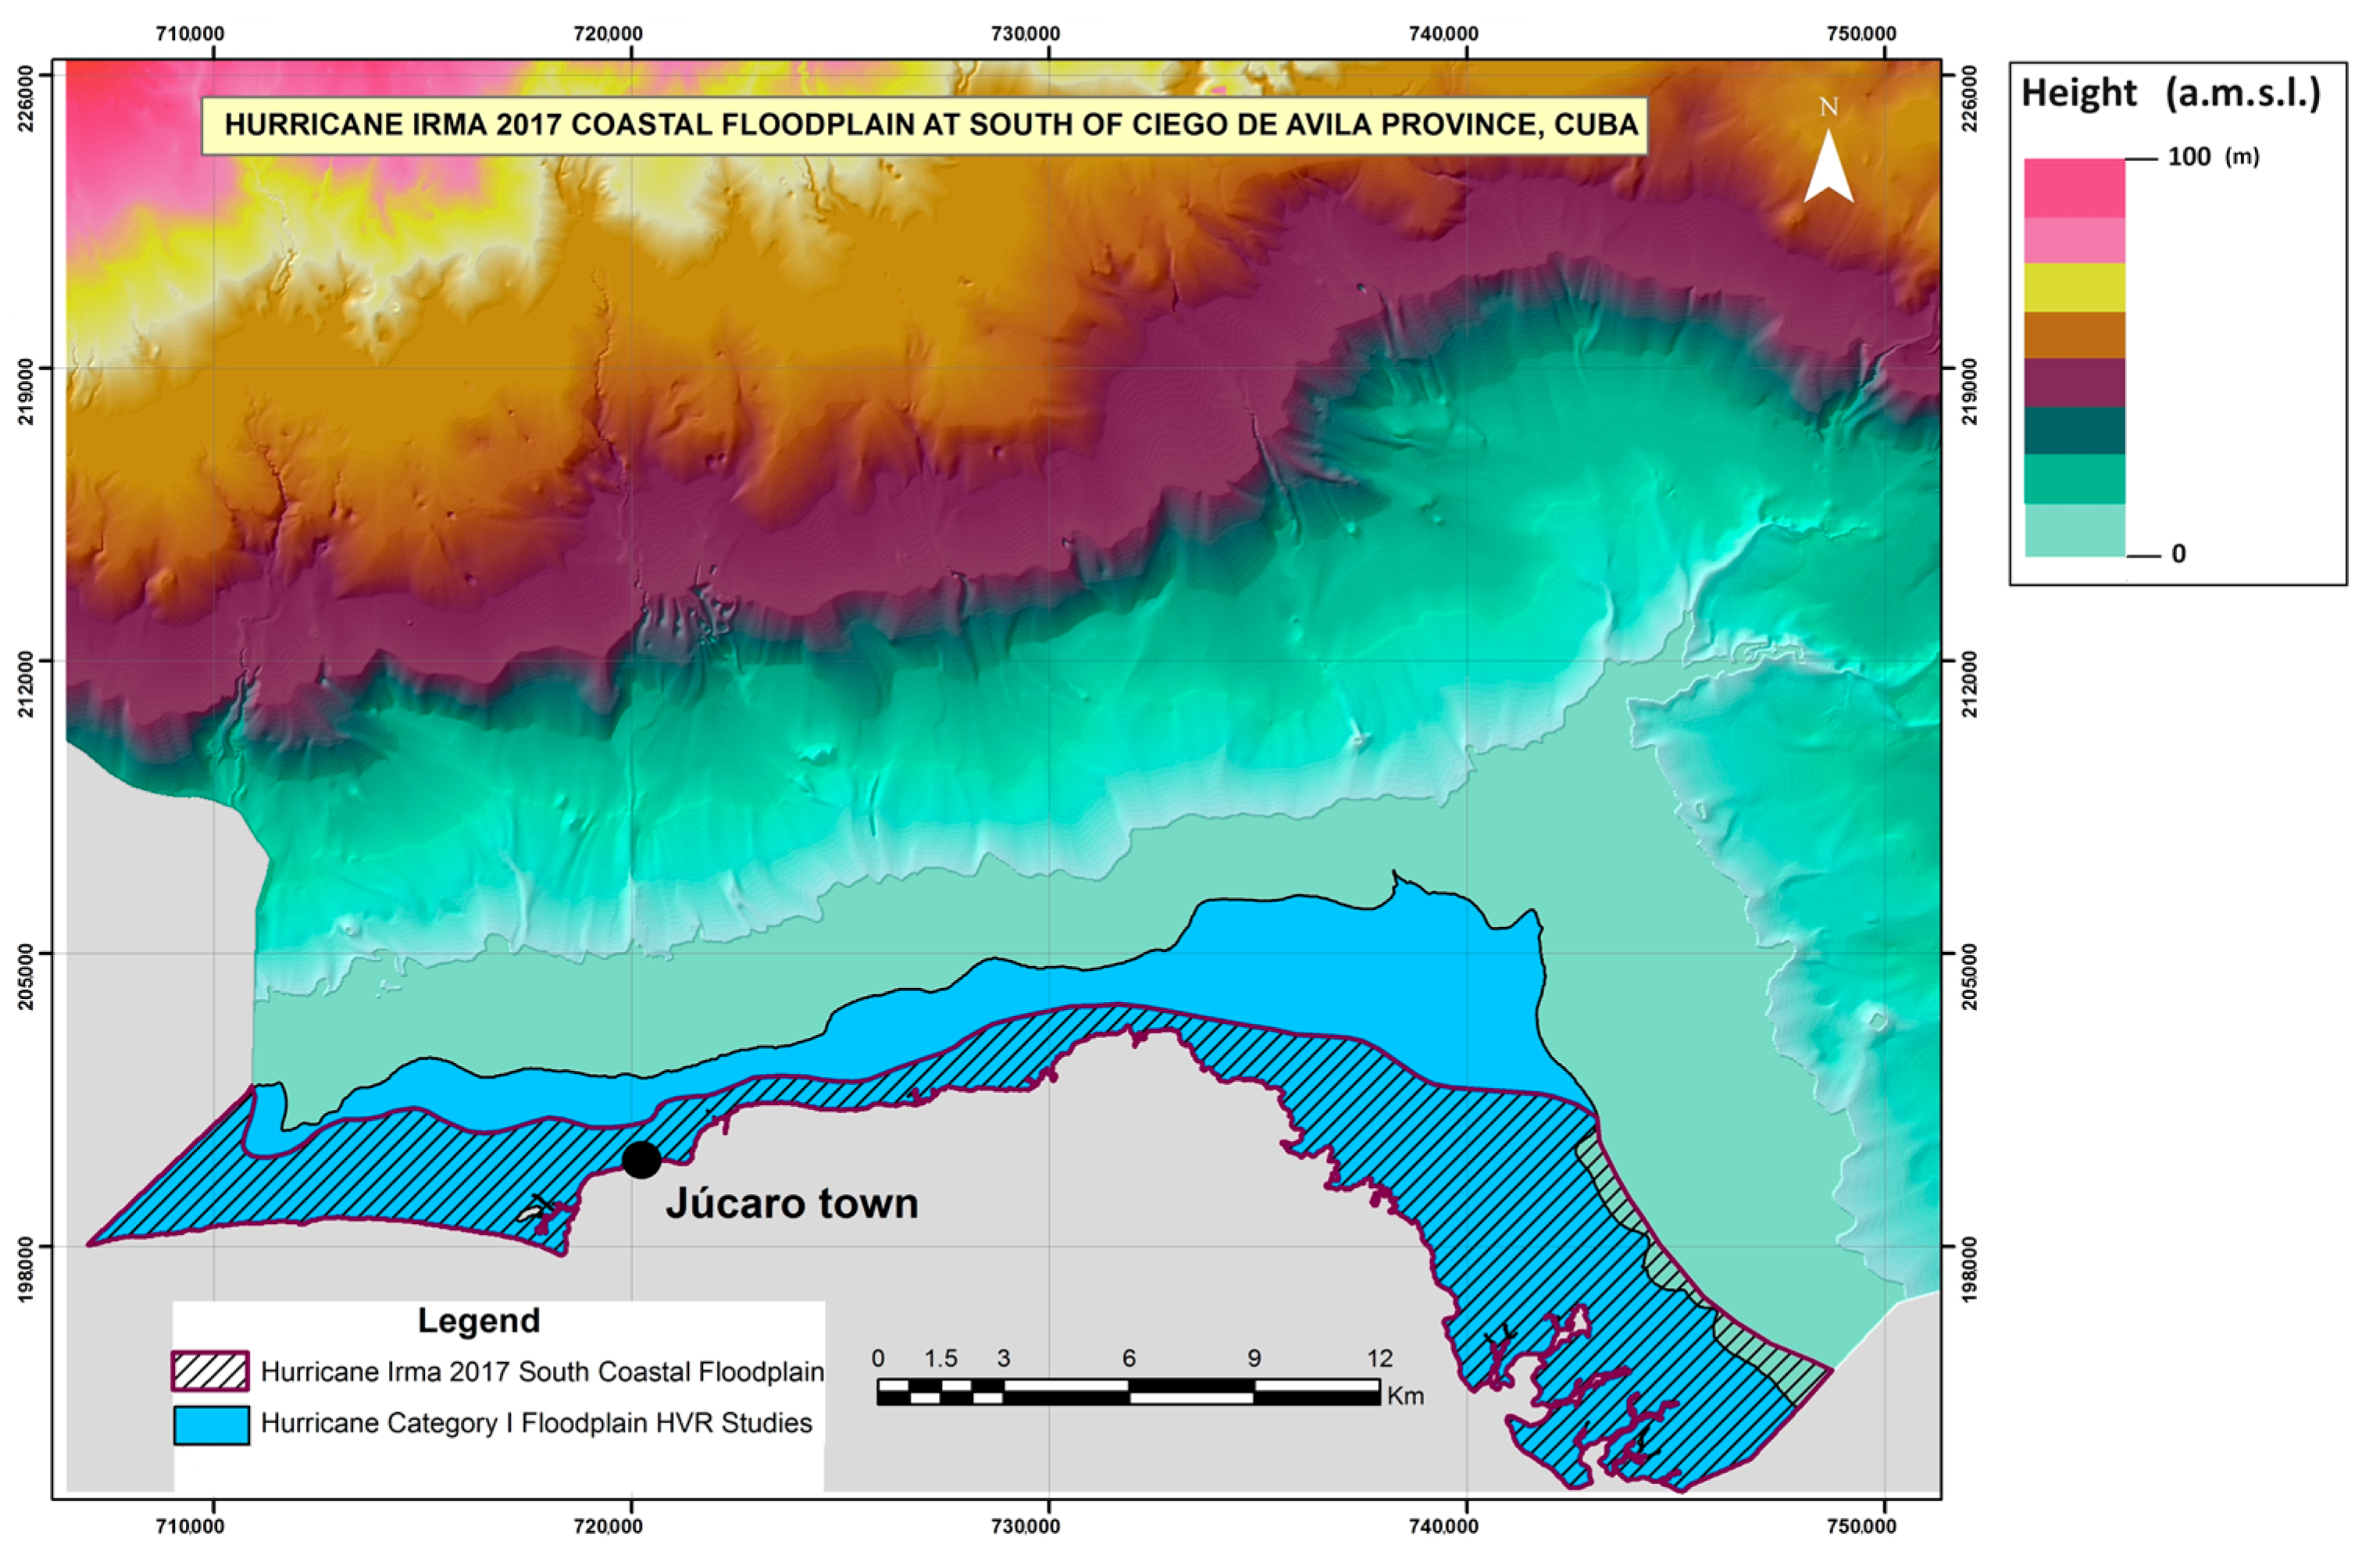
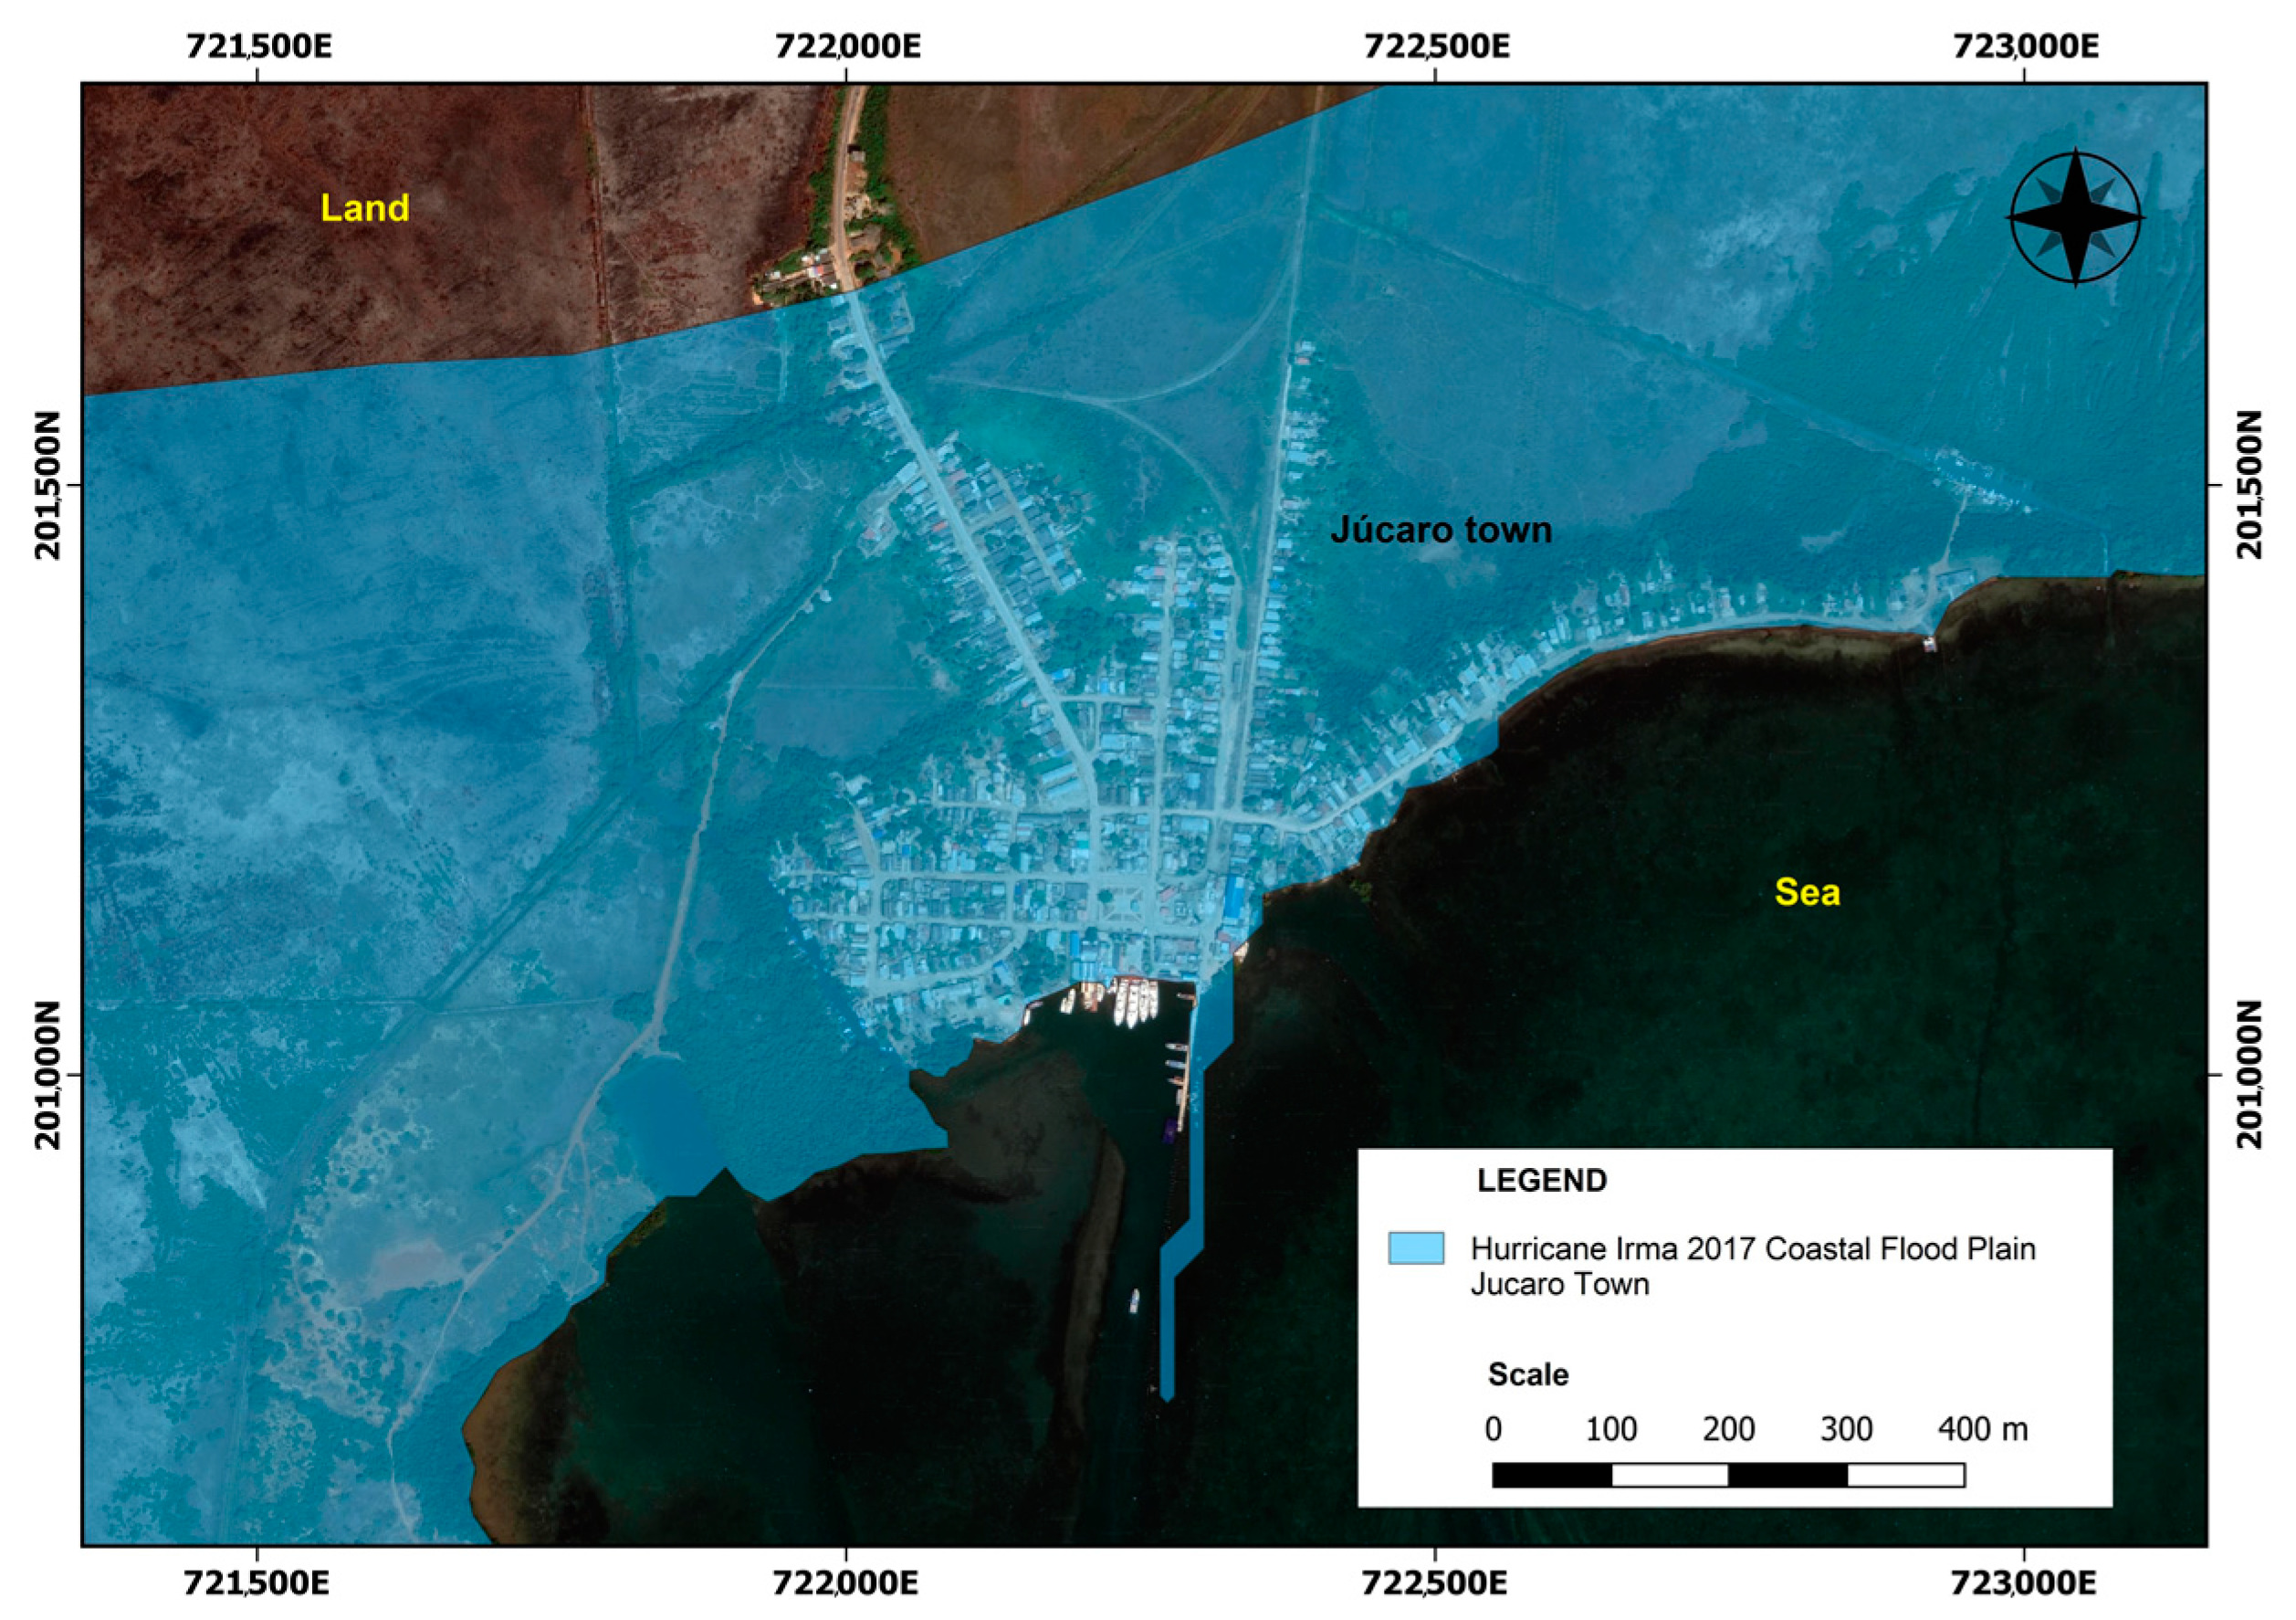
3.2. Spatial Distribution of Coastal Flooding

The storm surge related to Hurricane Irma caused the biggest effects on the southern coast of Ciego de Ávila, with the greatest impact over the town of Júcaro (Venezuela municipality). In the coastal area of the Baraguá municipality, the mangrove forests received the greatest impacts.
Floods on the northern coast were due to the combination of three factors: storm surge, swell (with waves of 7–8 m), and water pushing. Punta Alegre and Máximo Gomez (municipality of Chambas, both in Punta Alegre constituency) were the most impacted by Hurricane Irma. The water level reached 2 m in this portion of the northern coast. Numerous flooding reference points were taken in this area, particularly from the high-water mark measured in houses. In the town of Punta Alegre, the water level reached 0.9 m (taking as a reference the floor of the house) (Figure 4).
The area flooded on the northern coast (644.6 km2) was larger than the area flooded on the southern coast (103.0 km2) (Figure 5). Although the town of Punta Alegre suffered the greatest social impacts due to Hurricane Irma, the largest flooded areas (spatially) were in the constituencies of Turiguanó (municipality of Morón), Bolivia, and La Loma (municipality of Bolivia) (Table 3). On the southern coast, the town of Júcaro was not only the most severely impacted but also had the largest flooded area as well.

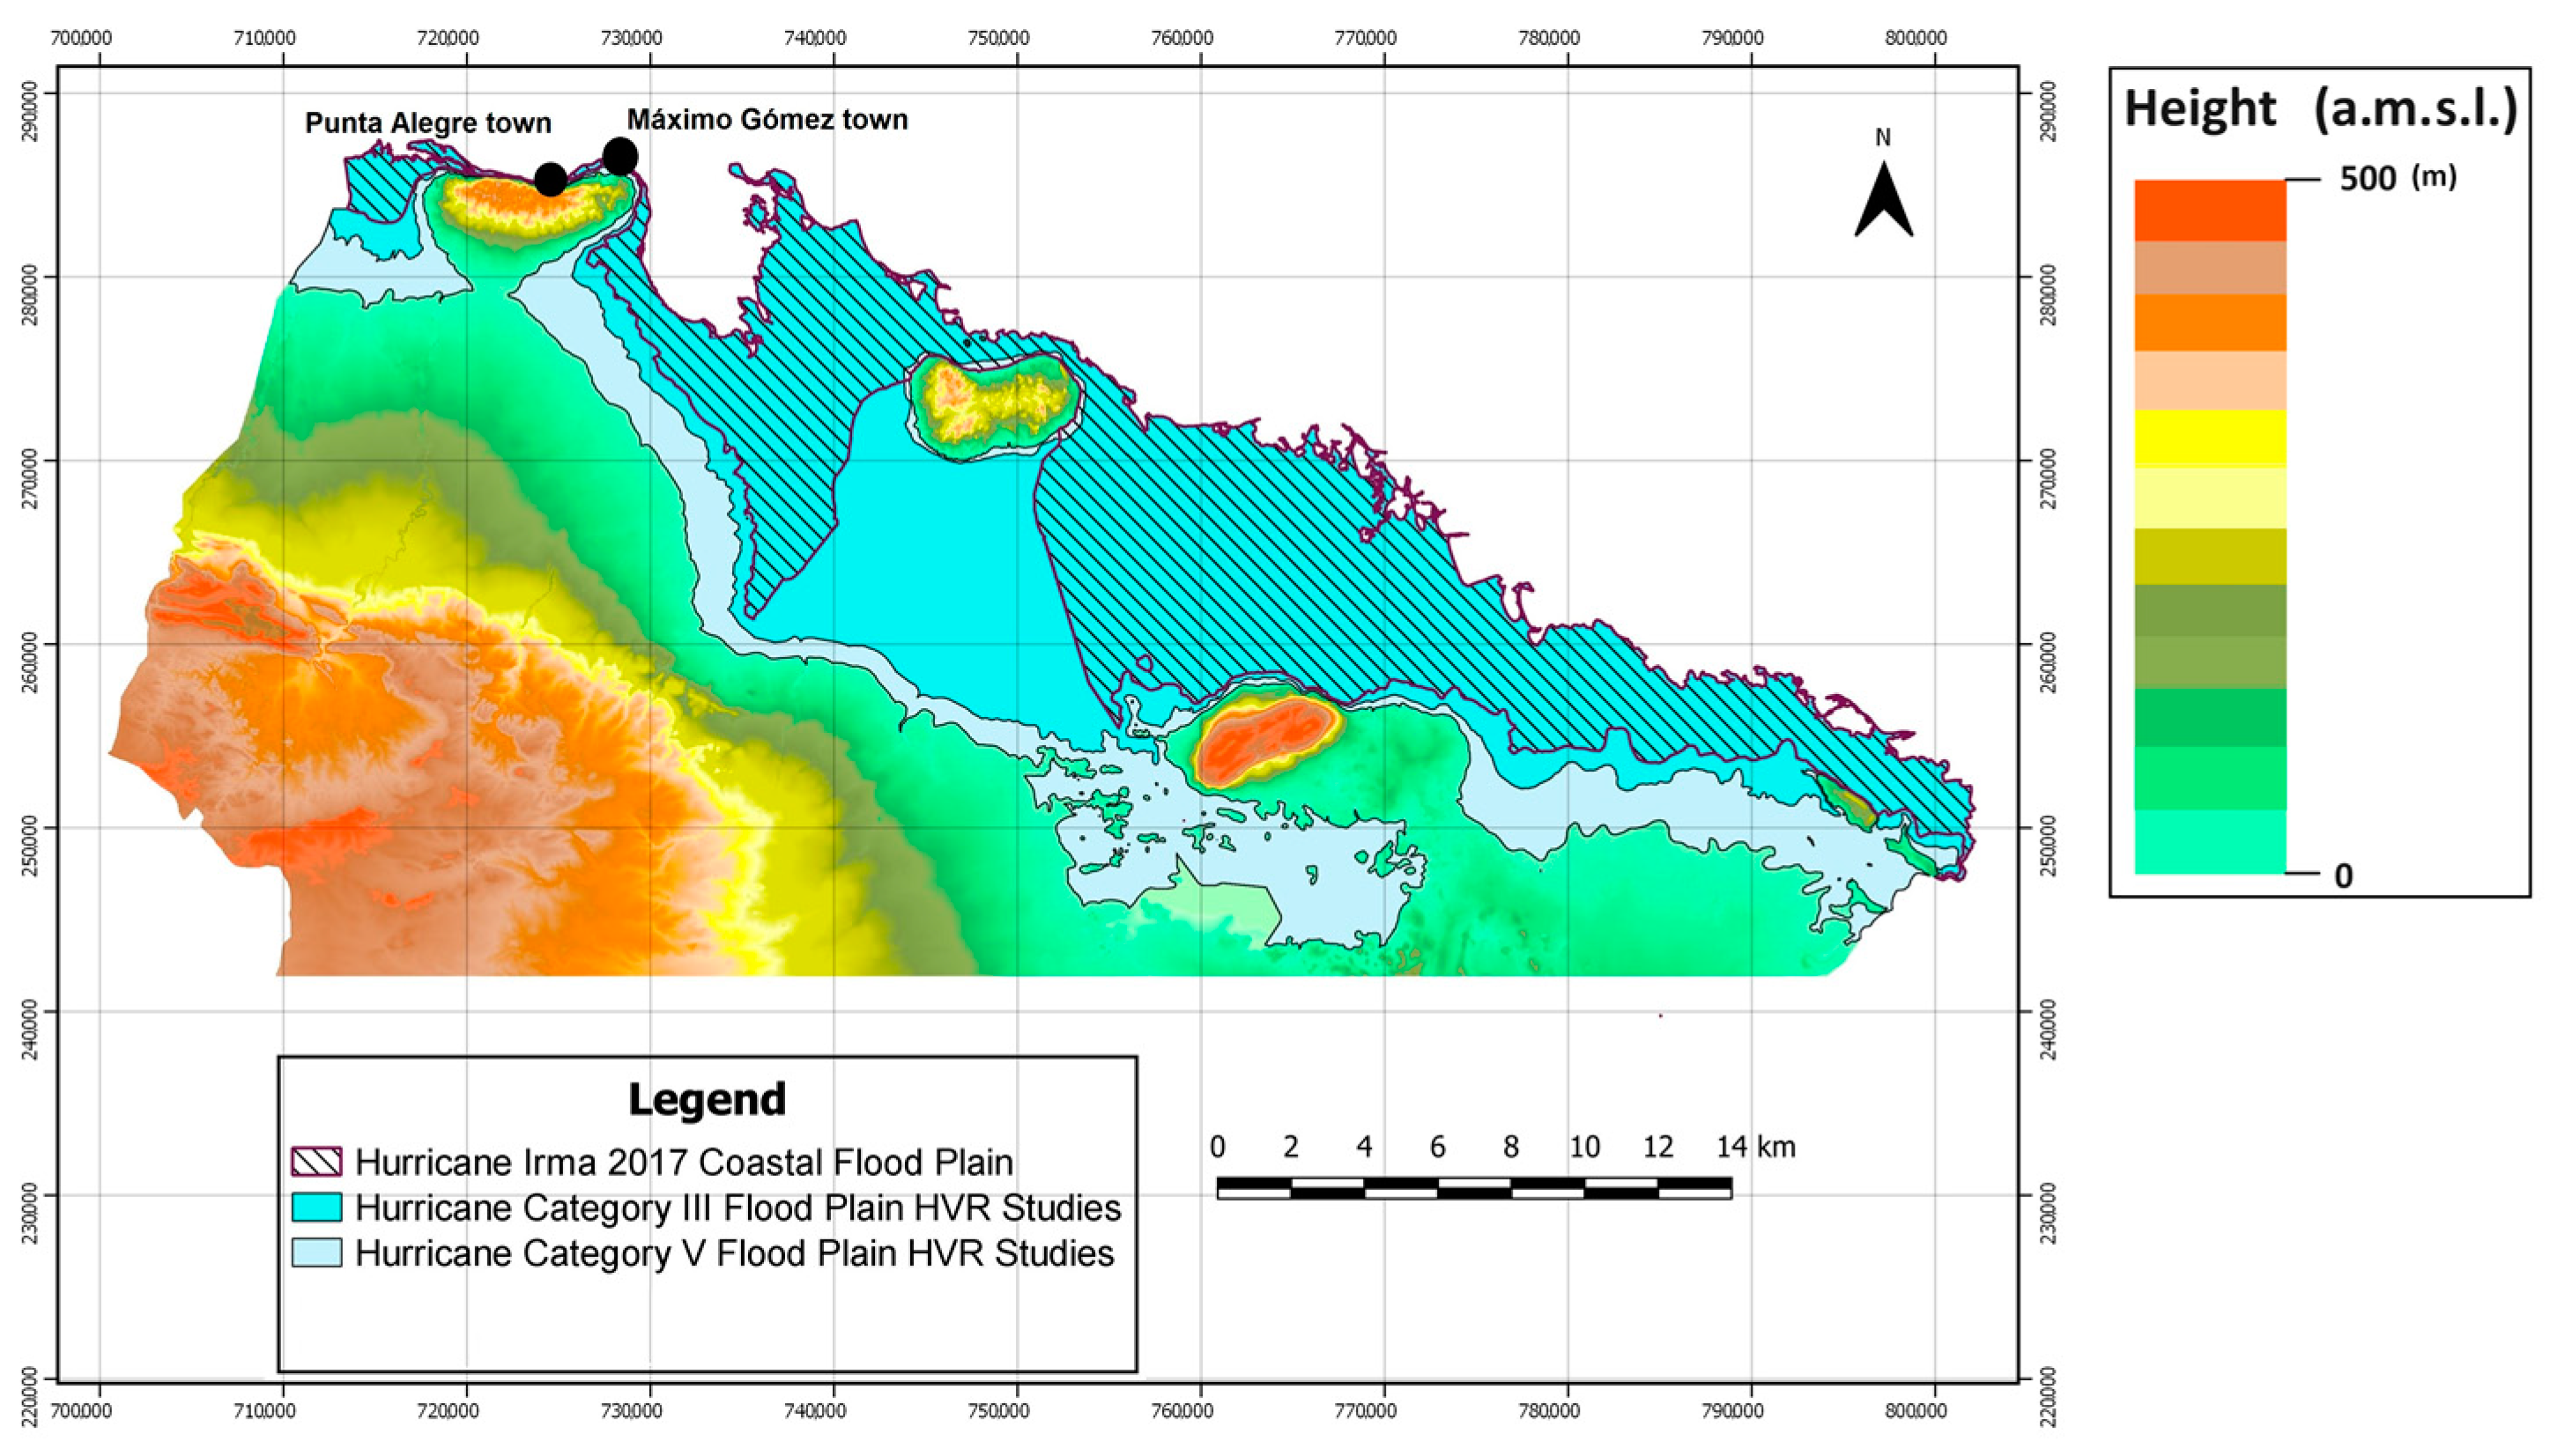
3.3. Coastal Flooding Associated with Hurricane Irma—Comparison with Previously Modeled Hazard Scenarios

The comparison of coastal flooded areas related to Hurricane Irma with previously modeled hazard scenarios shows that, on the southern coast, only in the constituency of Baraguá, the flooded area was larger than the modeled area (Figure 6). The hazard scenarios were modeled using the impact of a category 1 hurricane.
For the northern coast, hazard scenarios were modeled using intense hurricanes (categories 3 and 5) (Figure 7). In some surveyed coastal portions, the water level did not reach a height of 2 m. Previously modeled hazard scenarios (with both hurricane categories) showed that at least 22 constituencies would have been flooded; however, Hurricane Irma did not cause flooding in 8 of these constituencies. For the evaluated coastal portions, flooded areas related to Hurricane Irma were less than those of the hazard scenarios modeled using intense hurricanes (categories 3 and 5). Differences among the areas were more evident in the Bolivia and Morón municipalities, and these differences were bigger for category 3 hurricane hazard scenarios, particularly in the municipality of Morón (Figure 7 and Table 4).
Despite the differences between the Hurricane-Irma-related flooded areas and the modeled areas, the constituencies of Punta Alegre on the northern coast and Júcaro on the southern coast were the most severely impacted by flooding. Locals from both constituencies had never experienced flooding of these proportions. Hurricane risk perception by the local people is an important variable in dealing with disasters and mitigating their impact.

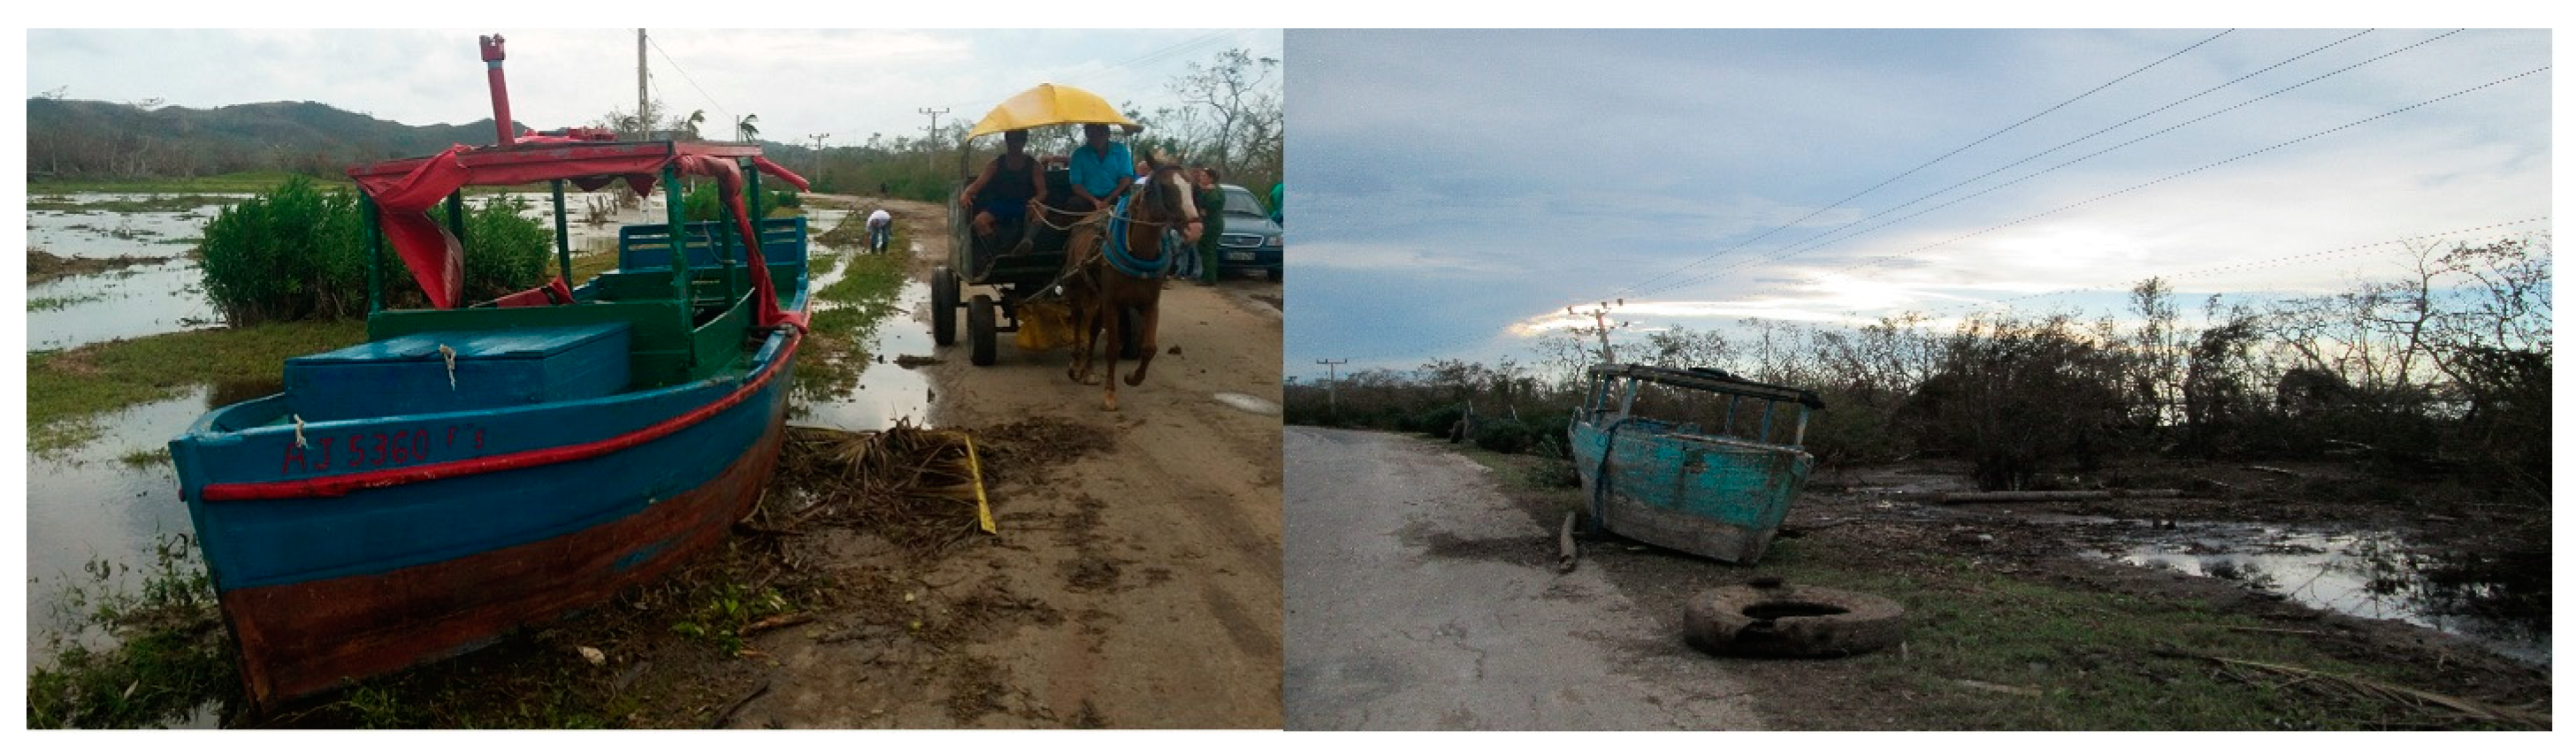
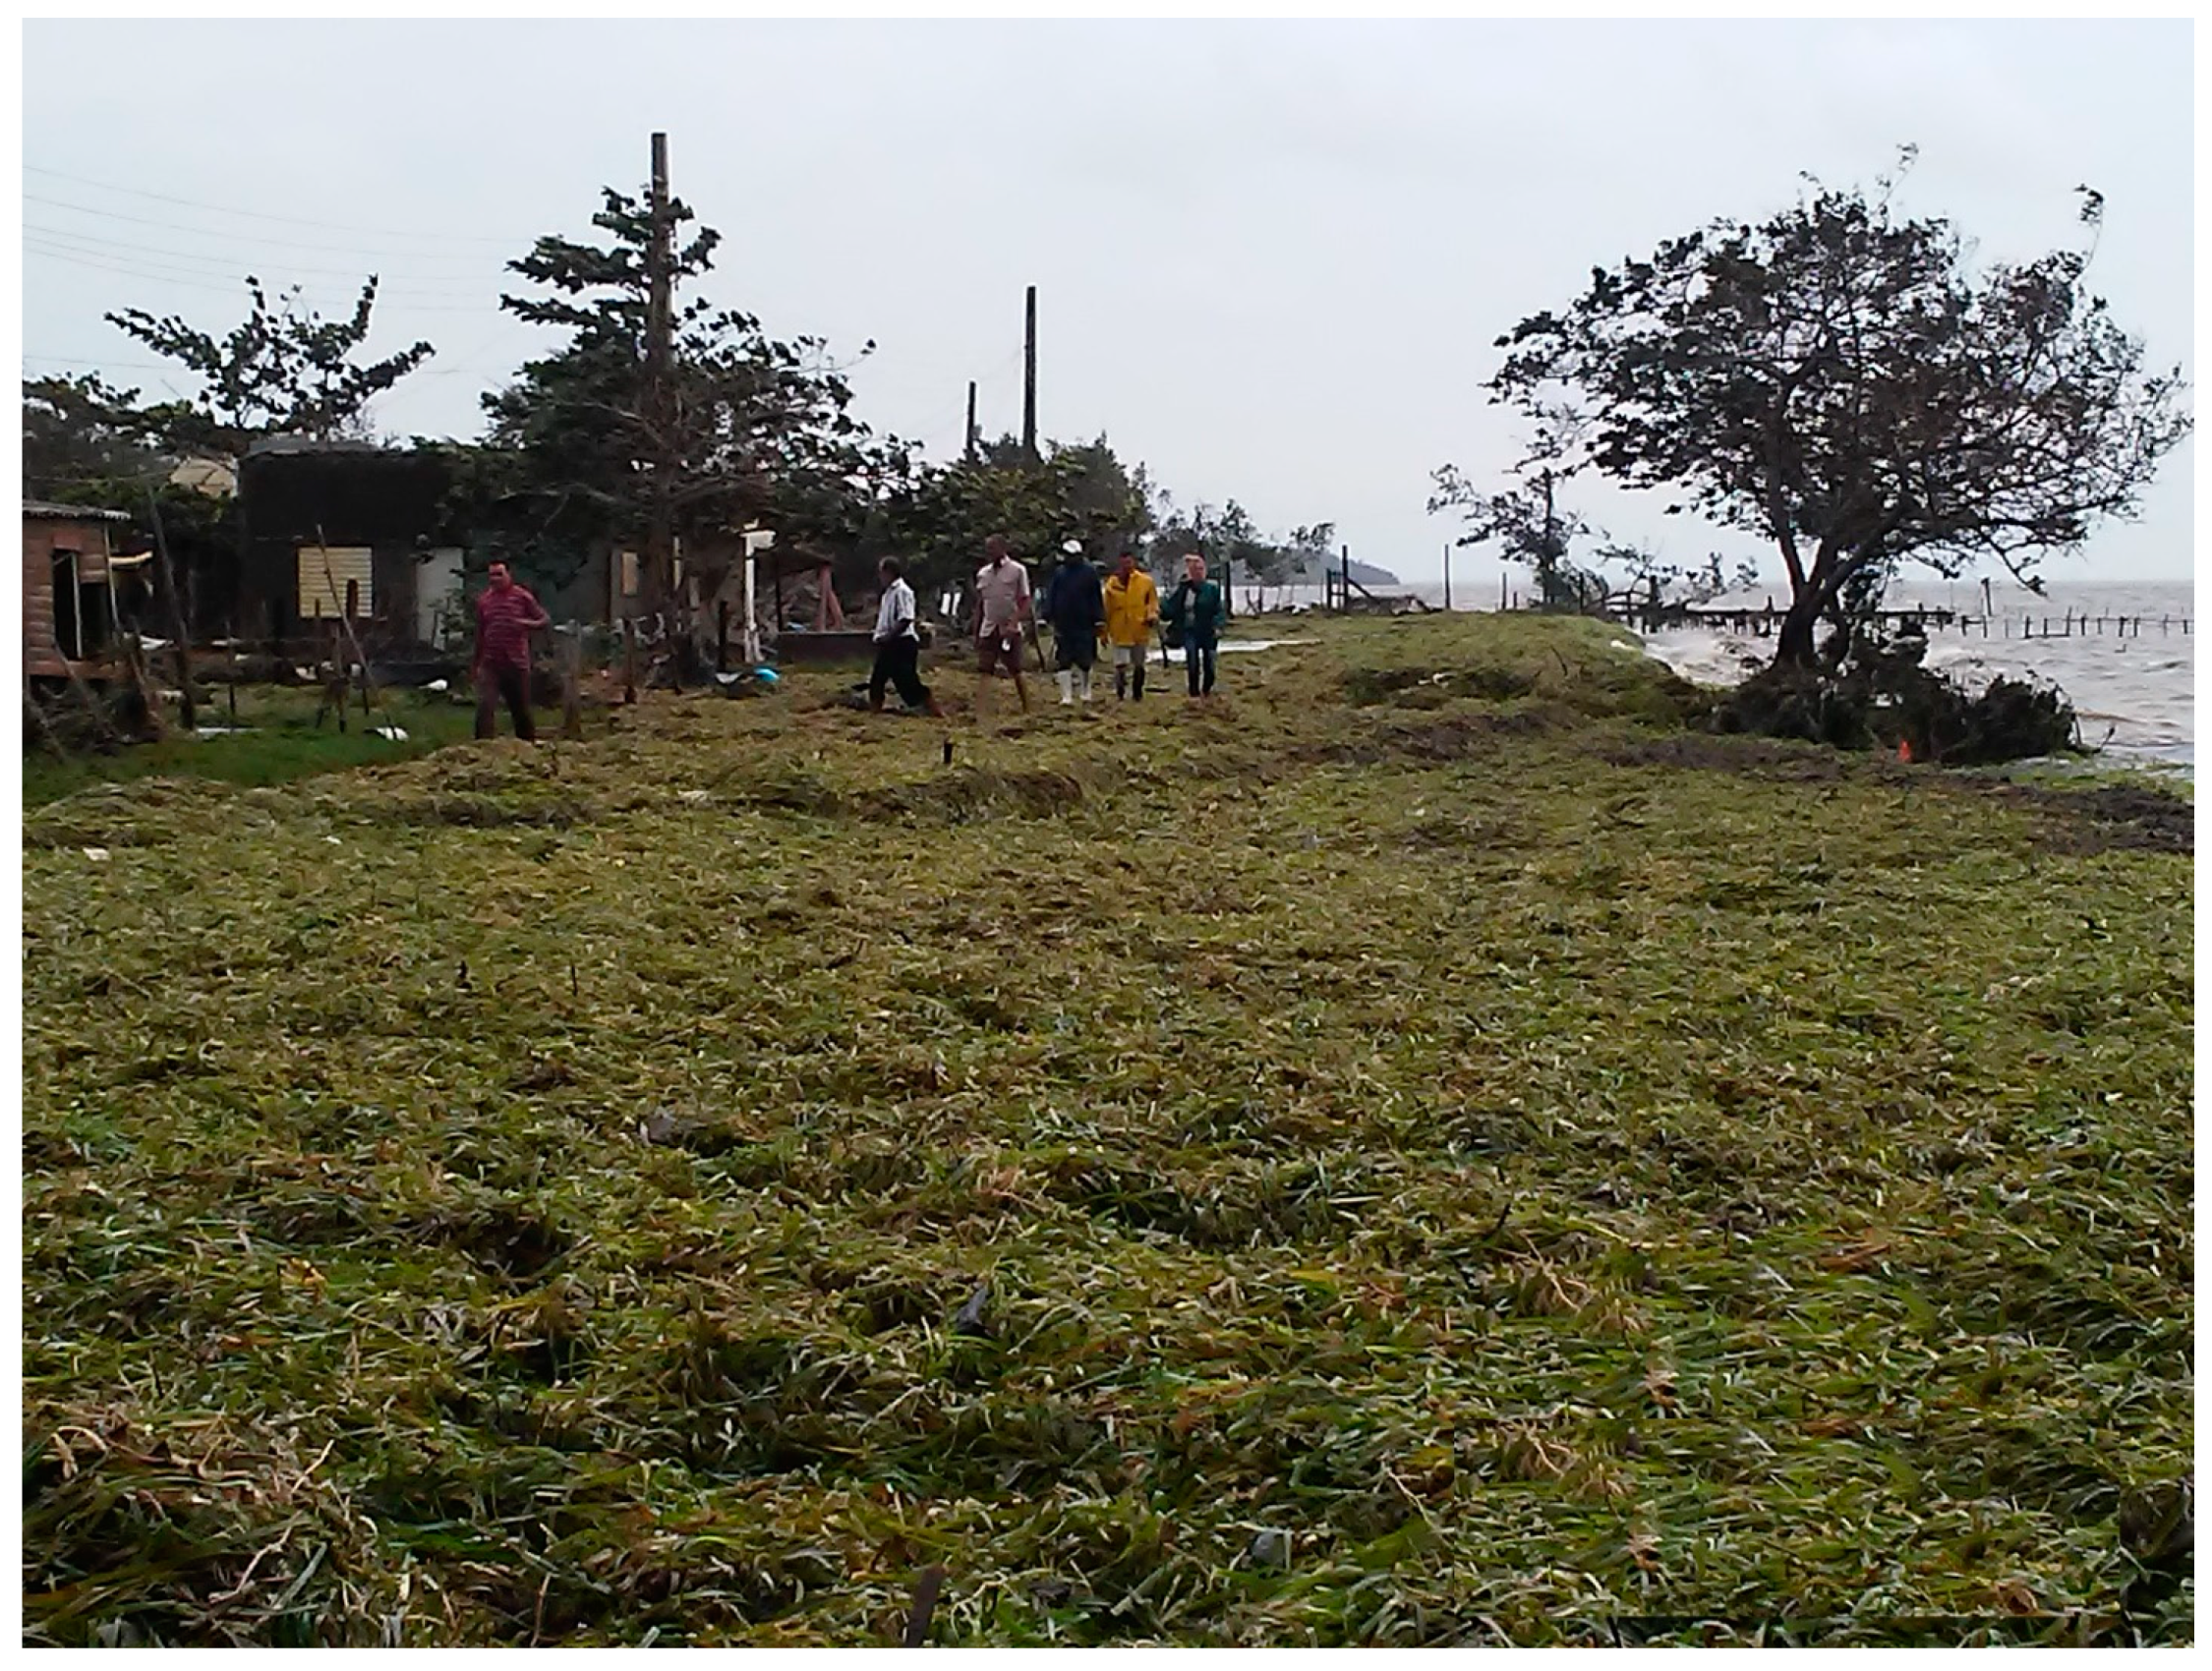
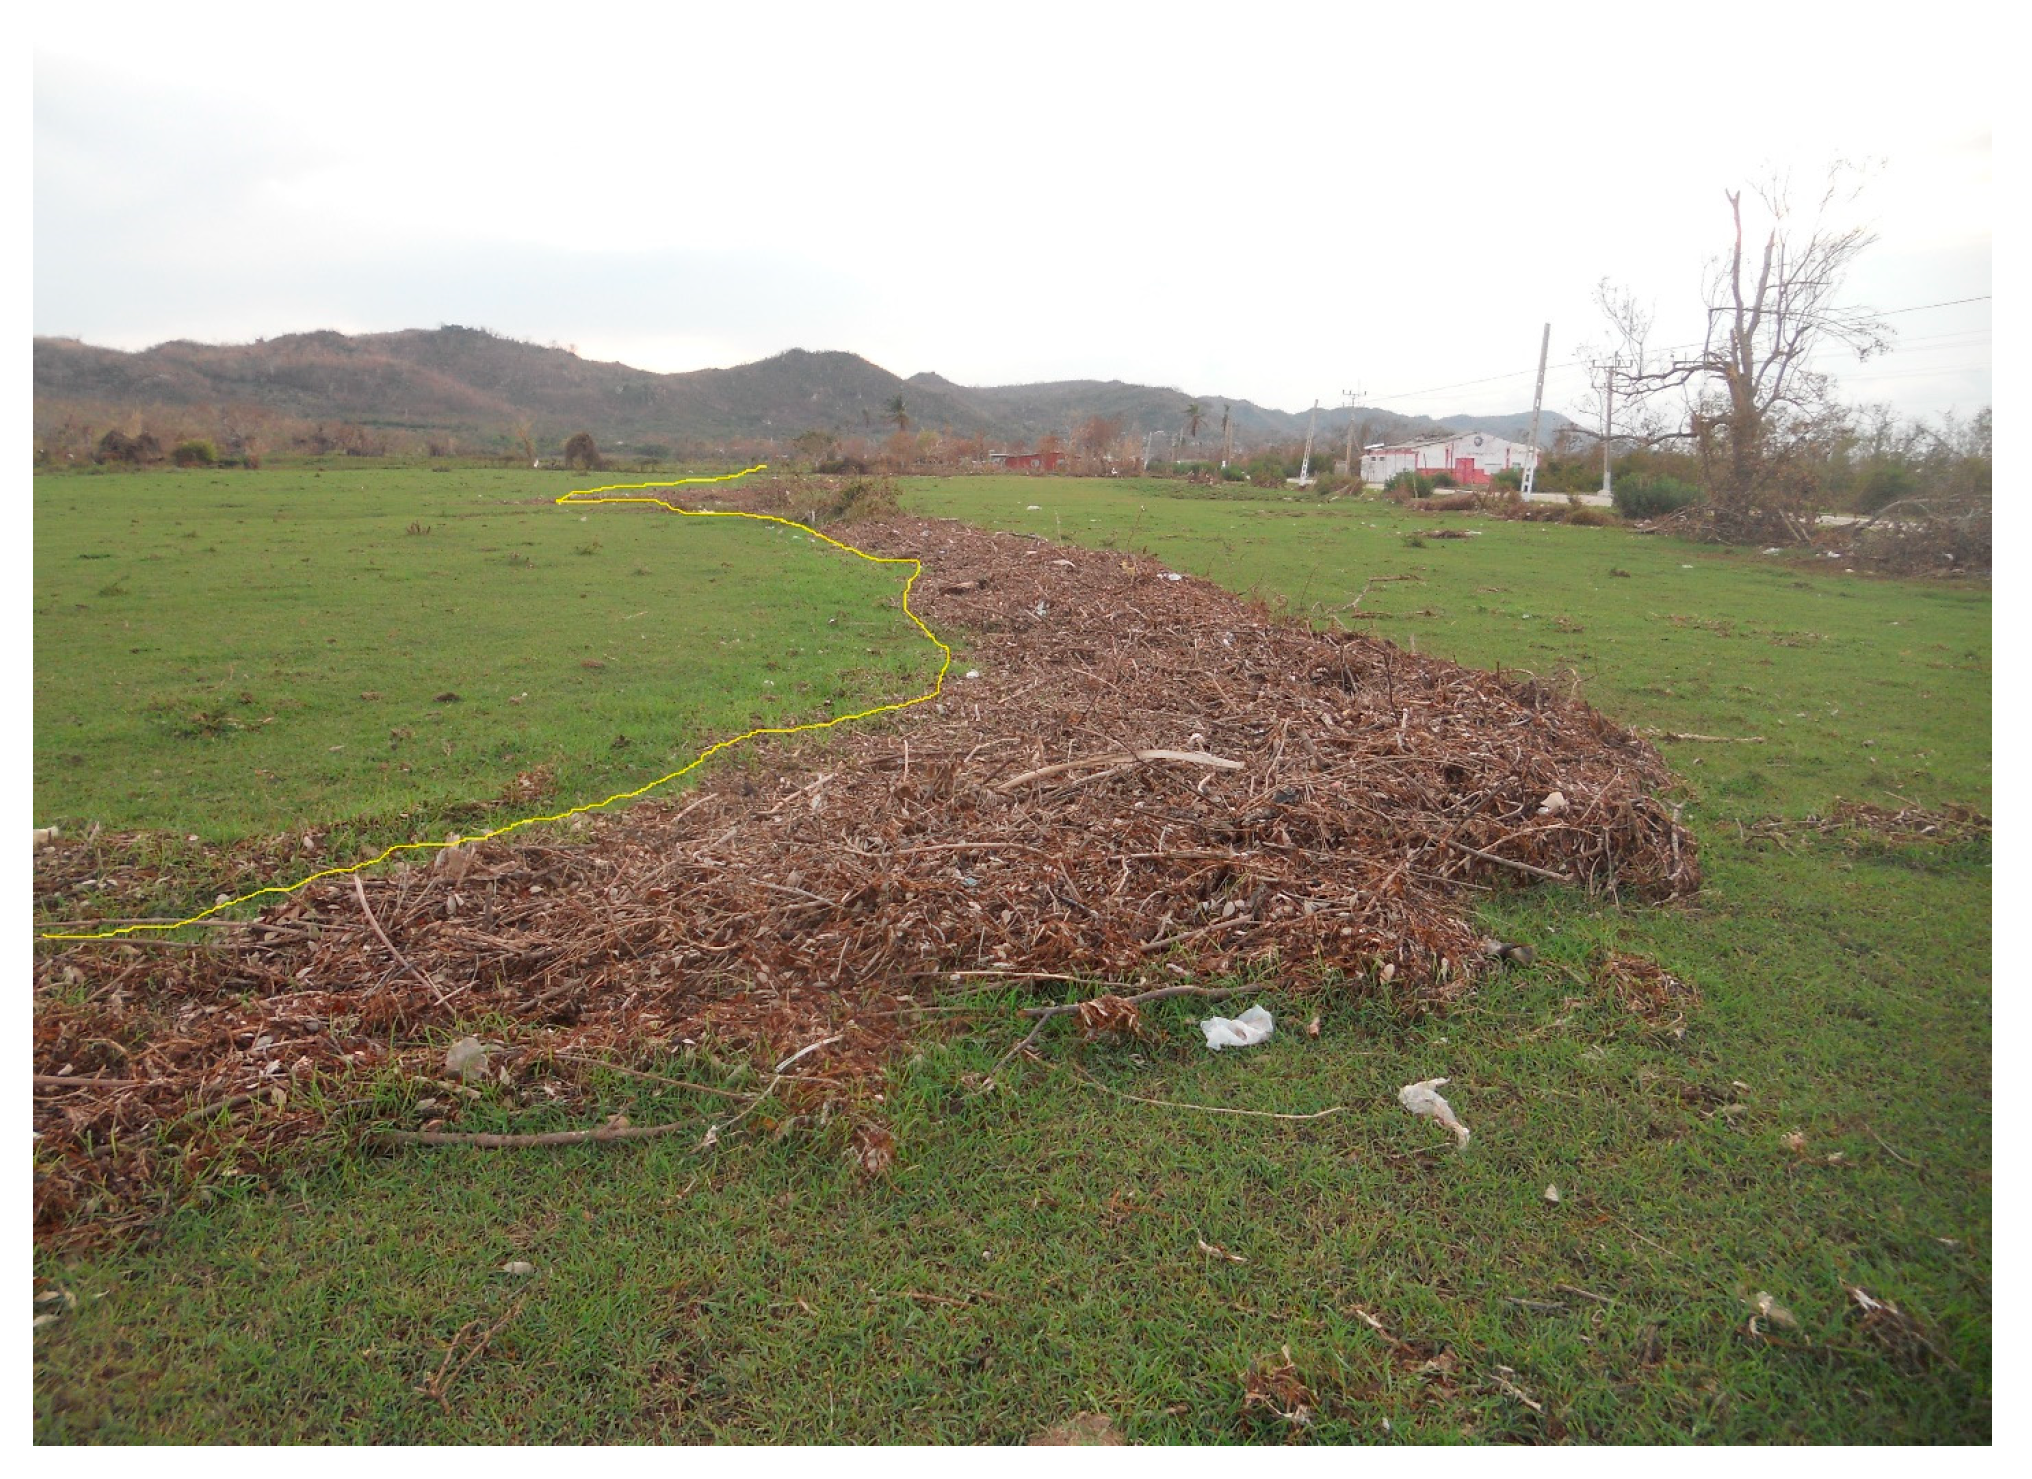
3.4. Socioeconomic Effects of Hurricane Irma on the Constituencies of Venezuela and Chambas

The municipalities of Venezuela and Chambas were the most affected by Hurricane Irma in the Ciego de Ávila province. The impacts were more severe on the coastal settlements (constituencies) of Júcaro and Punta Alegre, in the municipalities of Venezuela and Chambas, respectively (Figure 1). In Júcaro, 18.2% of the area of the constituency (208.7 km2) was covered by flooding related to Hurricane Irma (Figure 8); however, more than a quarter of the houses were flooded. Table 5 summarizes data from local government and houses reported as affected. The authorities included the wind-related effects too.
Using the methodology for the evaluation of flooded areas, it was estimated that the storm surge moved inland 600–700 m in the town of Júcaro. The mean water level reached 0.88 m (a.m.s.l) on the southern coast (Figure 8). Large volumes of seagrass Thalassia testudinum were pushed inland, in some cases dozens of meters from the coastline (Figure 9).
In the town of Punta Alegre, the flooded area (24.4%) was larger than that of Júcaro. However, the sea penetrated only 100 m from the coastline, (probably due to the low relief) and the water level reached 2.0 m (a.s.l). In the town of Máximo Gomez, near Punta Alegre, the greatest impacts were mostly related to tree falls rather than to flooding (Figure 10).
In Punta Alegre, boats were pushed inland by flooding although they were moored in the Los Buchillones coastal lagoon and protected by mangrove forests (Figure 11). Large volumes of seagrass Thalassia testudinum were also pushed inland by the storm surge, which eventually helped to estimate the flooded area because of the seagrass mark (Figure 12).
The coastal flooding associated with Hurricane Irma affected the Los Buchillones archeological site (relevant for Caribbean archeology). This site (located near Punta Alegre) was completely flooded due to its location (center of the Los Buchillones Lagoon); damage was significant at the site (Figure 13).

4. Discussion

Hurricane Irma was an intense and destructive hurricane that hit the northern Caribbean Islands and the United States in 2017. It destroyed many social and economic infrastructures in these islands with an unprecedented storm surge and sea level rise. However, only in the islands of Antigua and Barbuda, the storm surge was higher than in Cayo Coco (northern coast of Ciego de Ávila); and only in Fort Pulaski (USA), Antigua and Barbuda, and Cayo Coco, the storm surge was higher than in Punta Alegre, in the northern coast of Ciego de Ávila [29] (Table 6). As in Punta Alegre and Júcaro, significant flooding occurred in some places in Havana, considered similar to those related to the storm of March 1993 (known as the Storm of the Century) and to Hurricane Wilma (category 3) in October 2005.
The flooding related to Hurricane Irma was primarily due to rising sea levels as a result of high winds, low pressure, and waves. Rainfall did not bring about flooding events because reservoirs had enough capacity for the rain volumes and runoffs associated with Hurricane Irma due to the 2014 dry period [30,31]. Strong winds and coastal floodings were the principal climatic processes associated with Hurricane Irma, and although the former affected an area larger (most of the province) than the area affected by the latter, the floodings were severe and reached places that had never been flooded before according to historical data [19].
Tsunamis and hurricanes are the main causes of coastal flooding [32]. On a global scale, there are many reports about hurricane-related storm surge impacts in Bangladesh [33] and México [34]. In Cuba, the most destructive natural phenomenon killed more than 3000 people in November 1932, due to storm surge and flooding related to the intense Hurricane of Santa Cruz del Sur. In Ciego de Ávila, the main cause of coastal flooding between 1960 and 2017 was the impact of hurricanes on or near this region of Cuba [19].
The calculated flooded areas associated with Hurricane Irma were smaller on both coasts of the province than those in previous modeled hazard scenarios (for intense hurricanes). In the municipality of Morón, the difference between the flooded area and the modeled area was 23% (35% of the total area vs. 58% of the total modeled area) [35,36]. Planos and Gutiérrez [37] reported that, based on models, with the impact of categories 1, 3, and 5 hurricanes, large areas of Cuba would be flooded (8196.2, 12,997.8, and 17,737.6 km2, respectively). However, our results show that the calculated flooded areas were overestimated. Even in the municipality of Morón, where the largest flooded area was estimated, we found that it was smaller than the area modeled for a category 1 hurricane.
For the northern coast of the province, the overestimated flooded area (for a category 5 hurricane) doubled (1213.6 km2) the flooded area associated with Hurricane Irma (644.6 km2). For the southern coast, the overestimated area (modeled scenario for a category 1 hurricane) was 1.5 times larger than the flooded area associated with Hurricane Irma. However, in this case, the models used the hurricane’s path over the northern coast (Hurricane Irma), and there could be more danger for the southern coast in case of an intense hurricane crossing the province from south to north. Even in this context, the locals from Júcaro had never seen similar flooding. The results of this study suggest that new hazard scenarios must be modeled (using intense hurricanes with different paths) to estimate the possible flooded areas on the southern coast of Ciego de Ávila.
What could explain the differences between the flooded areas related to Hurricane Irma and those of the modeled scenarios is that the modeling processes (for different hurricane categories) used the bathymetry and topography of the coastal zone without natural barriers such as coral reefs, mangrove forests, sand dunes, and coastal lagoons. Some studies showed the protective effect of these coastal ecosystems against the impacts of hurricanes in coastal zones [38,39,40]. Therefore, one of the lessons learned from this study is that the models used to calculate potentially flooded areas in the Cuban coastal zones must use new hazard scenarios and include the protective coastal ecosystems. This aspect is more important now, when some authors are reporting an increase in the frequency of intense hurricanes in the North Atlantic Basin [41,42].
In the Caribbean, Hurricane Irma caused large floods in the Saint Martin and Saint Barthelemy Islands, with significant differences between flooded areas in urbanized and non-urbanized sites [43]. In Saint Martin Island, the recovery of mangroves damaged by Hurricane Irma was slower in healthy mangrove forests than that of those affected by anthropic development [44]. In the Florida Keys, the strong winds of Hurricane Irma (more than 177 km/h) caused severe damage; however, such damage was more evident and destructive in areas without mangrove forests [38,45].
Another conclusion drawn from the results of this study is that coastal settlements such as Júcaro must be resettled away from the coastline due to its vulnerability. Hurricane Irma moved along the north coast of Cuba; however, Júcaro (southern coast) was one of the sites most affected by flooding in the province of Ciego de Ávila. At the same time, the differences between the flooded areas due to Hurricane Irma and the previous modeled hazard scenarios showed the importance of coastal ecosystems as protective barriers against natural destructive phenomena such as intense hurricanes. The vulnerability of an important archeological site (Los Buchillones) is another lesson that must be considered. A new proposal for the protection and management of this site will be made to preserve the wooden pieces and other archeological records.
Although, in the last few years, Cuba has implemented an advanced methodology to evaluate damage after the impacts of natural phenomena such as hurricanes, this study is the first that evaluated and calculated the flooded areas in coastal zones of central Cuba. Our results will be useful for the implementation of governmental strategies to assess and manage hurricane-related hazards and risks in this part of the island.

5. Conclusions

The northern and southern coasts of the Ciego de Ávila province were affected by flooding related to the passage of Hurricane Irma. The evidence and the testimonies of the local people support the conclusion that these events have been the most intense ever in some towns of the province. The flooded area was larger on the northern than on the southern coast, particularly in places such as Turiguanó (municipality of Morón), Bolivia, and La Loma (municipality of Bolivia). Two coastal towns were the most socioeconomically affected by flooding: Punta Alegre (municipality of Chambas) and Júcaro (municipality of Venezuela). The differences between the flooded areas associated with Hurricane Irma and those in the previous modeled hazard scenarios using hurricanes of different categories (1, 3, and 5) were evident. The principal cause of such differences could be flood modeling without consideration of the natural barriers present in the coastal zones (mangrove forests, coral reefs, sand dunes, and coastal lagoons). In the future, mitigation actions to be undertaken by the local and national authorities must be based on data from scenarios in which the natural barriers have been included. The results of this study will be useful for decision-makers to mitigate hurricane-related impacts such as floods and damaging winds.

Author Contributions

Conceptualization: F.M.-P., M.C.P. and O.E.P.-L.; methodology: F.M.-P., M.C.P., R.G.-D.Z., A.V.-J. and O.E.P.-L.; maps: A.V.-J., O.E.P.-L. and F.Á.-T.; investigation: F.M.-P., M.C.P., R.G.-D.Z. and A.V.-J.; statistical analysis: R.G.-D.Z. and F.M.-P.; writing: F.M.-P., R.S., M.C.P. and R.G.-D.Z.; supervision: M.C.P., R.G.-D.Z., F.M.-P., R.S. and F.Á.-T. All authors have read and agreed to the published version of the manuscript.

Funding

This work was supported by the national project “Paleotempestología en Cuba: variabilidad espacio-temporal de la actividad de huracanes usando proxy data” of the Cuban government (Code: P104LH001-049) and by the Emerging Leaders of the Americas Program (ELAP) scholarships.

Institutional Review Board Statement

Not applicable.

Informed Consent Statement

Not applicable.

Data Availability Statement

The data used are available from the sources cited. No new data were generated.

Acknowledgments

Our deepest appreciation to the Climate and Environmental Change Research Laboratory of Bishop’s University and to the Emerging Leaders of the Americas Program (ELAP) scholarships, without their support, this research would not have been possible. Rogert Sorí acknowledges the support from the postdoctoral grant Ramón y Cajal (RYC2021-034044-I), financed by the Spanish Ministry of Science and Innovation.

Conflicts of Interest

The authors declare no conflict of interest.

References

  1. IPCC. Cambio climático 2014. Impactos, adaptación y vulnerabilidad. In Field; Barros, C.V., Jon Dokken, V.R., Mach, D., Mastrandrea, K.J., Bilir, M.D., Chatterjee, T.E., Ebi, M., Otsuki Estrada, K.L., Genova, Y., Girma, R.C., et al., Eds.; Copa: Geneva, Switzerland, 2014. [Google Scholar]
  2. Furrazola, G.F.; Núñez, K.E. Estudios Sobre Geología de Cuba/Compilación; Centro Nacional de Información Geológica (CNDIG), Ed.; Instituto de Geología y Paleontología: La Habana, Cuba, 1997; pp. 509–527. [Google Scholar]
  3. Mitrani, I. Las Inundaciones Costeras en Cuba y su Repercusión Social. Bioética/Septiembre–Diciembre, 2006. Available online: http://www.cbioetica.org/revista/63/630410.pdf (accessed on 17 October 2019).
  4. Iturralde-Vinent, M.A. Huracanolitos, Eventos de Oleaje Extremo y Protección de las Obras Costeras. 2017. Available online: http://www.redciencia.cu/geobiblio/inicio.html (accessed on 18 July 2020).
  5. Mitrani, I.; Fontova, M.; Díaz, L.; González, J. Determinación del Régimen de Ola y Viento en la Costa Norte de la Habana. IV Exposición Forjadores Del Futuro; Centro de Información y Divulgación de las BTJ: La Habana, Cuba, 1986; 15p. [Google Scholar]
  6. Mitrani, I.; Díaz, L.; Pérez, P.; González, J. Características Hidrometeorológicas Generales de la Zona Costera Correspondiente al Malecón Habanero: Informe de Resultado Científico; Biblioteca INSMET: La Habana, Cuba, 1994; 38p. [Google Scholar]
  7. Portela, M. Elaboración de un Método Sinóptico–Estadístico Para el Pronóstico de la Ocurrencia de Inundaciones Costeras en Cuba; Proyecto Cuba/94/003; Instituto de Meteorología—PNUD: La Habana, Cuba, 1998; pp. 46–63. [Google Scholar]
  8. Pérez-Osorio, P.J.; Casals, R.; del Sol, A.; Díaz, L. Análisis de los fenómenos meteorológicos que provocaron penetraciones del mar en el malecón habanero. Rev. Cuba. Meteorol. 2001, 8, 50–58. [Google Scholar]
  9. Casals, R. Cronología de las inundaciones costeras ocurridas en el sur de la provincia La Habana. Rev. Cuba. Meteorol. 2002, 9, 90–95. [Google Scholar]
  10. Regueira, V.A.; Barcia, S. Cronología de inundaciones costeras por penetración del mar, en la provincia Cienfuegos. Rev. Cuba. Meteorol. 2019, 25, 278–290. [Google Scholar]
  11. Hidalgo, A.; Hernández, N.; Perigó, E. Períodos de retorno para las inundaciones costeras y los eventos extremos de viento y oleaje en la costa nororiental de Cuba. Rev. Cuba. Meteorol. 2019, 25, 191–202. [Google Scholar]
  12. Hidalgo, A. Metodología para el Estudio Climático de las Inundaciones Costeras en Cuba. Master’s Thesis, Instituto Superior de Tecnologías y Ciencias Aplicadas (InSTEC), La Habana, Cuba, 2016; 73p. [Google Scholar]
  13. Casals, R.; Pérez, P.; Menéndez, L. Análisis de las inundaciones costeras ocurridas en áreas protegidas de Cuba en el período 1981–2010. Rev. Cuba. Meteorol. 2016, 22, 199–215. [Google Scholar]
  14. Hidalgo, A.; Mitrani, I.; Pérez, G. Nueva clasificación de las inundaciones costeras en Cuba. Rev. Cuba. Meteorol. 2017, 23, 209–216. [Google Scholar]
  15. Córdova, O.L.; García, M.; López, A. Cronología de las inundaciones costeras en la provincia de Ciego de Ávila. Período 1960–2017. Rev. Cuba. Meteorol. 2018, 24, 136–145. [Google Scholar]
  16. Matos-Pupo, F.; Peros, M.; Rodríguez, Y.; Hernández-Fernández, L.; Guash, F. Depósitos de huracanolitos en Jardines de la Reina (Cuba) provocados por oleajes extremos: Paleohuracanes o paleotsunamis? In Proceedings of the XI Congreso de Ciencias del Mar (MarCuba), Palacio de Convenciones, La Habana, Cuba, 15–19 October 2018. Available online: http://www.congresomarcuba.com (accessed on 17 October 2019).
  17. Pérez, R.; Vega, R.; Limia, M. Los huracanes más intensos y desastrosos de Cuba en los últimos dos siglos. Bol. Soc. Meteorol. Cuba. 2001, 7, 9p. [Google Scholar]
  18. AMA. Lineamientos Metodológicos para la Realización de los Estudios de Peligro, Vulnerabilidad y Riesgos de Desastre de Inundación por Penetración del Mar, Inundaciones por Intensas Lluvias y Afectaciones por Fuertes Vientos; Agencia de Medio Ambiente, CITMA: Havana, Cuba, 2008. [Google Scholar]
  19. Córdova, O.L.; García, M.; Machado, A.; Borrego, R. Huracanes que afectaron a Ciego de Ávila y sus periodos de retorno. Periodo 1851 a 2017. Rev. Cuba. Meteorol. 2018, 24, 245–255. [Google Scholar]
  20. Matos, F.; López, O.E.P.; Jorge, A.V. Hurricane Related Coastal Flooding in the Province of Ciego de Avila, Cuba: Hazard, Vulnerability and Risk Study. In Proceedings of the 3rd International Conference on BioGeoSciences; Cayos de Santa Maria, Villa Clara, Cuba, 23–30 June 2019; Cardenas, R., Mochalov, V., Parra, O., Martin, O., Eds.; Springer Proceedings in Earth and Environmental Sciences. Springer: Cham, Swizterland, 2022. [Google Scholar] [CrossRef]
  21. UMA. Informe de Evaluación del Impacto Ambiental de Desastre Provocado por Irma (Huracán de Gran Intensidad) en la Provincia Ciego de Ávila; Unidad De Medio Ambiente CITMA Ciego de Ávila: Ciego de Ávila, Cuba, 2017; 33p. [Google Scholar]
  22. Centro de Inspección y Control Ambiental (CICA). Guías para la Realización de las Solicitudes de Licencia Ambiental y los Estudios de Impacto Ambiental; Editorial CITMA: Havana, Cuba, 2009; 94p. [Google Scholar]
  23. Iturralde-Vinent, M.A. Compendio de Geología de Cuba y el Caribe, 2nd ed.; CITMATEL (Empresa de Tecnologías de la Información y Servicios Telemáticos Avanzados): La Habana, Cuba, 2012. [Google Scholar]
  24. Pardo, M.E. (Ed.) Geology of Cuba. In Regional Geology Reviews; Springer: Berlin/Heidelberg, Germany, 2021; 332p. [Google Scholar] [CrossRef]
  25. Gómez-Martín, M.B.; Matos-Pupo, F.; Bada-Díaz, R.; Escalante-Pérez, D. Assessing Present and Future Climate Conditions for Beach Tourism in Jardines del Rey (Cuba). Atmosphere 2020, 11, 1295. [Google Scholar] [CrossRef]
  26. ONEI. Anuario Estadístico de Cuba 2020. Agricultura, Ganaderia, Silvicultura y Pesca. 2021. Available online: https://www.onei.gob.cu/sites/default/files/agropecuario_-2020_0.pdf (accessed on 3 September 2023).
  27. ONEI. Anuario Nacional de Estadística. 2017. Available online: http://www.onei.gob.cu (accessed on 19 October 2022).
  28. ONEI. Censo de Población y Viviendas. 2012. Available online: http://onei.gob.cu/publicaciones-censos (accessed on 18 March 2022).
  29. Cangialosi, J.P.; Latto, A.S.; Berg, R. National Hurricane Center Tropical Cyclone Report, Hurricane Irma (AL112017); National Hurricane Center, National Oceanic and Atmospheric Administration: Miami, FL, USA, 2021. Available online: https://www.nhc.noaa.gov/data/tcr/AL112017_Irma.pdf (accessed on 4 March 2023).
  30. Barcia-Sardiñas, S.; Fontes-Leandro, M.; Ramírez-González, M.; Viera-González, E.Y. La sequía meteorológica 2014–1017, características e impactos en la provincia Cienfuegos. Rev. Cuba. Meteorol. 2019, 25, 319–333. [Google Scholar]
  31. Valero-Jorge, A.; González-De Zayas, R.; Alcántara-Martín, A.; Álvarez-Taboada, F.; Matos-Pupo, F.; Brown-Manrique, O. Water area and volume calculation of two reservoirs in Central Cuba using remote sensing methods. A new perspective. Rev. Teledetección 2022, 60, 71–87. [Google Scholar] [CrossRef]
  32. CENAPRED. Facículo de Ciclonestropicales. 2003. Available online: https://www.gob.mx/cenapred/documentos/fasciculo-ciclones-tropicales (accessed on 5 March 2022).
  33. Frank, N.L.; Husain, S.A. The deadliest tropical cyclone in history? Bull. Am. Meteorol. Soc. 1971, 52, 438–444. [Google Scholar] [CrossRef]
  34. Rosengaus, M. Efectos Destructivos de Ciclones Tropicales; MAPFRE: Mexico City, Mexico, 1998; Available online: https://www.mapfrere.com/publicaciones/efectos-destructivos-ciclones-tropicales/ (accessed on 5 March 2022).
  35. Moreno-Suárez, O.; Rodríguez-Ríos, Y.; Matos-Pupo, F.; López-Mayea, A.; González-Abreu, R.; Rodríguez-Cueto, Y.; González-Ramírez, I.; Rodríguez-Zayas, M.; Hernández-Hernández, S.; Vidal-Olivera, V.; et al. Estudio de Peligro, Vulnerabilidad y Riesgos de Desastres de Inundaciones por penetraciones del Mar, Inundaciones por Intensas Lluvias y Afectaciones por Fuertes Vientos en la Provincia Ciego de Ávila; Ministerio de Ciencia, Tecnología y Medio Ambiente (CITMA): Ciego de Ávila, Cuba, 2011; 118p. [Google Scholar]
  36. AMA. Escenarios de Peligro y Vulnerabilidad de la Zona Costera Cubana, Asociados al Ascenso del Nivel Medio del Mar para los Años 2050 y 2100; Resumen anual de los resultados del Macro Proyecto; Agencia de Medio Ambiente: La Habana, Cuba, 2019. [Google Scholar]
  37. Planos, E.O.; Gutiérrez, T. (Eds.) Tercera Comunicación Nacional a la Convención Marco de Naciones Unidas Sobre Cambio Climático; CITMA: Ciego de Ávila, Cuba, 2020; 403p. [Google Scholar]
  38. Liu, H.; Zhang, H.; Li, Y.; Xie, L. Numerical study of the sensitivity of mangroves in reducing storm surge and flooding to hurricane characteristics in southern Florida. Cont. Shelf Res. 2013, 64, 51–65. [Google Scholar] [CrossRef]
  39. Marino-Tapia, I.; Enriquez, C.; Mendoza Baldwin, E.; Escalante Mancera, E. Comparative Morphodynamics between Exposed and Reef Protected Beaches under Hurricane Conditions. Coast. Eng. 2014, 34, 1–9. [Google Scholar] [CrossRef]
  40. Imbert, D. Hurricane disturbance and forest dynamics in east Caribbean mangroves. Ecosphere 2018, 9, e02231. [Google Scholar] [CrossRef]
  41. Elsner, J.B.; Kossin, J.P.; Jagger, T.H. The increasing intensity of the strongest tropical cyclones. Nature 2008, 455, 92–95. [Google Scholar] [CrossRef]
  42. Knutson, T.R.; McBride, J.L.; Chan, J.; Emanuel, K.; Holland, G.; Landsea, C.; Held, I.; Kossin, J.P.; Srivastava, A.K.; Sugi, M. Tropical cyclones and climate change. Nat. Geosci. 2010, 3, 157–163. [Google Scholar] [CrossRef]
  43. Rey, T.; Leone, F.; Candela, T.; Belmadani, A.; Palany, P.; Krien, Y.; Cécé, R.; Gherardi, M.; Péroche, M.; Zahibo, N. Coastal Processes and Influence on Damage to Urban Structures during Hurricane Irma (St-Martin & St-Barthélemy, French West Indies). J. Mar. Sci. Eng. 2019, 7, 215. [Google Scholar] [CrossRef]
  44. Walker, R.; Laplanche, C.; Herteman, M.; Lambs, L.; Fromard, F. Damages caused by hurricane Irma in the human-degraded mangroves of Saint Martin (Caribbean). Sci. Rep. 2019, 9, 18971. [Google Scholar] [CrossRef]
  45. Zhang, K.; Liu, H.; Li, Y.; Xu, H.; Shen, J.; Rhome, J.; Smith, T.J. The role of mangroves in attenuating storm surges. Estuar. Coast. Shelf Sci. 2012, 102–103, 11–23. [Google Scholar] [CrossRef]
Figure 1. Map of the study area.
Atmosphere 14 01445 g001
Figure 2. Digital Elevation Model map of the province Ciego de Ávila, including the four meteorological stations, source: Geocuba Agency.
Atmosphere 14 01445 g002
Figure 3. Images of Hurricane Irma over central Cuba. (a) Path of Hurricane Irma over Cuba. (b) Infrared image of Hurricane Irma over central Cuba (from http://www.noaa.gov). Accessed on 14 November 2017.
Atmosphere 14 01445 g003
Figure 4. Image of water level (approximately 0.9 m from the ground level) measured at a house in the town of Punta Alegre.
Atmosphere 14 01445 g004
Figure 5. Coastal floodplain associated with Hurricane Irma on both coasts of Ciego de Ávila province.
Atmosphere 14 01445 g005
Figure 6. Floodplain associated with Hurricane Irma (2017) and studies of hazard, vulnerability, and risks (HVR studies) for a category 1 hurricane in the southern coast of Ciego de Ávila.
Atmosphere 14 01445 g006
Figure 7. Floodplain associated with Hurricane Irma (2017) and HVR studies for two intense hurricanes (categories 3 and 5) on the northern coast.
Atmosphere 14 01445 g007
Figure 8. Hurricane-Irma-related floodplain in the coastal town of Júcaro, Source: Open Access Hub (copernicus.eu) Accessed on 28 November 2018.
Atmosphere 14 01445 g008
Figure 9. Seagrass Thalassia testudinum pushed inland by sea (due to storm surge) in the coastal town of Júcaro.
Atmosphere 14 01445 g009
Figure 10. Floodplain associated with Hurricane Irma in the towns of Punta Alegre and Máximo Gómez, respectively. Source: Open Access Hub (copernicus.eu).
Atmosphere 14 01445 g010
Figure 11. Boats pushed inland by Hurricane-Irma-related surge in Punta Alegre.
Atmosphere 14 01445 g011
Figure 12. Line of Thalassia testudinum moved by Hurricane Irma in the coastal sector of Punta Alegre. The yellow line was used as a reference to estimate the limits of coastal flooding.
Atmosphere 14 01445 g012
Figure 13. Floodplain lagoon associated with Hurricane Irma at Los Buchillones archeological site (2017).
Atmosphere 14 01445 g013
Table 1. Main characteristics of Ciego de Ávila province, central Cuba.
IndicatorValueComments
The total area of the province (km2), including the keys6971.63776 keys (north cost: 654; south coast: 122)
Area (km2) considered for this study6124.69Keys not included
Coast length (km)338.00Northern coast: 265. Southern coast: 73
Coast length (km) considered for this study268.70Coasts of the keys not included
Municipalities (units)10
Constituencies (units)62
Table 2. Coastal flooding start times in different sites of Ciego de Ávila province during the passage of Hurricane Irma.
Coastal ZoneCoordinatesCoastMunicipalityDay/h
of Flood Beginning
Cunagua Beach 22.18° N; 78.32° WNorthBolivia8/10:00 pm
Cayo Coco22.48° N; 78.49° WNorthMorón8/11:30 pm
Cayo Guillermo 22.57° N; 78.69° WNorthMorón8/11:50 pm *
TDWF22.29° N; 78.58° WNorthMorón9/12:20 am
Punta Alegre22.38° N; 78.82° WNorthChambas9/02:00 am
Port of Baraguá21.53° N; 78.65° WSouthBaraguá9/02:30 am *
Júcaro21.63° N; 78.83° WSouthVenezuela9/03:05 am
Legend: TDWF: Turiguanó Demonstrative Wind Farm; (*) estimated hours.
Table 3. Coastal floodplain (area) associated with Hurricane Irma in several constituencies of Ciego de Ávila province.
MunicipalityConstituencyArea (km2)Irma Floodplain (km2)Irma Floodplain (%)
ChambasLos Perros124.4015.6012.5
ChambasPunta Alegre86.0621.0024.4
ChambasLas Palmas155.6050.1032.2
ChambasFalla94.8120.8021.9
ChambasRanchuelo62.421.702.7
MorónTuriguanó295.90204.9069.2
BoliviaLa Loma306.60164.7053.7
BoliviaBolivia124.3078.6063.2
BoliviaYarual251.7087.2034.6
VenezuelaJúcaro208.7038.0018.2
VenezuelaJagüeyal204.6036.0017.6
BaraguáLas 20201.8029.0014.4
Table 4. Comparison between Hurricane Irma floodplain and HVR studies floodplain associated with three hazard scenarios (hurricane of categories 1, 3, and 5).
MunicipalityArea (km2)Floodplain HVR Studies (Hurricane Categories)Hurricane Irma Floodplain (km2)
Category H1 (km2)Category H3 (km2)Category H5 (km2)
North Coast
Chambas772.43 122.94208.30109.20
Morón587.30 377.64442.50204.90
Bolivia892.30 390.77561.90330.50
Primero de Enero512.72 0.000.200.00
Ciro Redondo581.15 0.360.700.00
South Coast
Venezuela699.74130.29 74.00
Baraguá781.7024.06 29.00
Table 5. Summary of social impacts on the coastal towns of Júcaro (Venezuela) and Punta Alegre (Chambas). Data from the local government. Sources: National Statistics Office (ONEI in Spanish) [27,28].
Damage DataJúcaroPunta Alegre
Area (km2)208.7086.06
Coastal floodplain/Irma (km2)38.0021.00
Total number of houses7812017
Houses totally affected97200
Houses partially affected3375
Roofs affected (total)525
Roofs affected (partial)8982
Houses affected224382
Houses affected (%)28.718.9
Population 26966724
Affected population6231272
Affected population (%)23.118.9
Number of affected/Territorial area315
Number of affected/Flooded area1660
Table 6. Storm surge and storm tide in different sites according to landfall intensity of Hurricane Irma.
CountrySiteLocationMinimum Sea Level
Pressure
Maximum Surface Wind SpeedStorm Surge (m)Storm Tide (m)Source
Date/Time (UTC)Pressure (hPa)Date/Time (UTC)Sustained (km/h)Gust (km/h)
Antigua and BarbudaBarbuda NOS Site17.59N 61.82W06/0536916.106/04541942572.43 (1)
U.S. Virgin IslandsChristiansted Harbor, St. Croix17.75N 64.71W06/1706995.006/164261930.70 (1)
Lime Tree Bay, St. Croix17.69N 64.75W06/1706996.406/184880980.180.24(1)
Charlotte Amalie, St. Thomas18.34N 64.92W06/1742967.506/17361021570.440.52(1)
Puerto RicoEsperanza, Vieques Island18.09N 65.47W06/2006991.906/2130831040.440.48(1)
La Puntilla, San Juan Bay18.46N 66.12W06/2300989.306/2230891190.470.64(1)
Mayaguez18.22N 67.16W07/00181001.507/060650670.420.61(1)
Arecibo18.48N 66.70W07/0036998.707/013070870.420.46(1)
CubaCayo Coco (78339)22.52N 78.45W09/0520933.109/05001851942.342.65(2)
Ciego de Ávila (Punta Alegre)22.38N 78.81W09/0650959.809/06352302561.692.00(2)
Ciego de Ávila (Júcaro)21.62N 78.85W09/1300984.309/0700801440.570.88(2)
United StatesClearwater Beach27.98N 82.83W11/0606976.211/05481151430.510.57(1)
Port Canaveral—Trident Pier28.42N 80.59W11/0700990.111/0942851091.411.60(1)
Cedar Key29.13N 83.03W11/0936977.211/153657870.790.83(1)
Apalachicola29.73N 84.98W11/1206995.611/091863830.280.51(1)
Charleston32.78N 79.93W11/16541002.811/165478981.492.07(1)
Fort Pulaski32.03N 80.90W11/1706999.711/1218781131.722.50(1)
Panama City30.15N 85.67W11/1942999.311/191846720.170.33(1)
Pensacola30.40N 87.21W11/20541004.010/222431520.310.48(1)
Panama City Beach30.21N 85.88W11/2206999.411/221854700.180.39(1)
Legend: (1) [29]; (2) this study.
Disclaimer/Publisher’s Note: The statements, opinions and data contained in all publications are solely those of the individual author(s) and contributor(s) and not of MDPI and/or the editor(s). MDPI and/or the editor(s) disclaim responsibility for any injury to people or property resulting from any ideas, methods, instructions or products referred to in the content.

