Abstract
Eastern Xinjiang, as a typical extremely arid area, exhibits a high sensitivity to climate change. Gaining a comprehensive understanding of the climatic changes in this region, along with their driving mechanisms, and comparing these with the broader trend of “warming and humidifying” in the Northwest can provide a scientific foundation for adapting to and addressing climate change. Based on a study of precipitation and temperature data from seven meteorological stations in Eastern Xinjiang from 1960 to 2022, the following findings were observed: (1) The climate of eastern Xinjiang is generally characterized by a warming and humidifying trend, with the rates of mean annual temperature and total annual precipitation being 0.39 °C/10 a and 3.32 mm/10 a. The eastern part of Xinjiang has less precipitation, with a lower growth rate than that of the neighboring regions, and higher temperatures, with a higher growth rate than that of the neighboring regions. (2) The first principal component of precipitation explains 47.85% of the variation in total precipitation, with a significant upward trend (p < 0.05) and an abrupt change in the late 1970s. It contains strong signals of regional precipitation, temperature, and dry and wet changes. (3) The increase in the first principal component of annual precipitation in eastern Xinjiang is mainly related to the warming of SSTs in the Indian Ocean and the central-eastern part of the tropical southern Pacific Ocean as well as the weakening of the Asian monsoon.
1. Introduction
Over the past few decades, climate change and its impacts have received widespread attention from governments around the world. The IPCC’s Sixth Assessment Report indicates that the global surface temperature increased by 1.1 °C during 2011–2020 compared to the period of 1850–1900. In 2019, global net greenhouse gas emissions grew by 12% compared to 2010 and 54% compared to 1990. Looking at the projected average temperature change for the next 20 years, global warming is expected to reach or exceed a growth of 1.5 °C [1,2,3]. In the context of global warming, the northwest arid region, located in the hinterland of the Eurasian continent, is one of the driest regions in the world at the same latitude and one of the most sensitive ecosystems to the impacts of climate change [4,5].
At the beginning of the 21st century, Shi et al. proposed that since the 1980s, the climate in the arid areas of Northwest China has gradually transformed from “warm and dry” to “warm and wet” [6]. Since then, scholars have conducted extensive research on the characteristics, formation mechanism, and future trends of climate warming and humidification in Northwest China [7,8,9,10,11,12,13]. Chen et al. showed that the temperature and precipitation in the arid region of Northwest China had “sharply” increased in the past 50 years. The trend of precipitation changed in 1987 and has been in a state of violent fluctuation since then. In the 21st century, the increase in precipitation has weakened. Temperatures rose “sharply” in 1997; however, since the start of the 21st century, this sharp increase has shifted to a marked hiatus [7]. Li et al., using monthly precipitation data from 122 weather stations in Xinjiang, showed that between 1960 and 2015, the annual precipitation at 68% of stations showed an upward trend, and the average annual precipitation increased at a rate of 2.6 mm per decade. Among them, winter precipitation generally showed an increasing trend, but summer precipitation changes showed significant regional differences [11]. Research by He et al. showed that between 1961 and 2017, the annual average temperature and annual precipitation in northern Xinjiang increased significantly at rates of 0.35 °C/10 years and 13.25 mm/10 years, respectively [12]. Wen et al., using the daily observation data of 29 meteorological stations in Gansu Province from 1951 to 2015, showed that most of the stations in the study area, especially the high-altitude stations, had a significant warming trend while precipitation increased in the west and decreased in the east [13]. It can be seen that although there is an overall warming and humidification trend in the northwest, the magnitude of the warming and humidification trend is not uniform in different regions. Therefore, there is still a need for climate change research at different regional scales to better address the risks and impacts of future climate hazards.
Xinjiang, located in a strategically vital position along the Silk Road, is not only China’s largest cotton-producing region but also one of the areas with the greatest potential for agricultural and livestock development. It stands as a core region in the current ‘Belt and Road’ development initiative. Situated deep within the Eurasian continent, Xinjiang is far from a moisture source, resulting in scarce and unevenly distributed precipitation [14]. The eastern part of Xinjiang experiences an arid climate characterized by scarce precipitation and intense evaporation, rendering it as a classic example of an extremely arid region and a highly climate-sensitive area. Temperature and precipitation are two fundamental components of climate change, their fluctuations exerting a significant impact on the region’s ecological environment. A comprehensive understanding of the facts and trends of climate change in eastern Xinjiang and further exploration of its driving mechanisms are important for the study of the socio-economic and ecological impacts of climate change, especially the vulnerability of water resources [15].
Taking these considerations into account, this study investigates the similarities and differences between climate change in eastern Xinjiang and the warming and humidifying phenomenon in the northwest. Subsequently, within the context of warming and humidifying in eastern Xinjiang, the study reveals the changing characteristics of precipitation in the region. Finally, by expanding upon this foundation, the study unravels the intricate relationships between climate-driving factors, such as Indian Ocean sea surface temperatures and Pacific Ocean sea surface temperatures as well as the observed patterns of warming, moistening, and precipitation changes in China’s northwest region.
2. Materials and Methods
2.1. Study Area
The eastern part of Xinjiang, with a total area of about 140,749 km2, is located at 40°09′–45°43′ N, 87°16′–96°23′ E. The terrain is a mountain-basin structure, which has “4 mountains and 3 basins”. The central Tien Shan Mountains span 400 km from east to west and are separated into two main closed basins south of the mountain and north of the mountain, forming two very different natural environment areas. The northern part of the mountain includes the Balikun Basin and the Naomao Lake-Santang Lake Basin, in which the Balikun Basin is located between the Balku Mountain and the Moqin Ula Mountain, while the Naomao Lake-Santang Lake Basin is located between the Moqin Ula Mountain and the Junggar Basin. South of the mountains is the Turpan-Hami Basin. The topography of the Hami region is complex and contains the Gobi Desert, comprising sparse vegetation and more than 90% of the arid area, of which the extreme arid area accounts for more than 70% of the total area. It is dry with little rain, a large temperature difference between day and night, and long sunshine hours, showing typical continental climate characteristics [15].
2.2. Meteorological Data
This study focuses on the eastern region of Xinjiang, China, encompassing seven meteorological stations. The selected stations include Toksun, Shanshan, Turpan, Hami, Naomao Lake, Yiwu, and Balikun. These stations were chosen based on their representativeness of the diverse geographical and climatic conditions in the study area. Monthly precipitation and mean temperature data spanning from 1960 to 2022 were collected from the seven selected meteorological stations. These stations have a long-term and reliable history of data collection, ensuring the availability of consistent and accurate records. The precipitation data represent the total rainfall received each month, and the mean temperature data reflect the average temperature recorded over the course of the month (Table 1, Figure 1).

Table 1.
Information about meteorological stations in eastern Xinjiang for this study.
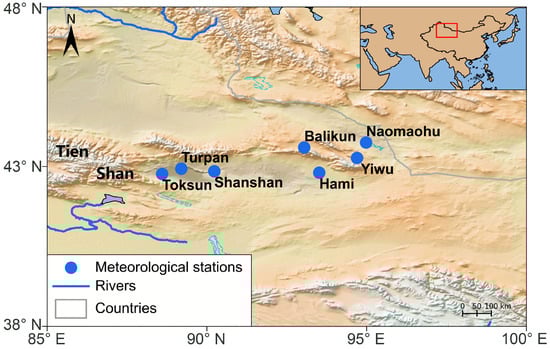
Figure 1.
Location map of meteorological stations in eastern Xinjiang for this study.
2.3. Statistical Methods
In order to characterize the features of warm humidification in the northwestern region, the present study firstly generated the spatial climatology of the northwestern region based on the gridded monthly precipitation and monthly mean temperature data from Climatic Research Unit Time-Series version 4.06 (CRU TS4.06) for the period 1960–2021 [16]. The spatial climatology provided a comprehensive picture of the climatic conditions in the region which was further analyzed using the linear trend analysis method to determine its trend characteristics.
Further investigation focused on understanding the climate change patterns specifically in the eastern part of Xinjiang. Firstly, the linear trend analysis method was employed to analyze the linear variations of monthly precipitation and monthly mean temperature at the seven meteorological stations in eastern Xinjiang. Subsequently, the principal component analysis (PCA) method was utilized to extract the principal component series from these meteorological stations [17]. Finally, a combination of the 10-year low-pass filter method, the Mann–Kendall trend test (M-K) method [18], and the multi-taper method (MTM) spectral analysis [19] were applied to these principal component series to identify their long-term, abrupt-change, and periodic characteristics.
To explore the driving mechanisms behind the precipitation changes in eastern Xinjiang, we examined the correlation between the gridded monthly precipitation, monthly temperature, and monthly self-calibrating Palmer Drought Severity Index (scPDSI) [20] for each principal component series. Based on these correlations, the relationship between the principal component series and sea surface temperatures (SSTs) was investigated [21]. Finally, we mapped the spatial patterns of water vapor transport based on water vapor flux data from 10 anomalously warm and 10 anomalously cold SST years. The vector wind data and precipitation data in the water vapor flux map were selected from NCEP/NCAR reanalysis data (1960–2022). NCEP/NCAR Reanalysis Data are created by assimilating and analyzing meteorological data from various observational sources, including satellite observations, land-based measurements, ship and buoy observations, and meteorological radar data, among others. These data undergo sophisticated numerical modeling processes to produce highly detailed historical records of atmospheric and oceanic conditions [22].
3. Results and Discussion
3.1. Spatial Characteristics of Climate Change in Eastern Xinjiang
The gridded annual total precipitation and annual mean temperature dataset (CRU TS4.06, 1960–2021) shows that compared with the surrounding areas, the eastern part of Xinjiang had less precipitation and higher temperatures (Figure 2a,b). From the perspective of the change trend, the northwestern region, including the eastern part of Xinjiang, is generally warm and humid. Compared with the surrounding areas, the annual precipitation growth rate in the eastern part of Xinjiang is lower than that of the surrounding areas, and the annual average temperature growth rate is higher than that of the surrounding areas (Figure 2c,d).
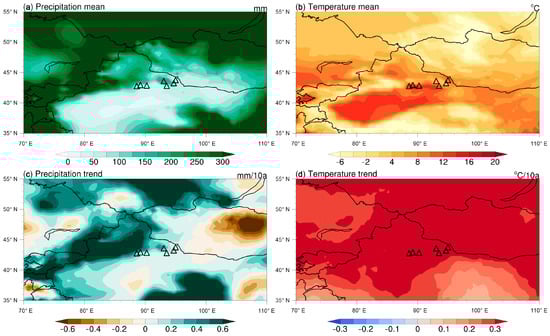
Figure 2.
Gridded total annual precipitation (a) and mean annual temperature (b) from CRU TS4.06 in the study area for the period 1960–2021, with the corresponding linear trends (c,d). Triangles represent the locations of meteorological stations, the same below.
The overall annual total precipitation and annual average temperature of the seven weather stations show that eastern Xinjiang is generally warm and humid (0.39 °C/10 a, 3.32 mm/10 a, 1960–2022). Among them, the Toksun (0.33 °C/10 a, 0.99 mm/10 a, p > 0.05), Hami (0.26 °C/10 a, 2.53 mm/10 a, p > 0.05), Naomao Lake (0.41 °C/10 a, 2.86 mm/10 a, p < 0.01), Yiwu (0.27 °C/10 a, 5.21 mm/10 a, p < 0.01), and Barkol (0.61 °C/10 a, 11.98 mm/10 a, p < 0.01) meteorological stations showed a trend of warming and humidification. However, the Shanshan (0.35 °C/10 a, −0.04 mm/10 a, p > 0.05) and Turpan (0.53 °C/10 a, −0.28 mm/10 a, p > 0.05) meteorological stations showed a warm and dry trend. The total annual precipitation and the annual average temperature increase at the Barkol meteorological station were the highest (Figure 3a,b).
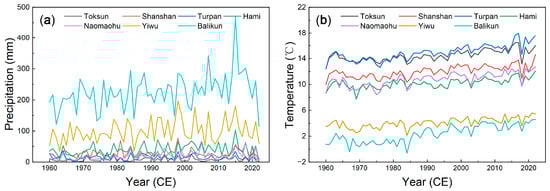
Figure 3.
The total annual precipitation (a) and mean annual temperature (b) records of eastern Xinjiang during 1960–2022 from seven meteorological stations (Toksun, Shanshan, Turpan, Hami, Naomaohu, Yiwu, and Balikun).
Our study supports previous findings. Wang et al.’s research indicates that the annual and seasonal average temperatures in the eastern part of Xinjiang and at various stations have exhibited an upward trend over the past 50 years. The rate of temperature increase observed is more than three times higher than the global temperature increase rate documented in the IPCC Fourth Assessment Report, surpassing the warming rates in both China and the arid regions of the northwest [15]. However, with regards to the analysis of annual precipitation trends, Wang et al.’s study did not show a downward trend in precipitation for the Shanshan and Turpan meteorological stations. This difference may be attributed to the different lengths of time of the two studies. The study period of Wang et al. was 1961–2010, while the study period of our study was 1960–2022. Additionally, both studies reveal that the Barikun meteorological station exhibits the most distinct upward trends in both annual total precipitation and annual average temperature [15].
These findings provide localized evidence that supports the earlier observations of the gridded data analysis. The trends of warming and humidification in the eastern part of Xinjiang are consistent across both the gridded data and the meteorological station data. Such evidence helps to reinforce the understanding of the changing climate dynamics in the region. The identified trends of increasing temperature and varying precipitation patterns have important implications for various sectors in eastern Xinjiang, such as agriculture, water resource management, and ecological systems. Understanding these trends can aid in the development of effective adaptation and mitigation strategies to address the potential impacts of these climate changes [23,24,25,26].
3.2. Characteristics of Precipitation
As mentioned above, since the total annual precipitation of the seven stations in eastern Xinjiang did not show a uniform upward trend, we next focus on the characteristics of precipitation changes. As shown in Table 2, notable positive correlations exist among the precipitation records, with the exception of certain more distant stations. Consequently, principal components were extracted to represent the precipitation variations in Northwest China, with the explained variances of the PCs being 47.85%, 18.08%, and 9.51%, respectively (Table 3 and Figure 4). The PC1 series was significantly positively correlated with the precipitation of a single station (p < 0.01), and the correlation coefficient with the total precipitation of the seven meteorological stations was 0.96 (p < 0.01). The PC1 sequence has an obvious upward trend (p < 0.05), but it is worth noting that this upward trend has weakened since entering the 21st century, while the severity of extreme events has intensified (Figure 4a). The Mann–Kendall test highlights a shift occurring in the late 1970s (Figure 4b). The PC2 sequence demonstrates favorable positive correlations with the western stations, Toksun (r = 0.67, p < 0.01), Shanshan (r = 0.38, p < 0.01), and Turpan (r = 0.53, p < 0.01), while it exhibits negative correlations with the four eastern meteorological stations. This potentially signifies the divergence in precipitation changes between the eastern and western regions. Aligned with station-level precipitation trends (p > 0.05), PC2 maintains relative stability or exhibits a slight decline (Figure 4c). The Mann–Kendall test indicates that the PC2 sequence experienced a shift in the mid-to-late 1990s (Figure 4d). Regarding the PC3 sequence, it displays notable positive correlations with the lowest precipitation stations, namely, Toksun in the far west (r = 0.55, p < 0.01) and Naomao Lake in the far east (r = 0.31, p < 0.05), representing a teleconnection of precipitation across the northwest region. The Mann–Kendall test suggests a shift in the late 1980s for the PC3 sequence (Figure 4e,f). The MTM cycle test showed that the PCs showed a significant interannual cycle of quasi-2–3 years (Figure 5).
Table 2.
Cross-correlations among the precipitation records from eastern Xinjiang for the common period 1960–2022.
Table 3.
Correlations of PCs with the precipitation records from eastern Xinjiang for the common period 1960–2022.
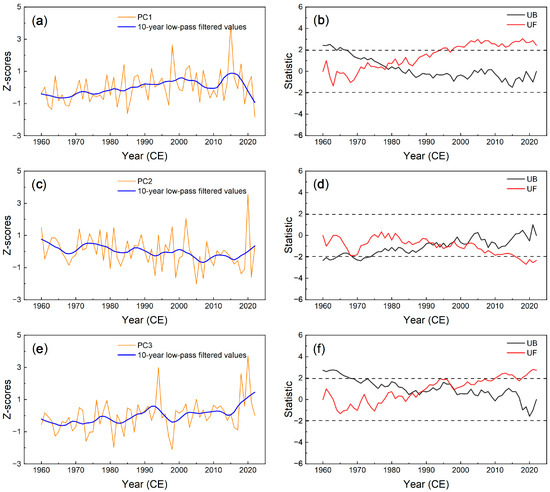
Figure 4.
The variation (a) and sequential Mann–Kendall test (b) of PC1 for seven precipitation records from 1960 to 2022. (c,d) and (e,f) are both the same as (a,b) but for PC2 and PC3, respectively.
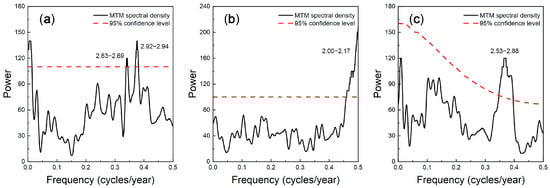
Figure 5.
Principal cycles were calculated for PC1 (a), PC2 (b), and PC3 (c) using multi-taper spectral analysis method (MTM). The red dashed line indicates the 95% confidence level.
Furthermore, the spatial correlation analysis of the PCs with gridded precipitation, temperature, and scPDSI shows that PC1 contains strong regional precipitation, temperature, and dry–humidity change signals, which can characterize most of the characteristics of northwest warming and humidification. Both PC2 and PC3 have no significant relationship with regional climate. The correlation between PC2 and precipitation and PDSI shows that it is positively correlated with the west and negatively correlated with the east, which further indicates that regional precipitation also has a certain difference in dryness and wetness, rather than being completely consistent. PC3 is negatively correlated with the dry–wet signal in the south and positively correlated with the north, which further indicates that the precipitation commonality of the maximum distance in eastern Xinjiang will be determined by the north–south movement of the precipitation belt. In addition, PC2 and PC3 may be related to global temperature changes, showing a wide range of negative and positive correlations, respectively (Figure 6).
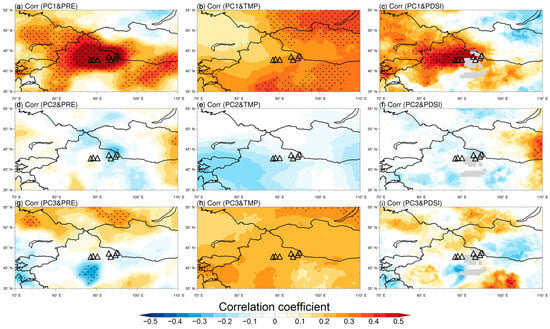
Figure 6.
Spatial correlation patterns of PC1 with CRU gridded annual total precipitation (a), annual mean temperature (b), and annual mean scPDSI (c) since 1960. (d–f) as well as (g–i) are the same as (a–c) but for PC2 and PC3, respectively.
3.3. Driving Mechanism of Precipitation
The ocean, as the most important external forcing factor, modulates inter-decadal climate change mainly through sea–air interactions. Spatial correlation analyses show that PC1 is significantly and positively correlated (p < 0.05) with Indian Ocean SSTs and southern tropical central and eastern (STCE) Pacific SSTs over the 1960–2022 common time period (Figure 7a). PC2 is negatively correlated with global SSTs, but not significantly. This indicates that the eastern part of Xinjiang will be affected by more-pronounced drought due to global warming (Figure 7b). PC3 is positively correlated with SSTs in the Indian Ocean, Western Pacific, North Pacific (p < 0.05), and parts of the North Atlantic (p < 0.05) (Figure 7c). PC1 explains nearly half (47.85%) of the annual precipitation variability in eastern Xinjiang and has the strongest response with SST; therefore, we conclude that the annual precipitation variations in eastern Xinjiang are mainly related to the SST variations in the Indian Ocean and the STCE Pacific. Further, we extracted (30°S–20° N, 50°E–120° E) and (20° S–0°, 120° W–170° E) SSTs for comparison with PC1. It was found that PC1 was significantly and positively correlated with the Indian Ocean SST (r = 0.66, p < 0.01, Figure 7d) and STCE Pacific SST (r = 0.30, p < 0.05, Figure 7e). In addition, we compared PC1 with the Asian summer wind index. The results showed a negative correlation (r = −0.30 to −0.34, 1960–2022). Among them, the Asian summer monsoon indices include the South Asian summer monsoon index (SASMI) [27], East Asian summer monsoon index (EASMI) [27], and South China Sea summer monsoon index (SCSSMI) [27].
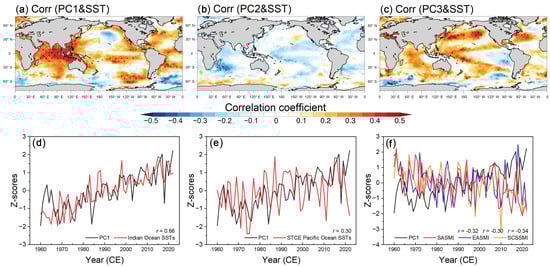
Figure 7.
Spatial correlation patterns of PCs with HadISST1 SST data during 1960–2022 (a–c). Comparison of PC1 with the Indian Ocean SSTs (d), STCE SSTs (e), and Asian summer wind indices (ASWI) (f). Among them, the Asian summer wind index (ASWI) includes the South Asian summer wind index (SASWI), the East Asian summer wind index (EASWI), and the South China Sea summer wind index (SCSWI) (Li et al., 2010).
We further extracted the water vapor fluxes corresponding to the warmest and coldest 10-year SSTs in the Indian Ocean and the STCE Pacific. Figure 8 and some studies have shown that the Indian Ocean SST plays an important role in the water vapor transport in Northwest China. When the Indian Ocean is anomalously warm, the thermal difference between the ocean and the continent decreases, the Asian monsoon system is weaker, and the subtropical westerly jet is located southerly. At this time, the cyclone response on the northwest side of the Indian Ocean is an anomalous cyclone, and the strong southwesterly wind facilitates the abundant water vapor carried by the Somali trans-equatorial jet to the north across the Arabian Peninsula and the Iranian Plateau to the sky over Northwest China, providing water vapor conditions for precipitation. During the warm period of the STCE Pacific Ocean, the anomalous air pressure along the eastern Indian Ocean will further stimulate the abnormally strong westerly belt in Northwest China and promote the transportation of water vapor from the Indian Ocean to Northwest China. The opposite pattern occurs during the cooler Indian Ocean and STCE Pacific Ocean SSTs [28,29].
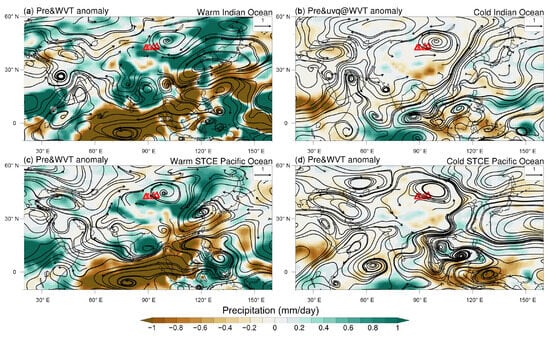
Figure 8.
Spatial distribution of precipitation anomalies (shading, mm/day) and vertically integrated water vapor transport anomalies (vectors, where uq and vq are multiplied by 1000, kg/(m·s)) for years of warm Indian Ocean SSTs (a), cold Indian Ocean SSTs (b), warm STCE SSTs (c), and cold STCE SSTs (d), as extracted from NCEP/NCAR reanalysis data (1960–2022).
Several studies have shown that massive emissions of greenhouse gases, the accelerated water cycle caused by human activities, and the anomalous westerly and monsoon circulation may be the main reasons for the increase in precipitation in Northwest China in recent decades [5]. Huang et al. showed that the weakening of the Indian summer monsoon causes Indian Ocean water vapor to be transported to the arid area around the northeastern edge of the Tibetan Plateau [30]. Chen et al. further revealed that the increase in precipitation in the arid northwest region is directly related to the weakening of the East Asian summer monsoon [31]. Research by Zou et al. showed that the extremely heavy rains in the Hami region in eastern Xinjiang in 2018 were mainly caused by abnormal weather systems transporting large amounts of water vapor from the Indian Ocean and the East China Sea [32]. Our results suggest that enhanced Indian Ocean SSTs, enhanced Pacific Ocean SSTs, and weakened Asian summer winds contribute to the warming and humidification trend in eastern Xinjiang. This further supports the linkage of Indian Ocean SSTs [33,34], Pacific Ocean SSTs [35,36], and monsoon winds [37,38] with warming and humidification across the northwest. Meanwhile, understanding the influence mechanism of regional precipitation in eastern Xinjiang leads to a more accurate reference value for guiding local water resources management [39] as well as agricultural and livestock production [40].
4. Conclusions
To explore the climate change characteristics of eastern Xinjiang and its driving mechanisms in relation to warming and humidification in northwestern China, we used climatic statistical analysis based on annual mean temperature and annual total precipitation data from seven meteorological stations in the study area from 1960 to 2022. The results show that: (1) The climate of eastern Xinjiang is generally characterized by a warming and humidifying trend, with the rates of mean annual temperature and total annual precipitation being 0.39 °C/10 a and 3.32 mm/10 a. The eastern part of Xinjiang has less precipitation, with a lower growth rate than the neighboring regions, and higher temperatures, with a higher growth rate than the neighboring regions. (2) The first principal component of precipitation explains 47.85% of the variation in total precipitation, with a significant upward trend (p < 0.05) and an abrupt change in the late 1970s. It contains strong signals of regional precipitation, temperature, and dry and wet changes. (3) The increase in the first principal component of annual precipitation in eastern Xinjiang is mainly related to the warming of SSTs in the Indian Ocean and the central-eastern part of the tropical southern Pacific Ocean as well as the weakening of the Asian monsoon.
Author Contributions
Conceptualization, L.L., S.W., Y.C. and H.Z.; methodology, S.W., Y.X. and J.W.; validation, S.W. and Y.X.; data curation, J.Z.; writing—original draft preparation, L.L., Y.C. and H.Z.; writing—review and editing, L.L., Y.C. and H.Z.; visualization, S.W. and Y.X.; funding acquisition, H.Z. All authors have read and agreed to the published version of the manuscript.
Funding
This research was supported by the Natural Science Foundation of Xinjiang Uygur Autonomous Region (2021D01B118).
Institutional Review Board Statement
Not applicable.
Informed Consent Statement
Not applicable.
Data Availability Statement
Data will be made available upon reasonable request to the corresponding author.
Conflicts of Interest
The authors declare that the research was conducted in the absence of any commercial or financial relationships that could be construed as a potential conflict of interest.
References
- Zhou, B.-T.; Qian, J. Changes of weather and climate extremes in the IPCC AR6. Adv. Clim. Chang. Res. 2021, 17, 713–718. [Google Scholar]
- Zhou, T.-J.; Chen, Z.-M.; Chen, X.-L.; Zuo, M.; Jiang, J.; Hu, S. Interpreting IPCC AR6: Future global climate based on projection under scenarios and on near-term information. Adv. Clim. Chang. Res. 2021, 17, 652–663. [Google Scholar]
- Wang, Z.-N.; Yuan, J.-S.; Pang, B.; Huang, L. The interpretation and highlights on mitigation of climate change in IPCC AR6 WGIII report. Adv. Clim. Chang. Res. 2022, 18, 531–537. [Google Scholar] [CrossRef]
- Yao, J.-Q.; Mao, W.-Y.; Chen, J.; Tuoliewubieke, D. Recent signal and impact of wet-to-dry climatic shift in Xinjiang, China. J. Geogr. Sci. 2021, 31, 1283–1298. [Google Scholar] [CrossRef]
- Zhang, Q.; Yang, J.; Wang, P.; Yu, H.; Yue, P.; Liu, X.; Lin, J.; Duan, X.; Zhu, B.; Yan, X. Progress and prospect on climate warming and humidification in Northwest China. Chin. Sci. Bull. 2023, 68, 1814–1828. (In Chinese) [Google Scholar] [CrossRef]
- Shi, Y.; Shen, Y.; Kang, E.; Li, D.; Ding, Y.; Zhang, G.; Hu, R. Recent and future climate change in northwest China. Clim. Chang. 2007, 80, 379–393. [Google Scholar] [CrossRef]
- Chen, Y.; Li, Z.; Fan, Y.; Wang, H.; Deng, H. Progress and prospects of climate change impacts on hydrology in the arid region of northwest China. Environ. Res. 2015, 139, 11–19. [Google Scholar] [CrossRef]
- Wang, Y.J.; Qin, D.H. Influence of climate change and human activity on water resources in arid region of Northwest China: An overview. Adv. Clim. Chang. Res. 2017, 8, 268–278. [Google Scholar] [CrossRef]
- Yan, X.; Zhang, Q.; Ren, X.; Wang, X.; Yan, X.; Li, X.; Wang, L.; Bao, L. Climatic Change Characteristics towards the “Warming–Wetting” Trend in the Pan-Central-Asia Arid Region. Atmosphere 2022, 13, 467. [Google Scholar] [CrossRef]
- Zhu, B.; Zhang, Q.; Yang, J.-H.; Li, C.-H. Response of potential evapotranspiration to warming and wetting in Northwest China. Atmosphere 2022, 13, 353. [Google Scholar] [CrossRef]
- Li, H.; Gao, Y.; Hou, E. Spatial and temporal variation of precipitation during 1960–2015 in Northwestern China. Nat. Hazards 2021, 109, 2173–2196. [Google Scholar] [CrossRef]
- He, B.; Sheng, Y.; Cao, W.; Wu, J. Characteristics of climate change in northern Xinjiang in 1961–2017, China. Chin. Geogr. Sci. 2020, 30, 249–265. [Google Scholar] [CrossRef]
- Wen, X.; Wu, X.; Gao, M. Spatiotemporal variability of temperature and precipitation in Gansu Province (Northwest China) during 1951–2015. Atmos. Res. 2017, 197, 132–149. [Google Scholar] [CrossRef]
- Zhang, H.-W.; Song, J.; Wang, G.; Wu, X.-Y.; Li, J. Spatiotemporal characteristic and forecast of drought in northern Xinjiang, China. Ecol. Indic. 2021, 127, 107712. [Google Scholar] [CrossRef]
- Wang, W.; Tian, B.; Li, J. Climate Change in Eastern Region of Xinjiang in the Past 50 Yearsand Its Effects on the Local Ecological Environment. Res. Soil Water Conserv. 2014, 21, 249–254. [Google Scholar]
- Harris, I.; Osborn, T.J.; Jones, P.; Lister, D. Version 4 of the CRU TS monthly high-resolution gridded multivariate climate dataset. Sci. Data 2020, 7, 109. [Google Scholar] [CrossRef] [PubMed]
- Ringnér, M. What is principal component analysis? Nat. Biotechnol. 2008, 26, 303–304. [Google Scholar] [CrossRef]
- Gocic, M.; Trajkovic, S. Analysis of changes in meteorological variables using Mann-Kendall and Sen’s slope estimator statistical tests in Serbia. Glob. Planet. Chang. 2013, 100, 172–182. [Google Scholar] [CrossRef]
- Rao, A.R.; Hamed, K. Multi-taper method of analysis of periodicities in hydrologic data. J. Hydrol. 2003, 279, 125–143. [Google Scholar]
- van der Schrier, G.; Barichivich, J.; Briffa, K.R.; Jones, P.D. A scPDSI-based global data set of dry and wet spells for 1901–2009. J. Geophys. Res. Atmos. 2013, 118, 4025–4048. [Google Scholar] [CrossRef]
- Rayner, N.A.; Parker, D.E.; Horton, E.B.; Folland, C.K.; Alexander, L.V.; Rowell, D.P.; Kent, E.C.; Kaplan, A. Global analyses of sea surface temperature, sea ice, and night marine air temperature since the late nineteenth century. J. Geophys. Res. Atmos. 2003, 108, 4407. [Google Scholar] [CrossRef]
- Kalnay, E.; Mangoud, M.A. The NCEP/NCAR 40-Year Reanalysis Project. Bull. Am. Meteor. Soc. 1996, 77, 437–471. [Google Scholar] [CrossRef]
- Luo, M.; Liu, T.; Meng, F.; Duan, Y.; Bao, A.; Xing, W.; Feng, X.; De Maeyer, P.; Frankl, A. Identifying climate change impacts on water resources in Xinjiang, China. Sci. Total Environ. 2019, 676, 613–626. [Google Scholar] [CrossRef]
- Li, N.; Lin, H.; Wang, T.; Liu, Y.; Chen, X.; Hu, X. Impact of climate change on cotton growth and yields in Xinjiang, China. Field Crops Res. 2020, 247, 107590. [Google Scholar] [CrossRef]
- Yao, J.; Hu, W.; Chen, Y.; Huo, W.; Zhao, Y.; Mao, W.; Yang, Q. Hydro-climatic changes and their impacts on vegetation in Xinjiang, Central Asia. Sci. Total Environ. 2019, 660, 724–732. [Google Scholar] [CrossRef]
- Yang, Y.; Chen, Y.; Li, W.; Wang, M.; Sun, G. Impacts of climatic change on river runoff in northern Xinjiang of China over last fifty years. Chin. Geogr. Sci. 2010, 20, 193–201. [Google Scholar] [CrossRef]
- Li, J.; Zeng, Q. A unified monsoon index. Geophys. Res. Lett. 2002, 29, 115-1–115-4. [Google Scholar] [CrossRef]
- Chen, F.; Chen, Y.; Bakhtiyorov, Z.; Zhang, H.; Man, W.; Chen, F. Central Asian river streamflows have not continued to increase during the recent warming hiatus. Atmos. Res. 2020, 246, 105124. [Google Scholar] [CrossRef]
- Ren, G.; Zhao, Y. Relationship between the Subtropical Westerly Jet and Summer Rainfall over Central Asia from 1961 to 2016. Plateau Meteorol. 2022, 41, 1425–1434. [Google Scholar]
- Huang, W.; Feng, S.; Chen, J.; Chen, F. Physical mechanisms of summer precipitation variations in the Tarim Basin in northwestern China. J. Clim. 2015, 28, 3579–3591. [Google Scholar] [CrossRef]
- Chen, C.; Zhang, X.; Lu, H.; Jin, L.; Du, Y.; Chen, F. Increasing summer precipitation in arid Central Asia linked to the weakening of the East Asian summer monsoon in the recent decades. Int. J. Climatol. 2021, 41, 1024–1038. [Google Scholar] [CrossRef]
- Zou, S.; Duan, W.L.; Christidis, N.; Nover, D.; Abuduwaili, J.; De Maeyer, P.; Van De Voorde, T. An extreme rainfall event in summer 2018 of Hami city in eastern Xinjiang, China. Adv. Clim. Chang. Res. 2021, 12, 795–803. [Google Scholar] [CrossRef]
- Wang, S.; Huang, J.; Huang, G.; Luo, F.; Ren, Y.; He, Y. Enhanced impacts of Indian Ocean Sea surface temperature on the dry/wet variations over northwest China. J. Geophys. Res. Atmos. 2022, 127, e2022JD036533. [Google Scholar] [CrossRef]
- Ding, Y.; Wu, P.; Liu, Y. Modulation of sea surface temperature in three oceans on precipitation increase over Northwest China during the past 60 years: A review. Front. Clim. 2022, 4, 1015225. [Google Scholar] [CrossRef]
- Yin, X.; Zhou, L.T. Strengthened relationships of northwest China wintertime precipitation with ENSO and midlatitude North Atlantic SST since the mid-1990s. J. Clim. 2020, 33, 3967–3988. [Google Scholar] [CrossRef]
- Zhou, L.T.; Huang, R.H. Interdecadal variability of summer rainfall in Northwest China and its possible causes. Int. J. Climatol. A J. R. Meteorol. Soc. 2010, 30, 549–557. [Google Scholar] [CrossRef]
- Zhao, Y.; Yu, X.; Yao, J.; Dong, X.; Li, H. The concurrent effects of the South Asian monsoon and the plateau monsoon over the Tibetan Plateau on summer rainfall in the Tarim Basin of China. Int. J. Climatol. 2019, 39, 74–88. [Google Scholar] [CrossRef]
- Zhang, Q.; Lin, J.; Liu, W.; Han, L. Precipitation seesaw phenomenon and its formation mechanism in the eastern and western parts of Northwest China during the flood season. Sci. China Earth Sci. 2019, 62, 2083–2098. [Google Scholar] [CrossRef]
- Chen, Y.-N.; Li, W.-H.; Xu, C.-C.; Hao, X.-M. Effects of climate change on water resources in Tarim River Basin, Northwest China. J. Environ. Sci. 2007, 19, 488–493. [Google Scholar] [CrossRef]
- Liu, D.; Li, Y.; Wang, P.; Zhong, H.; Wang, P. Sustainable agriculture development in Northwest China under the impacts of global climate change. Front. Nutr. 2021, 8, 706552. [Google Scholar] [CrossRef]
Disclaimer/Publisher’s Note: The statements, opinions and data contained in all publications are solely those of the individual author(s) and contributor(s) and not of MDPI and/or the editor(s). MDPI and/or the editor(s) disclaim responsibility for any injury to people or property resulting from any ideas, methods, instructions or products referred to in the content. |
© 2023 by the authors. Licensee MDPI, Basel, Switzerland. This article is an open access article distributed under the terms and conditions of the Creative Commons Attribution (CC BY) license (https://creativecommons.org/licenses/by/4.0/).