Article

Spatial Inhomogeneity of New Particle Formation in the Urban and Mountainous Atmospheres of the North China Plain during the 2022 Winter Olympics

1
State Key Joint Laboratory of Environmental Simulation and Pollution Control, International Joint Laboratory for Regional Pollution Control, Ministry of Education (IJRC), College of Environmental Sciences and Engineering, Peking University, Beijing 100871, China
2
State Key Laboratory of Organic Geochemistry, Guangzhou Institute of Geochemistry, Chinese Academy of Sciences, Guangzhou 510640, China
3
China National Environmental Monitoring Centre, Beijing 100012, China
4
Institute for Atmospheric and Earth System Research/Physics, Helsinki University, 00014 Helsinki, Finland
5
School of Engineering Sciences, Lappeenranta-Lahti University of Technology, 53851 Lappeenranta, Finland
*
Author to whom correspondence should be addressed.
Atmosphere 2023, 14(9), 1395; https://doi.org/10.3390/atmos14091395
Submission received: 16 July 2023 / Revised: 20 August 2023 / Accepted: 1 September 2023 / Published: 4 September 2023
(This article belongs to the Special Issue Characteristics and Formation of Secondary Organic Aerosols)

Abstract

:
The new particle formation (NPF) process is a significant source of atmospheric secondary particles, which has remarkable impacts on the regional air quality and global radiative forcing. Most NPF studies conduct their measurements at a single site, which can hardly provide information about the regionality of NPF events at large scales (>100 km). During the 2022 Winter Olympic and Paralympic Games, simultaneous measurements of particle number size distributions and NPF-associated precursors were conducted at a mountainous site close to the Winter Olympic Village in Chongli (CL), Zhangjiakou, and an urban site in Beijing (BJ) located 150 km southeast of the CL site. High NPF frequencies were observed at the CL (50%) and BJ (52%) sites; however, the fraction of concurrent NPF events was smaller than the results in other regions. In addition, the wind distributions exhibited distinct air mass origins at the two sites during the concurrent NPF events. Compared with the BJ site, the NPF growth rates were higher at the CL site due to higher levels of volatile organic compounds (VOCs) and radiation. Surprisingly, the formation rates at the CL site were lower than at the BJ site, even with a higher sulfuric acid concentration and lower CS, which may be attributed to lower dimethylamine concentrations in the mountainous area. This study reveals that, although NPF events are commonly thought to occur on regional scales, their intensity and mechanisms may have significant spatial inhomogeneity. Further studies are required to reduce the uncertainty when expanding the mechanisms based on the urban conditions to regional or global scales in the models.

1. Introduction

Atmospheric new particle formation (NPF) is an essential source of secondary aerosol particles, which have significant impacts on the regional air quality [1] and global climate [2]. During the NPF process, gaseous precursors, such as sulfuric acid (SA), ammonia, and amines (e.g., dimethylamine), nucleate and form around 1 nm clusters. The clusters then grow into larger particles by condensing low-volatile vapors produced by the oxidation of volatile organic compounds (VOCs) [3,4]. The NPF process can influence the aerosol indirective radiative forcing through, enhancing the number concentration of cloud condensation nuclei (CCN) by a factor of 3.6 ± 1.2, and the enhancement factor is higher in anthropogenic source-influencing atmospheres, such as in urban areas, than in remote forest areas [5]. The efficient nucleation and continuous particle growth in the urban atmosphere can also cause haze events and damage visibility and human health [1,6,7]. To precisely simulate the environmental impacts of NPF events, numerous field measurements have been conducted all over the world [8,9,10,11]. These measurements tried to establish the NPF mechanisms, i.e., the relationships between NPF parameters, e.g., particle formation rates (J) and growth rates (GR), and levels of NPF precursors and sinks. Additionally, the atmospheric box models equipped with these mechanisms can reproduce the NPF process at the urban atmospheric sites [12,13]. However, the NPF mechanisms based on the field measurements at a single site may be not applicable to other environments in same region. For example, the SA–dimethylamine clustering nucleation mechanisms established based on laboratory experiments [14] and field measurements in the urban atmosphere of China [15,16] cannot explain the high nucleation rates when applied to the rural atmosphere of the North China Plain.
Investigations were conducted focusing on the regional characteristics of the NPF process. Based on the air mass trajectory analysis, Shen et al. (2018) and Zhou et al. (2021) believed that NPF could occur at a horizontal scale over hundreds of kilometers in northern China [17,18]. Simultaneous NPF measurements at multiple ground-level sites were conducted in areas of the North China Plain [18,19], North America [20], Europe [21,22], and the Mediterranean Sea [23,24]. These studies revealed that many NPF events were concurrent at sites with a distance of 70–1100 km when the air masses arriving at the sites shared similar origins. All the multi-site measurements presented the differences in J and GR between places in the same region with different environmental characteristics; however, the mechanism investigation based on the precursor data was lacking.
In this study, a two-site measurement is conducted in the winter of 2022 in Beijing and its surrounding area to compare the characteristics of NPF events in urban and mountainous atmospheres. Particle number size distribution (PNSD), as well as concentrations of gaseous precursors, such as SO2, NH3, VOCs, etc., are monitored simultaneously at the two sites, and the NPF mechanisms are analyzed with the help of a box model simulation.

2. Materials and Methods

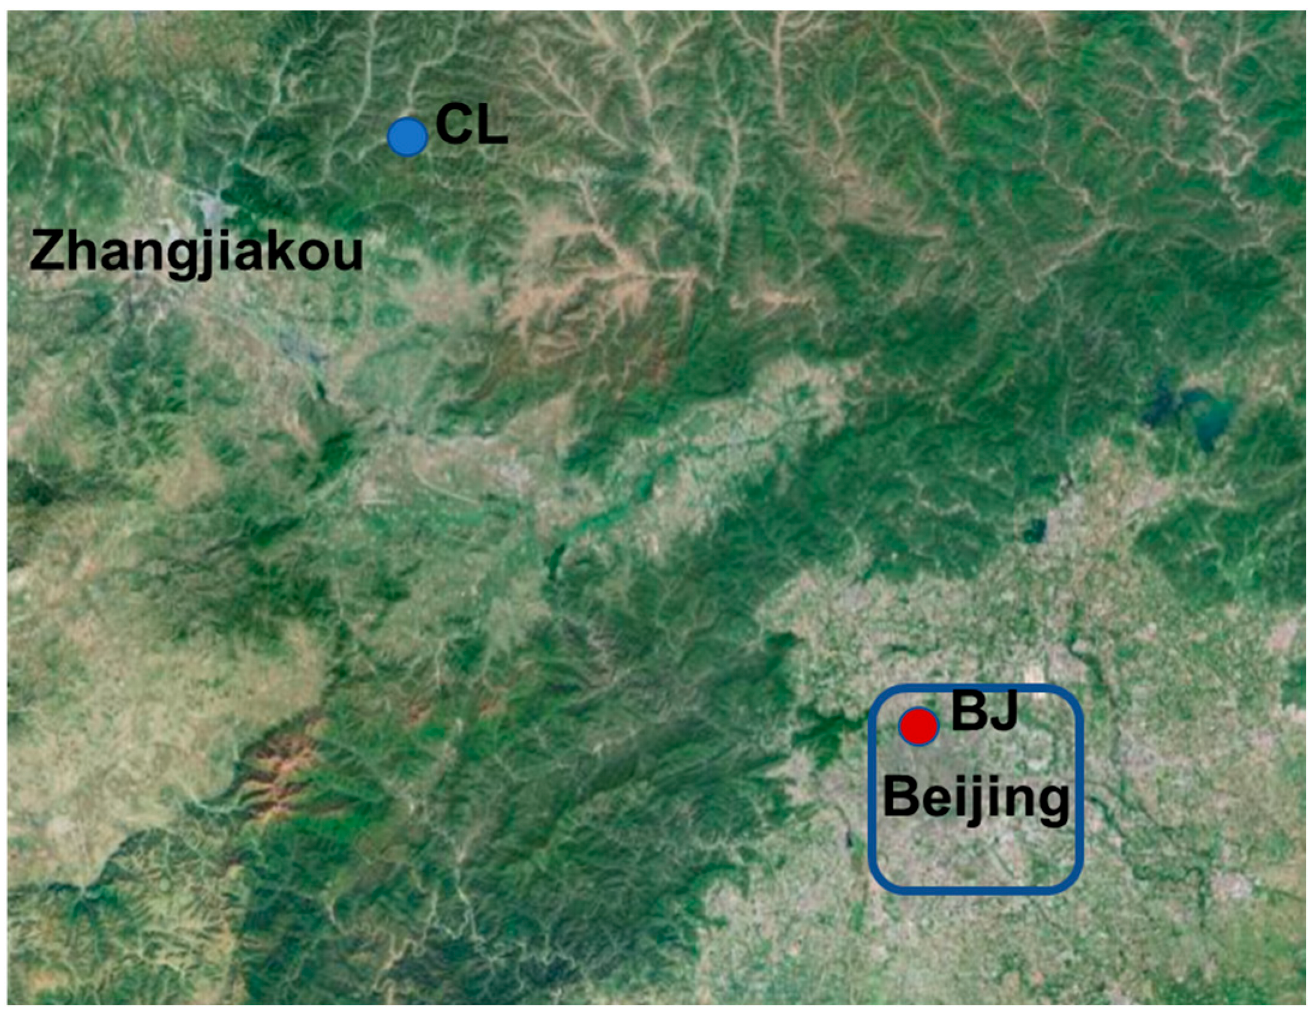
2.1. Measurement Sites

The measurements were conducted simultaneously at two sites 150 km apart—an urban site in Beijing (BJ) and a mountainous site in Chongli (CL) (Figure 1).
The urban measurements were conducted at the PeKing University Urban Atmosphere Environment MonitoRing Station (PKUERS), hereafter called the BJ site (39°59′21″ N, 116°18′25″ E, 60 m a.s.l.). This site can be taken as a typical urban site in Beijing. It was located in a populated area with no industrial emissions or coal combustion sources, and the main local anthropogenic source was traffic emissions from the main road 150 m away.
The mountainous CL site was located in the Chongli Youth Extracurricular Activity Center (40°58′47″ N, 115°17′25″ E, 1250 m a.s.l.), Zhangjiakou. This site was located around 15 km northwest of the Winter Olympic Village, 150 km northwest of the BJ site, and 40 km northeast of the urban area of Zhangjiakou City. Surrounding the site was the area of the Yanshan mountains, 20 km around, making the CL site a typical mountainous site near Beijing. Out of the “no coal zone” of Beijing, coal combustion for residential warming is allowed in the local municipality and can have an influence on this site [25].
The observation was performed from 30 January to 14 March 2022, which covered the duration of the Winter Olympic and the Paralympic Games. Within this period, heavy-duty truck (rated load capacity > 4 tons) was forbidden within the 6th Ring Road in Beijing and close to the Chongli Olympic venues. In addition, temporary control measures were also taken for factories with high-pollutant emissions around Beijing.

2.2. Data Collections

PNSD, the concentration of gaseous precursors, and meteorological conditions were measured at both sites to characterize the NPF events.
Two sets of size mobility particle sizers (SMPSs, TSI. Inc., Shoreview, MN, USA) were used to measure atmospheric PNSD for size ranges of 3–60 and 60–800 nm, respectively. The sample air was dried (RH < 30%) with a Nafion dryer (Halma plc., Nottingham, UK) and then passed an X-ray neutralizer to obtain the known size-resolved particle charge distribution. Through a differential mobility analyzer (models 3085 and 3081), mono-dispersed particles with different diameters were determined and then counted by a condensed particle counter (CPC 3776 and CPC 3775). The PNSDs were also corrected due to diffusion loss in the sampling path and multiple charging in the neutralizer [26]. A tapered element oscillating microbalance (TEOM, 1400a, Thermo, Waltham, MA, USA) was used to measure the mass concentration of PM2.5.
Gaseous pollutants, including SO2, NOx, and O3, were monitored by commercial instruments from the Thermo Electron Corporation (Model 43i-TLE, 42i-TLE and 49i). In addition, ammonia was measured by a cavity ring-down spectroscopy instrument (Picarro, G1103, Santa Clara, CA, USA). In total, 99 species of VOCs, including alkanes, alkenes, benzene series, etc., were measured by an online gas chromatography and mass spectrometer.
Temperature, relative humidity (RH) at both sites, and wind profiles at BJ site were measured by automatic meteorological stations (Met one Instrument Inc., Grants Pass, OR, USA). Hourly average ultraviolet radiation-B (UVB) data were downloaded from the NASA website, https://power.larc.nasa.gov/data-access-viewer/ (accessed on 5 May 2023). The hourly wind speed and wind direction data at over 50 meteorological monitoring sites around the BJ and CL sites were obtained from the China Meteorological Administration to analyze the regional wind distribution.

2.3. NPF Parameterizations

The NPF events were identified based on the PNSD data when the number concentration of 3–10 nm particles (PN3-10) increased sharply during the day, and the diameter of these nanoparticles exhibited a continuously growing trend [27,28]. The threshold of particle number concentration was different (>104 cm−3 at the BJ site and >5000 cm−3 at the CL site) at the two sites, due to the difference in the background levels. When calculating and comparing the daily levels of parameters, the data were obtained within the first 2 h after the start of the NPF events on NPF days, and during 10:00–12:00 (which covered the occurrence time of NPF events on NPF days) on non-NPF days.
During the NPF events, the formation rate of 3–25 nm particles could indicate how fast the nano-sized particles were formed, and was quantified in this study based on the method from Dal Maso et al. (2005) [29]:
J 3 25 = d N 3 25 d t + N 3 25 · C o a g S 8
N 3 25 represents the number concentration of 3–25 nm particles; C o a g S 8 is the coagulation rate of particles with a diameter of 8 nm, which is the geometric mean of the 3–25 nm size range:
C o a g S D p = K D p , D p n D p d D p
where n ( D p ) is the number concentration of particles with a size of D p ; K D p ,   D p is the coagulation coefficient between D p and D p particles, calculated based on the diameters and diffusivities of particles and the Fuchs correction factor. The number concentrations of particles that grew larger than 25 nm were not considered since they were very low during the nucleation events.
To obtain the GRs of newly formed particles during the NPF events, the PNSD data were first fitted as the sum of two or three mode lognormal distributions, including the newly formed mode. Then, the GR for each NPF event was calculated as the increase in the median diameter of the newly formed mode per unit of time.
The background particles could also serve as the condensation sink and limit the condensable NPF precursors’ levels. This condensation sink (CS) was quantified as the condensing loss rate of gas vapors on the particle surface:
C S = 2 π D i β · D i · N i
where D is the diffusion coefficient of the condensable vapor, e.g., SA, β the transitional regime correction factor, and D i and N i are the diameter and number concentration of the particles in class i.
The SA in the atmosphere is produced by the oxidation of SO2 [30,31] and is the most important NPF precursor in urban and rural atmospheres [32,33]. The molecular concentration of SA was calculated based on the proxy formula from Lu et al. (2019) with SO2, CS, UVB, O3, and NOx [34].
The acid-base nucleation between sulfuric acid and dimethylamine (DMA) was reported to dominate the 1 nm particle nucleation process in the urban atmosphere in China [15,16]. In this study, the SA-DMA nucleation rates at both sites were simulated in an atmospherically relevant chemistry and aerosol (ARCA) box model based on the atmospheric cluster dynamic codes (ACDCs) [35]. The ARCA box model was developed based on the Fortran language, and the user interaction interface was built using Python. It can simulate the atmospheric NPF process with detailed chemistry and aerosol dynamics. In the ARCA model, the temperature, RH, CS, and concentrations of SA and DMA were input every 10 s, and the collision, clustering, evaporation, and coagulation of SA-DMA clusters were simulated in ACDCs. The DMA in the atmosphere mainly originated from agricultural processes and urban septic systems [36,37], and its concentration ranged from ppt to tens of ppts [38,39]. In this study, the level of DMA was estimated based on a [DMA]/[NH3] ratio of 10−3, according to a measurement study on the Yangtze River Delta [40]. The clusters with a diameter larger than 1.45 nm (mobility diameter) were stable clusters that could grow to larger sizes. The cluster evaporation rates were obtained from the quantum chemical data calculated at the DLPNO–CCSD(T)/aug-cc-pVTZ level [41].

3. Results

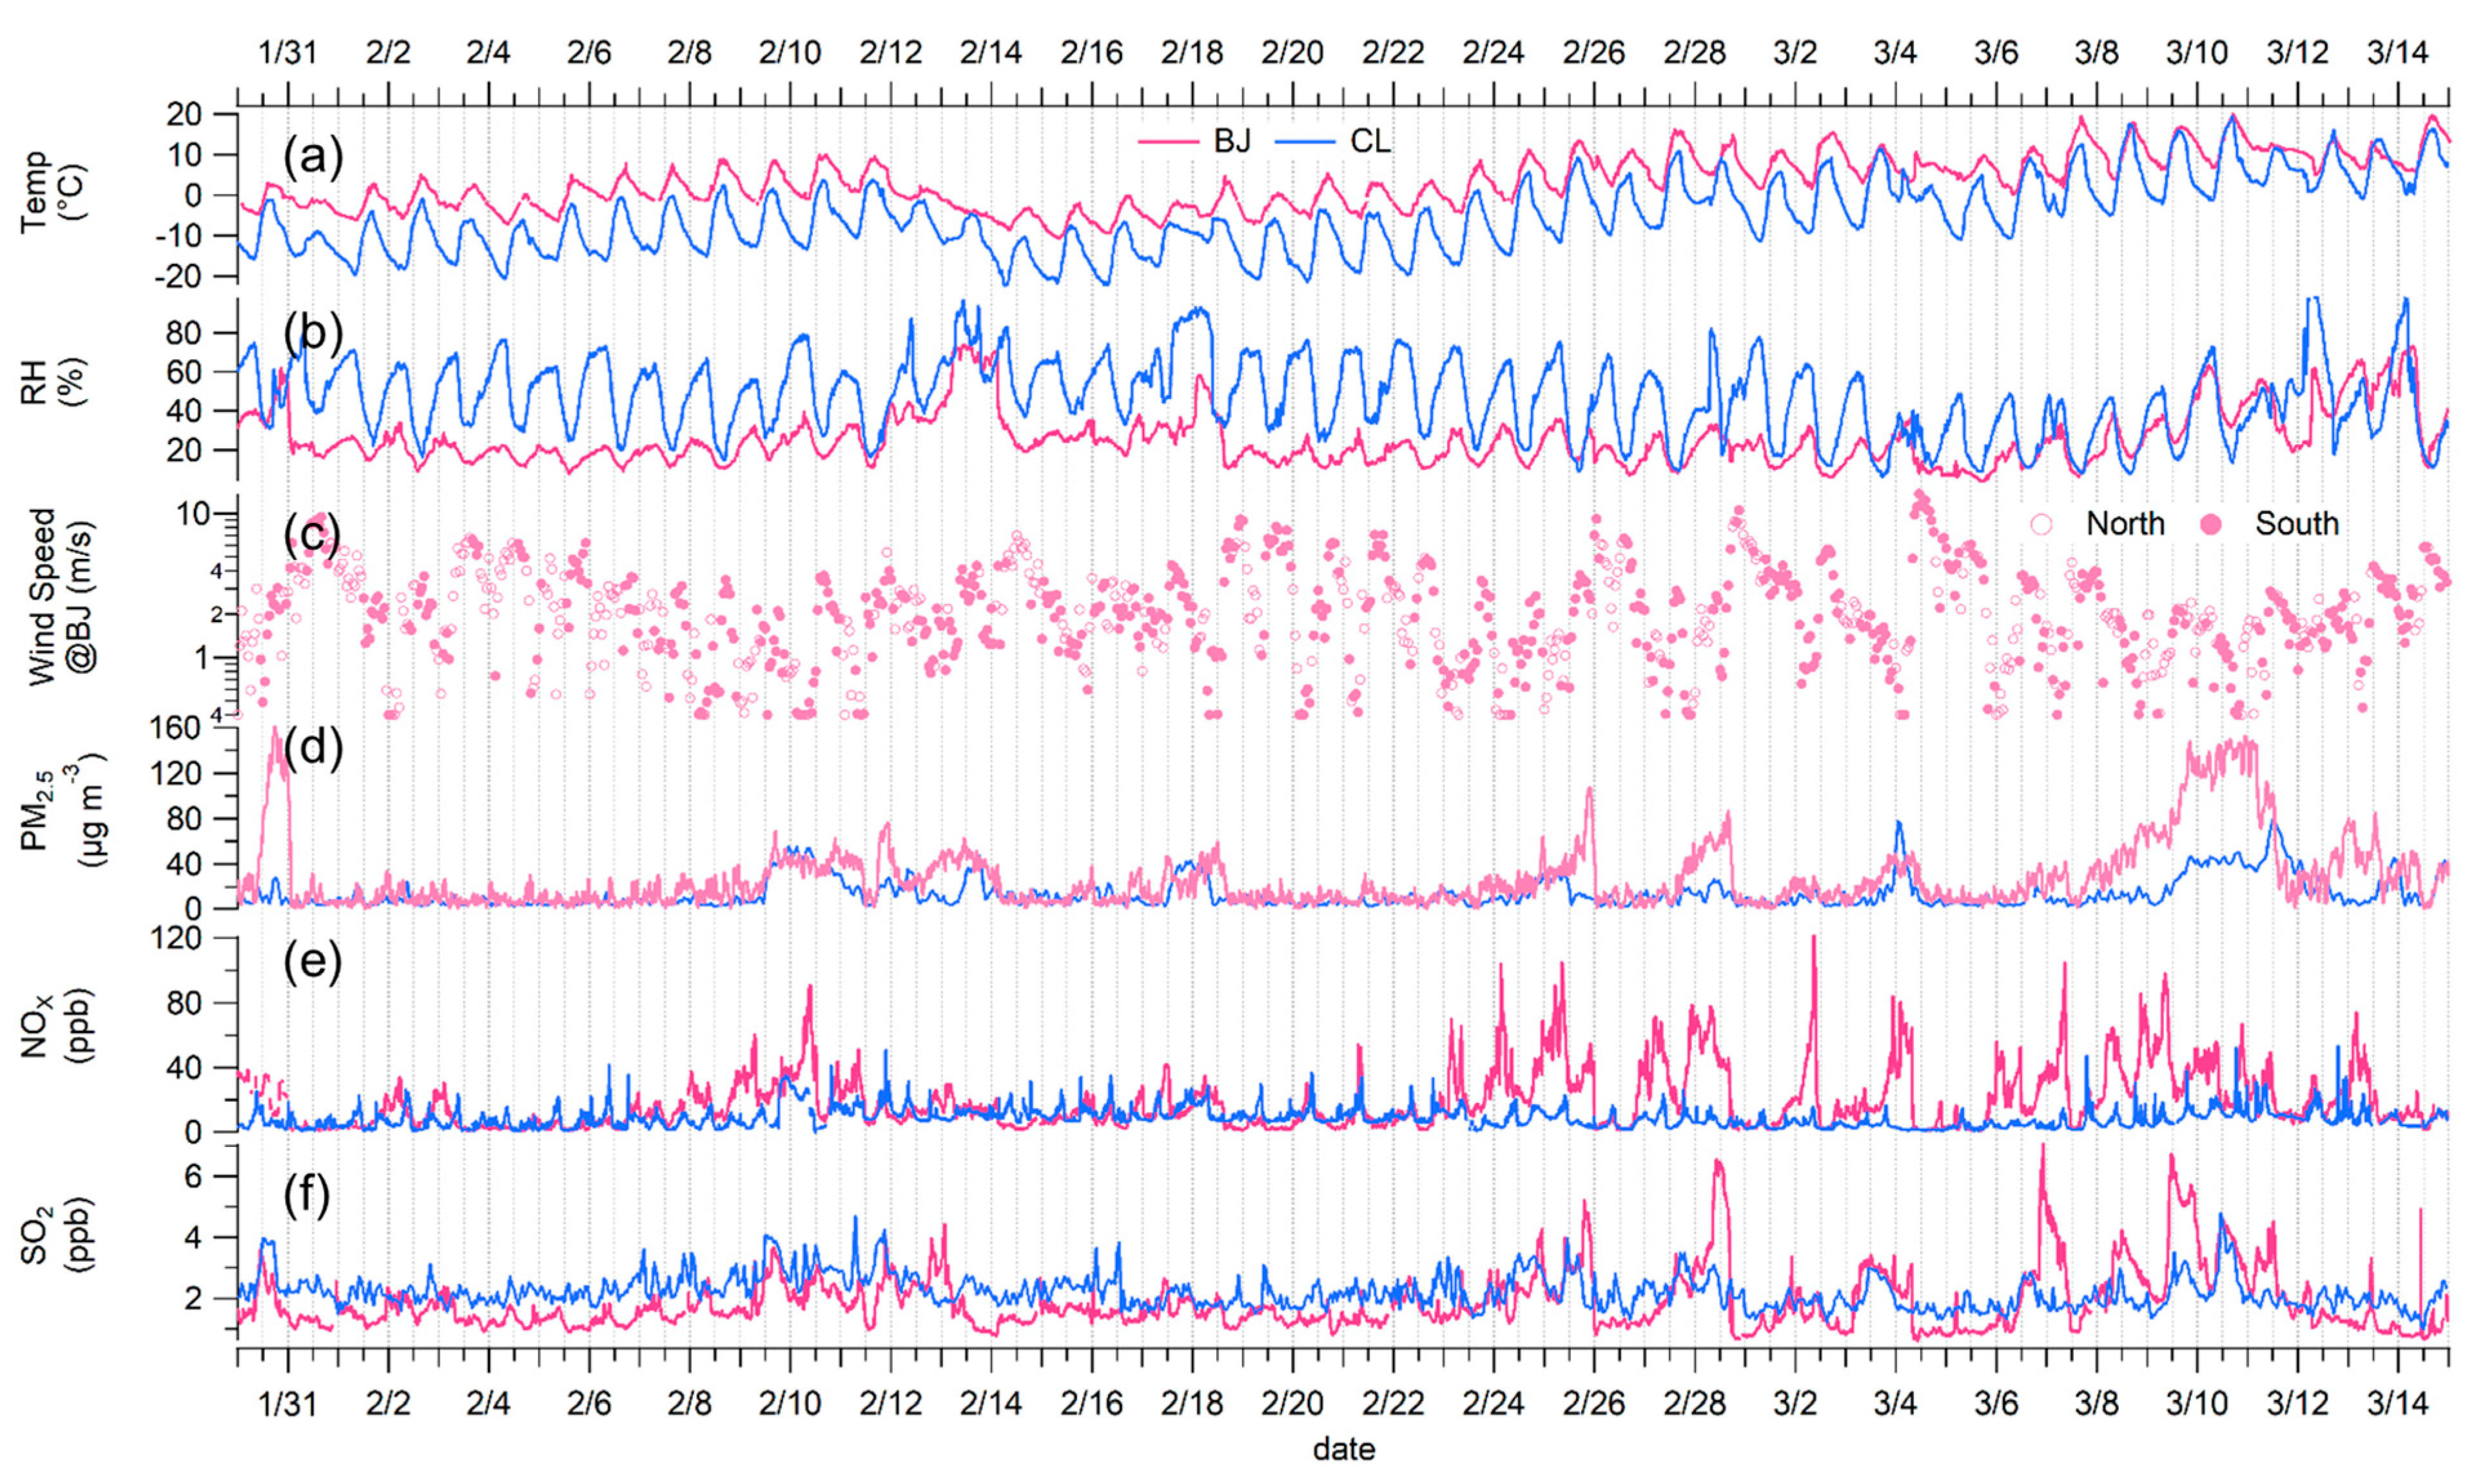
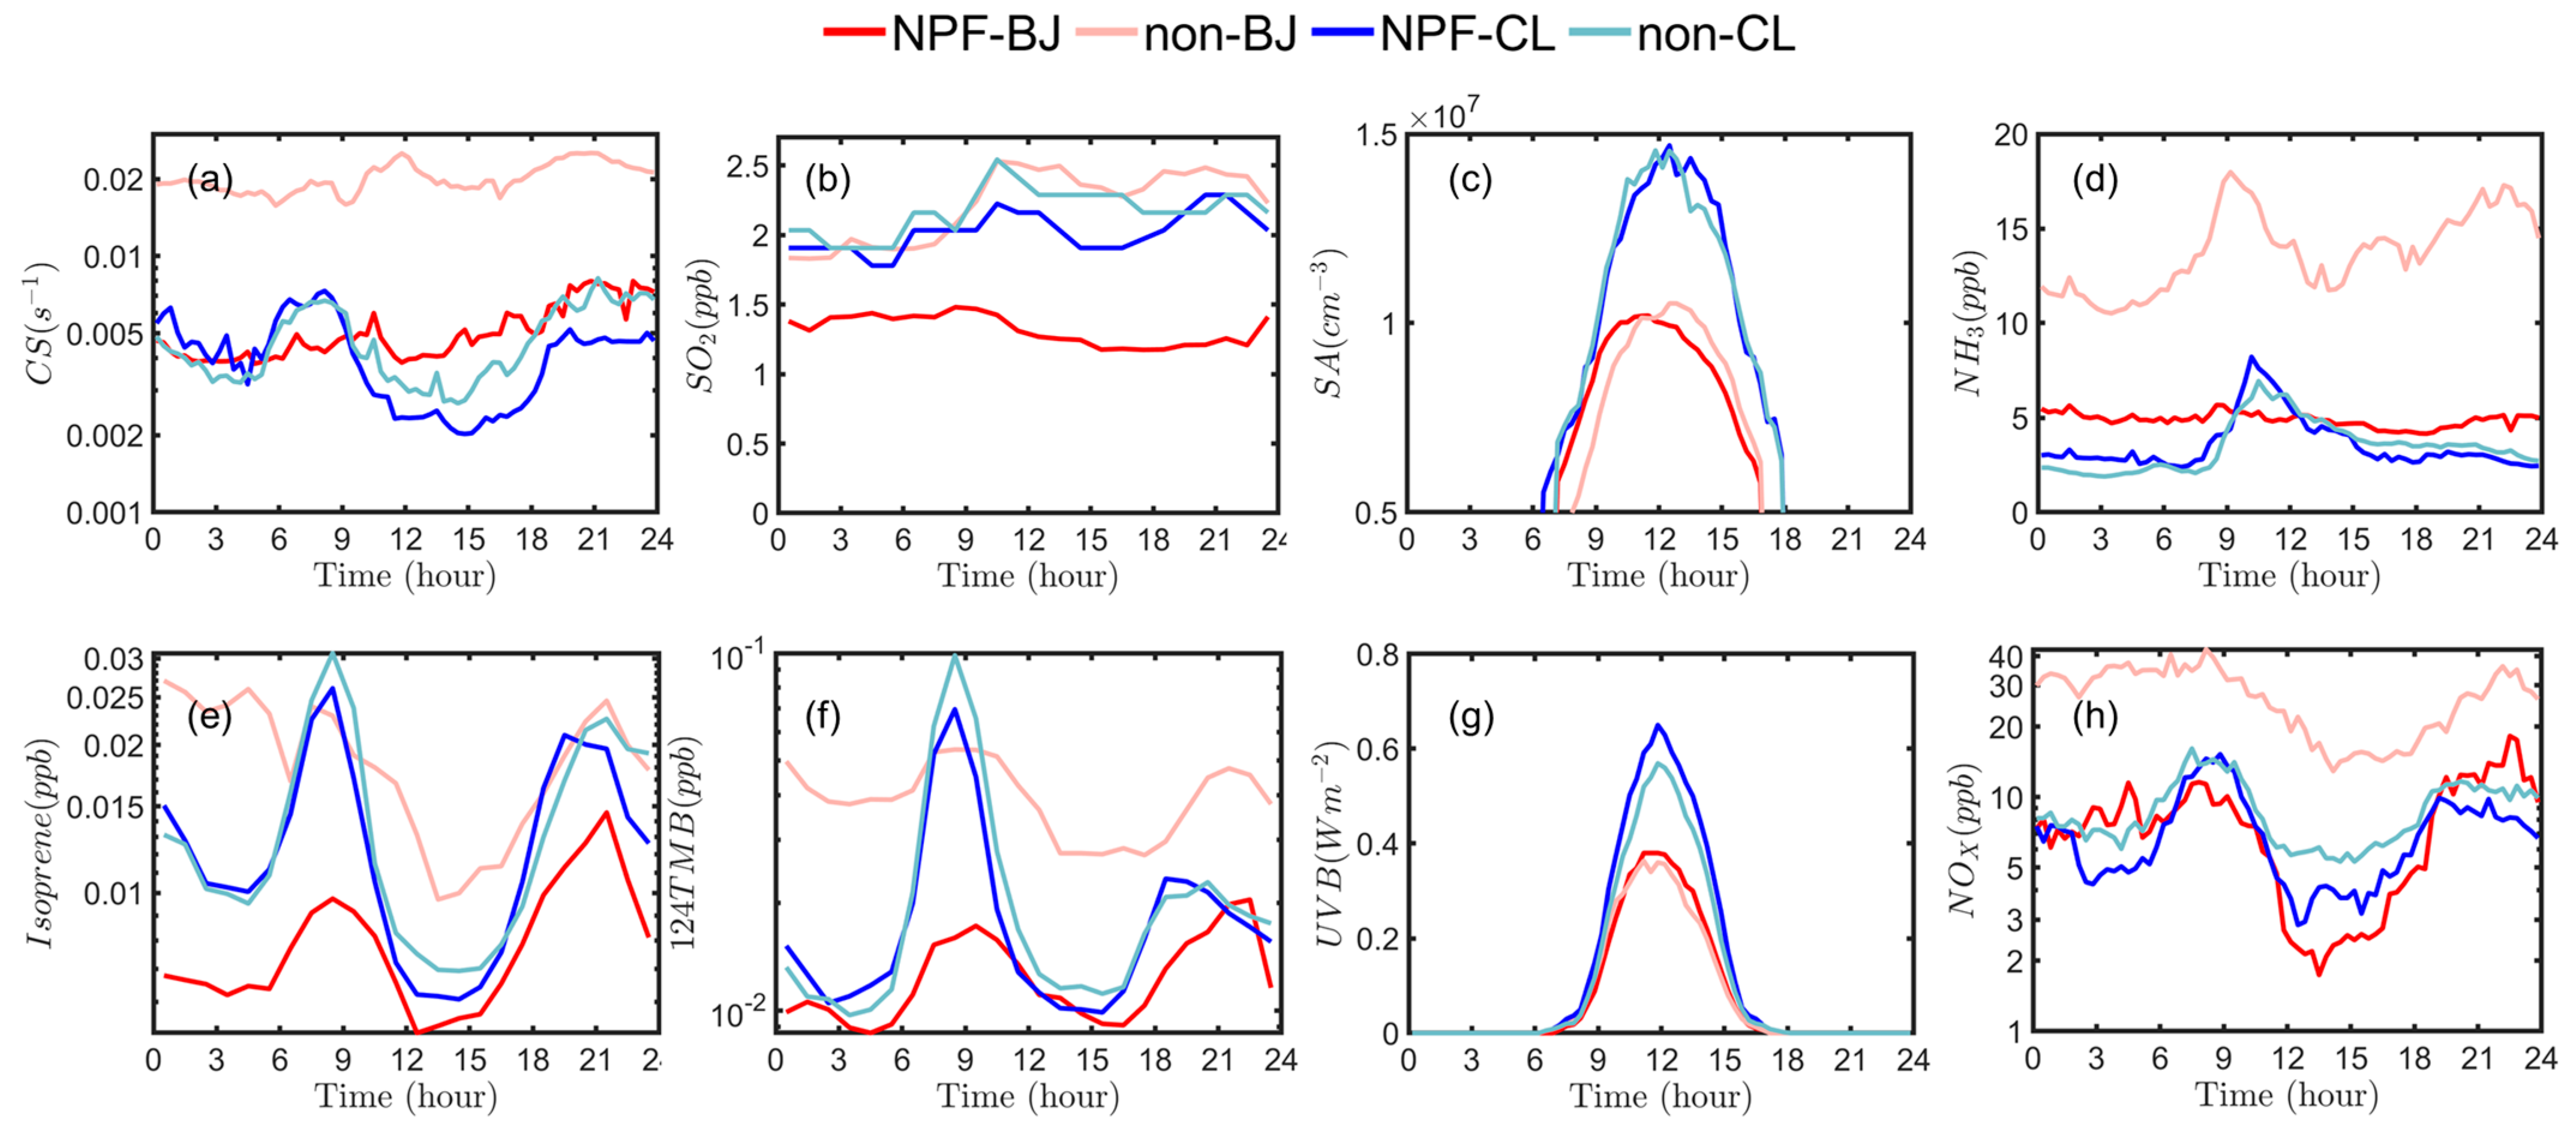
3.1. Meteorological Conditions Associated with NPF

The meteorological condition at the CL site was more favorable to the occurrence of NPF events than at the BJ site. According to previous studies, the atmospheric nucleation process requires a lower temperature and background aerosol loading [11,28]. Figure 2 shows the time series of the meteorological parameters and pollutants at the two sites. Due to the higher altitude, the temperature (−5.2 ± 8.8 °C) at the CL site was lower than (3.8 ± 6.5 °C) at the BJ site (Figure 2a), which could weaken the cluster evaporation process and assist the nucleation process [42,43]. The RH at the CL site was 47 ± 19%, higher than the 26 ± 14% at the BJ site (Figure 2b), which may have favored the uptake of pollutants on the particle surface and then enhanced the heterogeneous reactions during particle growth [44,45]. The PM2.5 at the BJ site (27.5 ± 29.3 μg m−3) was around twice as much as that at the CL site (14.0 ± 13.3 μg m−3) (Figure 2d). The worse air quality at the BJ site may be attributed to the stronger influence from the polluted air mass from the southern region. Previous studies showed that severe haze events in the atmosphere of Beijing were commonly caused by the stagnant meteorological conditions and air masses from the southern regions of Hebei province [46,47]. It can be observed that the higher PM2.5 levels are often associated with the lower wind speed (<3 m/s) from the south. Located in the Yanshan mountainous area, the CL site had a minor influence from the southern air mass, which led to less transported pollutants in the local atmosphere. With a lower aerosol load in the atmosphere, the CS at the CL site was (0.0035 ± 0.0024 s−1) lower than at the BJ site (0.0046 ± 0.0016 s−1), which could benefit the NPF occurrence. The CS in the atmosphere of Beijing during the winter of 2022 was lower than the results from the studies on the winter periods in 2019 and 2020 [28], which may be attributed to the emission control during the Olympic Games.

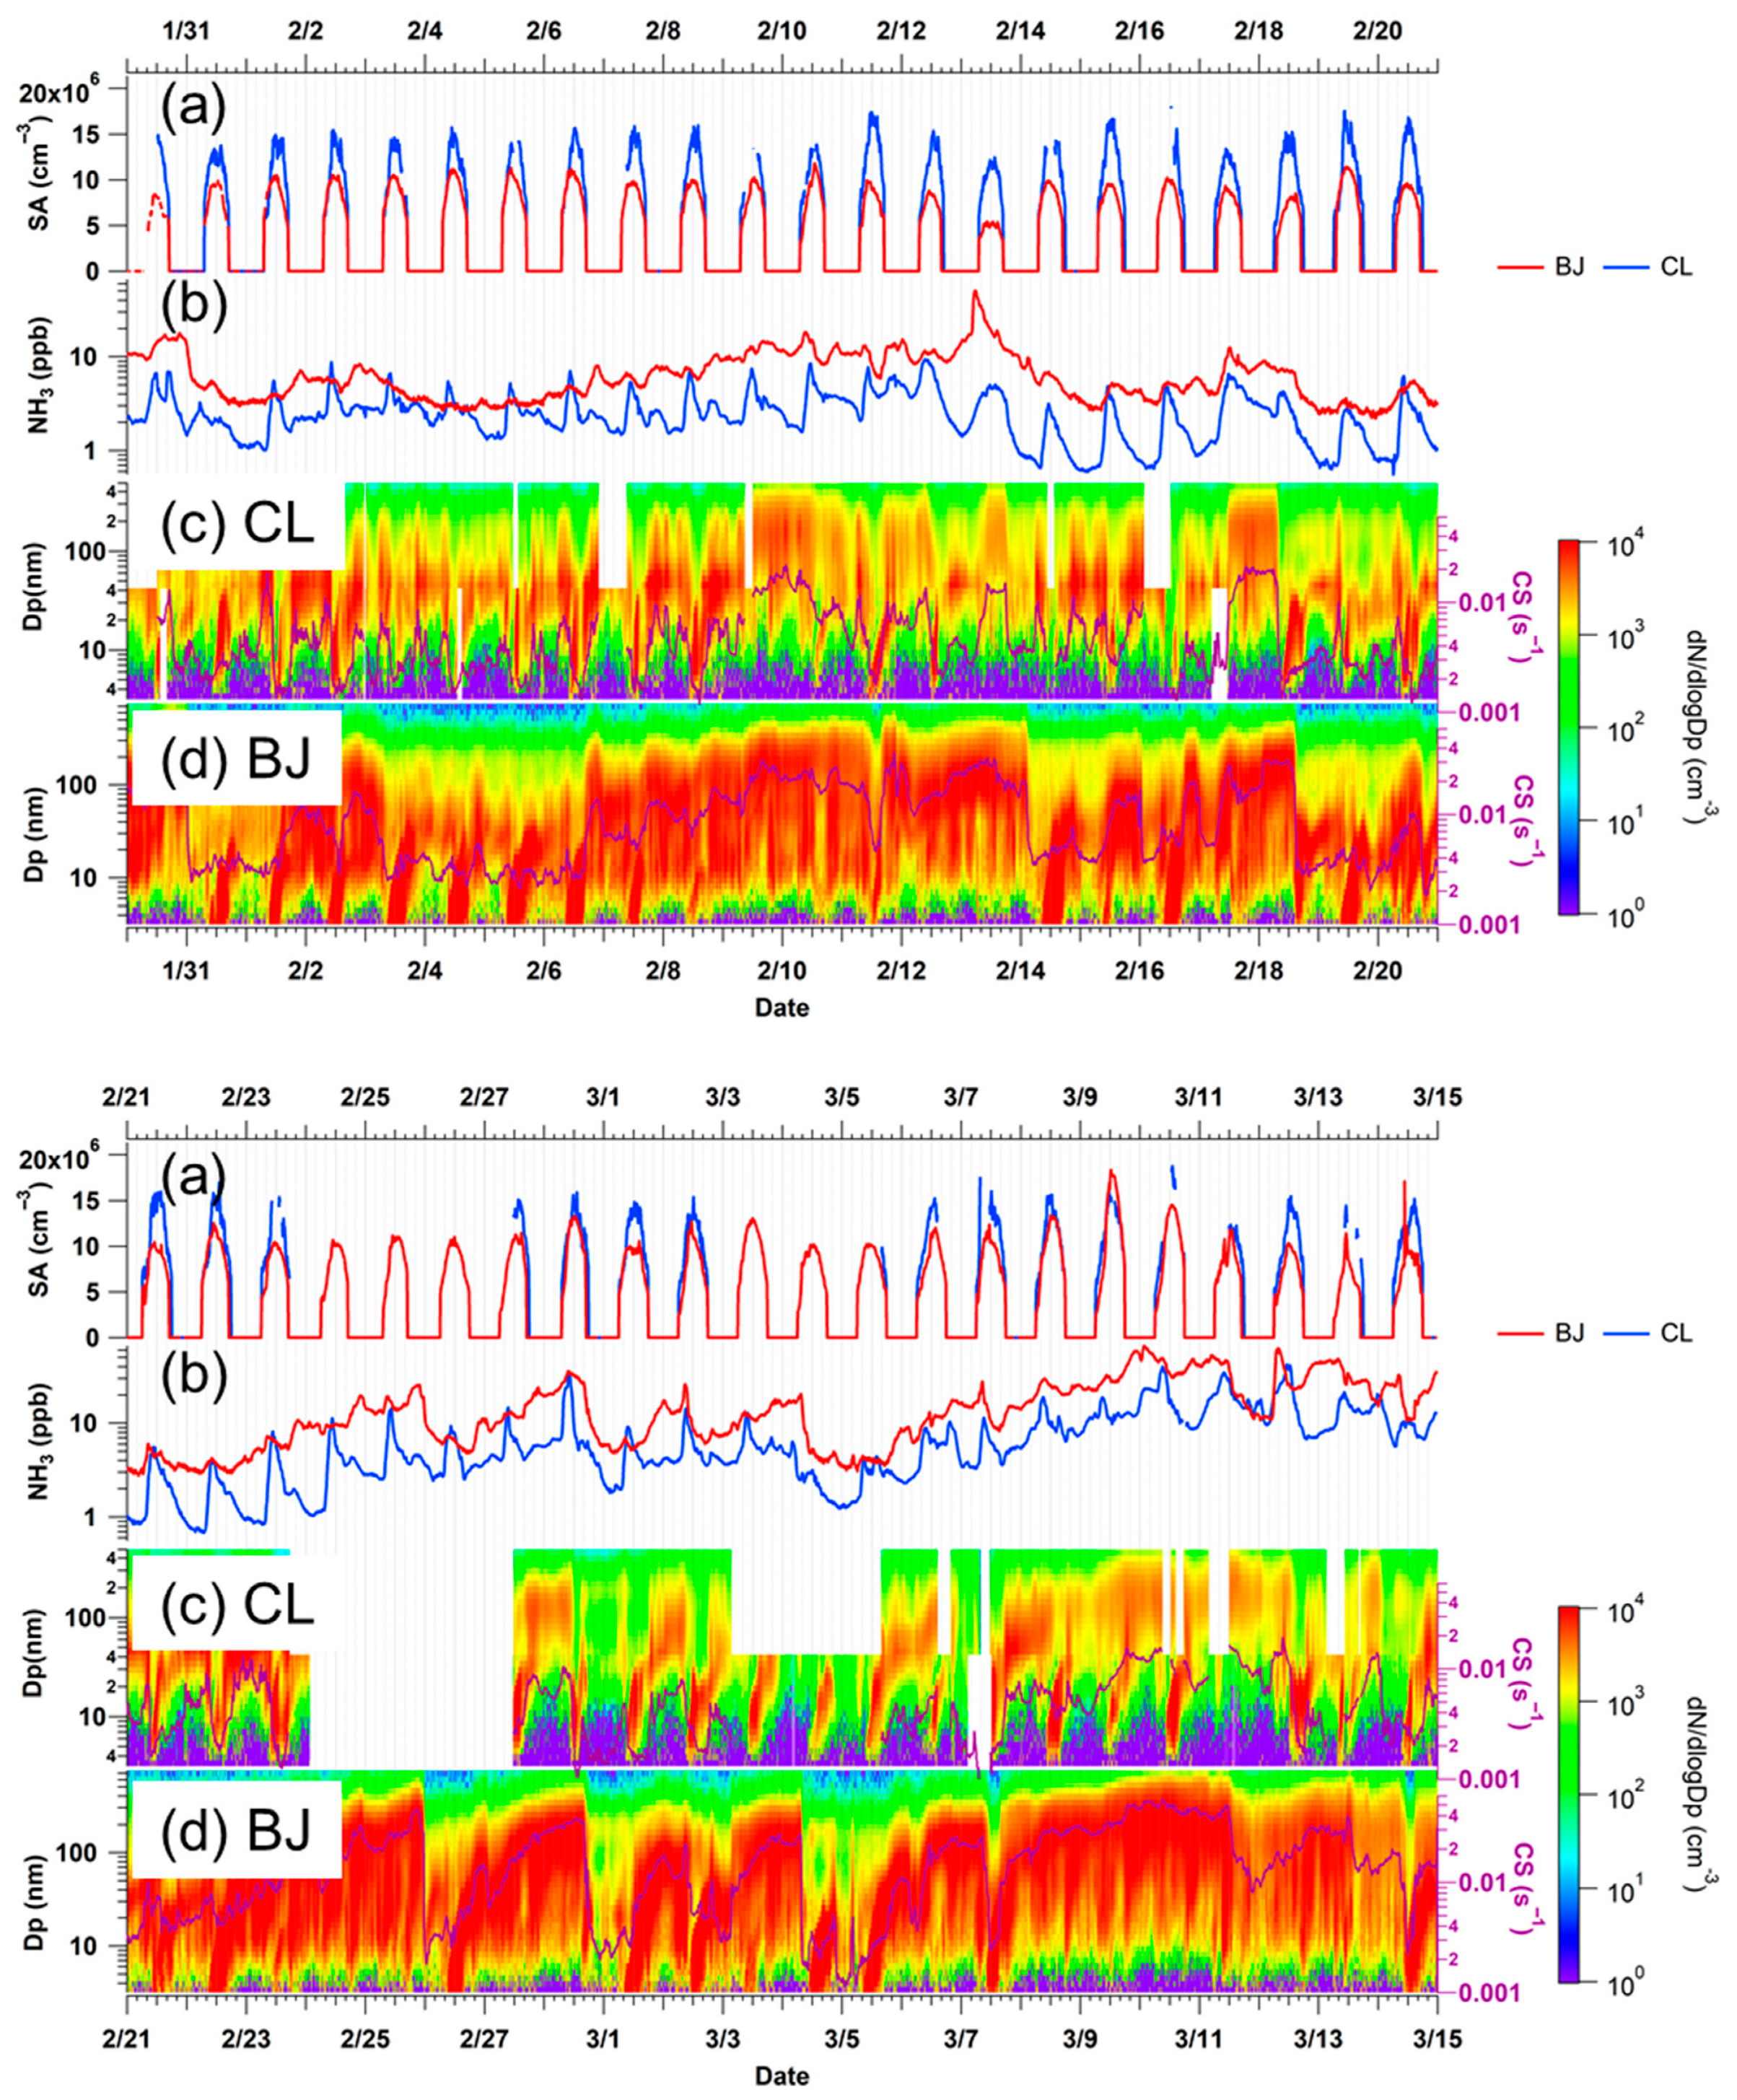
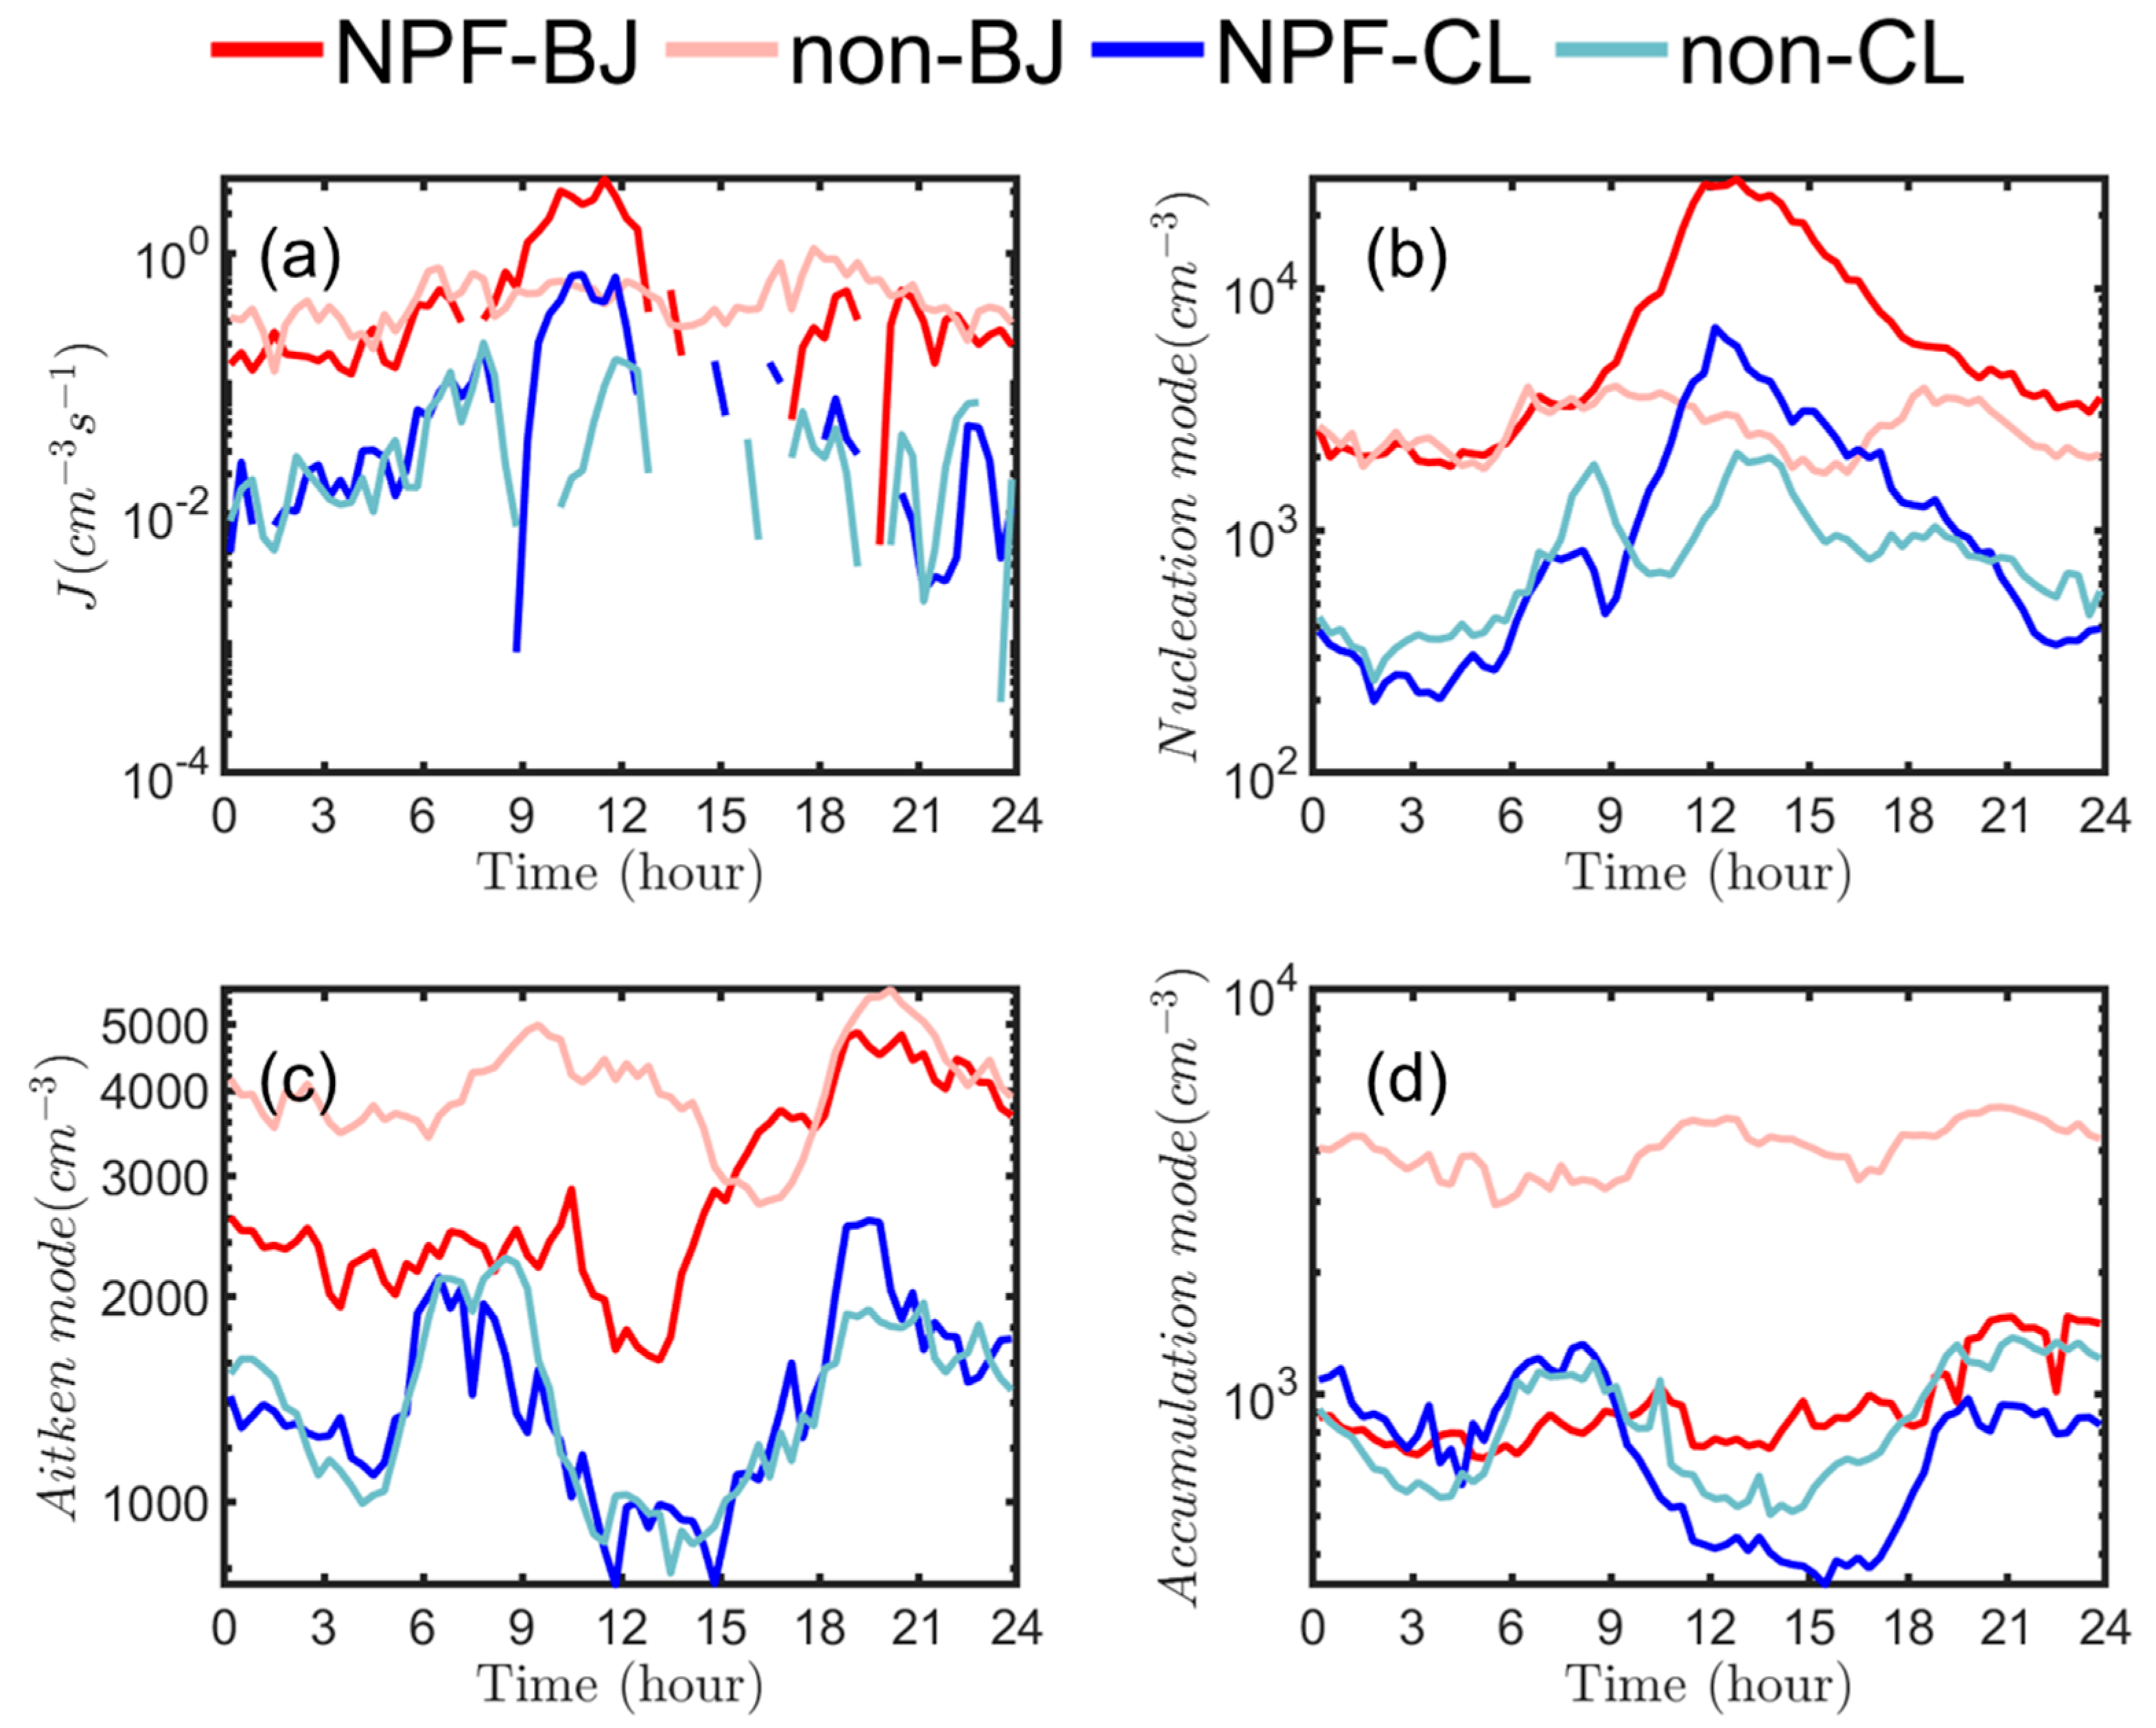
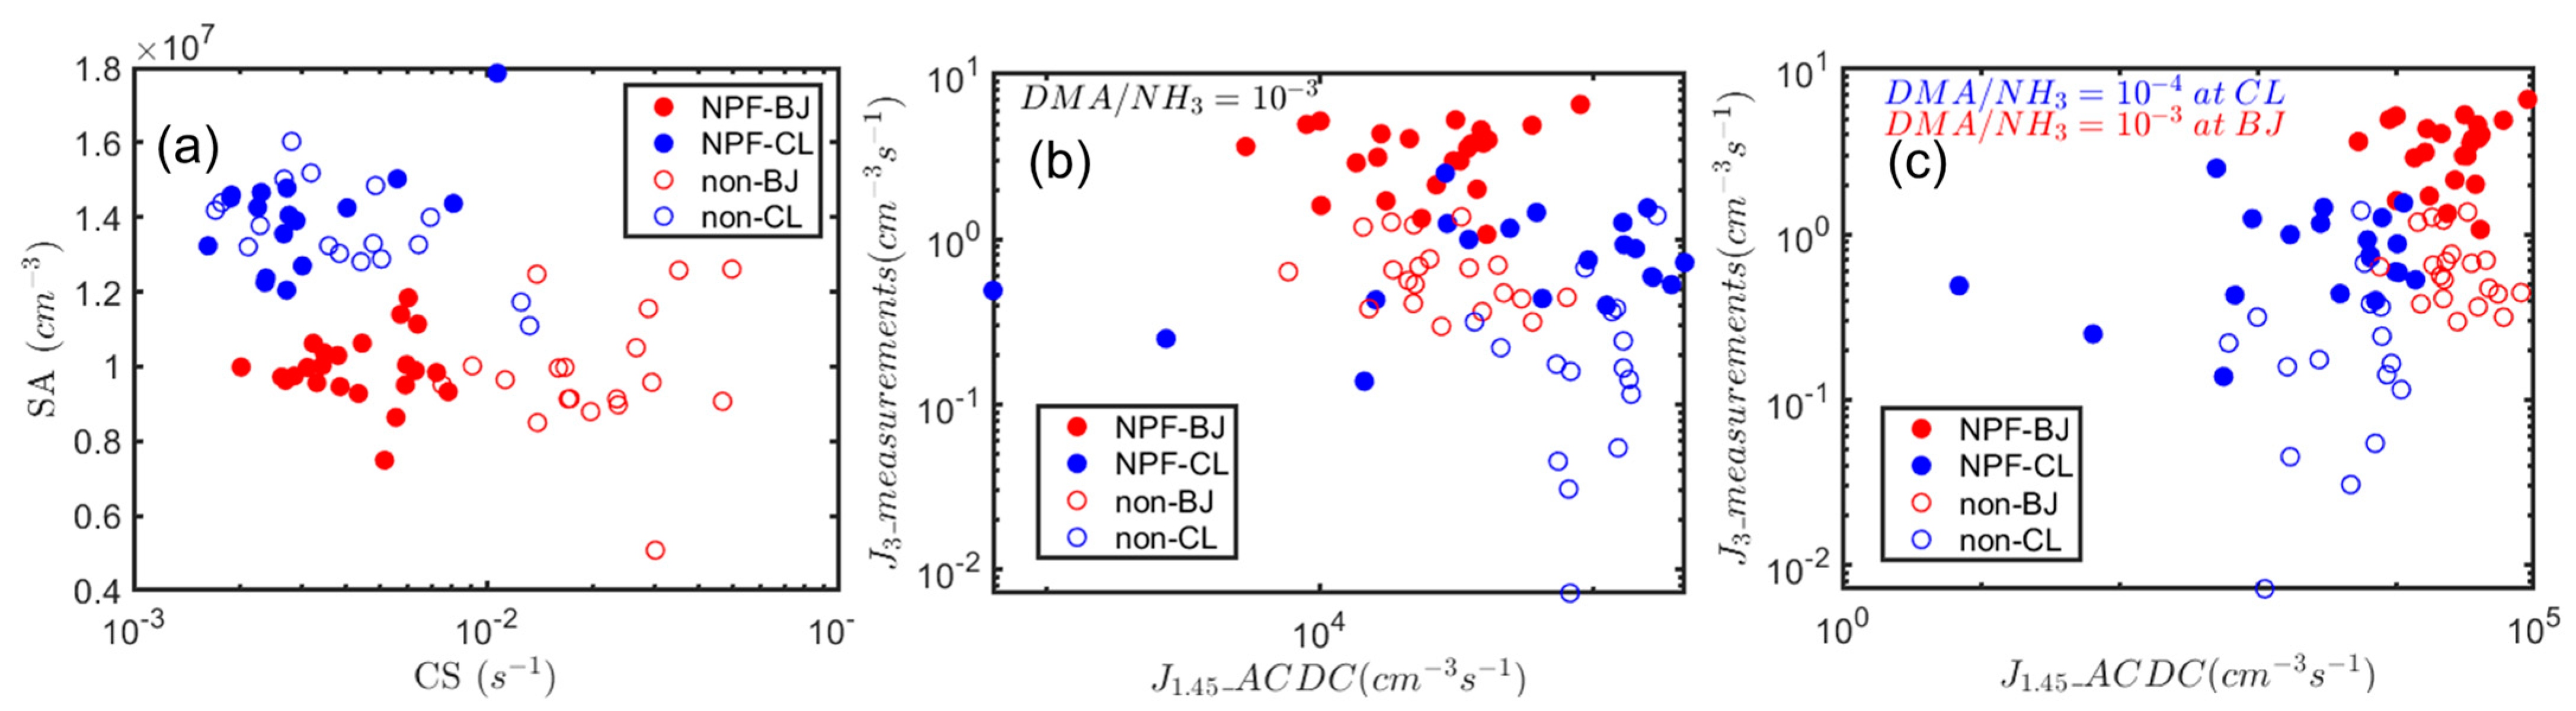
3.2. Different Characteristics of NPF at the Two Sites

The condition of gaseous pollutants was also more favorable to the NPF occurrence at the CL site. NOx is a limiting factor of NPF since it can react with RO2 radicals and restrain the formation of low volatile organic dimers [48,49]. With heavier traffic, the levels of NOx (Figure 2e) were higher at the BJ site than at the CL site. Surprisingly, the level of SO2 at the CL site (2.2 ± 0.6 ppb) was slightly higher than that at the BJ site (1.9 ± 1.0 ppb) (Figure 2f), indicating the greater influence of coal combustion in Chongli. As a result, the calculated daily concentration of SA was also higher at the CL site (Figure 3a), showing a more vigorous nucleation intensity. Gaseous NH3 is important in acid-base nucleation and particle growth in the atmosphere [50,51,52] and exhibits higher concentrations in the urban area. However, it should be noticed that, at noon each day, the levels of NH3 at the two sites were closer compared with other periods (Figure 3b).
Based on the analysis of the meteorological conditions and gaseous pollutants, more frequent and stronger NPF events were expected at the CL site compared to the BJ site. However, the observed NPF frequency at the CL site was similar to the BJ site. Figure 3 shows the PNSD measurements at the two sites. At the CL site, 20 out of 40 measurement days were sorted as NPF days, with a frequency of 50%. The PNSD data on 24, 25, and 26 February, and 7 March at the CL site were missing due to an instrument malfunction. At the BJ site, 23 NPF events were observed during 44 measurement days, with a frequency of 52%. The NPF frequency in this study was similar to other studies performed in Beijing. A long-term study of NPF occurrence at the BJ site determined that the frequency of NPF events during winter in Beijing was within 35–55% [28]. The two-site measurement conducted by Zhou et al. (2021) in the summer in Beijing also found a similar frequency (around 50%) between the urban and mountainous atmospheres, and most of the NPF events were observed at both sites [18]. At 9 days, the NPF events were observed at both sites, and the differences in the start times were within two hours. The fractions of concurrent NPF events among all NPF events at both sites were 44%, which was lower than many other two-site NPF measurement results (45–75%) (t-test, p = 0.03) (Table 1), indicating the more significant discrepancy between NPF mechanisms at the BJ and CL sites. A study performed in the Eastern Mediterranean by Kalkavouras et al. [53] reported a concurrent NPF event fraction of less than 1/3, and most of the simultaneous NPF events were observed in spring and fall under lower CS and higher SO2 levels compared to the non-common events. However, the CS and proxy SA levels on the concurrent NPF event days in this study were not significantly different from other NPF days (Table 2) (p > 0.05).
The formation rate J at the CL site was lower than at the BJ site; however, the GR was higher. As shown in Table 2, the mean level J3-25 at the CL site is 0.9 ± 0.5 cm−3 s−1, around one-fourth of J3-25 at the BJ site (3.5 ± 1.4 cm−3 s−1). According to the other two-site studies (Table 1) and a global statistical analysis [8], the formation rates of nucleation mode particles are commonly higher in urban atmospheres than in remote ones due to higher levels of SO2 and other precursors emitted by anthropogenic activities. The SO2 concentration was higher at the CL site than at the urban BJ site, indicating the influence of other anthropogenic precursors. On the other hand, the GR at the CL site was higher than at the BJ site. The inverse relationship between the J and GR at the two sites is rarely reported by previous studies (Table 1). As suggested by the experiments and models, SA, ammonia, and amine were the dominant precursors in the nucleation process [15,52,54]. At the same time, low volatile organics, such as highly oxygenated molecules (HOMs) produced by VOC oxidation, may play an essential role in particle growth [6,55,56,57,58,59]. Thus, the growth precursor level should be higher at the CL site (Section 3.3).
The impacts of NPF events on particle number concentrations also differed between the two sites. As shown in Figure 4a, at the BJ site, the formation rate on NPF days shows a higher value in the morning, and there is a background value range from 0.1–1 cm−3 s−1 in other periods, probably due to primary emissions and transport [60]. A similar pattern was also observed at the CL site on NPF days; however, the absolute value was even less than the background level at the BJ site on non-NPF days. As a result, the number concentration of nucleation mode particles (PN3-25) at the BJ site was around three-times higher than at the CL site. For Aitken-mode (25–100 nm) particle number concentration (PN25-100), the levels were lower on NPF days at the BJ site compared with non-NPF days but increased to a similar level at around 19:00 through particle growth. However, the variation in PN25-100 was similar between NPF and non-NPF days at the CL site, showing two peaks during morning and night rush hours, indicating that the contribution from NPF events was not significant compared to traffic sources.
Table 1. The statistics from two-site NPF measurement studies. For studies including more than two sites, the site pairs with a higher consistency in NPF occurrence were picked. “NPF freq” represents the NPF frequency and “C-NPF freq” is calculated as the fraction of concurrent NPF events among the total NPF events observed at the two sites.
RegionDateDistance
(km)
Type (Sites 1–2)Size Range
(nm)
C-NPF
Freq (%)
NPF Freq (%)J (cm−3 s−1)GR (nm h−1)CS (10−3 s−1)Reference
Site 1Site 2Site 1Site 2Site 1Site 2Site 1Site 2
Beijing, China2022/01–2022/03150Urban–Mountain3–8004452503.5 ± 1.40.9 ± 0.51.9 ± 0.93.2 ± 1.34.6 ± 1.63.5 ± 2.4This Study
Beijing, China2019/06–2019/0780Urban–Mountain7–8007548525.7 ± 2.31.0 ± 0.69.0 ± 2.77.3 ± 1.621 ± 1114 ± 9[18]
Beijing, China2008/03–2008/11120Urban–Regional3–80066383910.84.95.2 ± 2.24.0 ± 1.727 ± 2120 ± 20[19]
Toronto, Canada2007/05–2008/0580Urban–Rural10–560~100 *2340----10.3 ± 0.63.2 ± 0.3[20]
Carpathian Basin2008/11–2009/11
2012/01–2013/01
71Urban–Forest6–10006226354.2 ± 2.51.9 ± 1.57.7 ± 2.44.8 ± 2.37.96.6[21]
Mediterranean Sea2015/01–2019/12225Urban–Coastal10–800452593.3 ± 3.12.4 ± 1.87.5 ± 3.36.1 ± 2.310 ± 67 ± 3[61]
Mediterranean Sea2015/08–2016/08
2017/02–2018/02
340Urban–Coastal10–4872621191.6 ± 1.30.9 ± 0.94.2 ± 2.15.8 ± 3.97.3 ± 3.632 ± 31[53]
Mediterranean Sea2017/02–2017/071100Urban–Coastal10–4875740232.1 ± 1.11.9 ± 1.36.7 ± 3.45.8 ± 2.07.9 ± 2.16.4 ± 1.4[23]
Finland2013/01–2014/12300Forest–Forest3–700-9260.9 ± 0.90.2 ± 0.12.5 ± 1.91.8 ± 0.92.8 ± 2.30.8 ± 0.6[22]
* NPF events at the urban site were often observed simultaneously at the rural site.
Table 2. The start time, formation rate, growth rate, and CS of NPF events measured at BJ and CL sites.
DateStart TimeJ3–25 (cm−3 s−1)GR (nm h−1)CS (10−3 s−1)SA (106 cm−3)DateStart TimeJ3–25 (cm−3 s−1)GR (nm h−1)CS (10−3 s−1)SA (106 cm−3)
YYYYMMDDBJCLBJCLBJCLBJCLBJCLYYYYMMDDBJCLBJCLBJCLBJCLBJCL
2022013111:0011:003.81.20.83.93.82.49.512.32022022110:0010:001.30.92.44.55.91.91014.5
202202019:00 4.6 2.2 3.3 9.6 2022022210:00 5.3 1.7 6 11.8
202202029:0010:0020.51.327.22.99.813.920220223 9:00 1.2 6.8 2.8 13.7
202202039:00 4 1.2 2.6 9.7 202202269:00 4.1 2.7 3.4 10
202202049:00 3.8 0.9 3.5 10.4 20220227 11:00 1 2.1 2.7 13.6
202202059:00 3.6 1 3.2 10.6 202203019:009:003.10.62.32.32.92.49.712.3
202202069:0011:0030.41.1 3.82.310.314.72022030211:0010:0051.51.64.15.7311.412.7
2022020710:0012:002.10.41.9 5.91.99.514.620220303 * 10:00 0.5 1.5 - -
20220208 10:30 1.3 3.5 2.2 14.320220304 *11:0013:305.20.31.21.83.1-10-
20220212 11:30 0.9 3 4 14.320220305 *9:0012:002.90.22.32.82-10-
202202149:00 6.6 1 4.3 9.2 2022030710:00 4.4 2.2 6.4 11.1
202202159:00 1.1 4.8 5.5 8.6 20220308 11:00 1.2 1.4 5.6 15
2022021610:00 4.9 1.3 6.3 9.9 20220310 12:00 2.5 3.5 10.7 17.9
2022021814:309:001.60.83.33.55.11.67.513.220220312 12:00 0.7 1.4 8.1 14.4
202202199:00 3 1.6 4.4 10.6 2022031411:3011:303.60.422.52.72.79.612.3
2022022011:0011:001.71.62.34.47.82.79.314.8mean9.9 ± 1.310.8 ± 1.23.5 ± 1.40.9 ± 0.51.9 ± 0.93.2 ± 1.34.6 ± 1.63.5 ± 2.49.9 ± 0.914 ± 1.3
* Days without valid PNSD data for >60 nm particles at the CL site. On these days, NPF events at the CL site can be identified and GR can be calculated with 3–60 nm PNSD data; however, the CS and coagulation sink cannot be calculated, and the J3-25 is underestimated.

3.3. Inhomogeneity of NPF Mechanisms at the Two Sites

To investigate the explanation of the lower J and higher GR values at the CL site compared to the BJ site, the mechanisms of NPF events at the BJ and CL sites were analyzed by comparing the level of precursors.
A low CS value is commonly considered as a crucial factor for NPF occurrence [28,62], which can lead to a higher production rate of SA dimers and stable clusters [15,16] during nucleation. The CS at the BJ site on NPF days was one-fourth compared to non-NPF days. At the CL site, the CS showed a decreasing trend in the morning when NPF started; however, the diurnal variation was similar between NPF and non-NPF days (Figure 5a). Surprisingly, the CS level at the CL site on non-NPF days was even lower than CS on NPF days at the BJ site, indicating that the occurrence of NPF and the formation rate at the CL site was limited by source factors. SO2 on NPF days was lower than on non-NPF days (Figure 5b), which was consistent with the other measurements performed in Beijing [28,63]. The calculated SA concentration showed no apparent difference between NPF and non-NPF days at both sites (Figure 5c), indicating that SA was not the limiting factor for NPF events. The concentration of NH3 was not the limiting factor for J at the CL site either because its levels at the CL site were similar on NPF and non-NPF days and were higher than that on NPF days at the BJ site. Figure 6a shows the CS and SA levels on individual days at the BJ and CL sites. There was a clear gap at CS = 0.01 s−1, separating NPF and non-NPF days for the data for the BJ site. However, the circles for NPF and non-NPF days mixed at the CL site, indicating some unknown factors limiting the NPF occurrence.
To quantify the synergetic effects from the cluster formation and CS restriction on NPF events, the SA-DMA nucleation rates at 1.45 nm (J1.45) were simulated at both sites throughout the measurement period with ACDC implemented in the ARCA box model. The relationship between measured J3 and simulated J1.45 is shown in Figure 6b. The associated particle sizes were not unified for measured (3 nm) and simulated (1.45 nm) formation rates because extrapolating J3 to J1.45 or the other way around would introduce considerable uncertainty due to the absence of GR within 1–3 nm [64], especially in the urban atmosphere. Surprisingly, the simulated J1.45 showed a similar variation range between NPF and non-NPF days at both BJ and CL sites, despite their distinction in J3. This result indicates that NPF occurrence at both sites is decided by the 1–3 nm growth process. To be monitored by SMPS, the newly formed particles need to grow rapidly from 1 to 3 nm, overcoming the coagulation loss on the surface of large particles. At the BJ site, the higher level of CS on non-NPF days could lead to a considerable coagulation loss of particles within the size range of 1–3 nm, limiting the concentration of “survived” 3 nm particles. At the CL site, the CS levels were similar between NPF and non-NPF days, indicating that the growth rates may have play more important roles. The 1–3 nm growth at the CL site mainly occurred at 9:00–13:00. During this period, the levels of UVB and NH3 were higher, and the level of NOx was lower on NPF days at the CL site, indicating the more intensive condensation growth from oxidized organics [48] and HNO3-NH3 [51].
In addition, the simulated J1.45 was higher at the CL site than at the BJ site, opposite to the measured J3. The reason may have been the [DMA]/[NH3] ratio discrepancy between the urban and mountainous atmospheres. Residential DMA sources [65], such as septic systems [36], have more than an order of magnitude higher [DMA]/[NH3] ratios (10−2–10−4) than farming sources (10−5) [66]. In addition, DMA is more reactive than ammonia in the atmosphere [37]; therefore, its concentration may be reduced rapidly compared to ammonia during transport. Thus, in the remote area with a low population and the absence of agricultural activity, such as the CL site, the [DMA]/[NH3] ratio may be much lower than in the urban atmosphere. A test run was performed, reducing [DMA]/[NH3] to 10−4 at the CL site, which was one-tenth of the ratio at the BJ site. The results show a lower J1.45 nm at the CL than at the BJ site. This result indicates that models should not use a constant [DMA]/[NH3] ratio when simulating DMA concentrations as well as the SA-DMA nucleation rates.
The reason for a higher GR at the CL site was relatively apparent when examining the potential productivity of low volatile organic vapors. Both biogenic (e.g., isoprene in Figure 5e) and anthropogenic (e.g., 1,2,4-Trimethylbenzene in Figure 5f) VOCs showed higher values in the morning during NPF days at the CL site compared to the BJ site. Considering that the radiation (Figure 5g) was more intense at the CL site, and NOx (acting as a restriction factor, as mentioned in Section 3.1) levels were close between the two sites, there should have been a higher level of oxidized and condensable organic vapors at the CL site, contributing to the faster particle growth.

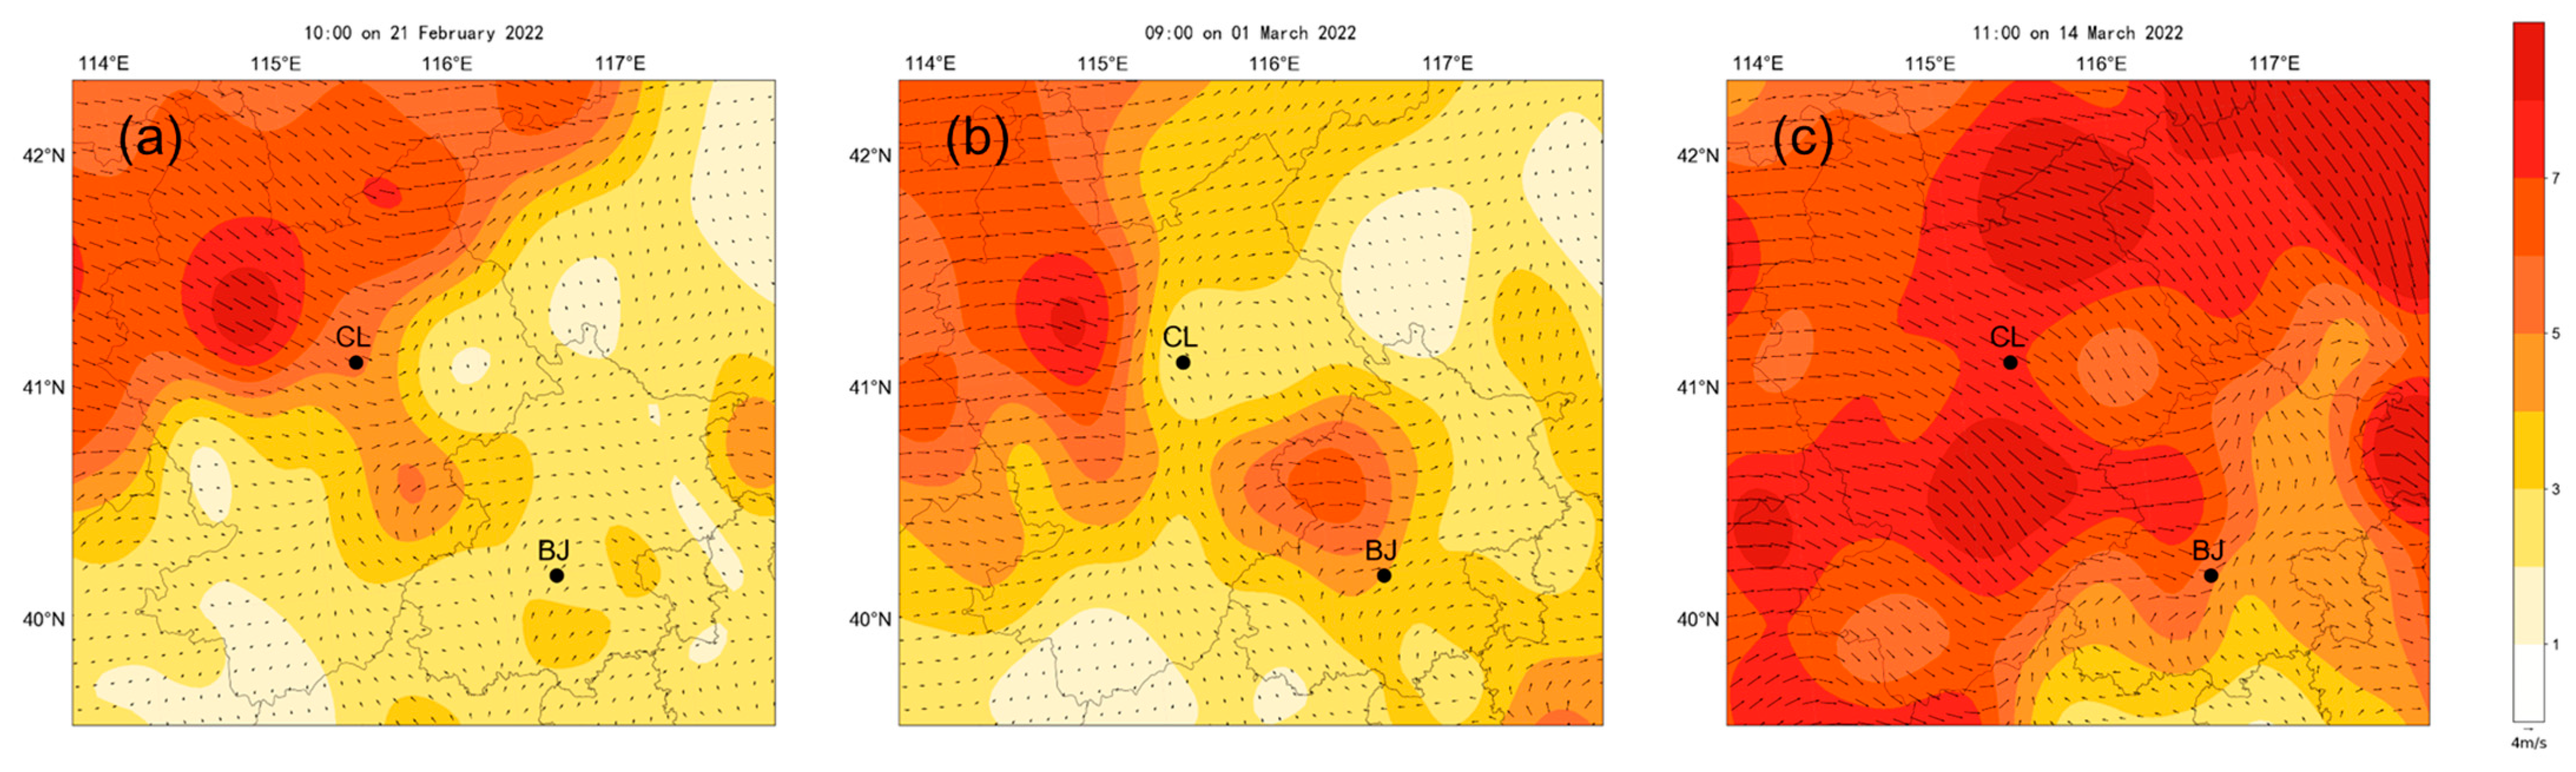
3.4. Influence of Wind Distribution

The discrepancy in the characteristics and mechanisms of NPF events at the BJ and CL sites may be attributed to the inhomogeneity of air mass origins. According to the studies on regional NPF events, when controlled by air masses with similar origins, NPF events can coincide at multiple measurement sites, and NPF-associated parameter levels can exhibit consistent variations [18,19,24]. This study analyzed the regional wind distribution on three days (21 February, 1 March, and 14 March) when the NPF events observed at the two sites occurred simultaneously. As shown in Figure 7 and Figure S1, around the occurrence of NPF events, the CL site was controlled by the north and west winds, while the southerly wind controlled the BJ site. Thus, sources in different regions influenced the precursor levels at the two sites, leading to an inhomogeneity of NPF mechanisms. This finding emphasizes that, although NPF can sometimes be observed in two sites far apart, it does not guarantee that the NPF can occur in the whole region between them or that the NPF values at the two sites share the same mechanisms. Thus, the researchers must be careful about the spatial distribution of sources and air mass movement when simulating the NPF process at regional levels.

4. Conclusions

New particle formation events and the associated atmospheric parameters (temperature, RH, SO2, NOx, NH3, VOCs, etc.) were measured during the 2022 Winter Olympic and Paralympic Games at an urban BJ site (60 m a.m.s.l) and a mountainous CL site (1250 m a.m.s.l) in Beijing and their surrounding areas. Due to this region’s traffic and industry emission control, the CS level was lower than that during previous years, and a high NPF frequency (~50%) was observed at both sites.
With a horizontal distance of 150 km, the NPF events observed at the two sites showed different characteristics. In all NPF events, the fraction of concurrent NPF events observed at both sites was lower than the results from studies performed in other regions. With higher SA, VOC, and NH3 levels and lower CS levels, the growth rates were higher at the CL site than at the BJ site; however, the formation rates were surprisingly lower at the CL site. Assuming [DMA] = (10−3~10−4) × [NH3], the nucleation rate J1.45 was simulated in the ARCA box model with ACDCs. At both sites, J1.45 did not show a difference between NPF and non-NPF days, indicating that the 1–3 nm growth process was a crucial stage for NPF occurrence. The lower J3 value at the CL site compared with the BJ site may be attributed to a lower [DMA]/[NH3] ratio in the mountainous atmosphere. In relation to air-quality influence, the NPF could contribute to the number concentration of Aitken- and accumulation-mode particles at the urban BJ site, while at the CL site, the influence of NPF on the particle number concentration was not significant when compared with primary emissions.
This study determined that the urban and mountainous sites located in one area may be influenced by different source regions, and their NPF events presented different mechanisms, even when they begun simultaneously. Thus, NPF events should not be considered as regionally homogenous processes. Therefore, precise emission source distribution levels and atmospheric transport modeling are necessary when investigating NPF events and their environmental impacts in different locations. Moreover, if the NPF simulation formulas used in the regional atmospheric models were adopted from the measurements in urban atmospheres (or laboratory experiments based on urban atmosphere conditions), this can cause uncertainties due to the discrepancy of the mechanisms in other environments.

Supplementary Materials

The following supporting information can be downloaded at: https://www.mdpi.com/article/10.3390/atmos14091395/s1, Figure S1: near-surface wind distribution at NPF start time, −1 and +1 h during three NPF days around the BJ and CL sites (based on the meteorological observation data). The points in the figures represent BJ and CL stations, respectively. The color of the legend represents the wind speed.

Author Contributions

Methodology, D.S. and P.S.C.; validation, D.S.; data curation: D.S., X.W., Y.Q., X.Y., Z.C., Z.Z. and J.S., Investigation: D.S., X.W. and L.T., writing—original draft preparation, D.S.; writing—review and editing, D.S. and M.B.; supervision, M.H. and M.B.; funding acquisition, M.H; resources: X.D., L.Z., S.G. and Z.W. All authors have read and agreed to the published version of the manuscript.

Funding

This study was funded by the National Key Research and Development Program of China (2022YFC3701001) and the National Natural Science Foundation of China (Grant Nos. 22221004).

Institutional Review Board Statement

Not applicable.

Informed Consent Statement

Informed consent was obtained from all subjects involved in the study.

Data Availability Statement

Data are available upon request from the corresponding author. The ARCA box model codes are available by contacting [email protected].

Acknowledgments

D.S. is sincerely grateful for the support for the open project of the State Key Laboratory of Organic Geochemistry, Guangzhou Institute of Geochemistry, Chinese Academy of Sciences.

Conflicts of Interest

The authors declare no conflict of interest.

References

  1. Guo, S.; Hu, M.; Zamora, M.L.; Peng, J.; Shang, D.; Zheng, J.; Du, Z.; Wu, Z.; Shao, M.; Zeng, L.; et al. Elucidating severe urban haze formation in china. Proc. Natl. Acad. Sci. USA 2014, 111, 17373–17378. [Google Scholar] [CrossRef] [PubMed]
  2. Merikanto, J.; Spracklen, D.V.; Mann, G.W.; Pickering, S.J.; Carslaw, K.S. Impact of nucleation on global ccn. Atmos. Chem. Phys. 2009, 9, 8601–8616. [Google Scholar] [CrossRef]
  3. Zhang, R.; Khalizov, A.; Wang, L.; Hu, M.; Xu, W. Nucleation and growth of nanoparticles in the atmosphere. Chem. Rev. 2012, 112, 1957–2011. [Google Scholar] [CrossRef] [PubMed]
  4. Hu, M.; Shang, D.; Guo, S.; Wu, Z. Mechanism of new particle formation and growth as well as environmental effects under complex air pollution in china. Acta Chim. Sin. 2016, 74, 385–391. [Google Scholar] [CrossRef]
  5. Ren, J.; Chen, L.; Fan, T.; Liu, J.; Jiang, S.; Zhang, F. The npf effect on ccn number concentrations: A review and re-evaluation of observations from 35 sites worldwide. Geophys. Res. Lett. 2021, 48, e2021GL095190. [Google Scholar] [CrossRef]
  6. Guo, S.; Hu, M.; Peng, J.; Wu, Z.; Zamora, M.L.; Shang, D.; Du, Z.; Zheng, J.; Fang, X.; Tang, R.; et al. Remarkable nucleation and growth of ultrafine particles from vehicular exhaust. Proc. Natl. Acad. Sci. USA 2020, 117, 3427–3432. [Google Scholar] [CrossRef]
  7. Kulmala, M.; Cai, R.; Stolzenburg, D.; Zhou, Y.; Dada, L.; Guo, Y.; Yan, C.; Petaja, T.; Jiang, J.; Kerminen, V.M. The contribution of new particle formation and subsequent growth to haze formation. Environ. Sci. Atmos. 2022, 2, 352–361. [Google Scholar] [CrossRef]
  8. Nieminen, T.; Kerminen, V.M.; Petaja, T.; Aalto, P.P.; Arshinov, M.; Asmi, E.; Baltensperger, U.; Beddows, D.C.S.; Beukes, J.P.; Collins, D.; et al. Global analysis of continental boundary layer new particle formation based on long-term measurements. Atmos. Chem. Phys. 2018, 18, 14737–14756. [Google Scholar] [CrossRef]
  9. Wang, Z.; Wu, Z.; Yue, D.; Shang, D.; Guo, S.; Sun, J.; Ding, A.; Wang, L.; Jiang, J.; Guo, H.; et al. New particle formation in china: Current knowledge and further directions. Sci. Total Environ. 2017, 577, 258–266. [Google Scholar] [CrossRef]
  10. Chu, B.; Kerminen, V.M.; Bianchi, F.; Yan, C.; Petäjä, T.; Kulmala, M. Atmospheric new particle formation in china. Atmos. Chem. Phys. 2019, 19, 115–138. [Google Scholar] [CrossRef]
  11. Deng, C.; Fu, Y.; Dada, L.; Yan, C.; Cai, R.; Yang, D.; Zhou, Y.; Yin, R.; Lu, Y.; Li, X.; et al. Seasonal characteristics of new particle formation and growth in urban beijing. Environ. Sci. Technol. 2020, 54, 8547–8557. [Google Scholar] [CrossRef] [PubMed]
  12. Wang, Z.B.; Hu, M.; Mogensen, D.; Yue, D.L.; Zheng, J.; Zhang, R.Y.; Liu, Y.; Yuan, B.; Li, X.; Shao, M.; et al. The simulations of sulfuric acid concentration and new particle formation in an urban atmosphere in china. Atmos. Chem. Phys. 2013, 13, 11157–11167. [Google Scholar] [CrossRef]
  13. Yang, S.H.; Liu, Z.R.; Clusius, P.S.; Liu, Y.C.; Zou, J.N.; Yang, Y.; Zhao, S.M.; Zhang, G.Z.; Xu, Z.J.; Ma, Z.Q.; et al. Chemistry of new particle formation and growth events during wintertime in suburban area of beijing: Insights from highly polluted atmosphere. Atmos. Res. 2021, 255, 10. [Google Scholar] [CrossRef]
  14. Almeida, J.; Schobesberger, S.; Kurten, A.; Ortega, I.K.; Kupiainen-Maatta, O.; Praplan, A.P.; Adamov, A.; Amorim, A.; Bianchi, F.; Breitenlechner, M.; et al. Molecular understanding of sulphuric acid-amine particle nucleation in the atmosphere. Nature 2013, 502, 359–363. [Google Scholar] [CrossRef]
  15. Yao, L.; Garmash, O.; Bianchi, F.; Zheng, J.; Yan, C.; Kontkanen, J.; Junninen, H.; Mazon, S.B.; Ehn, M.; Paasonen, P.; et al. Atmospheric new particle formation from sulfuric acid and amines in a chinese megacity. Science 2018, 361, 278–281. [Google Scholar] [CrossRef]
  16. Cai, R.; Yan, C.; Yang, D.; Yin, R.; Lu, Y.; Deng, C.; Fu, Y.; Ruan, J.; Li, X.; Kontkanen, J.; et al. Sulfuric acid–amine nucleation in urban beijing. Atmos. Chem. Phys. 2021, 21, 2457–2468. [Google Scholar] [CrossRef]
  17. Shen, X.J.; Sun, J.Y.; Kivekas, N.; Kristensson, A.; Zhang, X.Y.; Zhang, Y.M.; Zhang, L.; Fan, R.X.; Qi, X.F.; Ma, Q.L.; et al. Spatial distribution and occurrence probability of regional new particle formation events in eastern china. Atmos. Chem. Phys. 2018, 18, 587–599. [Google Scholar] [CrossRef]
  18. Zhou, Y.; Hakala, S.; Yan, C.; Gao, Y.; Yao, X.; Chu, B.; Chan, T.; Kangasluoma, J.; Gani, S.; Kontkanen, J.; et al. Measurement report: New particle formation characteristics at an urban and a mountain station in northern china. Atmos. Chem. Phys. 2021, 21, 17885–17906. [Google Scholar] [CrossRef]
  19. Wang, Z.B.; Hu, M.; Sun, J.Y.; Wu, Z.J.; Yue, D.L.; Shen, X.J.; Zhang, Y.M.; Pei, X.Y.; Cheng, Y.F.; Wiedensohler, A. Characteristics of regional new particle formation in urban and regional background environments in the north china plain. Atmos. Chem. Phys. 2013, 13, 12495–12506. [Google Scholar] [CrossRef]
  20. Jun, Y.-S.; Jeong, C.-H.; Sabaliauskas, K.; Richard Leaitch, W.; Evans, G.J. A year-long comparison of particle formation events at paired urban and rural locations. Atmos. Pollut. Res. 2014, 5, 447–454. [Google Scholar] [CrossRef]
  21. Salma, I.; Németh, Z.; Kerminen, V.M.; Aalto, P.; Nieminen, T.; Weidinger, T.; Molnár, Á.; Imre, K.; Kulmala, M. Regional effect on urban atmospheric nucleation. Atmos. Chem. Phys. 2016, 16, 8715–8728. [Google Scholar] [CrossRef]
  22. Vana, M.; Komsaare, K.; Horrak, U.; Mirme, S.; Nieminen, T.; Kontkanen, J.; Manninen, H.E.; Petaja, T.; Noe, S.M.; Kulmala, M. Characteristics of new-particle formation at three smear stations. Boreal Environ. Res. 2016, 21, 345–362. [Google Scholar]
  23. Kalkavouras, P.; BougiatiotI, A.; Hussein, T.; Kalivitis, N.; Stavroulas, I.; Michalopoulos, P.; Mihalopoulos, N. Regional new particle formation over the eastern mediterranean and middle east. Atmosphere 2021, 12, 13. [Google Scholar] [CrossRef]
  24. Kalkavouras, P.; Bougiatioti, A.; Kalivitis, N.; Stavroulas, I.; Tombrou, M.; Nenes, A.; Mihalopoulos, N. Regional new particle formation as modulators of cloud condensation nuclei and cloud droplet number in the eastern mediterranean. Atmos. Chem. Phys. 2019, 19, 6185–6203. [Google Scholar] [CrossRef]
  25. Yan, S.; Wu, G. So2 emissions in China—Their network and hierarchical structures. Sci. Rep. 2017, 7, 46216. [Google Scholar] [CrossRef] [PubMed]
  26. Wiedensohler, A.; Birmili, W.; Nowak, A.; Sonntag, A.; Weinhold, K.; Merkel, M.; Wehner, B.; Tuch, T.; Pfeifer, S.; Fiebig, M.; et al. Mobility particle size spectrometers: Harmonization of technical standards and data structure to facilitate high quality long-term observations of atmospheric particle number size distributions. Atmos. Meas. Tech. 2012, 5, 657–685. [Google Scholar] [CrossRef]
  27. Wu, Z.; Hu, M.; Liu, S.; Wehner, B.; Bauer, S.; Ma ßling, A.; Wiedensohler, A.; Petäjä, T.; Dal Maso, M.; Kulmala, M. New particle formation in beijing, china: Statistical analysis of a 1-year data set. J. Geophys. Res. 2007, 112, D09209. [Google Scholar] [CrossRef]
  28. Shang, D.; Hu, M.; Tang, L.; Fang, X.; Chen, S.; Zeng, L.; Guo, S.; Zhang, Y.; Wu, Z. New particle formation occurrence in the urban atmosphere of beijing during 2013–2020. J. Geophys. Res. Atmos. 2023, 128, e2022JD038334. [Google Scholar] [CrossRef]
  29. Dal Maso, M.; Kulmala, M.; Riipinen, I.; Wagner, R.; Hussein, T.; Aalto, P.P.; Lehtinen, K.E.J. Formation and growth of fresh atmospheric aerosols: Eight years of aerosol size distribution data from smear ii, hyytiala, finland. Boreal Environ. Res. 2005, 10, 323–336. [Google Scholar]
  30. Yang, L.; Nie, W.; Liu, Y.; Xu, Z.; Xiao, M.; Qi, X.; Li, Y.; Wang, R.; Zou, J.; Paasonen, P.; et al. Toward building a physical proxy for gas-phase sulfuric acid concentration based on its budget analysis in polluted yangtze river delta, east china. Environ. Sci. Technol. 2021, 55, 6665–6676. [Google Scholar] [CrossRef]
  31. Arathala, P.; Musah, R.A. Thermochemistry and kinetics of the atmospheric oxidation reactions of propanesulfinyl chloride initiated by oh radicals: A computational approach. J. Phys. Chem. A 2022, 126, 4264–4276. [Google Scholar] [CrossRef]
  32. Riccobono, F.; Rondo, L.; Sipilä, M.; Barmet, P.; Curtius, J.; Dommen, J.; Ehn, M.; Ehrhart, S.; Kulmala, M.; Kürten, A.; et al. Contribution of sulfuric acid and oxidized organic compounds to particle formation and growth. Atmos. Chem. Phys. 2012, 12, 9427–9439. [Google Scholar] [CrossRef]
  33. Sipilä, M.; Berndt, T.; Petäjä, T.; Brus, D.; Vanhanen, J.; Stratmann, F.; Patokoski, J.; Mauldin, R.L.; Hyvärinen, A.-P.; Lihavainen, H.; et al. The role of sulfuric acid in atmospheric nucleation. Science 2010, 327, 1243–1246. [Google Scholar] [CrossRef]
  34. Lu, Y.Q.; Yan, C.; Fu, Y.Y.; Chen, Y.; Liu, Y.L.; Yang, G.; Wang, Y.W.; Bianchi, F.; Chu, B.W.; Zhou, Y.; et al. A proxy for atmospheric daytime gaseous sulfuric acid concentration in urban beijing. Atmos. Chem. Phys. 2019, 19, 1971–1983. [Google Scholar] [CrossRef]
  35. McGrath, M.J.; Olenius, T.; Ortega, I.K.; Loukonen, V.; Paasonen, P.; Kurtén, T.; Kulmala, M.; Vehkamäki, H. Atmospheric cluster dynamics code: A flexible method for solution of the birth-death equations. Atmos. Chem. Phys. 2012, 12, 2345–2355. [Google Scholar] [CrossRef]
  36. Chang, Y.; Gao, Y.; Lu, Y.; Qiao, L.; Kuang, Y.; Cheng, K.; Wu, Y.; Lou, S.; Jing, S.; Wang, H.; et al. Discovery of a potent source of gaseous amines in urban china. Environ. Sci. Technol. Lett. 2021, 8, 725–731. [Google Scholar] [CrossRef]
  37. Ge, X.L.; Wexler, A.S.; Clegg, S.L. Atmospheric amines—Part i. A review. Atmos. Environ. 2011, 45, 524–546. [Google Scholar] [CrossRef]
  38. Arathala, P.; Musah, R.A. Catalytic effect of water and formic acid on the reaction of carbonyl sulfide with dimethyl amine under tropospheric conditions. Phys. Chem. Chem. Phys. 2021, 23, 8752–8766. [Google Scholar] [CrossRef]
  39. Yao, L.; Wang, M.-Y.; Wang, X.-K.; Liu, Y.-J.; Chen, H.-F.; Zheng, J.; Nie, W.; Ding, A.-J.; Geng, F.-H.; Wang, D.-F.; et al. Detection of atmospheric gaseous amines and amides by a high-resolution time-of-flight chemical ionization mass spectrometer with protonated ethanol reagent ions. Atmos. Chem. Phys. 2016, 16, 14527–14543. [Google Scholar] [CrossRef]
  40. Zheng, J.; Ma, Y.; Chen, M.; Zhang, Q.; Wang, L.; Khalizov, A.F.; Yao, L.; Wang, Z.; Wang, X.; Chen, L. Measurement of atmospheric amines and ammonia using the high resolution time-of-flight chemical ionization mass spectrometry. Atmos. Environ. 2015, 102, 249–259. [Google Scholar] [CrossRef]
  41. Myllys, N.; Kubečka, J.; Besel, V.; Alfaouri, D.; Olenius, T.; Smith, J.N.; Passananti, M. Role of base strength, cluster structure and charge in sulfuric-acid-driven particle formation. Atmos. Chem. Phys. 2019, 19, 9753–9768. [Google Scholar]
  42. Li, H.; Ning, A.; Zhong, J.; Zhang, H.; Liu, L.; Zhang, Y.; Zhang, X.; Zeng, X.C.; He, H. Influence of atmospheric conditions on sulfuric acid-dimethylamine-ammonia-based new particle formation. Chemosphere 2020, 245, 125554. [Google Scholar] [PubMed]
  43. Kürten, A.; Bianchi, F.; Almeida, J.; Kupiainen-Määttä, O.; Dunne, E.M.; Duplissy, J.; Williamson, C.; Barmet, P.; Breitenlechner, M.; Dommen, J.; et al. Experimental particle formation rates spanning tropospheric sulfuric acid and ammonia abundances, ion production rates, and temperatures. J. Geophys. Res. Atmos. 2016, 121, 12–377. [Google Scholar]
  44. Li, X.X.; Song, S.J.; Zhou, W.; Hao, J.M.; Worsnop, D.R.; Jiang, J.K. Interactions between aerosol organic components and liquid water content during haze episodes in beijing. Atmos. Chem. Phys. 2019, 19, 12163–12174. [Google Scholar]
  45. Liu, Y.C.; Wu, Z.J.; Wang, Y.; Xiao, Y.; Gu, F.T.; Zheng, J.; Tan, T.Y.; Shang, D.J.; Wu, Y.S.; Zeng, L.M.; et al. Submicrometer particles are in the liquid state during heavy haze episodes in the urban atmosphere of beijing, china. Environ. Sci. Technol. Lett. 2017, 4, 427–432. [Google Scholar]
  46. Zheng, G.J.; Duan, F.K.; Su, H.; Ma, Y.L.; Cheng, Y.; Zheng, B.; Zhang, Q.; Huang, T.; Kimoto, T.; Chang, D.; et al. Exploring the severe winter haze in beijing: The impact of synoptic weather, regional transport and heterogeneous reactions. Atmos. Chem. Phys. 2015, 15, 2969–2983. [Google Scholar]
  47. Shang, D.; Peng, J.; Guo, S.; Wu, Z.; Hu, M. Secondary aerosol formation in winter haze over the beijing-tianjin-hebei region, china. Front. Environ. Sci. Eng. 2020, 15, 34. [Google Scholar]
  48. Yan, C.; Nie, W.; Vogel, A.L.; Dada, L.; Lehtipalo, K.; Stolzenburg, D.; Wagner, R.; Rissanen, M.P.; Xiao, M.; Ahonen, L.; et al. Size-dependent influence of nox on the growth rates of organic aerosol particles. Sci. Adv. 2020, 6, 9. [Google Scholar]
  49. Wildt, J.; Mentel, T.F.; Kiendler-Scharr, A.; Hoffmann, T.; Andres, S.; Ehn, M.; Kleist, E.; Müsgen, P.; Rohrer, F.; Rudich, Y.; et al. Suppression of new particle formation from monoterpene oxidation by nox. Atmos. Chem. Phys. 2014, 14, 2789–2804. [Google Scholar]
  50. Nair, A.A.; Yua, F.; Luo, G. The importance of ammonia for springtime atmospheric new particle formation and aerosol number abundance over the united states. Sci. Total Environ. 2022, 863, 160756. [Google Scholar]
  51. Wang, M.; Kong, W.; Marten, R.; He, X.-C.; Chen, D.; Pfeifer, J.; Heitto, A.; Kontkanen, J.; Dada, L.; Kurten, A.; et al. Rapid growth of new atmospheric particles by nitric acid and ammonia condensation. Nature 2020, 581, 184–189. [Google Scholar] [PubMed]
  52. Kuerten, A. New particle formation from sulfuric acid and ammonia: Nucleation and growth model based on thermodynamics derived from cloud measurements for a wide range of conditions. Atmos. Chem. Phys. 2019, 19, 5033–5050. [Google Scholar]
  53. Kalkavouras, P.; Bougiatioti, A.; Grivas, G.; Stavroulas, I.; Kalivitis, N.; Liakakou, E.; Gerasopoulos, E.; Pilinis, C.; Mihalopoulos, N. On the regional aspects of new particle formation in the eastern mediterranean: A comparative study between a background and an urban site based on long term observations. Atmos. Res. 2020, 239, 14. [Google Scholar]
  54. Cai, R.; Yin, R.; Yan, C.; Yang, D.; Deng, C.; Dada, L.; Kangasluoma, J.; Kontkanen, J.; Halonen, R.; Ma, Y.; et al. The missing base molecules in atmospheric acid-base nucleation. Natl. Sci. Rev. 2022, 9, nwac137. [Google Scholar]
  55. Bianchi, F.; Kurten, T.; Riva, M.; Mohr, C.; Rissanen, M.P.; Roldin, P.; Berndt, T.; Crounse, J.D.; Wennberg, P.O.; Mentel, T.F.; et al. Highly oxygenated organic molecules (hom) from gas-phase autoxidation involving peroxy radicals: A key contributor to atmospheric aerosol. Chem. Rev. 2019, 119, 3472–3509. [Google Scholar]
  56. Qi, X.; Ding, A.; Roldin, P.; Xu, Z.; Zhou, P.; Sarnela, N.; Nie, W.; Huang, X.; Rusanen, A.; Ehn, M.; et al. Modelling studies of homs and their contributions to new particle formation and growth: Comparison of boreal forest in finland and a polluted environment in china. Atmos. Chem. Phys. 2018, 18, 11779–11791. [Google Scholar]
  57. Roldin, P.; Ehn, M.; Kurten, T.; Olenius, T.; Rissanen, M.P.; Sarnela, N.; Elm, J.; Rantala, P.; Hao, L.; Hyttinen, N.; et al. The role of highly oxygenated organic molecules in the boreal aerosol-cloud-climate system. Nat. Commun. 2019, 10, 4370. [Google Scholar]
  58. Wang, Z.B.; Hu, M.; Yue, D.L.; Zheng, J.; Zhang, R.Y.; Wiedensohler, A.; Wu, Z.J.; Nieminen, T.; Boy, M. Evaluation on the role of sulfuric acid in the mechanisms of new particle formation for beijing case. Atmos. Chem. Phys. 2011, 11, 12663–12671. [Google Scholar]
  59. Qiao, X.; Yan, C.; Li, X.; Guo, Y.; Yin, R.; Deng, C.; Li, C.; Nie, W.; Wang, M.; Cai, R.; et al. Contribution of atmospheric oxygenated organic compounds to particle growth in an urban environment. Environ. Sci. Technol. 2021, 55, 13646–13656. [Google Scholar]
  60. Shang, D.; Hu, M.; Tang, L.; Fang, X.; Liu, Y.; Wu, Y.; Du, Z.; Cai, X.; Wu, Z.; Lou, S.; et al. Significant effects of transport on nanoparticles during new particle formation events in the atmosphere of beijing. Particuology 2023, 80, 1–10. [Google Scholar]
  61. Dinoi, A.; Gulli, D.; Weinhold, K.; Ammoscato, I.; Calidonna, C.R.; Wiedensohler, A.; Contini, D. Characterization of ultrafine particles and the occurrence of new particle formation events in an urban and coastal site of the mediterranean area. Atmos. Chem. Phys. 2023, 23, 2167–2181. [Google Scholar]
  62. Cai, R.; Yang, D.; Fu, Y.; Wang, X.; Li, X.; Ma, Y.; Hao, J.; Zheng, J.; Jiang, J. Aerosol surface area concentration: A governing factor for new particle formation in beijing. Atmos. Chem. Phys. Discuss. 2017, 2017, 12327–12340. [Google Scholar]
  63. Yan, C.; Yin, R.; Lu, Y.; Dada, L.; Yang, D.; Fu, Y.; Kontkanen, J.; Deng, C.; Garmash, O.; Ruan, J.; et al. The synergistic role of sulfuric acid, bases, and oxidized organics governing new-particle formation in beijing. Geophys. Res. Lett. 2021, 48, e2020GL091944. [Google Scholar]
  64. Kulmala, M.; Kerminen, V.M.; Petaja, T.; Ding, A.J.; Wang, L. Atmospheric gas-to-particle conversion: Why npf events are observed in megacities? Faraday Discuss. 2017, 200, 271–288. [Google Scholar]
  65. Mao, J.; Yu, F.; Zhang, Y.; An, J.; Wang, L.; Zheng, J.; Yao, L.; Luo, G.; Ma, W.; Yu, Q.; et al. High-resolution modeling of gaseous methylamines over a polluted region in china: Source-dependent emissions and implications of spatial variations. Atmos. Chem. Phys. 2018, 18, 7933–7950. [Google Scholar]
  66. Yuan, B.; Coggon, M.M.; Koss, A.R.; Warneke, C.; Eilerman, S.; Peischl, J.; Aikin, K.C.; Ryerson, T.B.; de Gouw, J.A. Emissions of volatile organic compounds (vocs) from concentrated animal feeding operations (cafos): Chemical compositions and separation of sources. Atmos. Chem. Phys. 2017, 17, 4945–4956. [Google Scholar]
Figure 1. The BJ site (red) location in Beijing and the CL site in Zhangjiakou. The blue square represents the 5th Ring Road in Beijing. The measurement was conducted from 30 January to 14 March 2022.
Atmosphere 14 01395 g001
Figure 2. Time series of (a) temperature; (b) RH; (d) PM2.5; (e) NOx; and (f) SO2 at the urban BJ site (red) and mountainous CL site (blue) during the measurement campaign in 2022. Wind speed at BJ site is shown in panel (c), and the winds from the north (hollow circles) and south (solid circles) are separated.
Atmosphere 14 01395 g002
Figure 3. Concentration of sulfuric acid (a) and NH3 (b), and particle number size distributions (c,d) at CL (c) and BJ (d) sites during the measurements (21 February–14 March) in 2022. The purple line shows the level of CS.
Atmosphere 14 01395 g003
Figure 4. The diurnal variations in (a) J3-25, (b) PN3-25, (c) PN25-100, and (d) PN100-800 on NPF (dark color) and non-NPF (light color) days at BJ (red) and CL (blue) sites. Median values were calculated over the days.
Atmosphere 14 01395 g004
Figure 5. The diurnal variations in (a) CS, (b) SO2, (c) SA, (d) NH3, (e) isoprene, (f) 1,2,4-Trimethylbenzene (124TMB), (g) UVB, and (h) NOx on NPF (dark color) and non-NPF (light color) days at BJ (red) and CL (blue) sites. Median values were calculated over the days.
Atmosphere 14 01395 g005
Figure 6. The comparison between NPF (solid circles) and non-NPF (hollow circles) days at BJ (red) and CL (blue) sites. (a) Relationship between CS and SA, (b) relationship between J1.45 simulated by the ARCA model ([DMA] = 10−3 × [NH3] at both sites), and J3 calculated based on measurements, (c) the same for (b), except that [DMA] = 10−4 × [NH3] at the CL site.
Atmosphere 14 01395 g006
Figure 7. The near-surface wind distribution at NPF start time during three NPF days: (a) 21 February, (b) 1 March, and (c) 14 March, around BJ and CL sites. The points in the figures represent the BJ and CL sites, respectively. The color of the legend represents the wind speed.
Atmosphere 14 01395 g007
Disclaimer/Publisher’s Note: The statements, opinions and data contained in all publications are solely those of the individual author(s) and contributor(s) and not of MDPI and/or the editor(s). MDPI and/or the editor(s) disclaim responsibility for any injury to people or property resulting from any ideas, methods, instructions or products referred to in the content.

