Article

Characteristic Analysis of the 10–30-Day Intraseasonal Oscillation over Mid-High-Latitude Eurasia in Boreal Summer

Key Laboratory of Meteorological Disaster, Ministry of Education (KLME)/Collaborative Innovation Center on Forecast and Evaluation of Meteorological Disasters (CIC-FEMD)/Joint International Research Laboratory of Climate and Environmental Change (ILCEC), Nanjing University of Information Science and Technology, Nanjing 210044, China
*
Author to whom correspondence should be addressed.
Atmosphere 2023, 14(9), 1372; https://doi.org/10.3390/atmos14091372
Submission received: 30 July 2023 / Revised: 28 August 2023 / Accepted: 29 August 2023 / Published: 30 August 2023
(This article belongs to the Section Meteorology)

Abstract

:
The aim of this study is to investigate the characteristics of the intraseasonal oscillation (ISO) with a 10–30-day cycle over mid-high-latitude Eurasia during boreal summer. The leading mode of this ISO is determined using an extended empirical orthogonal function analysis. Through a phase composite analysis, it is observed that a southeastward-propagating wave train with a quasi-barotropic structure is present in Eurasia. The dynamical mechanism and energy conversion affecting its propagation are also analyzed. The negative (positive) temperature tendency appears in the southeastern part of the temperature anomaly in the lower troposphere (upper troposphere), resulting in further southeastward displacement of the temperature perturbation. A diagnosis of temperature tendency shows that the main cause of the southeastward movement is the advection of anomalous temperature by the mean zonal wind. The energy conversion analysis reveals that by converting kinetic energy and potential energy, the ISO perturbation acquires energy from the summertime mean flow during its southeastward movement.

1. Introduction

As one of the most important predictability sources for the sub-seasonal prediction, the atmospheric intraseasonal oscillation (ISO) has attracted considerable attention in recent decades [1,2,3,4,5,6]. The tropical ISO has a great influence on the tropical cyclone activity [7,8,9], the monsoon systems [10,11] and extreme weather [12,13,14]. The westward tilting vertical structure, the diversity in propagation, and the interannual variability of the tropical ISO have been extensively studied [15,16,17,18].
Previous studies have proved the existence of ISO over the extratropical regions, such as the mid-high latitudes [19,20,21,22,23,24]. Although as critical to regional weather and climate as the tropical ISO, the mid-high-latitude ISO has attracted far less attention than the tropical one. It has an important influence on various aspects, including modulate blocking frequency [25,26], precipitation [27] and temperature [28] anomalies. In boreal winter, the 10–60-day mid-high-latitude ISO propagates southeastward and derives energy from the wintertime mean flow as it moves southeastward [29]. The 9–29-day intraseasonal wind signal exhibits eastward and southward propagation over mid-high latitudes [30]. In boreal summer, the 20–70-day mid-high-latitude ISO can affect severe floods and droughts in the Changjiang–Huaihe River Basin by influencing the circulation over the Tibetan Plateau [31]. Moreover, the eastward and westward propagating patterns with dominant periods of 30–50 days are identified, exhibiting distinct tropical–extratropical interactions [32]. The above findings suggest that there is regional diversity in the propagation and periodicity of the mid-high-latitude ISO. In addition, these studies have primarily focused on the mid-high-latitude ISO with a 10–60-day cycle in boreal winter and the low-frequency one (more than 30-day periodicity) in boreal summer. There are still comparatively fewer systematic studies on summertime ISO with a 10–30-day cycle. Investigating the characteristics of the summertime ISO with a 10–30-day cycle will contribute to a deeper understanding of sub-seasonal prediction sources in East Asia; thus, it is worthwhile to further explore.
In this study, the main objective is to analyze the structure and propagation features of the 10–30-day ISO over mid-high latitudes in boreal summer. The specific dynamical mechanism and energy conversion affecting its propagation are also investigated. The remaining sections of this study are organized in the following way. Section 2 displays the data and methodology applied in this study. Section 3.1 describes the evolution characteristics of the dominant ISO mode. In Section 3.2, the reason for the southeastward movement of 10–30-day temperature anomaly is revealed using temperature budget analysis. In Section 3.3, the energy conversion for southeastward propagation is diagnosed. The summary is presented in the final section.

2. Data and Methodology

Daily 5th-generation grid data including meridional wind (v), air temperature (T), 2 m air temperature, vertical velocity (ω), geopotential height (Z), and zonal wind (u) from the European Centre for Medium-Range Weather Forecasts (ERA5) are utilized in this study [33]. The surface air temperature (SAT) is expressed as the 2 m air temperature. The data presented above have a horizontal resolution of 1.5° × 1.5° and range from 1979 to 2021. The summer period for this study is considered to be defined from May 1st to September 30th (MJJAS). To capture the 10–30-day intraseasonal signal, the first step is the removal of the seasonal cycle and the first three harmonics. The next step is to apply a Lanczos band-pass filter of 10–30 days [34] to the data derived above.
An extended empirical orthogonal function (EEOF) analysis [35] is applied in this study to obtain the dominant ISO modes. As noted in previous studies, this method can more effectively describe the temporal and spatial evolution of disturbance compared to conventional empirical orthogonal function analysis [9,20,36].
To investigate the key process leading to the southeastward propagation of the intraseasonal T anomaly, the T tendency equation is diagnosed. This thermodynamic equation can be written as [37]:
T t = u T x v T y ω T p + ω α C p + Q ˙ C p
where Q ˙ stands for the diabatic heat source [38]; C p denotes the specific heat of the air; α represents the air specific volume; and a single prime represents the intraseasonal component (10–30 days).
In the troposphere, T fluctuations on small time scales (e.g., a few months) are correlated with T fluctuations on long time scales (e.g., a few years), as shown in a previous study [39,40]. This result suggests that there is an interaction between different time scales. In order to analyze the relative contributions of varying time scales, the zonal temperature advection anomaly u T x in Equation (1) can be separated into the following nine terms, referring to Hsu and Li [41]:
u T x = u ¯ + u + u T ¯ + T + T x = u ¯ T ¯ x u ¯ T x u ¯ T x u T ¯ x u T x u T x u T ¯ x u T x u T x
where a double prime represents a synoptic-sale (less than 10 days) component and an overbar denotes a low-frequency state (more than 30 days) component. A single prime represents an intraseasonal component (10−30 days).
The energy analysis in this paper utilizes the barotropic kinetic energy conversion equation, which was developed by Hoskins et al. [42]. This equation effectively describes the conversion of energy between the summertime mean and the ISO flow, which is specified as:
CK ̿ iso = v 2 u 2 ̿ 2 u ̿ x v 2 u 2 ̿ 2 v ̿ y u v ̿ u ̿ y u v ̿ v ̿ x
where the double overbar represents the summertime (MJJAS) mean. When the value of CK ̿ iso is positive (negative), it means the ISO disturbance acquires (loses) kinetic energy from (to) the summertime mean flow.
Moreover, an examination is conducted to analyze the transfer of potential energy between the summertime mean flow and the ISO flow. An equation for converting time-averaged and perturbed potential energy developed from the thermodynamic equation can be represented as [29]:
CP ̿ iso = g γ d γ T 0 ( u T ̿ T ̿ x + v T ̿ T ̿ y )
where T0 stands for the standard temperature at sea level with a value taken as 288.15 K. g represents the gravity.   γ represents the actual lapse rate of the atmosphere, while γ d denotes the dry adiabatic lapse rate. In this study, a value of 4.0 × 10⁻³ °C m−1 is assigned to γ d γ . When the value of CP ̿ iso is positive (negative), it means that the intraseasonal disturbance acquires (loses) potential energy from (to) the summertime mean flow.

3. Results

3.1. Evolution Features of the Leading ISO Mode

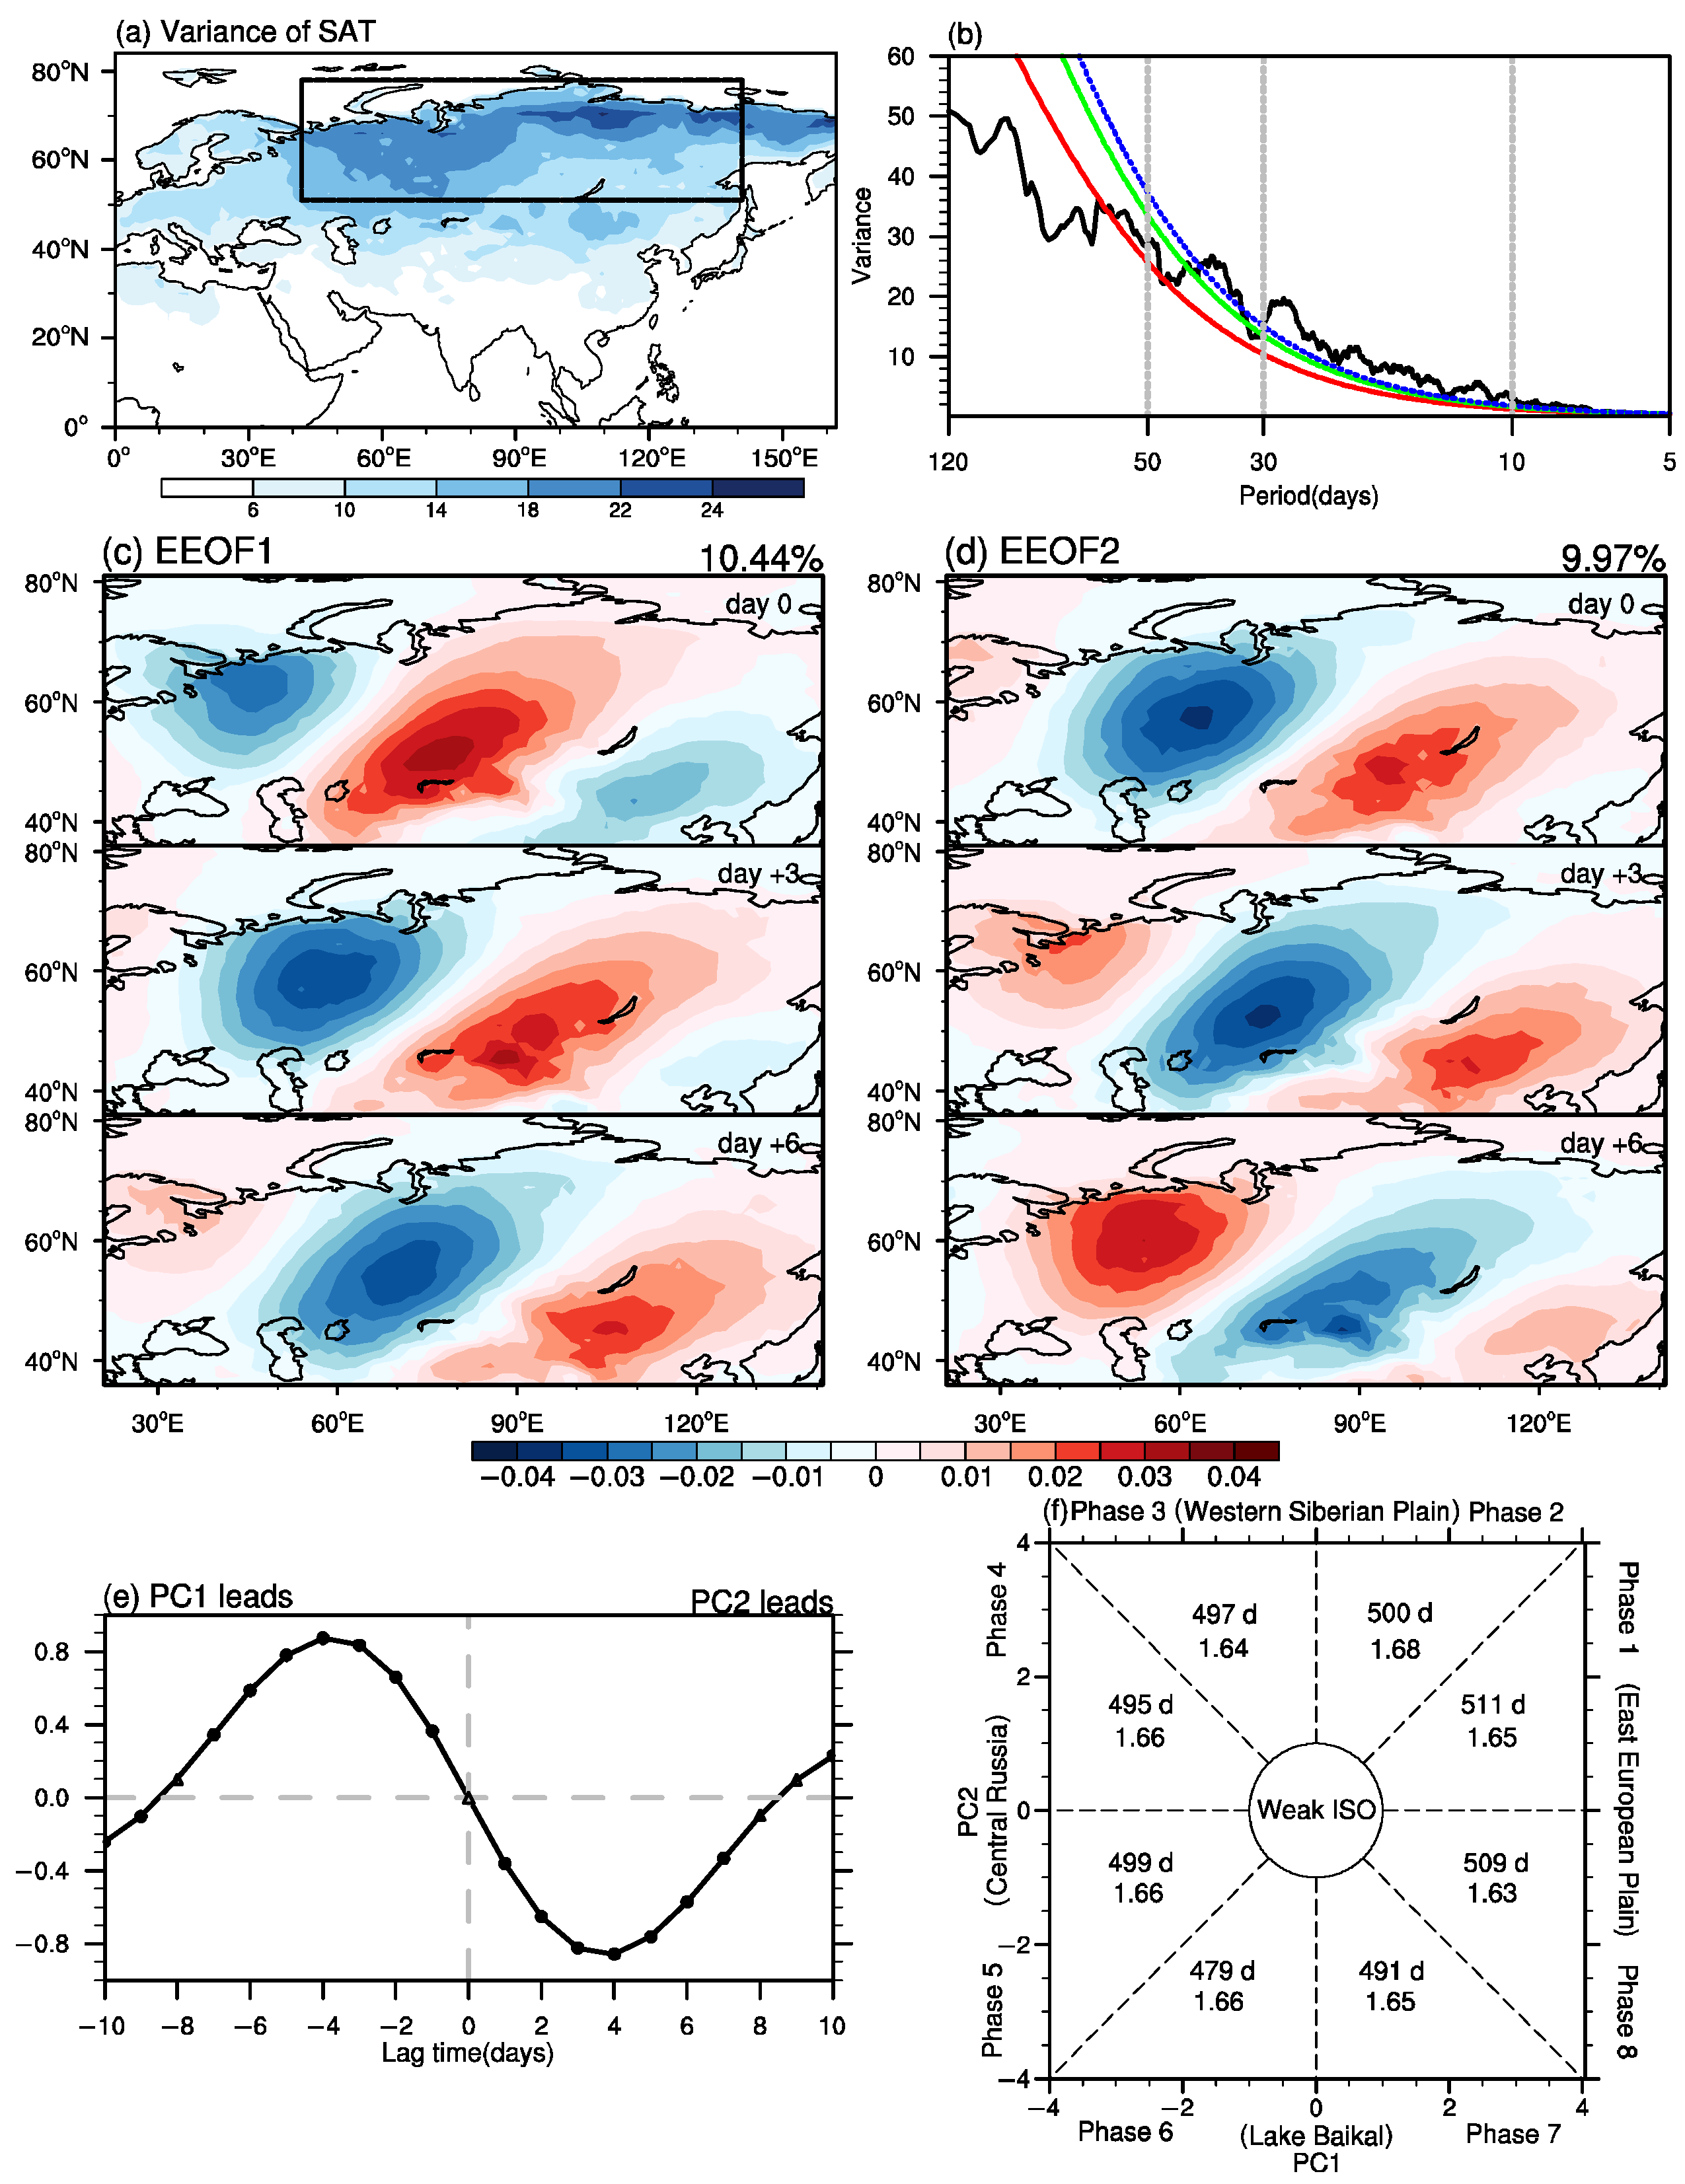
Figure 1a displays the variance distribution of the summertime SAT anomalies. Here, the SAT anomalies are obtained by removing the seasonal cycle and the first three harmonics. The largest variation in SAT is primarily in the mid-high-latitude region (box area in Figure 1a; 51°−78° N, 42°−141° E). The power spectrum analysis is performed on the area-averaged SAT time series over the box area (Figure 1b). It can be seen that the SAT anomalies over this domain exhibit significant cycles of 10–30 days and 30–50 days. As noted in Section 1, the summertime ISO with a 10–30-day cycle over mid-high-latitude Eurasia has received less attention than the low-frequency one. Therefore, unless otherwise stated, the 10–30-day period is the focus of this study.
To obtain the dominant modes, the SAT anomaly filtered for 10–30 days in the region of 21°–141° E, 36°–81° N during the summer period is subjected to an EEOF analysis (Figure 1c,d). As shown, the spatial patterns of the first two modes (EEOF1 and EEOF2) both exhibit a southeastward propagation. The EEOF1 and EEOF2, respectively, explain 10.44% and 9.97% of the total variance. Following the North test [43], the EEOF1 and EEOF2 are not separable and are statistically independent from other modes. There is also a significant positive correlation when the first principal component (PC1) leads the second principal component (PC2) by 4 days (Figure 1e), suggesting that EEOF1 and EEOF2 reflect spatial patterns at different times within the same propagation pattern. With reference to Wheeler and Hendon [44], eight phases are identified using PC1 and PC2 to clearly characterize the evolution of the southeastward-propagating ISO. The specific method of dividing the phase is as follows. First, calculate the phase angle at each time point t, i.e., arctan [PC2(t)/PC1(t)]. The phase angle is then converted into the range [0, 2 π ]. Using an interval of π/4, all time points can be divided into eight phases, as shown in Figure 1f. Finally, the phase of each time point can be determined from the position in Figure 1f. In this paper, strong ISO events with amplitudes ( [ PC 1 2 + PC 2 2 ] 1 / 2 ) greater than 1.0 STD are selected for phase composite. Figure 1f also shows the corresponding days and mean amplitudes for each phase. The number of days indicates the number of events composited for each ISO phase, and the amplitude indicates the intensity of that ISO phase. For example, in phase 2, the negative center of the SAT anomaly is located in the Western Siberian Plain, corresponding to 500 composite days and having the largest mean intensity.
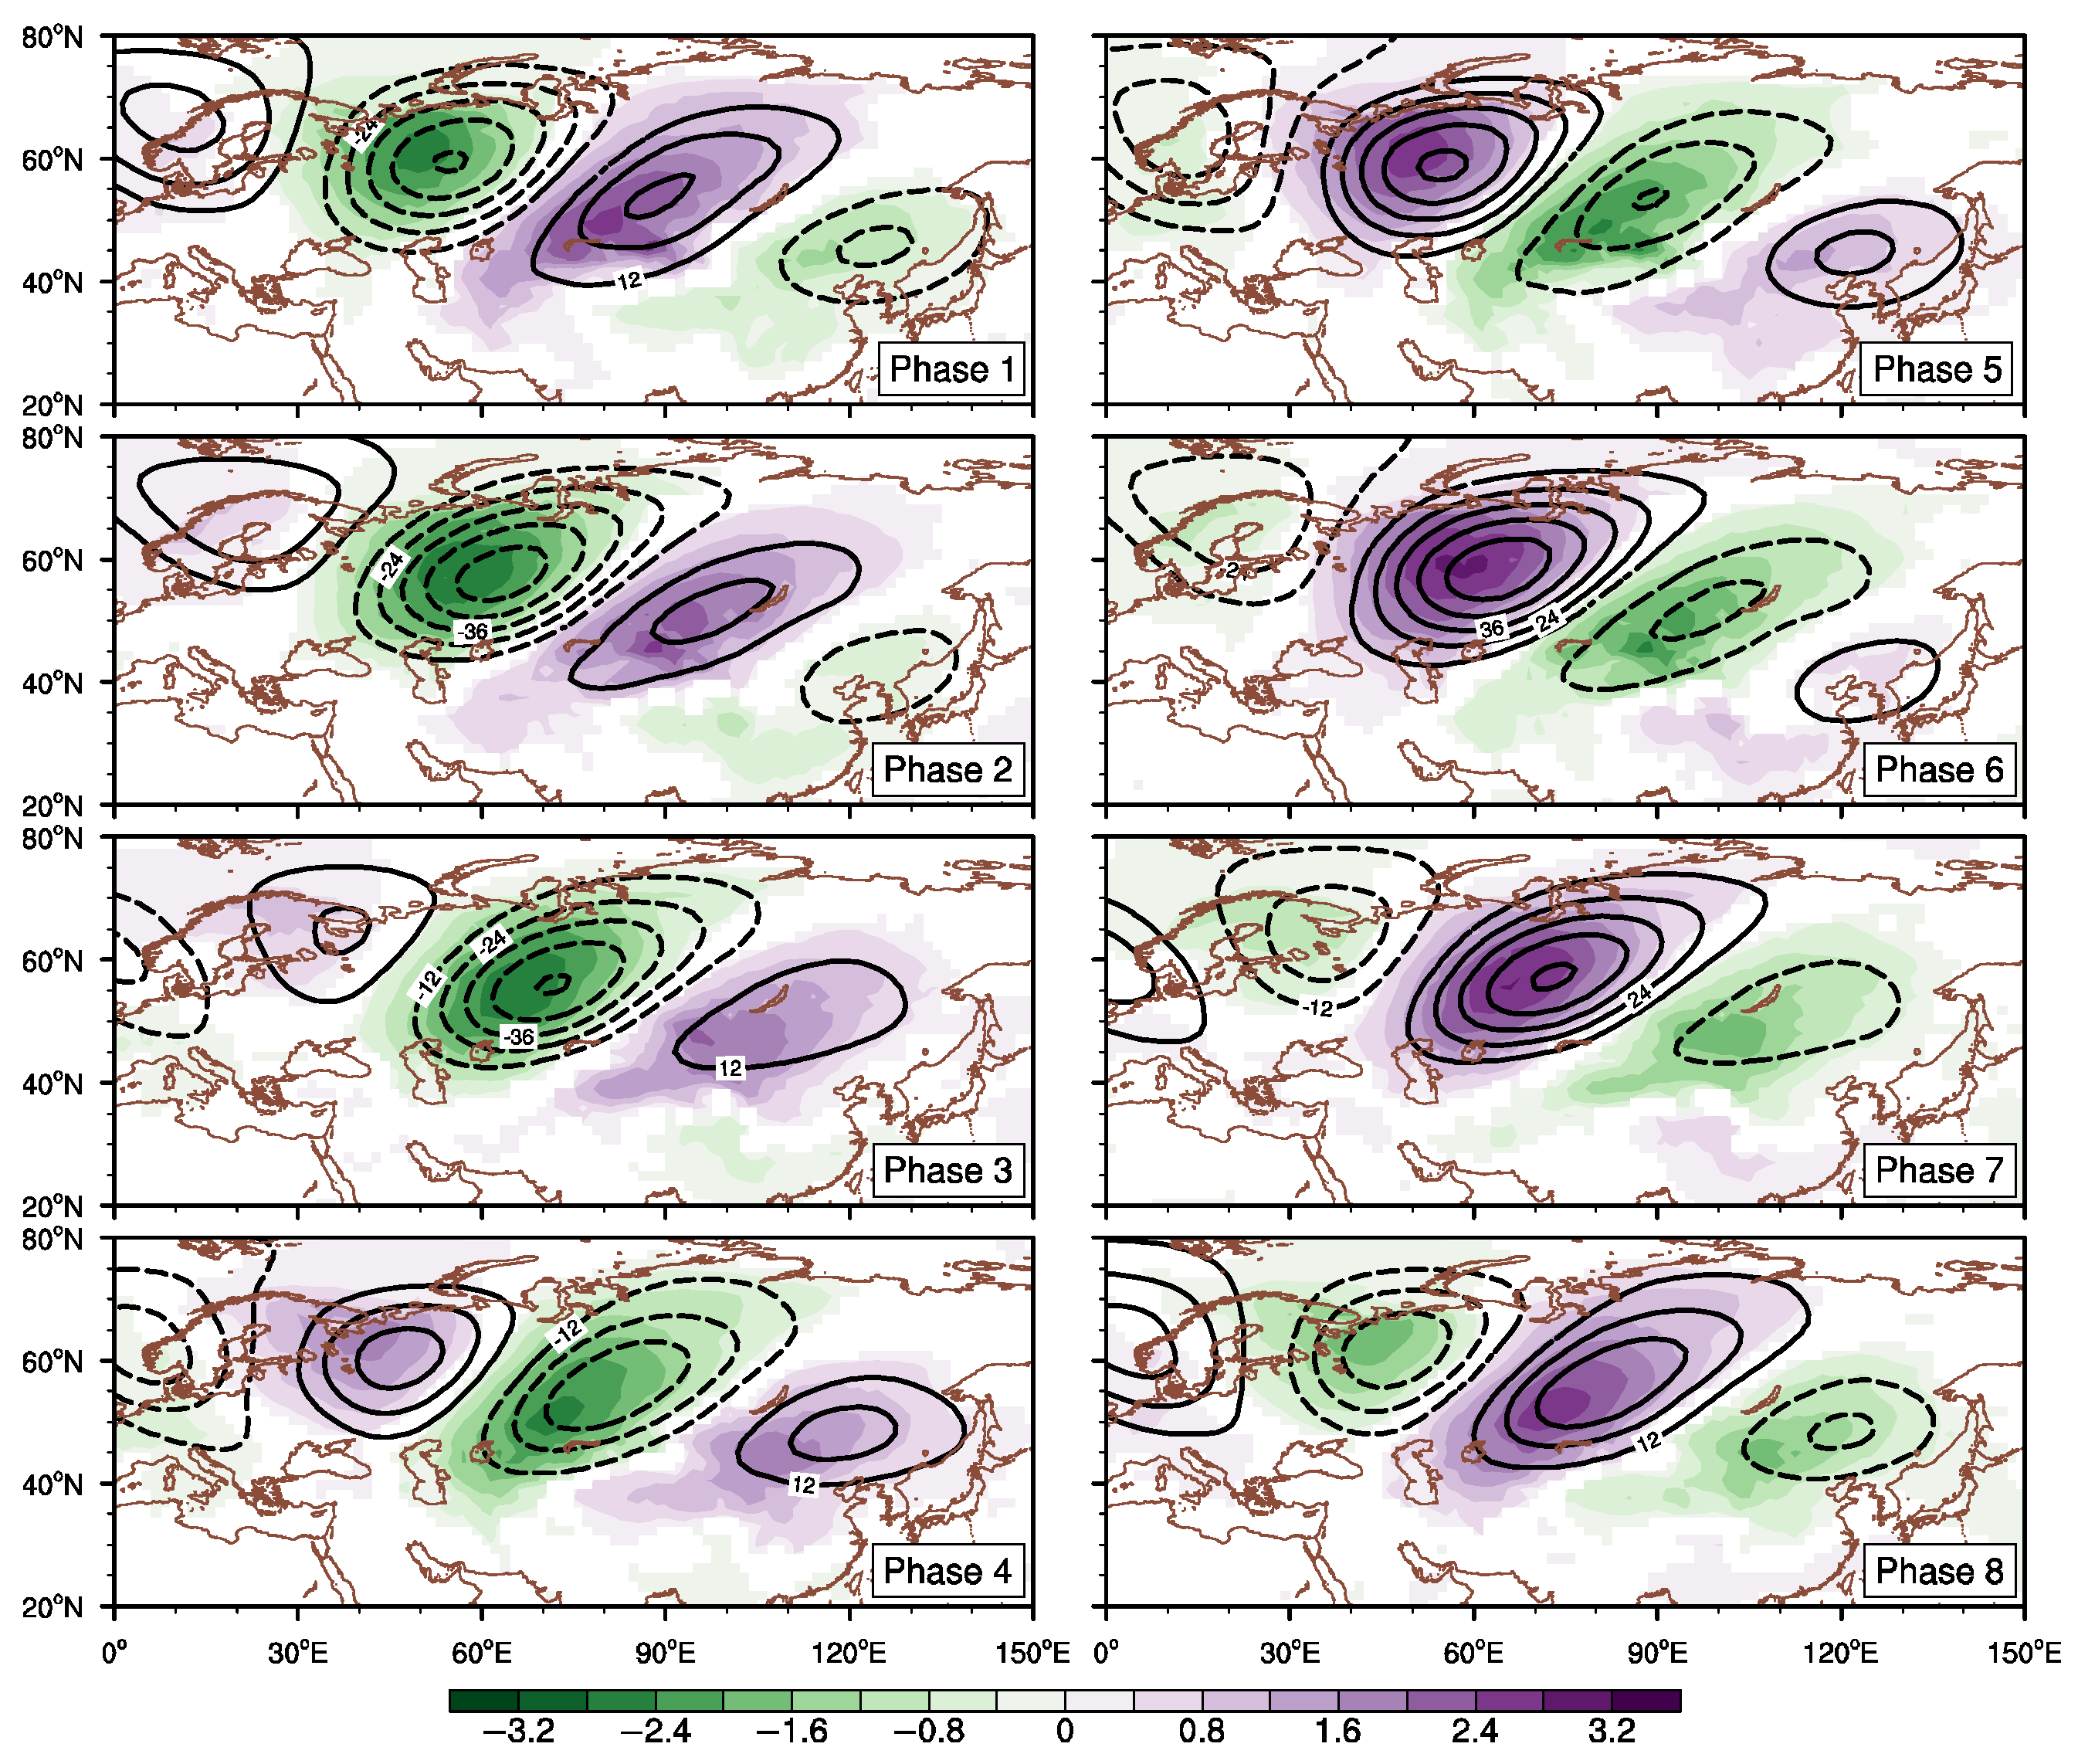
Figure 2 portrays the evolution of 10–30-day 500 hPa Z and SAT anomalies composited under eight phases. It is seen that the notable feature is a southeastward-propagating wave train throughout mid-high-latitude Eurasia. Taking the negative SAT anomaly center in East European at phase one, for example, its approximate maximum perturbation center ranges from the Western Siberian Plain at phase 2 to Central Russia at phase 4. The amplitude enhancement is found at phase 2 and phase 3. During phases 5 to 8, the negative SAT anomaly in Central Russia propagates to Lake Baikal and decreases in these phases.
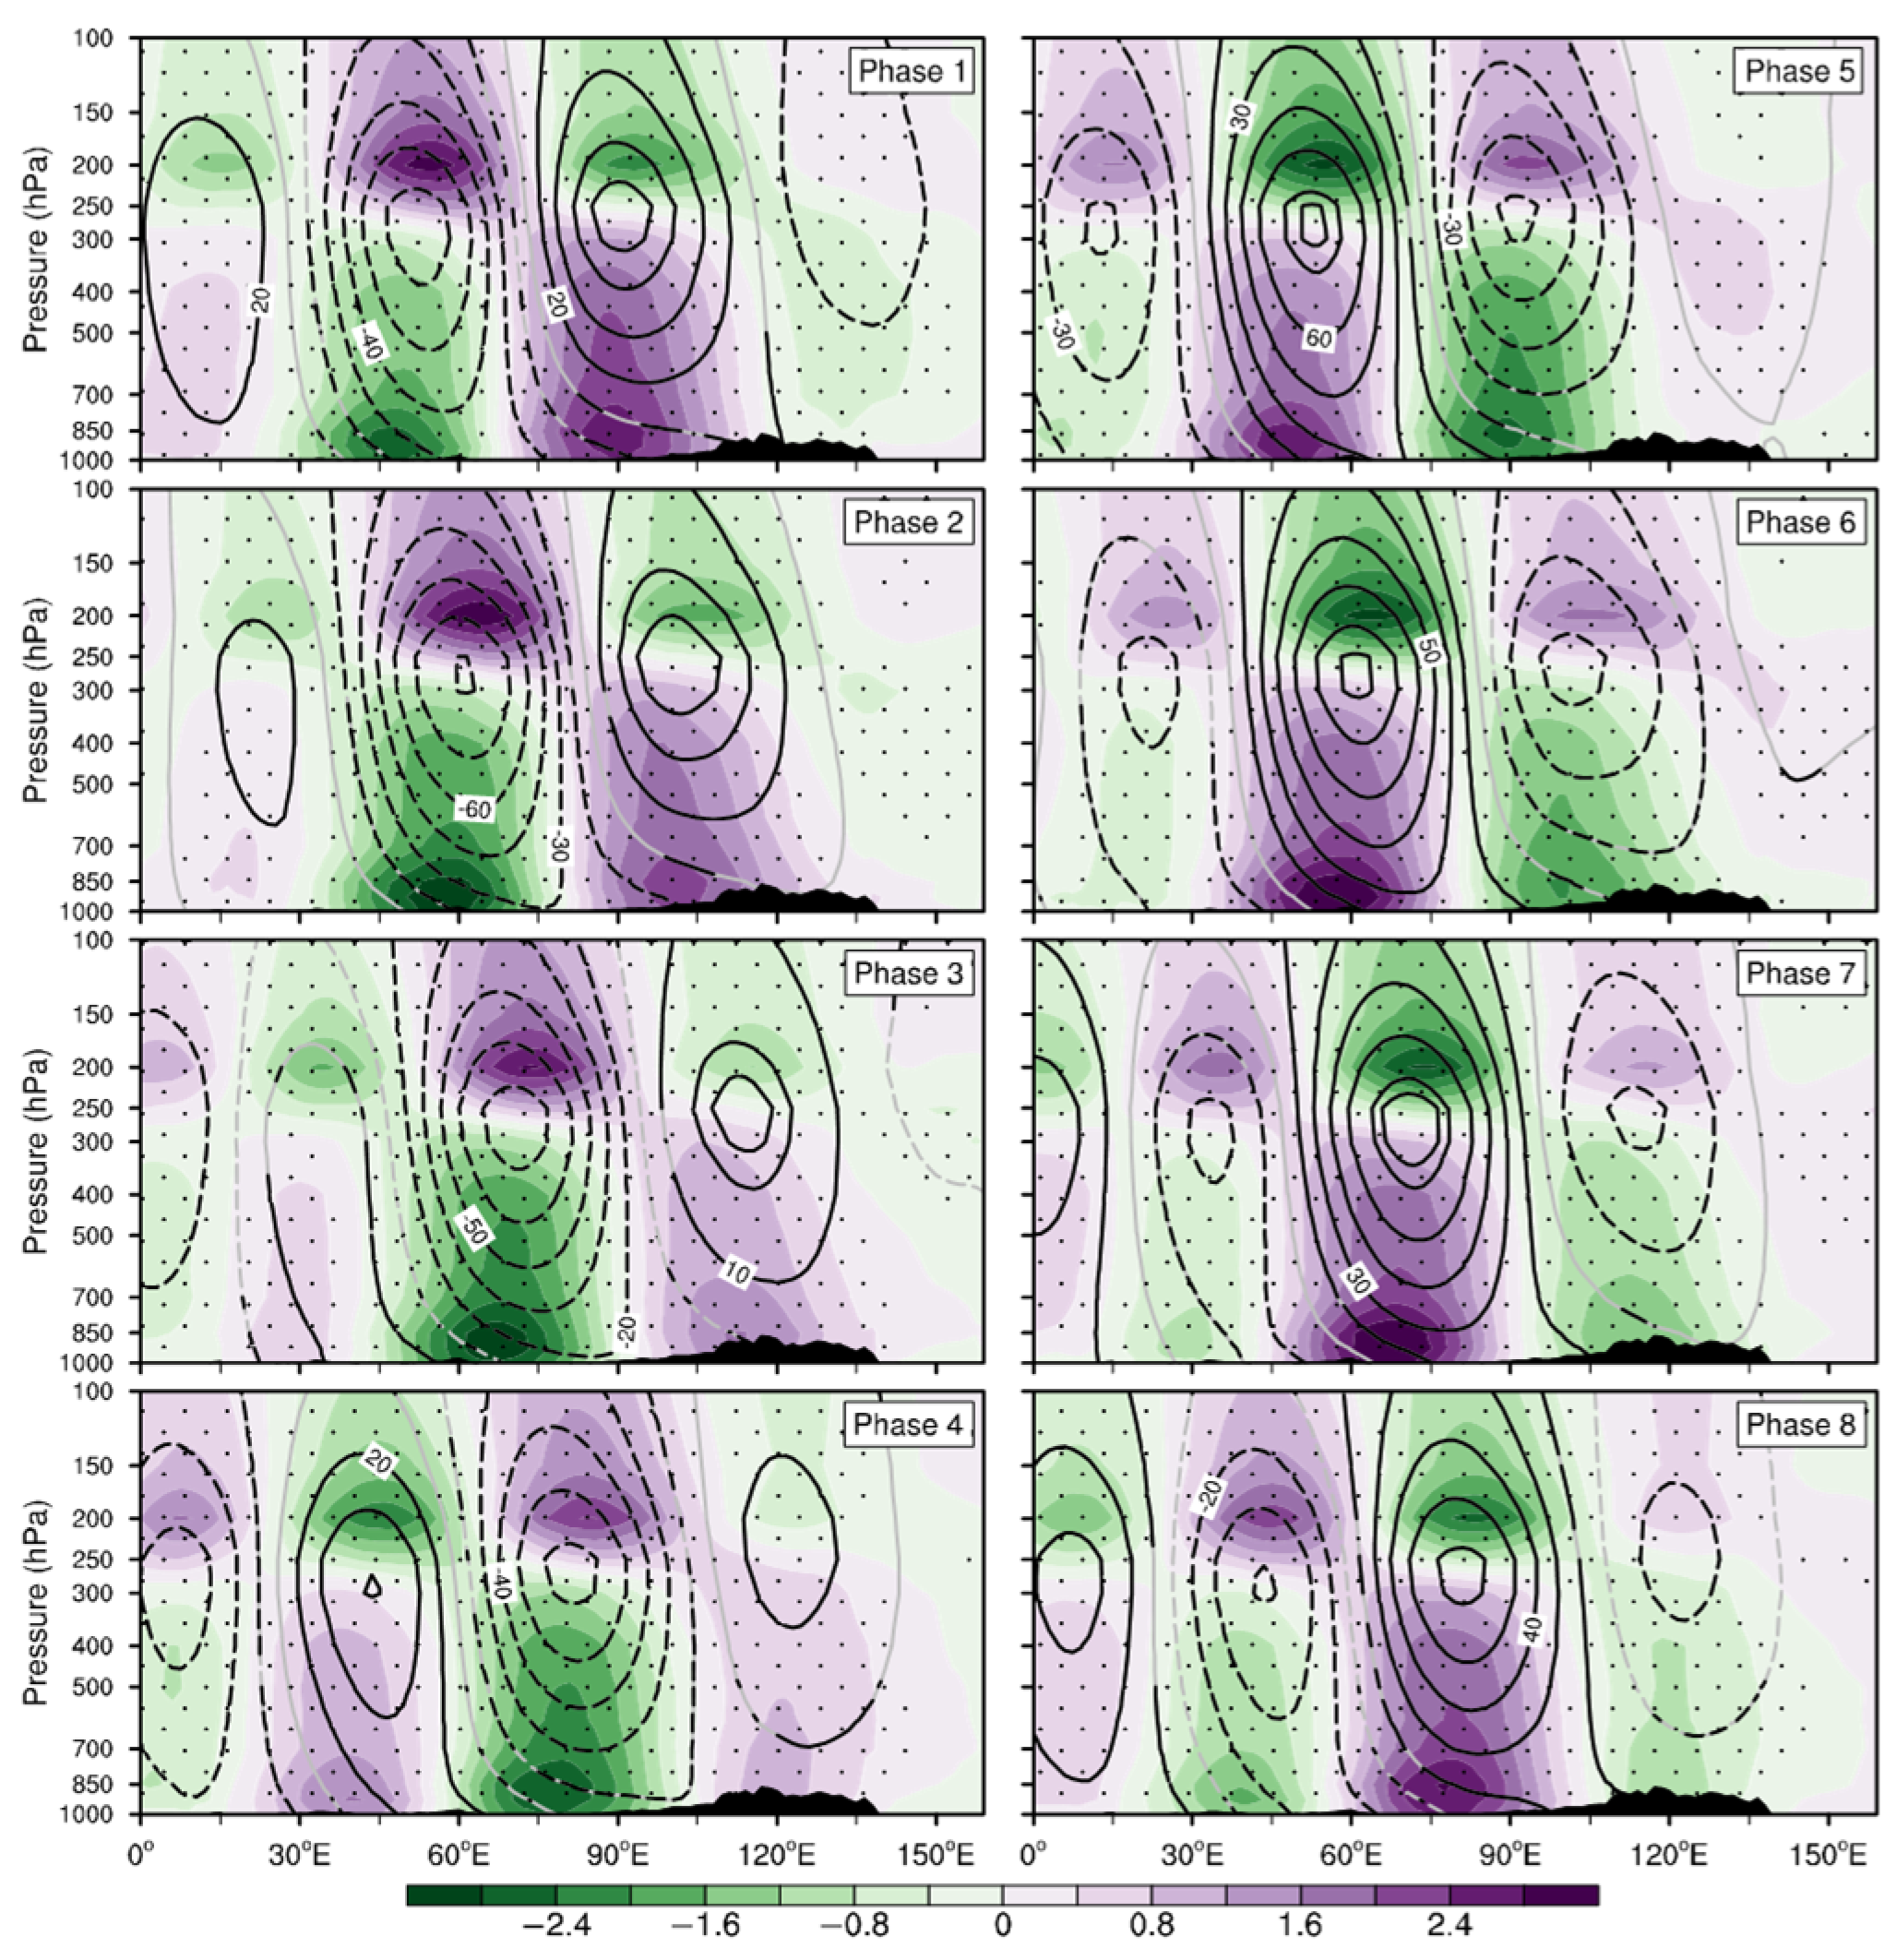
In addition, we depict the longitude–height sections to analyze the vertical structure of the mid-high-latitude ISO. As shown in Figure 3, the intraseasonal Z and T fields show an obviously eastward propagation. The anomalous Z field exhibits quasi-barotropic structure and couples with the T anomaly. The positive Z anomaly center near 300 hPa corresponds to a cold anomaly in the upper layers and a warm anomaly in the lower layers. The negative Z center indicates the opposite. It is shown that the hydrostatic relation is well followed.

3.2. Cause of the Southeastward-Propagating T Anomaly

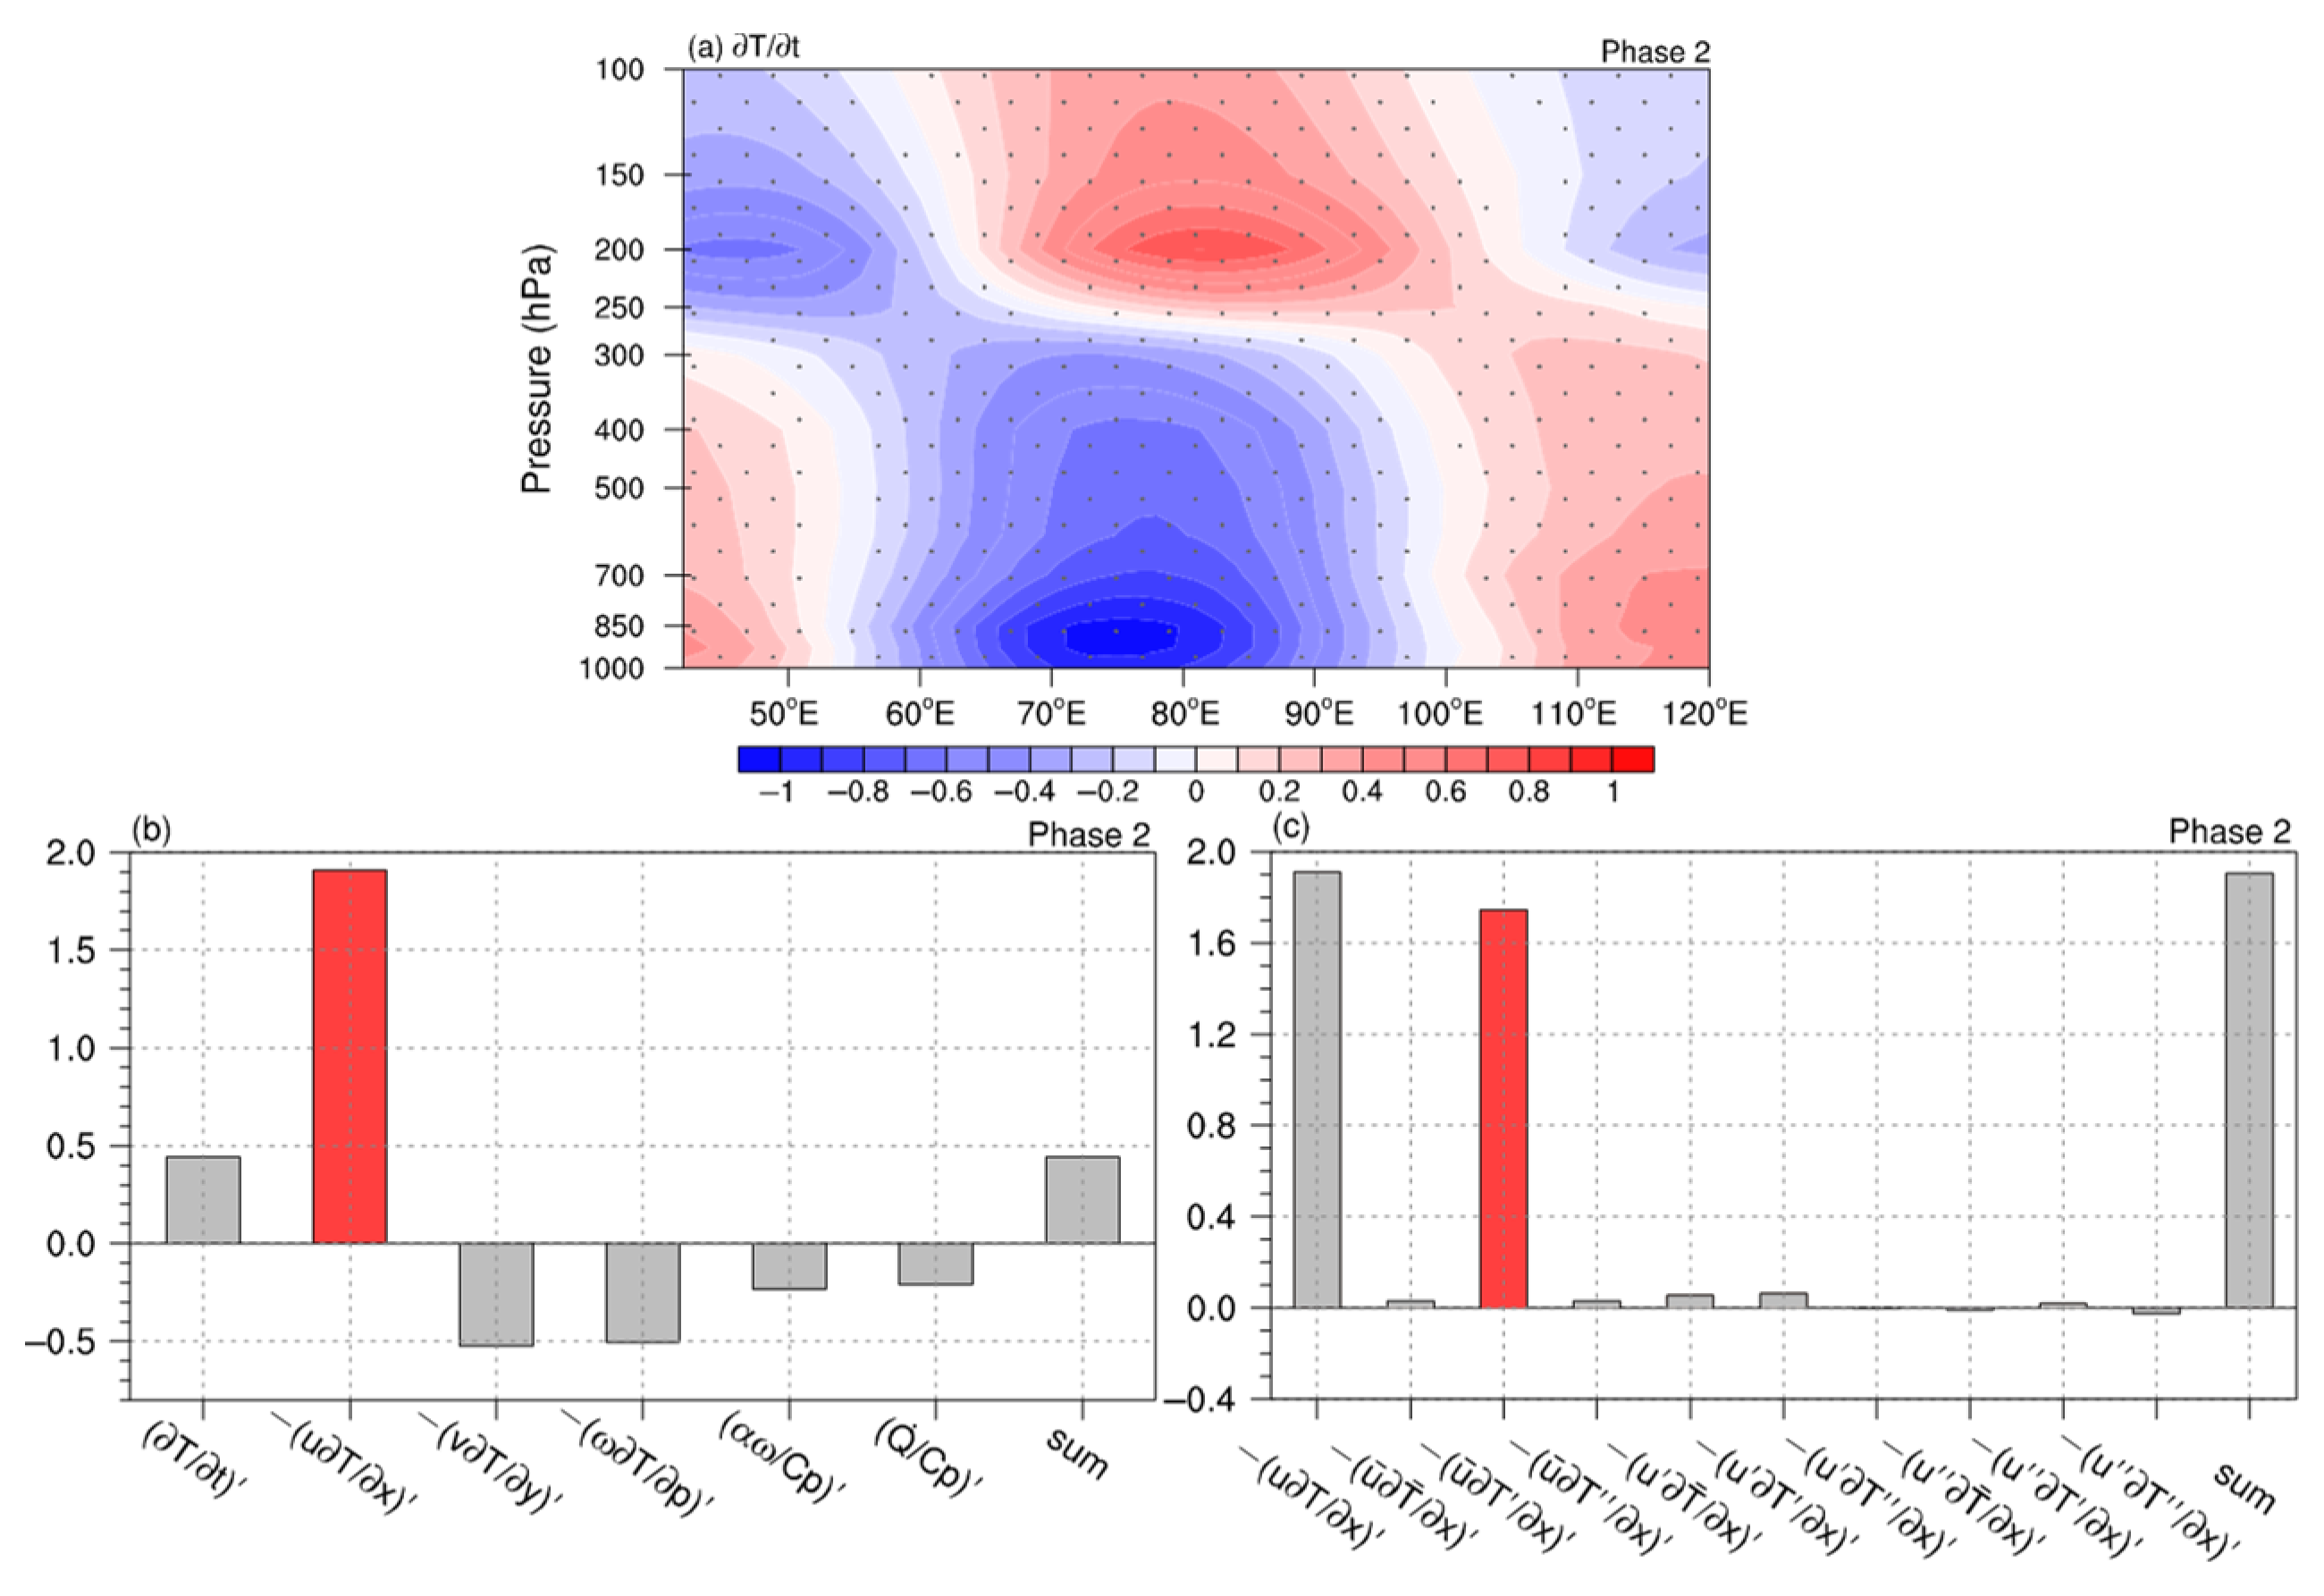
The above findings reveal that the 10–30-day mid-high-latitude ISO exhibits southeastward propagation and has a quasi-barotropic structure in boreal summer. To detect the mechanism that causes the southeastward propagation of T anomaly, the vertically averaged temperature budget analysis is applied in this section. Due to the opposite sign of the T anomalies (as shown in Figure 3) in the upper layers (above 300 hPa) and the lower layers, the T anomaly is analyzed separately for 925–500 hPa (Figure 4) and 250–150 hPa (Figure 5) in the following. Notably, for the low level, 1000 hPa is not included because it is not over the surface all the time (e.g., the terrain in Figure 3). As mentioned earlier (Figure 1f), the average amplitude of phase 2 is the largest, indicating that the ISO intensity is at its maximum during phase 2. In order to emphasize the variation of the (∂T/∂t)′, the contributions of the remaining five terms of Equation (1) in phase 2 are examined.
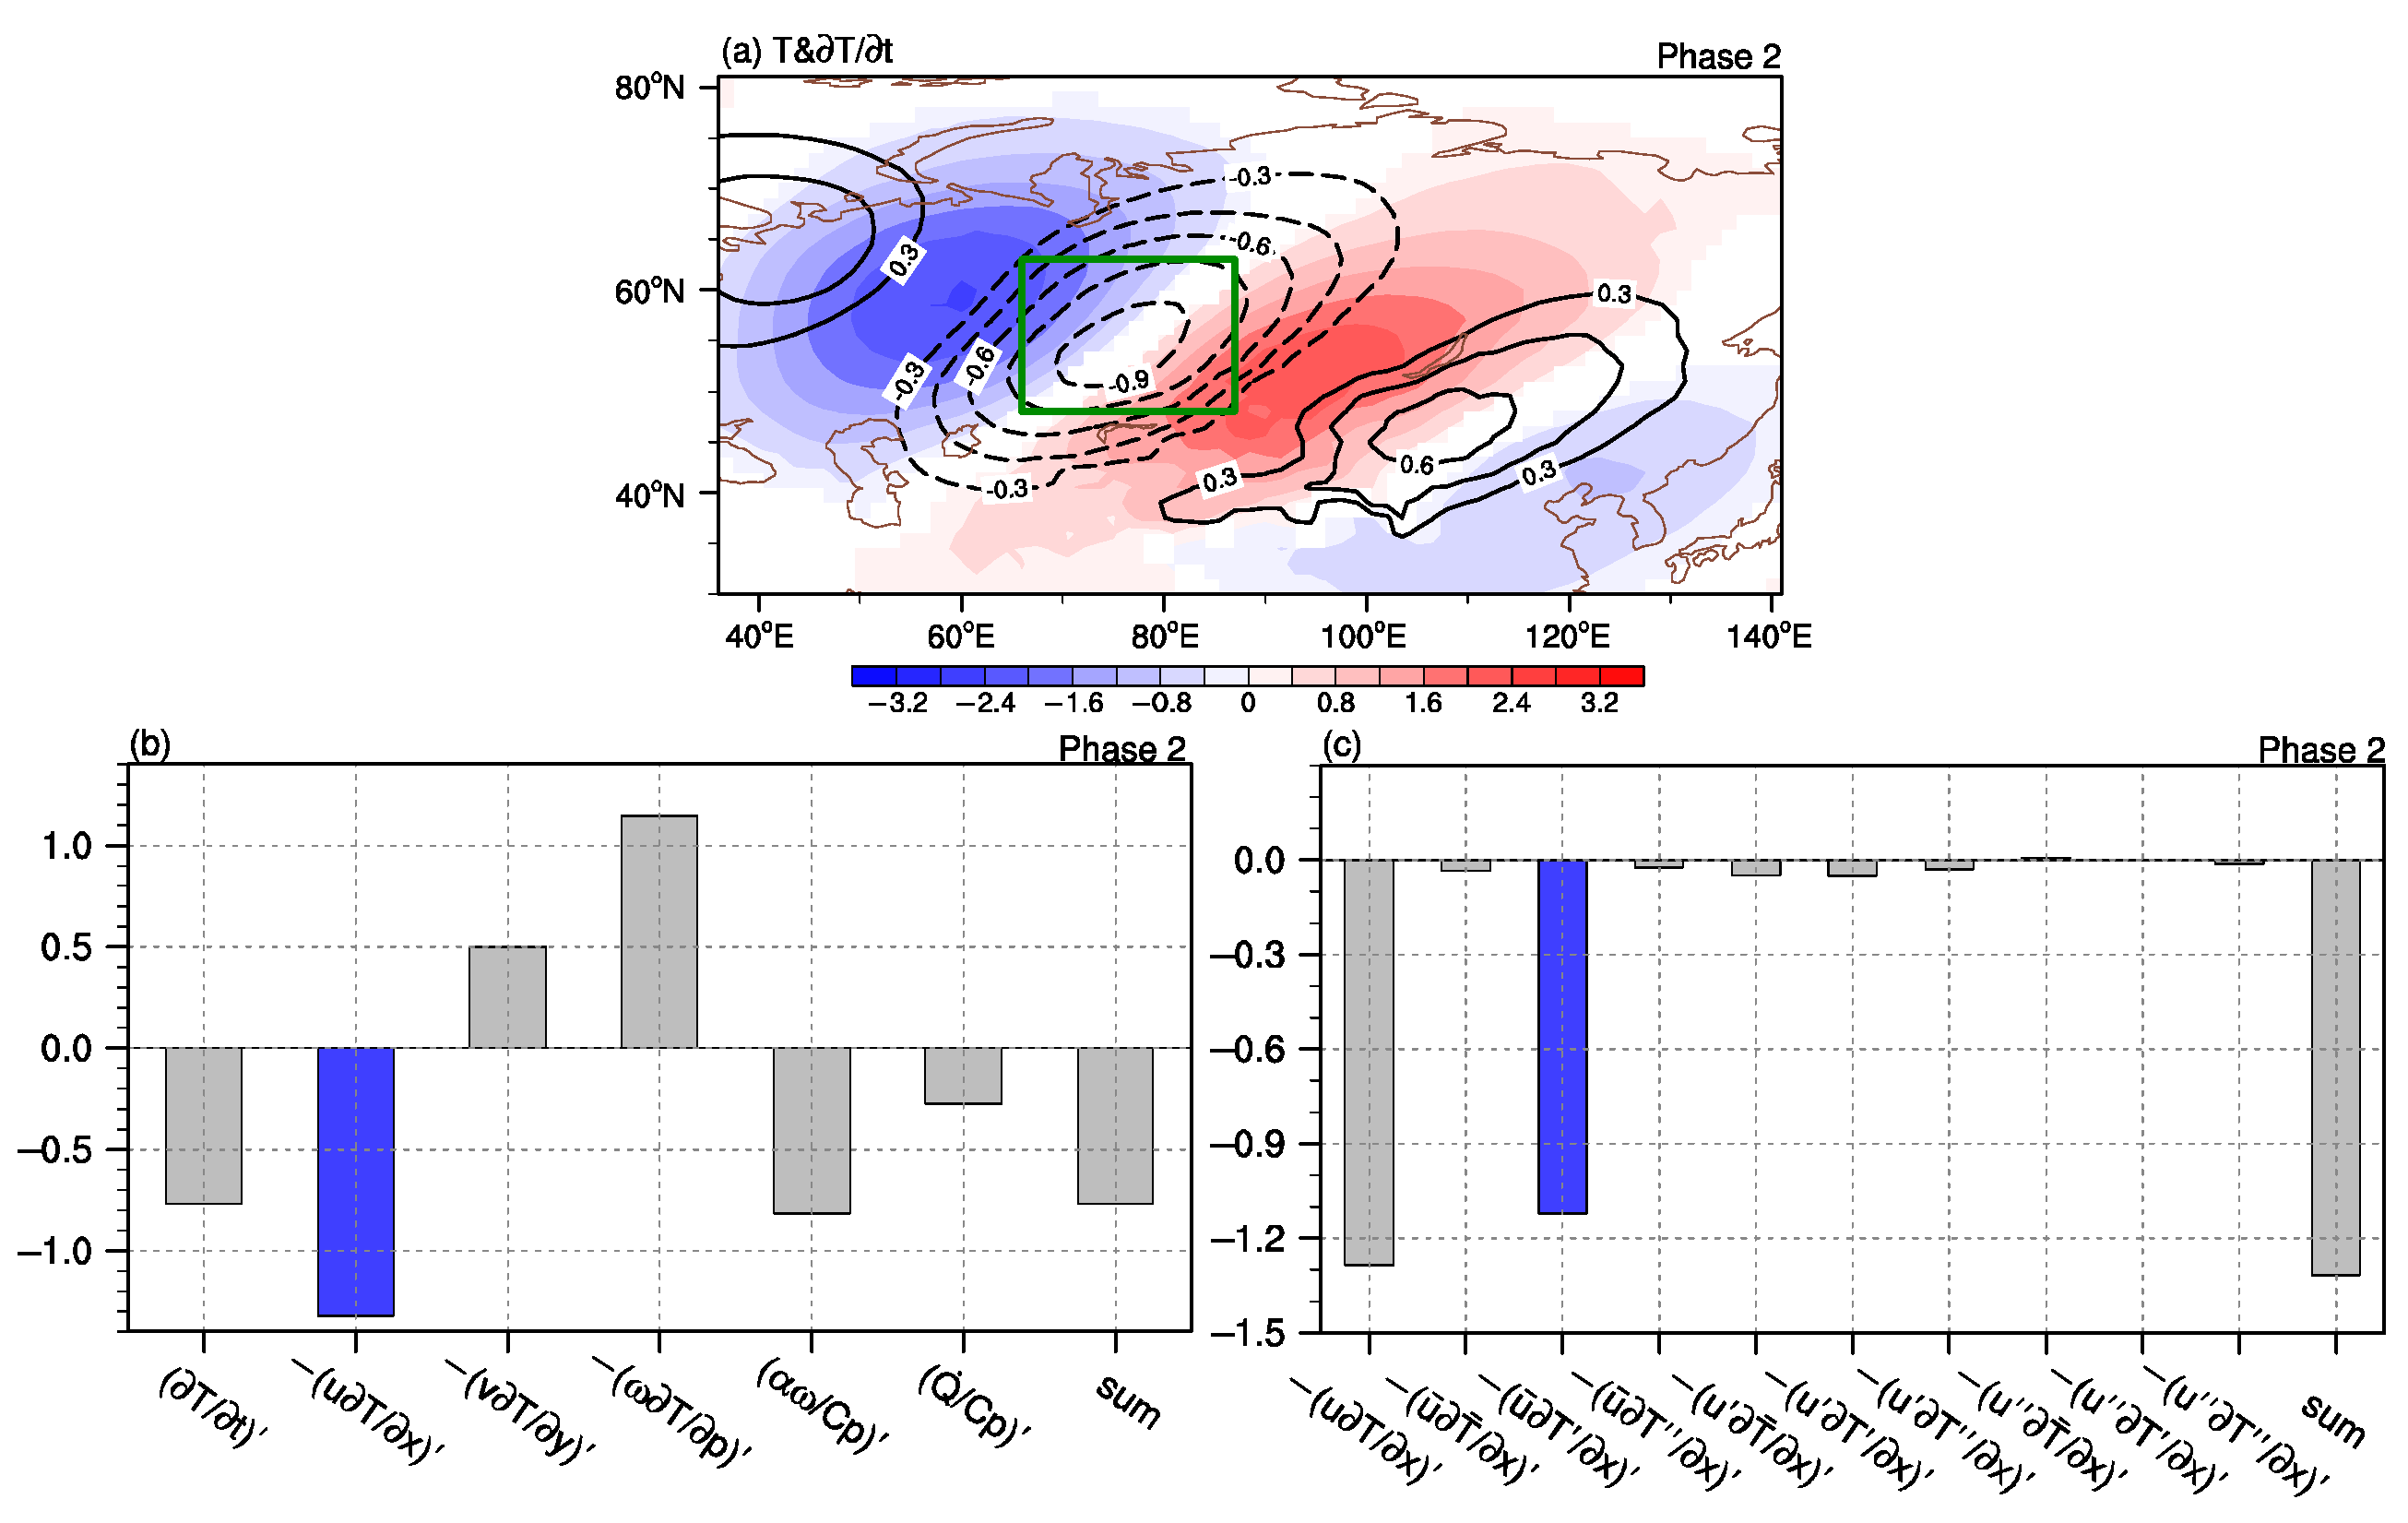
Figure 4 displays the vertical average of T′ and (∂T/∂t)′ between 925 hPa and 500 hPa during phase 2. The center of the maximum negative (∂T/∂t)′ is situated to the southeast of the negative T′ center, causing the T perturbation to further propagate southeastward. To comprehend the cause of this negative (∂T/∂t)′, a diagnosis is conducted for the region (green box marked in Figure 4a; 48°–63° N, 66°–87° E) where the largest value occurred. As illustrated in Figure 4b, the anomalous zonal temperature advection (−uT/∂x)′ is a primary contributor to the observed negative (∂T/∂t)′. By using Equation (2) to decompose this term into nine components, it is discovered that (− u ¯ ∂T′/∂x)′ contributes most significantly (Figure 4c). This indicates that the advection of the anomalous T by the mean zonal flow is the dominant contributor to cause the T perturbation propagating southeastward.
As mentioned in Figure 3, the upper-level T anomaly is in contrast to the low-level one. In order to investigate whether the southeastward-propagating T anomaly in the upper levels is influenced by the same physical process as the low-level one, we conducted a temperature budget analysis for 250–150 hPa in the following. There is a center of maximum positive (∂T/∂t)′ in the upper layers, which are mainly located at 250–150 hPa and ranging from 66° to 87° E (Figure 5a). The calculation of the vertically averaged T tendency terms at 250–150 hPa (Figure 5b) shows similar results to those at the lower levels, with the anomalous zonal temperature advection (−uT/∂x)′ being the dominant contributor. Furthermore, the primary cause of the positive (−uT/∂x)′ remains the advection of anomalous T by the mean zonal flow (Figure 5c).
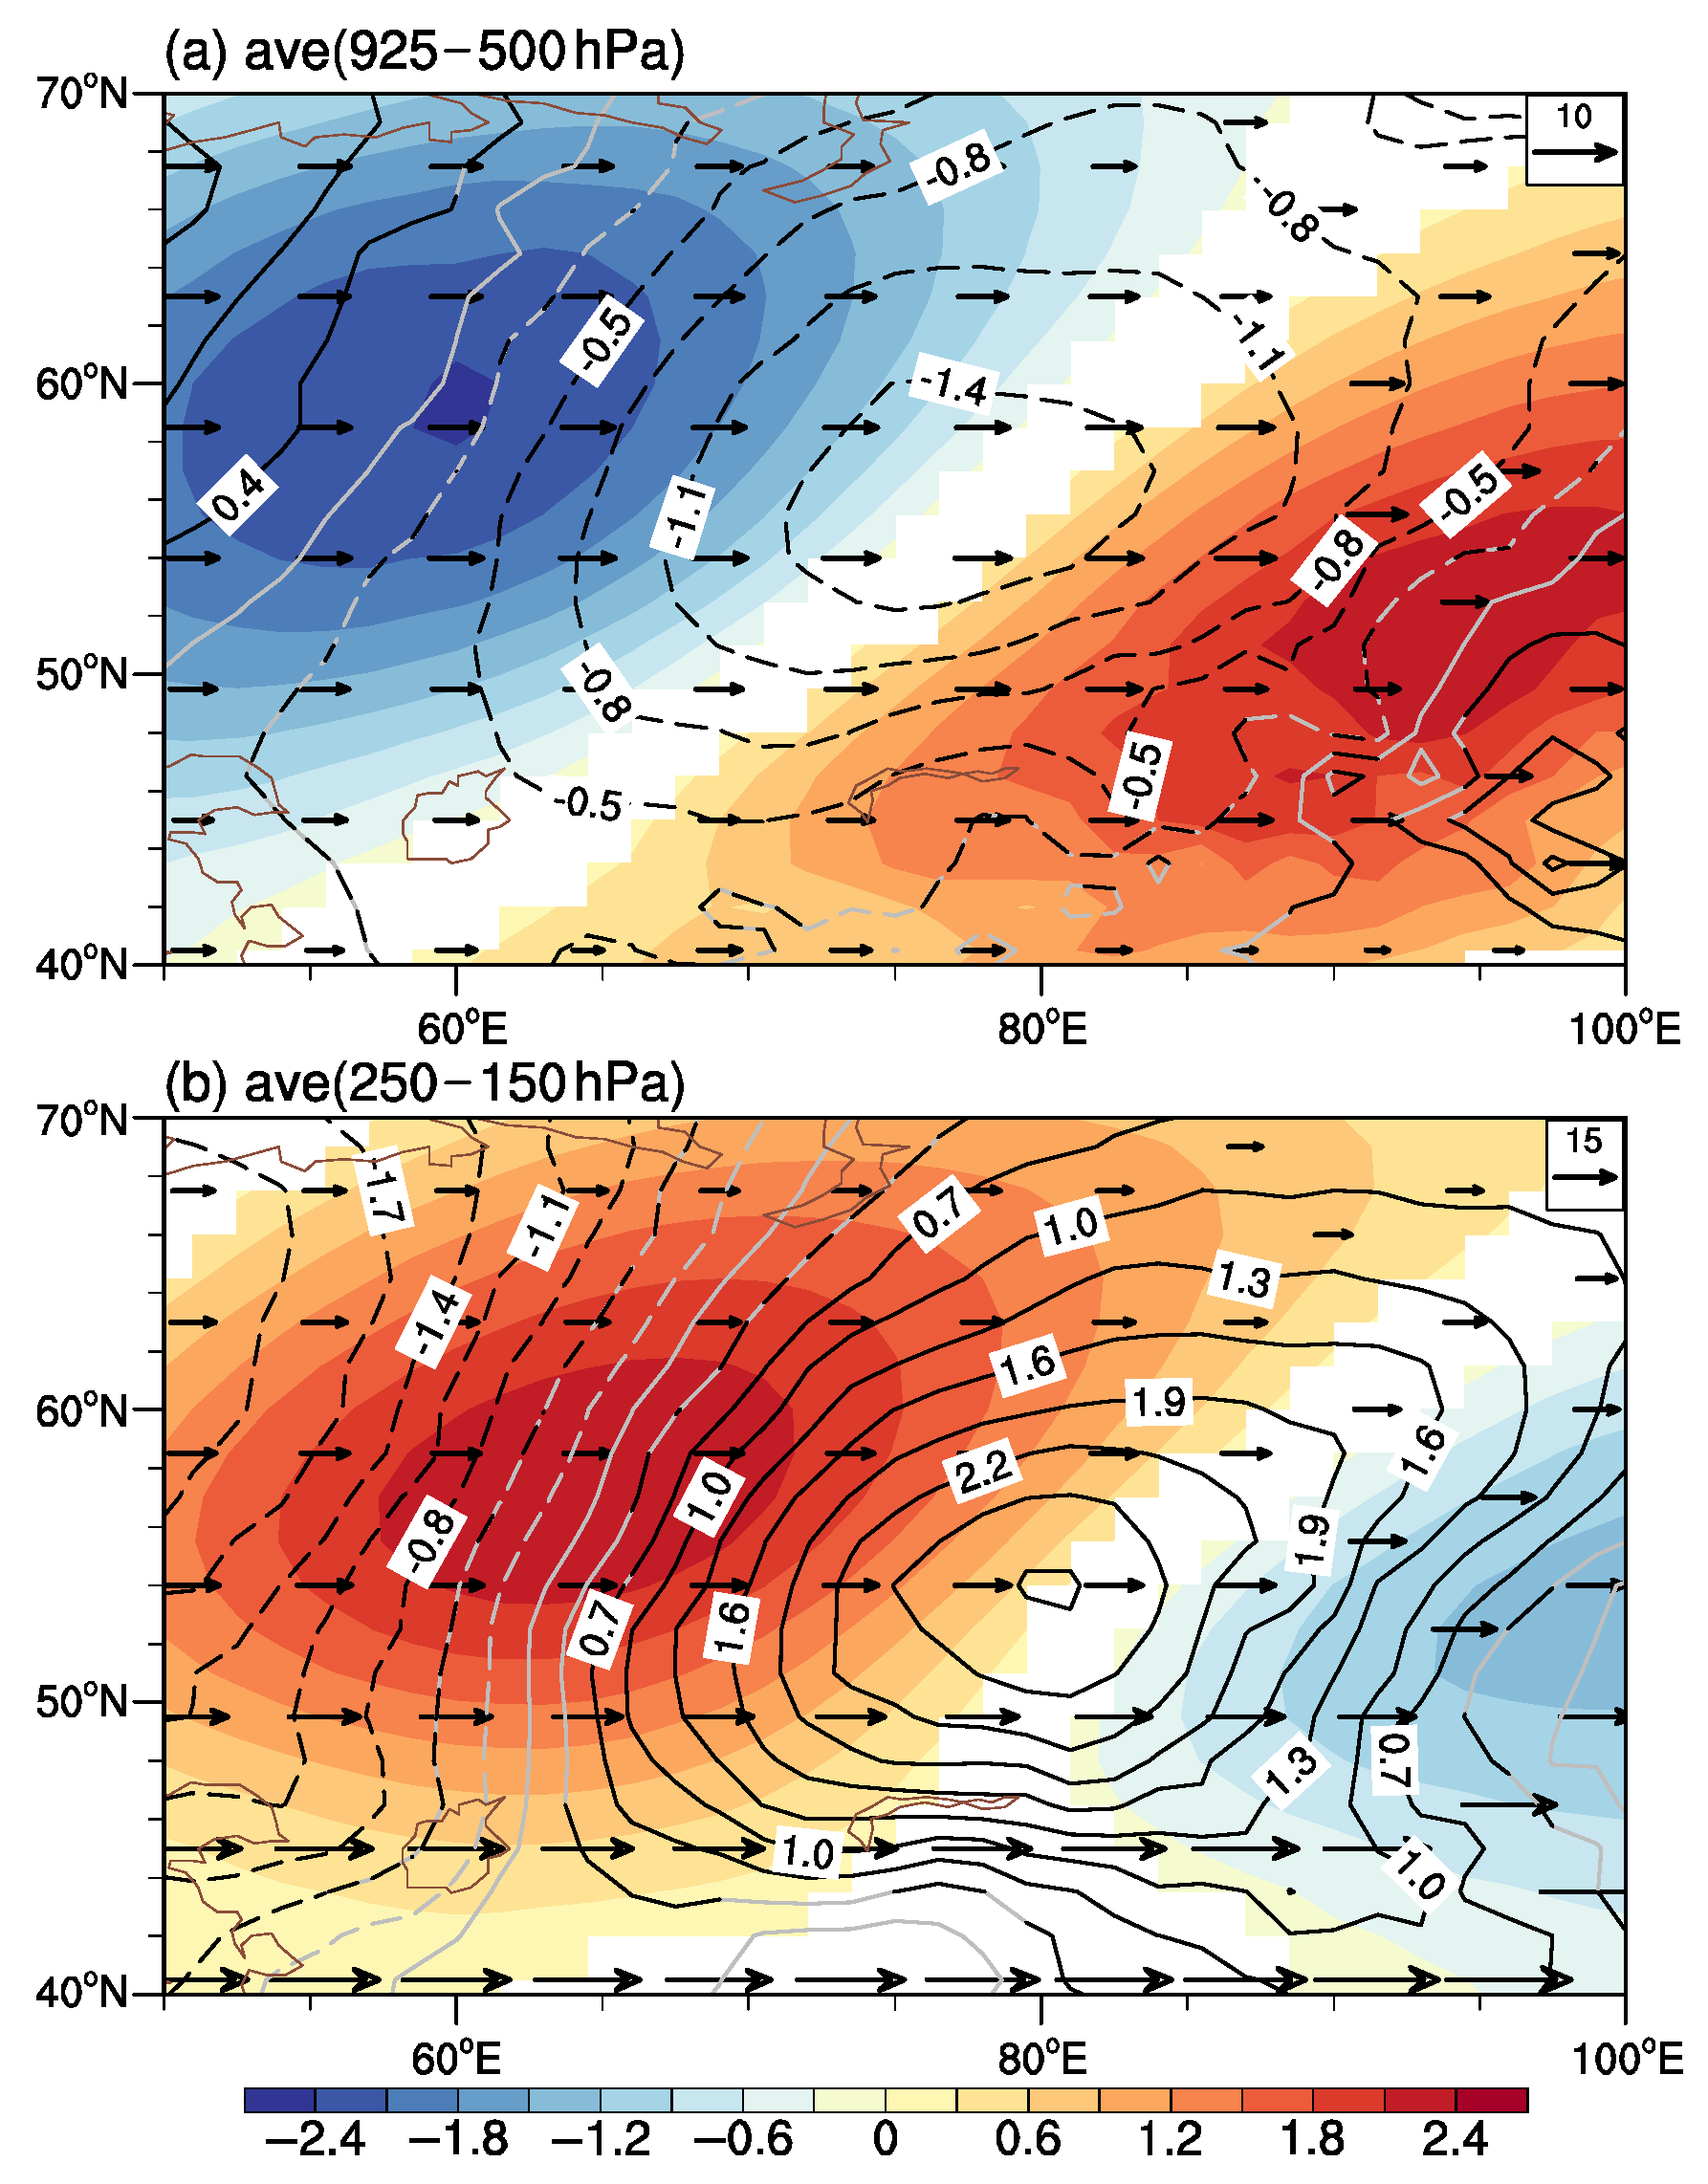
To further investigate how the dominant term (− u ¯ ∂T′/∂x)′ contributes to the anomalous T tendency, Figure 6 shows the horizontal distributions of 925–500 hPa (Figure 6a) and 250–150 hPa (Figure 6b) vertically averaged (− u ¯ ∂T′/∂x)′ (contour), u ¯ (vector), and T′ (shading) in phase 2. As displayed in Figure 6a, the mean zonal wind is westerly ( u ¯ > 0), T′ has a northwest–southeast dipole distribution, and negative T′ is accompanied by a positive temperature gradient (∂T′/∂x > 0) on its southeastern side. The mean westerly wind transports negative T′ to the east, resulting in an eastward transport of negative T′. In addition, due to the stronger westerly and the larger temperature gradient on the southeastern side of the positive T′, the maximum center of negative (− u ¯ ∂T′/∂x)′ occurs on this southeastern side, resulting in the southeastward propagation of T′. Figure 6b shows the 200–150 hPa vertically averaged case, which reveals a mirror result similar to that of 925–500 hPa (Figure 6a). Under the combined effect of the mean westerly ( u ¯ > 0) and the negative temperature gradient (∂T′/∂x < 0), the maximum center of positive (− u ¯ ∂T′/∂x)′ occurs to the southeast of negative T′, causing T′ to propagate southeastward. In summary, it is clear from the temperature budget analyses in the upper and lower layers that the equivalent barotropic flow acts as a crucial factor in the advection of the upper and lower tropospheric T anomalies to the southeast.

3.3. Energy Conversion Diagnosis for Southeastward Propagation

The analysis in Section 3.2 suggests that the advection of the anomalous T by mean wind is critical to the temperature perturbation propagating southeastward. However, it is unclear how the specific energy conversion of the propagation process works. Yang and Li [29] reveal that the ISO perturbation with a 10–60-day cycle gets energy from the mean flow as it moves southeastward in boreal winter. Based on this, we speculate that there may be a similar energy conversion in the 10–30-day ISO during summer. To verify this possibility, the energy conversion of kinetic and potential energy in the southeast propagation process is analyzed in this section.
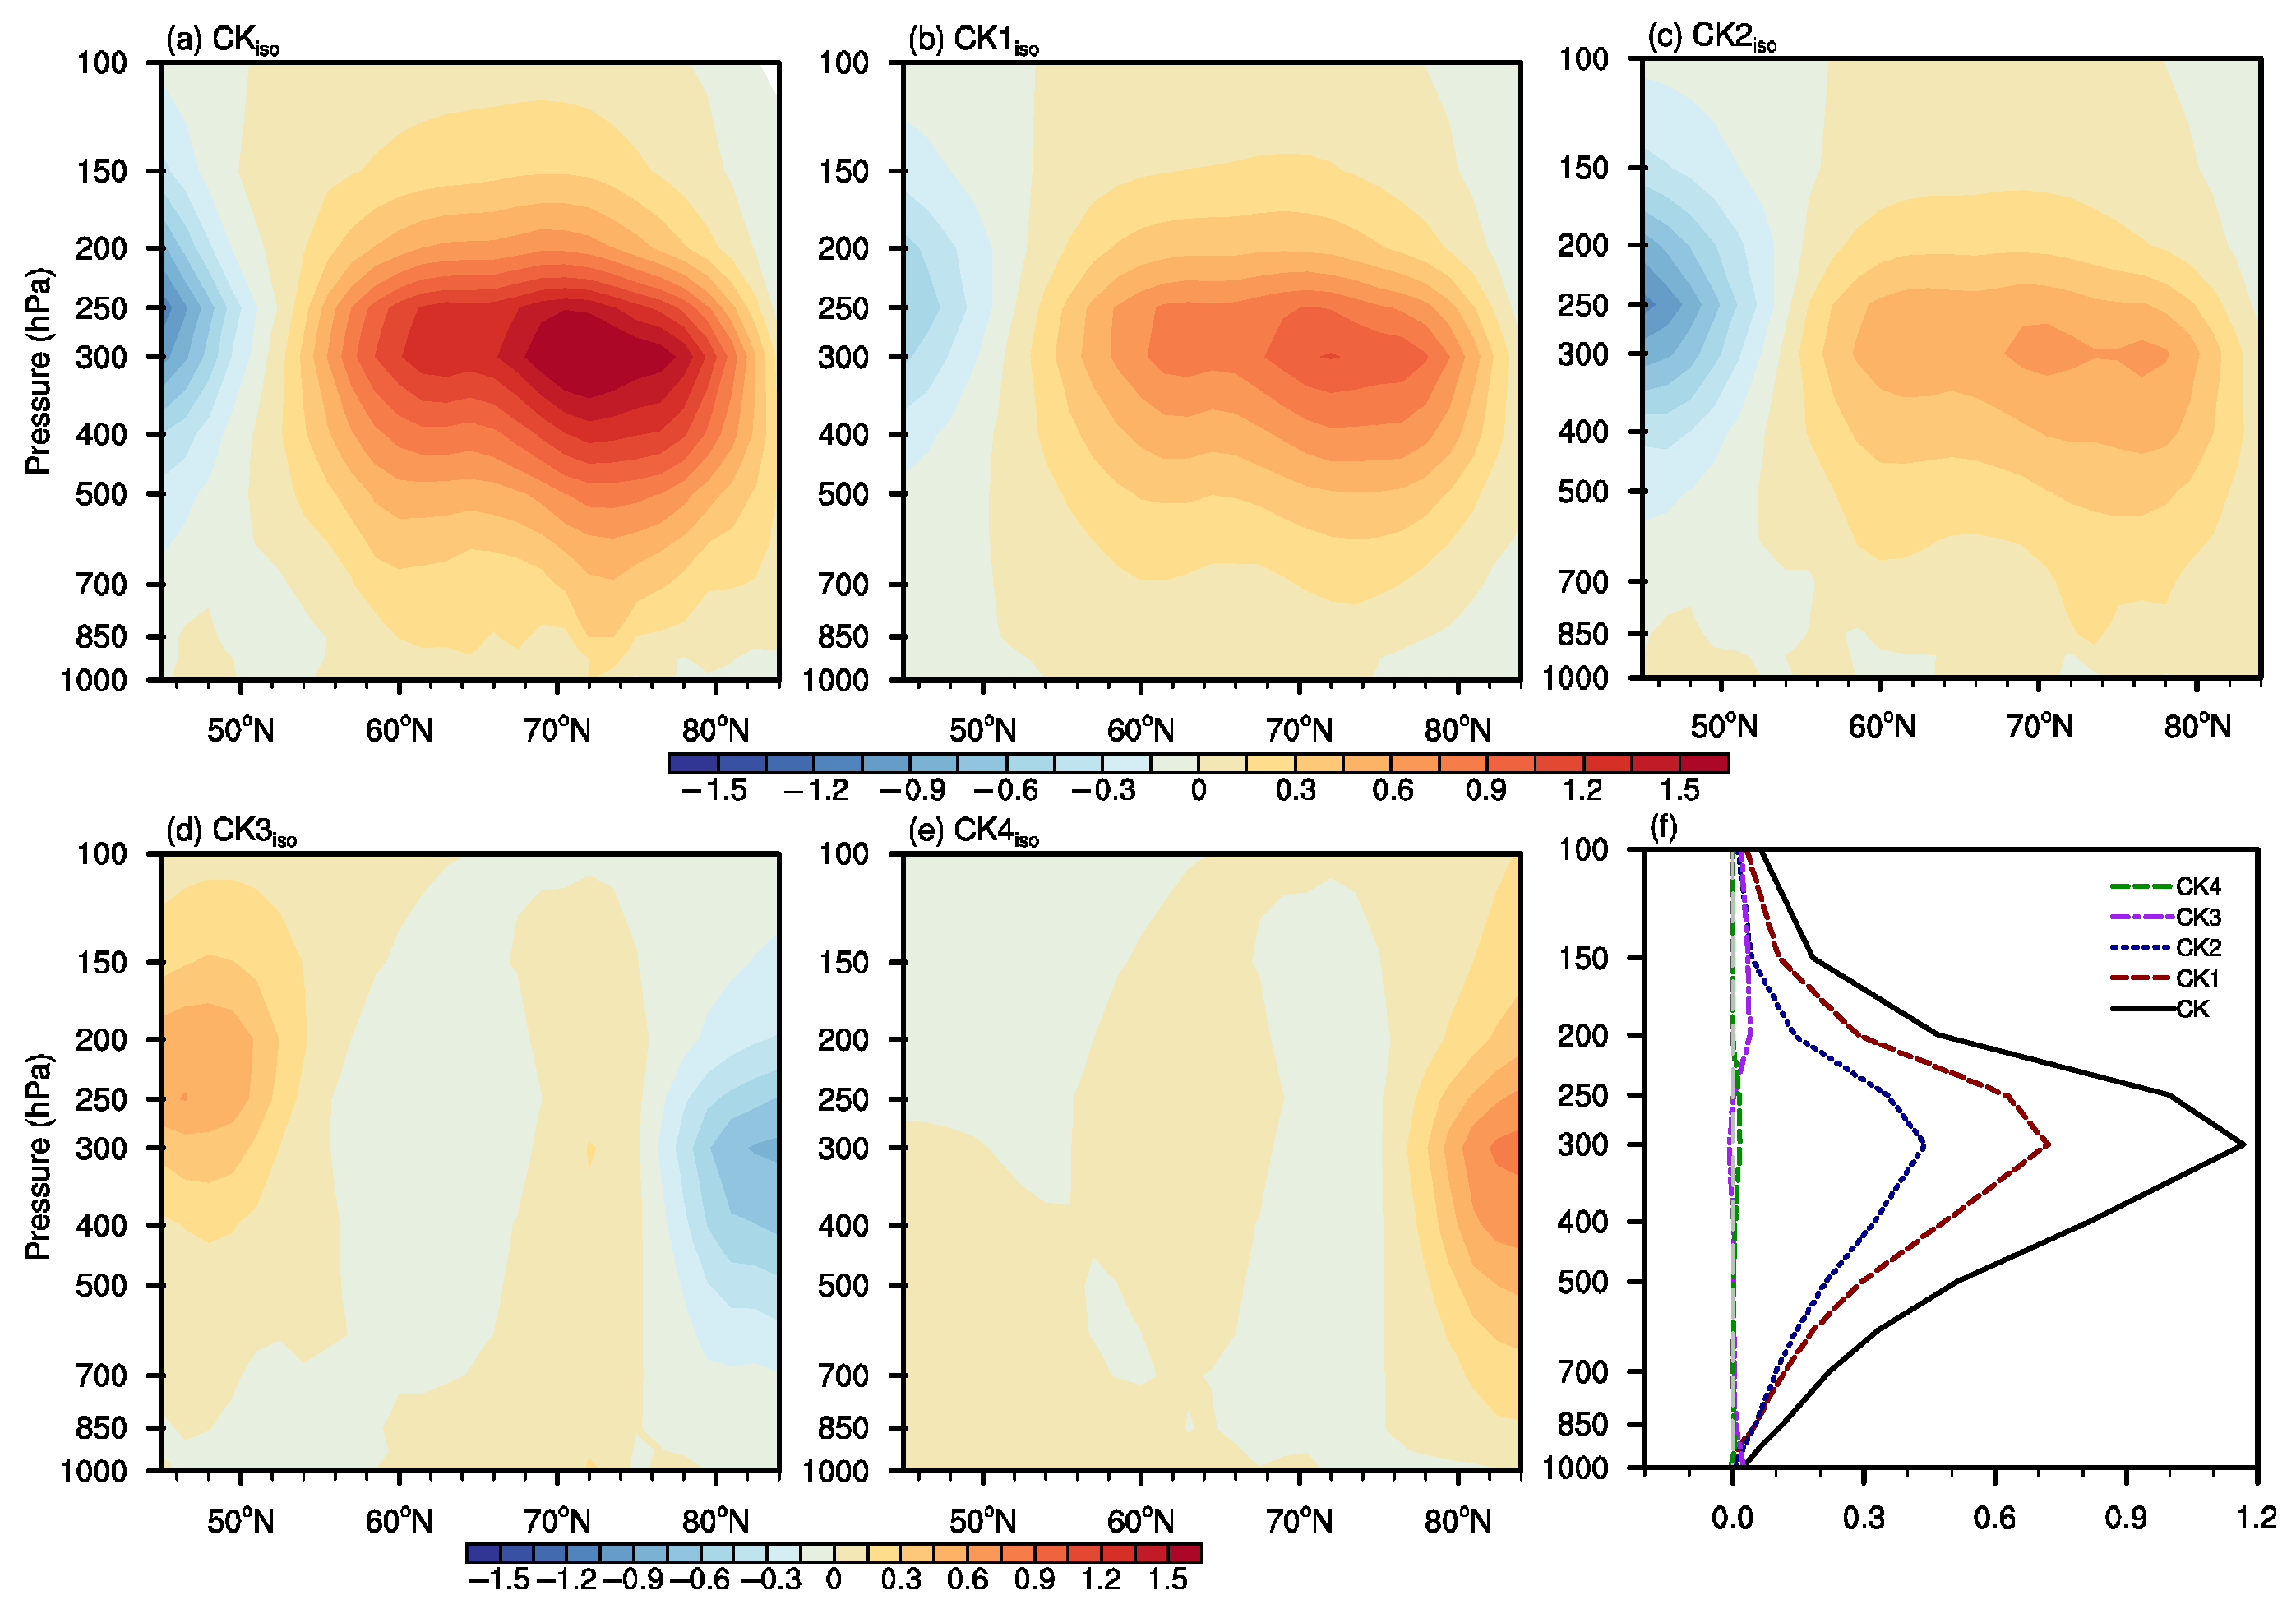
Figure 7 depicts the latitude–height cross section of barotropic kinetic energy conversion ( CK iso ̿ ) averaged over 42°–141° E. Here, CK iso ̿ is calculated from Equation (3). As depicted in Figure 7a, the positive values of CK iso ̿ are observed in the troposphere between 51° and 78° N. The maximum center of CK iso ̿ locates at 300 hPa. This finding indicates that the maximum energy conversion occurs in the upper troposphere. Furthermore, the remaining individual terms are shown in Figure 7b–e. The vertical profile of CK1 is essentially identical to that of CK iso ̿ , dominating the positive value of CK iso ̿ in magnitude term (Figure 7b). For a quantitative assessment of the relative contribution of CK1, CK2, CK3, and CK4, the zonal averaged CK iso ̿ and the vertical profile of the remaining terms are calculated in Figure 7f for 51°–78° N. The area selected for the average is the activity center of the T anomaly shown in Figure 1a (boxed area; hereafter referred to as the key region). It is seen that the dominant contributing term in the troposphere is CK1. The average values of u 2 v 2 ̿ 2 and u ̿ x in the key region are both negative, making CK1 predominantly positive in this region (figure omitted). The second dominant term is CK2, which has predominantly positive values due to positive means for both v 2 u 2 ̿ 2 and v ̿ y (figure omitted). The aforementioned findings suggest that the meridional divergence of the mean meridional wind and the zonal convergence of the mean zonal wind have significant impacts in facilitating the kinetic energy transfer from the summertime mean flow to the intraseasonal perturbation.
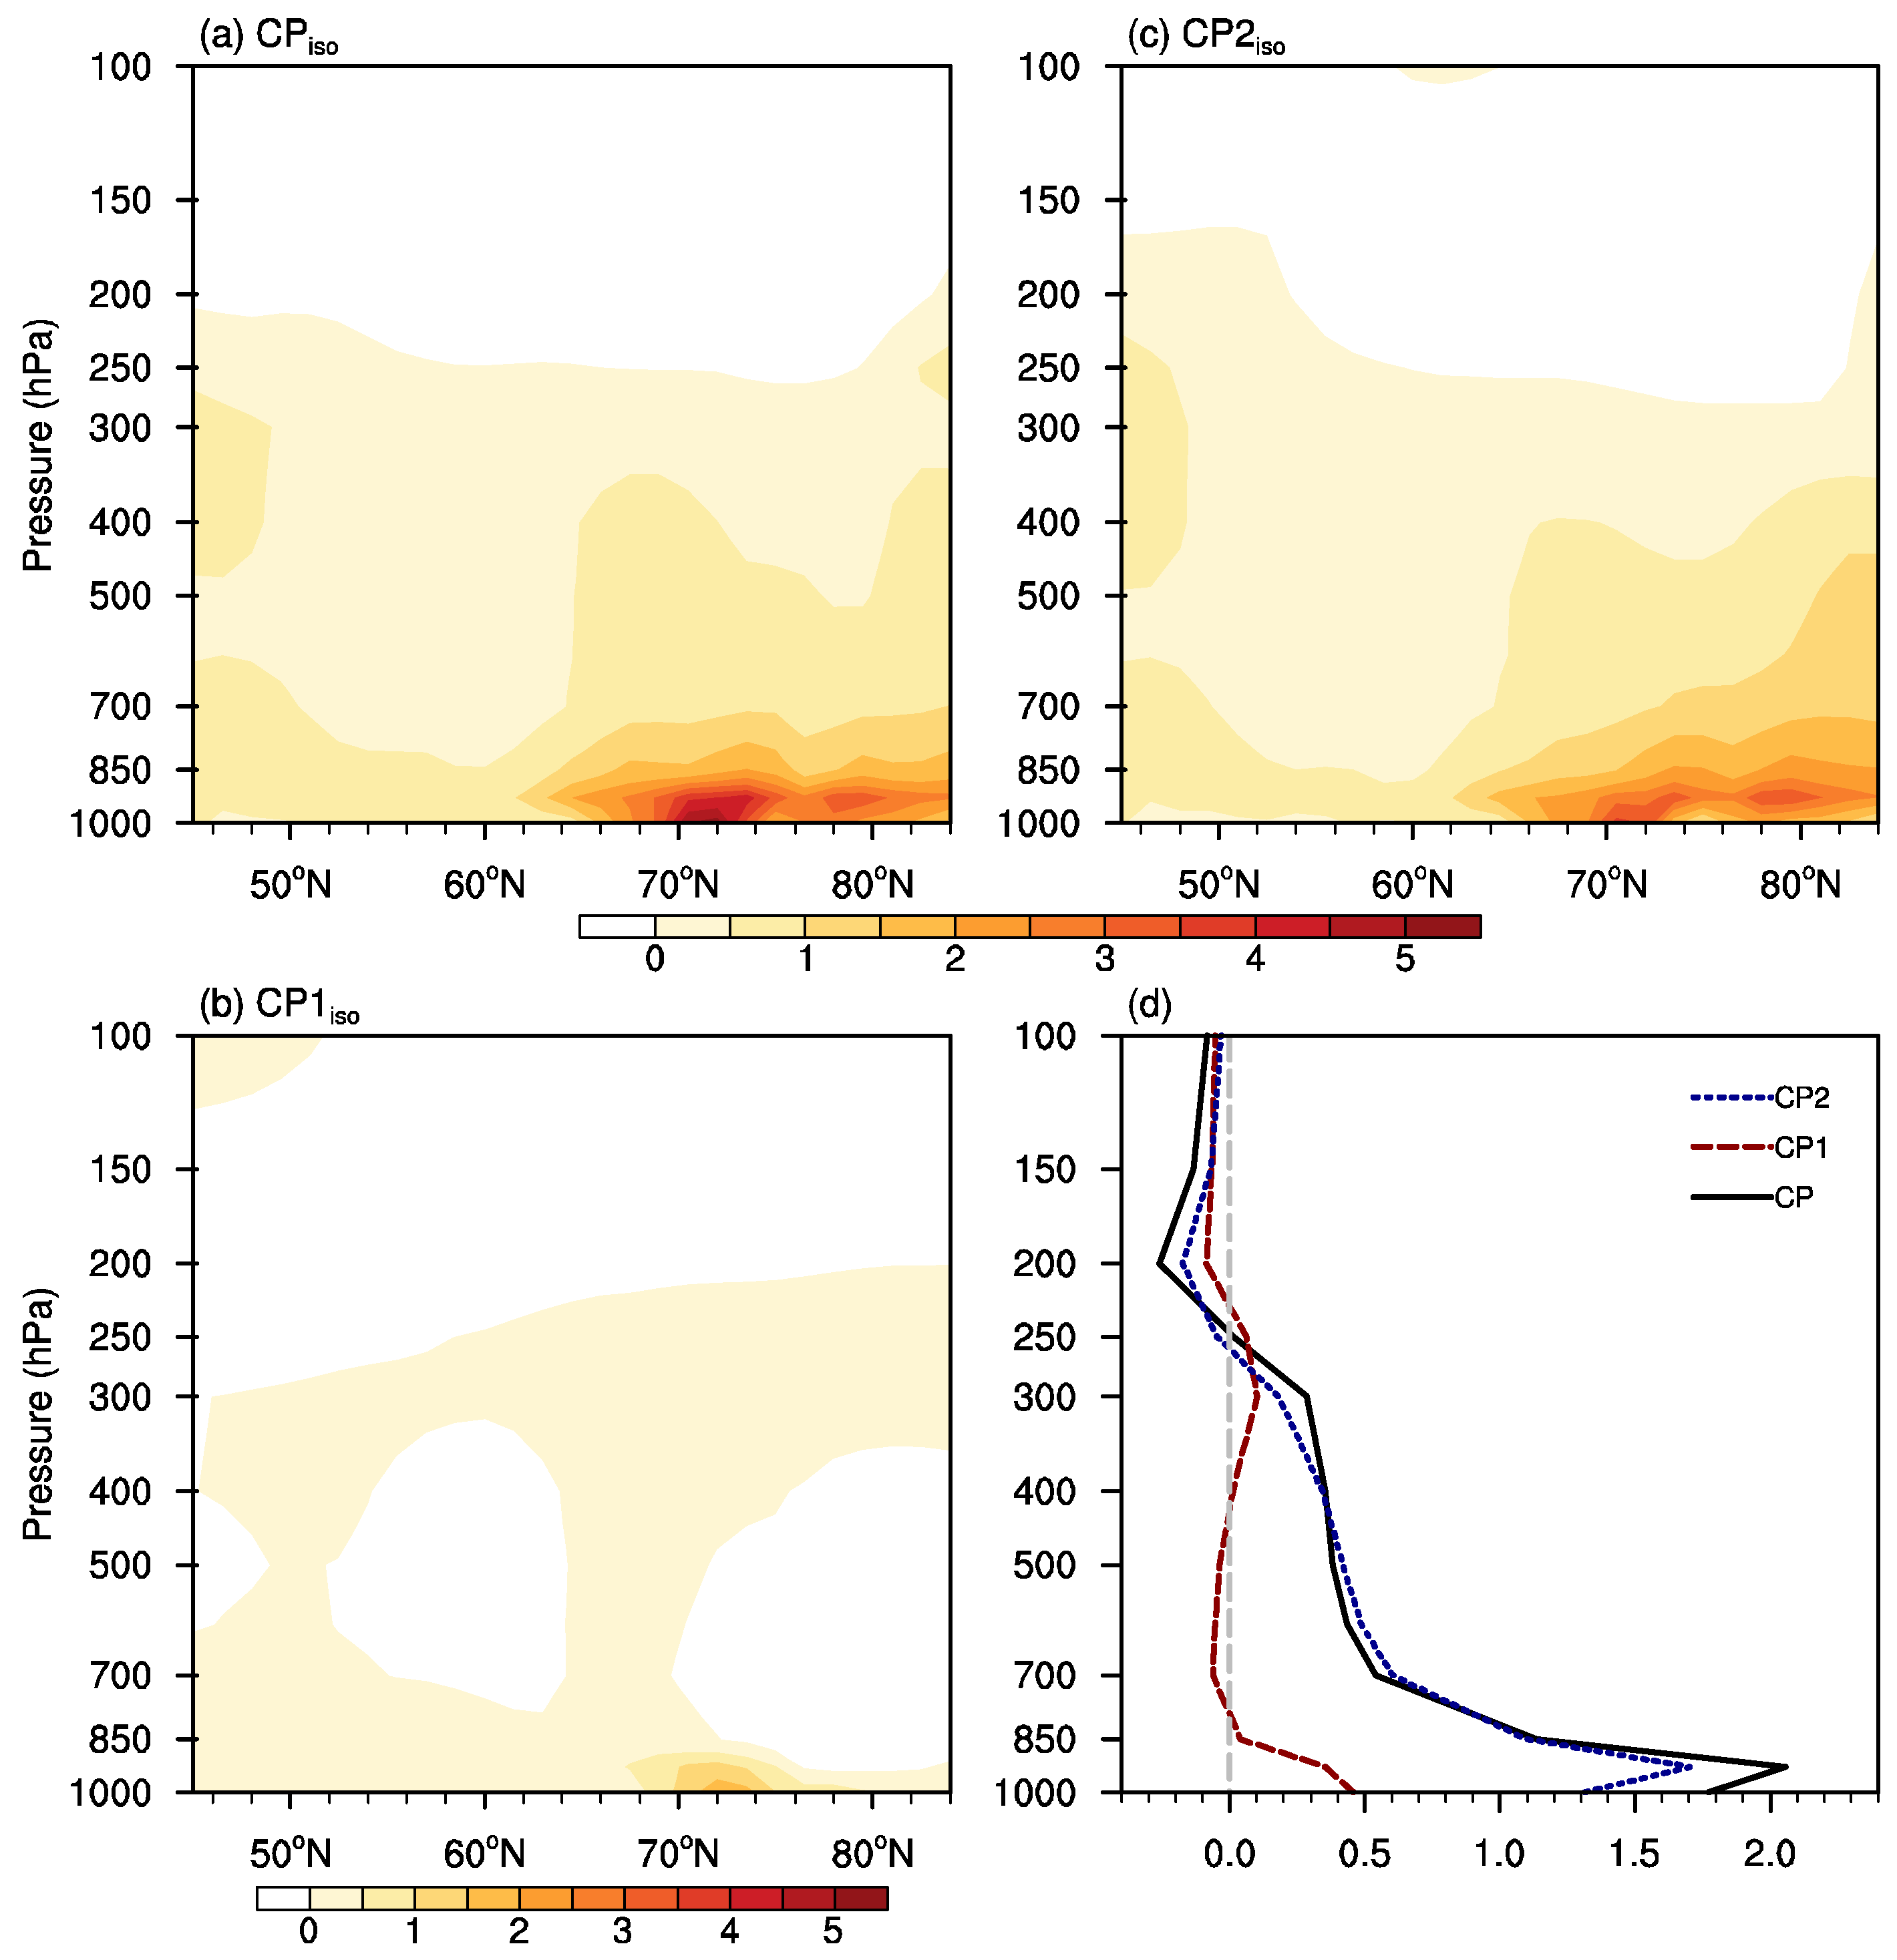
According to Equation (4), the potential energy transfer CP iso ̿ is further calculated in Figure 8. As shown in Figure 8a, the presence of positive CP iso ̿ in the key region suggests that the intraseasonal disturbance derives energy from the mean flow. It is worth noting that in the lower troposphere (below 700 hPa), there is the greatest energy conversion (Figure 8a). The contribution of each individual term is displayed in Figure 8b,c, with both individual terms contributing positively to the potential energy transfer, with CP2 exhibiting greater strength. The vertical profile (Figure 8d) quantitatively demonstrates that the average temperature gradient and the eddy heat flux transport are crucial in facilitating this potential energy conversion. To detect the role of baroclinic instability in intraseasonal T variations, we analyze the baroclinic available potential energy conversion ( CP * ̿ iso ), referring to Du and Lu [45]. The results (figure omitted) are similar to the results of the barotropic process (Figure 8), i.e., the intraseasonal disturbance derives energy from the mean flow through the baroclinic process, and the maximum energy conversion is located in the lower troposphere. In order to quantitatively compare the contribution of these two processes, we calculated CP ̿ iso and CP * ̿ iso vertically averaged from the surface to 100 hPa over the key region. The value of CP ̿ iso is 0.59, whereas the value of CP * ̿ iso is 0.55, indicating that the intraseasonal disturbance gains more energy through the barotropic process.
The kinetic and potential energy conversion analyses discussed above demonstrate that the ISO disturbances obtain their energy from the summertime mean flow. Consequently, the upper troposphere and lower troposphere ISO disturbances are able to sustain their intensity to resist natural dissipation as they propagate southeastward.

4. Summary

In this study, the structure and evolution characteristics of the mid-high-latitude Eurasian ISO in boreal summer are investigated by utilizing ERA5 daily reanalysis data. The novelties of this study are mainly to reveal the characteristics of the mid-high-latitude Eurasian ISO with a 10–30-day cycle and to examine the dynamic mechanism and energy conversion of its propagation. The leading mode of the ISO is extracted by an EEOF analysis of the 10–30-day SAT anomaly. Through phase analysis, a clear manifestation of southeastward propagation of the ISO is observed. Additionally, the anomalous Z field exhibits a quasi-barotropic structure and couples with the T anomaly, following well the hydrostatic relationship.
As shown in the previous study [5], the intraseasonal T variation over Eurasia may cause precipitation variation in downstream regions by affecting the vertical motion and corresponding moisture conditions. The above results suggest that the mid-high-latitude ISO with a 10–30-day cycle may serve as a predictable source of precipitation forecasts for downstream regions. Moreover, Yao and Liu [46] revealed that the ISO of the zonal wind in the jet exit region is tightly correlated with the intraseasonal inverse temperature tendency between the northern and southern parts of the jet exit region. Xu et al. [47] found that the extreme temperature in northern Eurasia is associated with enhanced waveguide teleconnections embedded in the polar front jet during boreal summer. Based on the above findings, we can speculate that there may be a link between the intraseasonal temperature and the subtropical jet and polar front jet, but the exact link needs to be studied.
Based on a budget analysis of the T anomaly, the mechanism for southeastward propagation of T anomaly is discussed. The results indicate a negative (positive) T tendency appearing in the southeastern part of the T anomaly in the lower troposphere (upper troposphere), resulting in further southeastward displacement of the T perturbation. The advection of the T anomaly by the mean zonal wind is identified as the dominant factor responsible for the observed T perturbation to move southeastward, which is also a new discovery in this study. These findings highlight the important role played by interactions between the ISO and the mean flow in inducing southeastward propagation.
Further energy conversion analysis reveals that, via the energy conversion of kinetic and potential energy, the ISO disturbance gains energy from the summertime mean flow during its southeastward movement. It is in the upper troposphere (near 300 hPa) that the maximum kinetic energy conversion occurs. Both the meridional divergence of the mean meridional wind and the zonal convergence of the mean zonal wind contribute to facilitating the transformation of kinetic energy from the summertime mean flow to the ISO perturbation. In addition, the maximum potential energy conversion primarily occurs in the lower troposphere. This potential energy conversion is greatly facilitated by the eddy heat flux transport as well as the average temperature gradient. It is noteworthy that the trajectory towards the southeast (Figure 2) basically follows the propagation path of the long-period Rossby wave highlighted in previous studies [48,49,50,51,52]. The above findings, combined with the energy conversion analyses, show that Rossby wave propagation is critical in the formation of intraseasonal temperature wave trains at the mid-high latitudes through a barotropic process [53,54].
The aforementioned results improve the knowledge of the mid-high-latitude ISO with a 10–30-day cycle during boreal summer, deepening the understanding of sub-seasonal prediction sources in East Asia. Recently, previous studies [4,29] have constructed statistical sub-seasonal temperature prediction models based on mid-high-latitude ISO signals, all of which have shown good prediction skills. These results indicate that we can build up statistical sub-seasonal prediction models based on mid-high-latitude ISO signals to predict the T anomaly and eventually help to improve downstream extreme temperature events prediction.
In addition, as noted in previous research, the southeastward-propagating mid-high-latitude ISO with a 10–60-day cycle in boreal winter originates from the Europe/North Atlantic sector [29]. The eastward propagating mid-high-latitude ISO with a 30–50-day cycle in boreal summer initiates over eastern North America [32]. These findings on the mid-high-latitude ISO provide valuable insights for investigating the origin of the 10–30-day ISO during boreal summer. Further exploration of this aspect should be conducted in future research.

Author Contributions

Conceptualization, S.Y.; methodology, S.Y.; software, Y.L.; validation, S.Y. and Y.L.; formal analysis, S.Y.; investigation, S.Y.; resources, S.Y. and Y.L.; data curation, Y.L.; writing—original draft preparation, Y.L.; writing—review and editing, S.Y. and Y.L.; visualization, S.Y.; supervision, S.Y.; project administration, S.Y.; funding acquisition, S.Y. All authors have read and agreed to the published version of the manuscript.

Funding

This research was funded by the National Natural Science Foundation of China, grant number 42305043, the National Key Basic Research Project of China, grant number 2019YFA0607002, and the Natural Science Foundation of Jiangsu province, grant number BK20210660.

Institutional Review Board Statement

Not applicable.

Informed Consent Statement

Not applicable.

Data Availability Statement

The ERA5 reanalysis data can be freely accessed on the website (https://www.ecmwf.int/en/forecasts/dataset/ecmwf-reanalysis-v5 (accessed on 18 January 2023)).

Acknowledgments

We acknowledge the High-Performance Computer Center of Nanjing University of Information Science & Technology for their support of this work.

Conflicts of Interest

The authors declare no conflict of interest.

References

  1. Lo, F.; Hendon, H.H. Empirical Extended-Range Prediction of the Madden-Julian Oscillation. Mon. Weather. Rev. 2000, 128, 2528–2543. [Google Scholar] [CrossRef]
  2. Seo, K.H.; Wang, W.; Gottschalck, J.; Zhang, Q.; Schemm, J.K.E.; Higgins, W.R.; Kumar, A. Evaluation of MJO Forecast Skill from Several Statistical and Dynamical Forecast Models. J. Clim. 2009, 22, 2372–2388. [Google Scholar] [CrossRef]
  3. Li, W.; Hsu, P.; He, J.; Zhu, Z.; Zhang, W. Extended-Range Forecast of Spring Rainfall in Southern China Based on the Madden-Julian Oscillation. Meteorol. Atmos. Phys. 2016, 128, 331–345. [Google Scholar] [CrossRef]
  4. Zhu, Z.; Li, T. Extended-Range Forecasting of Chinese Summer Surface Air Temperature and Heat Waves. Clim. Dyn. 2018, 50, 2007–2021. [Google Scholar] [CrossRef]
  5. Liu, Y.; Yang, S. The Impact of Mid-High-Latitude Eurasian ISO on Soil Moisture Anomaly in North China during Boreal Summer. Clim. Dyn. 2023, 61, 185–201. [Google Scholar] [CrossRef]
  6. Zhu, Z.; Wu, J.; Huang, H. The Influence of 10–30-day boreal summer intraseasonal oscillation on the extended-range forecast skill of extreme rainfall over southern China. Clim. Dyn. 2023. [Google Scholar] [CrossRef]
  7. Hall, J.D.; Matthews, A.J.; Karoly, D.J. The Modulation of Tropical Cyclone Activity in the Australian Region by the Madden-Julian Oscillation. Mon. Weather Rev. 2001, 129, 2970–2982. [Google Scholar]
  8. Zhao, C.; Li, T. Basin Dependence of the MJO Modulating Tropical Cyclone Genesis. Clim. Dyn. 2019, 52, 6081–6096. [Google Scholar]
  9. Qian, Y.; Hsu, P.C.; Kazuyoshi, K. New Real-Time Indices for the Quasi-Biweekly Oscillation over the Asian Summer Monsoon Region. Clim. Dyn. 2019, 53, 2603–2624. [Google Scholar] [CrossRef]
  10. Lorenz, D.J.; Hartmann, D.L. The Effect of the MJO on the North American Monsoon. J. Clim. 2006, 19, 333–343. [Google Scholar] [CrossRef]
  11. Li, X.; Gollan, G.; Greatbatch, R.J.; Lu, R. Intraseasonal Variation of the East Asian Summer Monsoon Associated with the Madden-Julian Oscillation. Atmos. Sci. Lett. 2018, 19, e794. [Google Scholar] [CrossRef]
  12. Hsu, P.C.; Qian, Y.; Liu, Y.; Murakami, H.; Gao, Y. Role of Abnormally Enhanced MJO over the Western Pacific in the Formation and Subseasonal Predictability of the Record-Breaking Northeast Asian Heatwave in the Summer of 2018. J. Clim. 2020, 33, 3333–3349. [Google Scholar] [CrossRef]
  13. Schreck, C.J. Global Survey of the MJO and Extreme Precipitation. Geophys. Res. Lett. 2021, 48, e2021GL094691. [Google Scholar] [CrossRef]
  14. Qian, Y.; Hsu, P.C.; Wang, H.; Duan, M. Distinct Influential Mechanisms of the Warm Pool Madden-Julian Oscillation on Persistent Extreme Cold Events in Northeast China. Atmos. Ocean. Sci. Lett. 2022, 15, 100226. [Google Scholar] [CrossRef]
  15. Deng, L.; Li, T.; Liu, J.; Peng, M. Factors Controlling the Interannual Variations of MJO Intensity. J. Meteorol. Res. 2016, 30, 328–340. [Google Scholar] [CrossRef]
  16. Wang, L.; Li, T.; Maloney, E.; Wang, B. Fundamental Causes of Propagating and Nonpropagating MJOs in MJOTF/GASS Models. J. Clim. 2017, 30, 3743–3769. [Google Scholar] [CrossRef]
  17. Wang, B.; Chen, G.; Liu, F. Diversity of the Madden-Julian Oscillation. Sci. Adv. 2019, 5, eaax0220. [Google Scholar] [CrossRef]
  18. Huang, K.; Pegion, K. The Roles of Westward-Propagating Waves and the QBO in Limiting MJO Propagation. J. Clim. 2022, 35, 6031–6049. [Google Scholar] [CrossRef]
  19. Anderson, J.R.; Rosen, R.D. The Latitude-Height Structure of 40–50 Day Variations in Atmospheric Angular Momentum. J. Atmos. Sci. 1983, 40, 1584–1591. [Google Scholar] [CrossRef]
  20. Kikuchi, K.; Wang, B. Global Perspective of the Quasi-Biweekly Oscillation. J. Clim. 2009, 22, 1340–1359. [Google Scholar] [CrossRef]
  21. Wang, L.; Li, T.; Zhou, T.; Rong, X. Origin of the Intraseasonal Variability over the North Pacific in Boreal Summer. J. Clim. 2013, 26, 1211–1229. [Google Scholar] [CrossRef]
  22. Yang, S.; Wu, B.; Zhang, R.; Zhou, S. Relationship between an Abrupt Drought-Flood Transition over Mid-Low Reaches of the Yangtze River in 2011 and the Intraseasonal Oscillation over Mid-High Latitudes of East Asia. Acta. Meteorol. Sin. 2013, 27, 129–143. [Google Scholar] [CrossRef]
  23. Yang, S.; Wu, B.; Zhang, R.; Zhou, S. The Zonal Propagating Characteristics of Low-Frequency Oscillation over the Eurasian Mid-High Latitude in Boreal Summer. Sci. China Earth Sci. 2013, 56, 1566–1575. [Google Scholar] [CrossRef]
  24. Xiu, J.; Jiang, X.; Zhang, R.; Guan, W.; Chen, G. An Intraseasonal Mode Linking Wintertime Surface Air Temperature over Arctic and Eurasian Continent. J. Clim. 2022, 35, 2675–2696. [Google Scholar] [CrossRef]
  25. Yang, S.; Li, T. The Role of Intraseasonal Variability at Mid-high Latitudes in Regulating Pacific Blockings during Boreal Winter. Int. J. Climatol. 2017, 37, 1248–1256. [Google Scholar] [CrossRef]
  26. Yang, S.; Wen, X.; Gao, M. Relation of Mid-High-Latitude Eurasian ISO to Ural Blocking Frequency and Their Co-Effect on Extreme Hot Events during Boreal Summer. Atmosphere 2022, 13, 2041. [Google Scholar] [CrossRef]
  27. Yang, J.; Bao, Q.; Wang, B.; He, H.; Gao, M.; Gong, D. Characterizing Two Types of Transient Intraseasonal Oscillations in the Eastern Tibetan Plateau Summer Rainfall. Clim. Dyn. 2017, 48, 1749–1768. [Google Scholar] [CrossRef]
  28. Yang, S.; Zhu, Z.; Cui, J.; Yang, Y. Regulation of the Intraseasonal Oscillation over Mid-to-High Latitude Eurasia on Winter Surface Air Temperature over China. Dyn. Atmos. Oceans 2019, 86, 63–72. [Google Scholar] [CrossRef]
  29. Yang, S.; Li, T. Intraseasonal Variability of Air Temperature over the Mid-High Latitude Eurasia in Boreal Winter. Clim. Dyn. 2016, 47, 2155–2175. [Google Scholar] [CrossRef]
  30. Jiao, Y.; Wu, R. Propagation and Influence on Tropical Precipitation of Intraseasonal Variation over Mid-Latitude East Asia in Boreal Winter. Atmos. Ocean. Sci. Lett. 2019, 12, 155–161. [Google Scholar] [CrossRef]
  31. Yang, H.; Li, C. The Relation between Atmospheric Intraseasonal Oscillation and Summer Severe Flood and Drought in the Changjiang—Huaihe River Basin. Adv. Atmos. Sci. 2003, 20, 540–553. [Google Scholar]
  32. Zhu, T.; Yang, J. Two Types of Mid-High-Latitude Low-Frequency Intraseasonal Oscillations near the Ural Mountains during Boreal Summer. J. Clim. 2021, 34, 4279–4296. [Google Scholar] [CrossRef]
  33. Hersbach, H.; Bell, B.; Berrisford, P.; Hirahara, S.; Horányi, A.; Muñoz-Sabater, J.; Nicolas, J.; Peubey, C.; Radu, R.; Schepers, D.; et al. The ERA5 Global Reanalysis. Q. J. R. Meteorol. Soc. 2020, 146, 1999–2049. [Google Scholar] [CrossRef]
  34. Duchon, C.E. Lanczos Filtering in One and Two Dimensions. J. Appl. Meteor. 1979, 18, 1016–1022. [Google Scholar] [CrossRef]
  35. Weare, B.C.; Nasstrom, J.S. Examples of Extended Empirical Orthogonal Function Analyses. Mon. Weather Rev. 1982, 110, 481–485. [Google Scholar] [CrossRef]
  36. Suhas, E.; Neena, J.M.; Goswami, B.N. An Indian Monsoon Intraseasonal Oscillations (MISO) Index for Real Time Monitoring and Forecast Verification. Clim. Dyn. 2013, 40, 2605–2616. [Google Scholar] [CrossRef]
  37. Holton, J.R. An Introduction to Dynamic Meteorology; Academic Press: London, UK, 1992; p. 511. [Google Scholar]
  38. Yanai, M.; Esbensen, S.; Chu, J.H. Determination of Bulk Properties of Tropical Cloud Clusters from Large-Scale Heat and Moisture Budgets. J. Atmos. Sci. 1973, 30, 611–627. [Google Scholar] [CrossRef]
  39. Varotsos, C.; Efstathiou, M.; Tzanis, C. Scaling Behaviour of the Global Tropopause. Atmos. Chem. Phys. 2009, 9, 677–683. [Google Scholar] [CrossRef]
  40. Efstathiou, M.N.; Varotsos, C.A. On the Altitude Dependence of the Temperature Scaling Behaviour at the Global Troposphere. Int. J. Remote Sens. 2010, 31, 343–349. [Google Scholar] [CrossRef]
  41. Hsu, P.C.; Li, T. Role of the Boundary Layer Moisture Asymmetry in Causing the Eastward Propagation of the Madden-Julian Oscillation. J. Clim. 2012, 25, 4914–4931. [Google Scholar] [CrossRef]
  42. Hoskins, B.J.; James, I.N.; White, G.H. The Shape, Propagation and Mean-Flow Interaction of Large-Scale Weather Systems. J. Atmos. Sci. 1983, 40, 1595–1612. [Google Scholar] [CrossRef]
  43. North, G.R.; Bell, T.L.; Cahalan, R.F.; Moeng, F.J. Sampling Errors in the Estimation of Empirical Orthogonal Functions. Mon. Weather Rev. 1982, 110, 699–706. [Google Scholar] [CrossRef]
  44. Wheeler, M.C.; Hendon, H.H. An All-Season Real-Time Multivariate MJO Index: Development of an Index for Monitoring and Prediction. Mon. Weather Rev. 2004, 132, 1917–1932. [Google Scholar] [CrossRef]
  45. Du, Y.; Lu, R. Wave Trains of 10–30-Day Meridional Wind Variations over the North Pacific during Summer. J. Clim. 2021, 34, 9267–9277. [Google Scholar] [CrossRef]
  46. Yao, S.; Liu, Y. The Zonal Wind Intraseasonal Oscillation in the Exit Region of the East Asian Subtropical Westerly Jet in Winter and Its Thermodynamic Mechanism. Atmosphere 2022, 13, 395. [Google Scholar] [CrossRef]
  47. Xu, P.; Wang, L.; Vallis, G.K.; Geen, R.; Screen, J.A.; Wu, P.; Ding, S.; Huang, P.; Chen, W. Amplified Waveguide Teleconnections Along the Polar Front Jet Favor Summer Temperature Extremes Over Northern Eurasia. Geophys. Res. Lett. 2021, 48, e2021GL093735. [Google Scholar] [CrossRef]
  48. Wallace, J.M.; Gutzler, D.S. Teleconnections in the geopotential height field during the Northern Hemisphere winter. Mon. Weather Rev. 1981, 109, 784–812. [Google Scholar] [CrossRef]
  49. Wang, N.; Zhang, Y. Evolution of Eurasian teleconnection pattern and its relationship to climate anomalies in China. Clim. Dyn. 2015, 44, 1017–1028. [Google Scholar] [CrossRef]
  50. Renwick, J.A.; Revell, M.J. Blocking over the South Pacific and Rossby wave propagation. Mon. Weather Rev. 1999, 127, 2233–2247. [Google Scholar] [CrossRef]
  51. Jiang, X.; Lau, N.-C. Intraseasonal teleconnection between North American and Western North Pacific monsoons with 20-day time scale. J. Clim. 2008, 21, 2664–2679. [Google Scholar] [CrossRef]
  52. Zhao, P.; Cao, Z.; Chen, J. A summer teleconnection pattern over the extratropical Northern Hemisphere and associated mechanisms. Clim. Dyn. 2010, 35, 523–534. [Google Scholar] [CrossRef]
  53. Wang, Y.; Lupo, A.R. An extratropical air-sea interaction over the North Pacific in association with a preceding El Niño episode in early summer. Mon. Weather Rev. 2009, 137, 3771–3785. [Google Scholar] [CrossRef]
  54. Wang, Y.; Lupo, A.R.; Qin, J. A response in the ENSO cycle to an extratropical forcing mechanism during the El Niño to La Niña transition. Tellus A Dyn. Meteorol. Oceanogr. 2013, 65, 22431. [Google Scholar] [CrossRef]
Figure 1. (a) The variance distribution of the summertime (MJJAS) SAT anomaly (unit: K; with the seasonal cycle and the first three harmonics excluded). Black box denotes the largest variability center of SAT anomalies. (b) Power spectrum of area-averaged SAT time series for the boxed area in (a). The red noise spectrum′s (red solid line) 0.05 and 0.01 confidence levels are shown by the green solid and blue dashed lines, respectively. (c) The spatial pattern of EEOF1 for 10–30-day SAT anomalies in boreal summer at 3-day intervals (day 0, +3, +6). (d) Similar to (c), but for the EEOF2. (e) The coefficients of lead–lag correlation between PC1 and PC2. Black dots indicate correlation coefficients with a significance level greater than 0.05. The zero line is depicted by gray dashed lines; for a positive (negative) day, it means that PC2 is leading (lagging) PC1. (f) Phase space diagram and the corresponding days and mean amplitudes for each phase. The positions of the ISO phase space are given on the outside of the coordinate axes, such as in phases 2 and 3 on the ‘Western Siberian Plain’.
Atmosphere 14 01372 g001
Figure 2. Composite of 10–30-day 500 hPa Z (contours; at 12 gpm intervals) and SAT (shading; unit: K) anomalies for each ISO phase during summertime. According to Student′s t-test, only fields with a significance level greater than 0.05 are displayed.
Atmosphere 14 01372 g002
Figure 3. Longitude–height cross sections of 10–30-day-filtered Z (contours; at 15 gpm intervals) and T (shadings; unit: K) anomalies along 57° N. According to Student′s t-test, the black isolines indicate that the Z anomaly passes the 0.05 significance level. Black dots indicate regions where the T anomaly has a significance level greater than 0.05. The black shading in each panel represents the topography.
Atmosphere 14 01372 g003
Figure 4. (a) Horizontal distribution of ∂T′/∂t (contours; at intervals of 0.15 K day−1) and T′ (shaded; K) during phase 2. Green box (48°–63° N, 66°–87° E) indicates the center of maximum negative ∂T′/∂t. Only fields with a significance level greater than 0.05 are shown. (b) The regional average of ∂T′/∂t and its individual terms (unit: K day−1) over the green box region in (a) during phase 2. Blue bar indicates the largest term. (c) As in (b), but for zonal advection terms of temperature (−uT/∂x)′ after timescale separation (unit: K day−1). Blue bar represents the largest of the nine terms after timescale separation. All the above values are vertically averaged (925–500 hPa).
Atmosphere 14 01372 g004
Figure 5. (a) Longitude–height cross section of ∂T′/∂t (unit: K day−1) averaged over 48°–63° N during phase 2. Black dots indicate areas where ∂T′/∂t has a significance level greater than 0.05. (b,c) Similar to Figure 4b,c, respectively, but for 250–150 hPa vertically averaged.
Atmosphere 14 01372 g005
Figure 6. (a) Composite of 925–500 hPa vertically averaged T′ (shaded; unit: K), (− u ¯ ∂T′/∂x)′ (contours; at intervals of 0.3 K day1) and u ¯ (vector; unit: m s1) during phase 2. Black isolines for (− u ¯ ∂T′/∂x)′ pass the 0.05 significance level. Only u ¯ and T′ fields with a significance level greater than 0.05 are shown. (b) Similar to (a), but for 250–150 hPa vertically averaged.
Atmosphere 14 01372 g006
Figure 7. (a) Latitude–height cross section of barotropic kinetic energy conversion ( CK iso ̿ ; unit: 10−5 m2 s−3) averaged over 42°–141° E in boreal summer. (be) Similar to (a), but for CK1 ( u 2 v 2 ̿ 2 u ̿ x ), CK2 ( v 2 u 2 ̿ 2 v ̿ y ), CK3 ( u v ̿ u ̿ y ), and CK4 ( u v ̿ v ̿ x ), respectively. (f) The vertical profile of area-averaged (42°–141° E, 51°–78° N; the boxed area in Figure 1a) CK iso ̿ , CK1, CK2, CK3, and CK4 (unit: 10−5 m2 s−3).
Atmosphere 14 01372 g007
Figure 8. (a) Similar to Figure 7a, but for the results of potential energy conversion ( CP iso ̿ ; unit: 10−5 m2 s−3). (b,c) Similar to (a), but for CP1 ( g ( γ d γ ) T 0 u T T ̿ x ) and CP2 ( g ( γ d γ ) T 0 v T T ̿ y ), respectively. (d) Vertical profile of area-averaged (42°–141° E, 51°–78° N; the boxed area in Figure 1a) CP iso ̿ , CP1 and CP2 (unit: 10−5 m2 s−3).
Atmosphere 14 01372 g008
Disclaimer/Publisher’s Note: The statements, opinions and data contained in all publications are solely those of the individual author(s) and contributor(s) and not of MDPI and/or the editor(s). MDPI and/or the editor(s) disclaim responsibility for any injury to people or property resulting from any ideas, methods, instructions or products referred to in the content.