Review

Research Progress and Trends in the Field of Satellite Ozone from 2005 to 2023: A Bibliometric Review

1
Jiangsu Meteorological Observation Center, Nanjing 210041, China
2
State Key Laboratory of Severe Weather, Chinese Academy of Meteorological Sciences, Beijing 100081, China
3
Key Laboratory of Atmosphere Sounding, China Meteorological Administration, Chengdu 610225, China
4
Key Laboratory of Transportation Meteorology, China Meteorological Administration, Nanjing 210041, China
Atmosphere 2023, 14(8), 1245; https://doi.org/10.3390/atmos14081245
Submission received: 9 July 2023 / Revised: 30 July 2023 / Accepted: 31 July 2023 / Published: 4 August 2023

Abstract

:
Ozone, an important atmospheric constituent, affects various processes in the troposphere–stratosphere region and significantly contributes to climate and environmental change. The advancement of meteorological satellite technology has enabled the deployment of ozone detection instruments in space, providing accurate and global satellite ozone data in all weather conditions. This study employs scientometric methods, such as collaboration analysis, co-citation analysis, and keyword co-occurrence analysis to investigate the current status, trends, and future directions of satellite ozone research, with a broader search scope and more objective results compared with a manual review. Analyzing a dataset of 5320 bibliographic records from the WoS core collection database reveals the key intellectual frameworks shaping this field during the period from 2005 to 2023. The findings indicate that leading nations, like the United States, Germany, France, and China, along with their respective institutions and authors, spearhead satellite ozone research. Collaborative partnerships between the United States and European countries play a crucial role in advancing research efforts. Moreover, 20 distinct co-citation clusters identify the knowledge framework within the field, demonstrating a consistent progression over time. The focus has expanded from satellite ozone observation instruments to encompass broader areas, such as atmospheric pollution and environmental conditions, with “air quality” emerging as a prominent research area and future trend. Based on these insights, four major research directions are proposed: understanding atmospheric pollution mechanisms, improving ozone detection technologies, utilizing satellite ozone data for weather, and climate phenomena. This study aims to assist scholars by providing a comprehensive understanding of the developmental trajectory of satellite ozone research. Its results can serve as a valuable reference for researchers to identify relevant publications and journals efficiently. Policymakers can also utilize this systematic review as a structured point of reference.

1. Introduction

Ozone is an important atmospheric trace gas, primarily concentrated in the stratosphere at altitudes of 10–50 km, with only about 10% of ozone found in the troposphere. Ozone in the stratosphere absorbs solar ultraviolet radiation, thereby protecting the Earth’s biosphere. In the troposphere, ozone acts as a greenhouse gas by absorbing long-wave radiation from the Earth–atmosphere system, contributing to atmospheric heating [1]. However, high concentrations of ground-level ozone can constitute air pollutants, directly impacting ecosystems and human health. Therefore, ozone can influence processes, such as atmospheric dynamics, thermodynamics, radiation, and chemistry in the troposphere–stratosphere region, and it plays a significant role in climate and environmental change [2].
Since the discovery of the atmospheric ozone layer by Fabry in 1921 and the successful development of the Dobson spectrophotometer in 1929, atmospheric ozone observations have rapidly advanced [3]. Scholars from China and abroad have measured atmospheric ozone using various platforms, such as ground-based instruments and balloons. Relevant studies have shown close correlations between variations in atmospheric ozone and tropopause height, temperature, potential height, and the strength of high-level troughs and ridges [4,5,6,7]. Due to the lack of temporal and spatial continuity in ground-based and balloon observations, satellite-based measurements have become the primary method for observing atmospheric ozone in recent decades. Satellite-based observation of atmospheric ozone began in the 1960s. In 1965, Singer proposed the atmospheric ozone measurement method based on solar ultraviolet backscattering, opening a new chapter in satellite-based atmospheric ozone detection [8]. Subsequently, several other methods for measuring atmospheric ozone were developed. To date, satellite-based detection methods for atmospheric ozone mainly include occultation, limb radiance measurement, infrared wavelength bands, visible spectroscopy, and ultraviolet backscattering [9]. The occultation method measures ozone when satellites pass through the dawn–dusk interface, allowing at most two measurements per orbit. The limb radiance measurement method is limited to obtaining satellite ozone data above 50 km due to the peak altitude of the limb radiance. The infrared wavelength band method can measure the Earth’s dark side, which is beneficial for retrieving ozone distribution below 15 km. However, this method is easily influenced by surface radiation, cloud cover, and water content in the atmosphere [10]. The visible spectroscopy method identifies the type and concentration of pollutants in the atmosphere based on characteristic absorption spectra. It enables high-precision non-contact measurements of standard air pollutants, such as ozone. However, this technique is only applicable to gases with narrow-band absorption structures [11]. The ultraviolet backscattering method has stable algorithms, low instrument requirements, and can provide ozone data with higher accuracy, making it the main method for obtaining satellite-based ozone information [12].
With the rapid development of meteorological satellite technology, an increasing number of atmospheric ozone detection instruments have been launched into space, providing high-precision, global, and all-weather satellite ozone data. In recent decades, scholars from various countries have conducted numerous studies on different types of satellite ozone data, achieving abundant results [13,14,15,16]. In light of this context, several studies have been carried out to review the research topics and methodologies within the domain of satellite ozone. These reviews have encompassed a range of perspectives to account for the interdisciplinary nature of satellite ozone research [17,18,19,20,21]. These perspectives include the utilization of satellite ozone data in the context of cyclones or low-pressure processes, the application of satellite ozone data to analyze the climate distribution and variations of global or regional ozone, exploring the use of satellite ozone data to uncover the distribution and characteristic variations of ozone in high-altitude areas, and the numerical applications of satellite ozone data [22,23,24,25]. Nonetheless, the existing reviews in this area predominantly rely on expert opinions and tend to narrow their focus to specific topics, thereby neglecting quantitative bibliometric analysis. Despite the growing number of publications within satellite ozone, our understanding of the broader knowledge landscape remains limited.
The field of scientometrics, as coined by Nalimov and Mul’chenko (1971) [26], encompasses quantitative research methods that focus on studying the progression of science as an informational process. These methods utilize citation analysis in the academic literature to map the structure of knowledge and forecast emerging trends. To facilitate this analysis, researchers commonly employ visualization tools, like VOSviewer [27], Histcite [28], and CiteSpace [29], which aid in the exploration, extraction, analysis, and presentation of knowledge within the scientometric domain.
Despite the prevailing use of knowledge domain mapping, as far as we know, there is a dearth of studies that have investigated the burgeoning literature on satellite ozone. Given the need for a thorough understanding of this field, it is imperative to conduct a systematic analysis that offers insights into its current state and future prospects. Our study aims to address this gap by conducting a comprehensive investigation of research in the field of satellite ozone. By utilizing the bibliographic records from the Web of Science (WoS) core collection database [30], we aim to uncover the underlying structure of the satellite ozone knowledge domain and provide reliable predictions for future research trends. This endeavor not only equips researchers with a clear comprehension of the field’s knowledge landscape but also furnishes policymakers with a well-structured point of reference.
This paper is structured as follows. In Section 2, we provide details on the methodology used for data collection, filtering, and the research framework. The analysis results are presented in Section 3, followed by Section 4 where we discuss potential future research directions based on the insights gleaned from the analysis. Lastly, we conclude by summarizing the key findings and showcasing the wide-ranging relevance and applicability of this study.

2. Materials and Methods

2.1. Data Collection and Filtering

This study made use of data sourced from the WoS core collection database. The search was carried out on 5 June 2023. The examination of the available literature indicated that the earliest publication focused on satellite ozone was released in 1961. Further analysis showed that the number of relevant publications was very small from 1961 to 2004, and it was not until 2005 that the annual publication count exceeded 200. In the field of bibliometrics, it is generally considered that results obtained from analyzing a literature collection with an average annual publication count exceeding 200 and a time range of over 10 years have typical representativeness [31]. Therefore, the time range for the literature collection used in this study was set from 1 January 2005 to 5 June 2023. By employing the search query “TS = (satellite ozone)”, we successfully discovered a comprehensive collection of 5365 publications. The output format of the search results is set as “Full Record and Cited References” and “Plain Text”. Upon excluding conference papers, notes, and publications in languages other than English, we obtained a dataset of 5320 publications with original research papers and review articles.

2.2. Analysis Tool

CiteSpace is a software tool commonly used for bibliometric analysis and visualization of the development of research domains, as well as the connections among authors, institutions, and keywords [31]. Its primary function is to examine large quantities of bibliographic data sourced from academic databases, like WoS, Scopus, and Google Scholar. CiteSpace empowers users to generate diverse visual representations encompassing highly cited papers, author networks, and clusters of keywords. These visualizations provide valuable insights into the progression of research fields over time, pinpoint significant scholarly contributions and influential authors, and identify emerging trends and potential avenues for future investigation [32].
In this research, we employed an advanced beta version of CiteSpace 6.2.R4a. CiteSpace played a crucial role in handling publications sourced from the WoS database and creating dynamic visual representations. Its utility greatly benefited researchers seeking a thorough and in-depth comprehension of the satellite ozone field.

2.3. Research Framework

In this study, we applied a combination of bibliometric techniques to investigate the field of satellite ozone (Figure 1). We utilized collaboration analysis to investigate potential cooperative relationships, co-citation analysis to uncover the underlying knowledge structure, and keyword co-occurrence analysis to track the development of research trends and identify current hot topics. Additionally, based on our analysis findings, we put forward suggestions for future research directions in the domain of satellite ozone.

3. Results

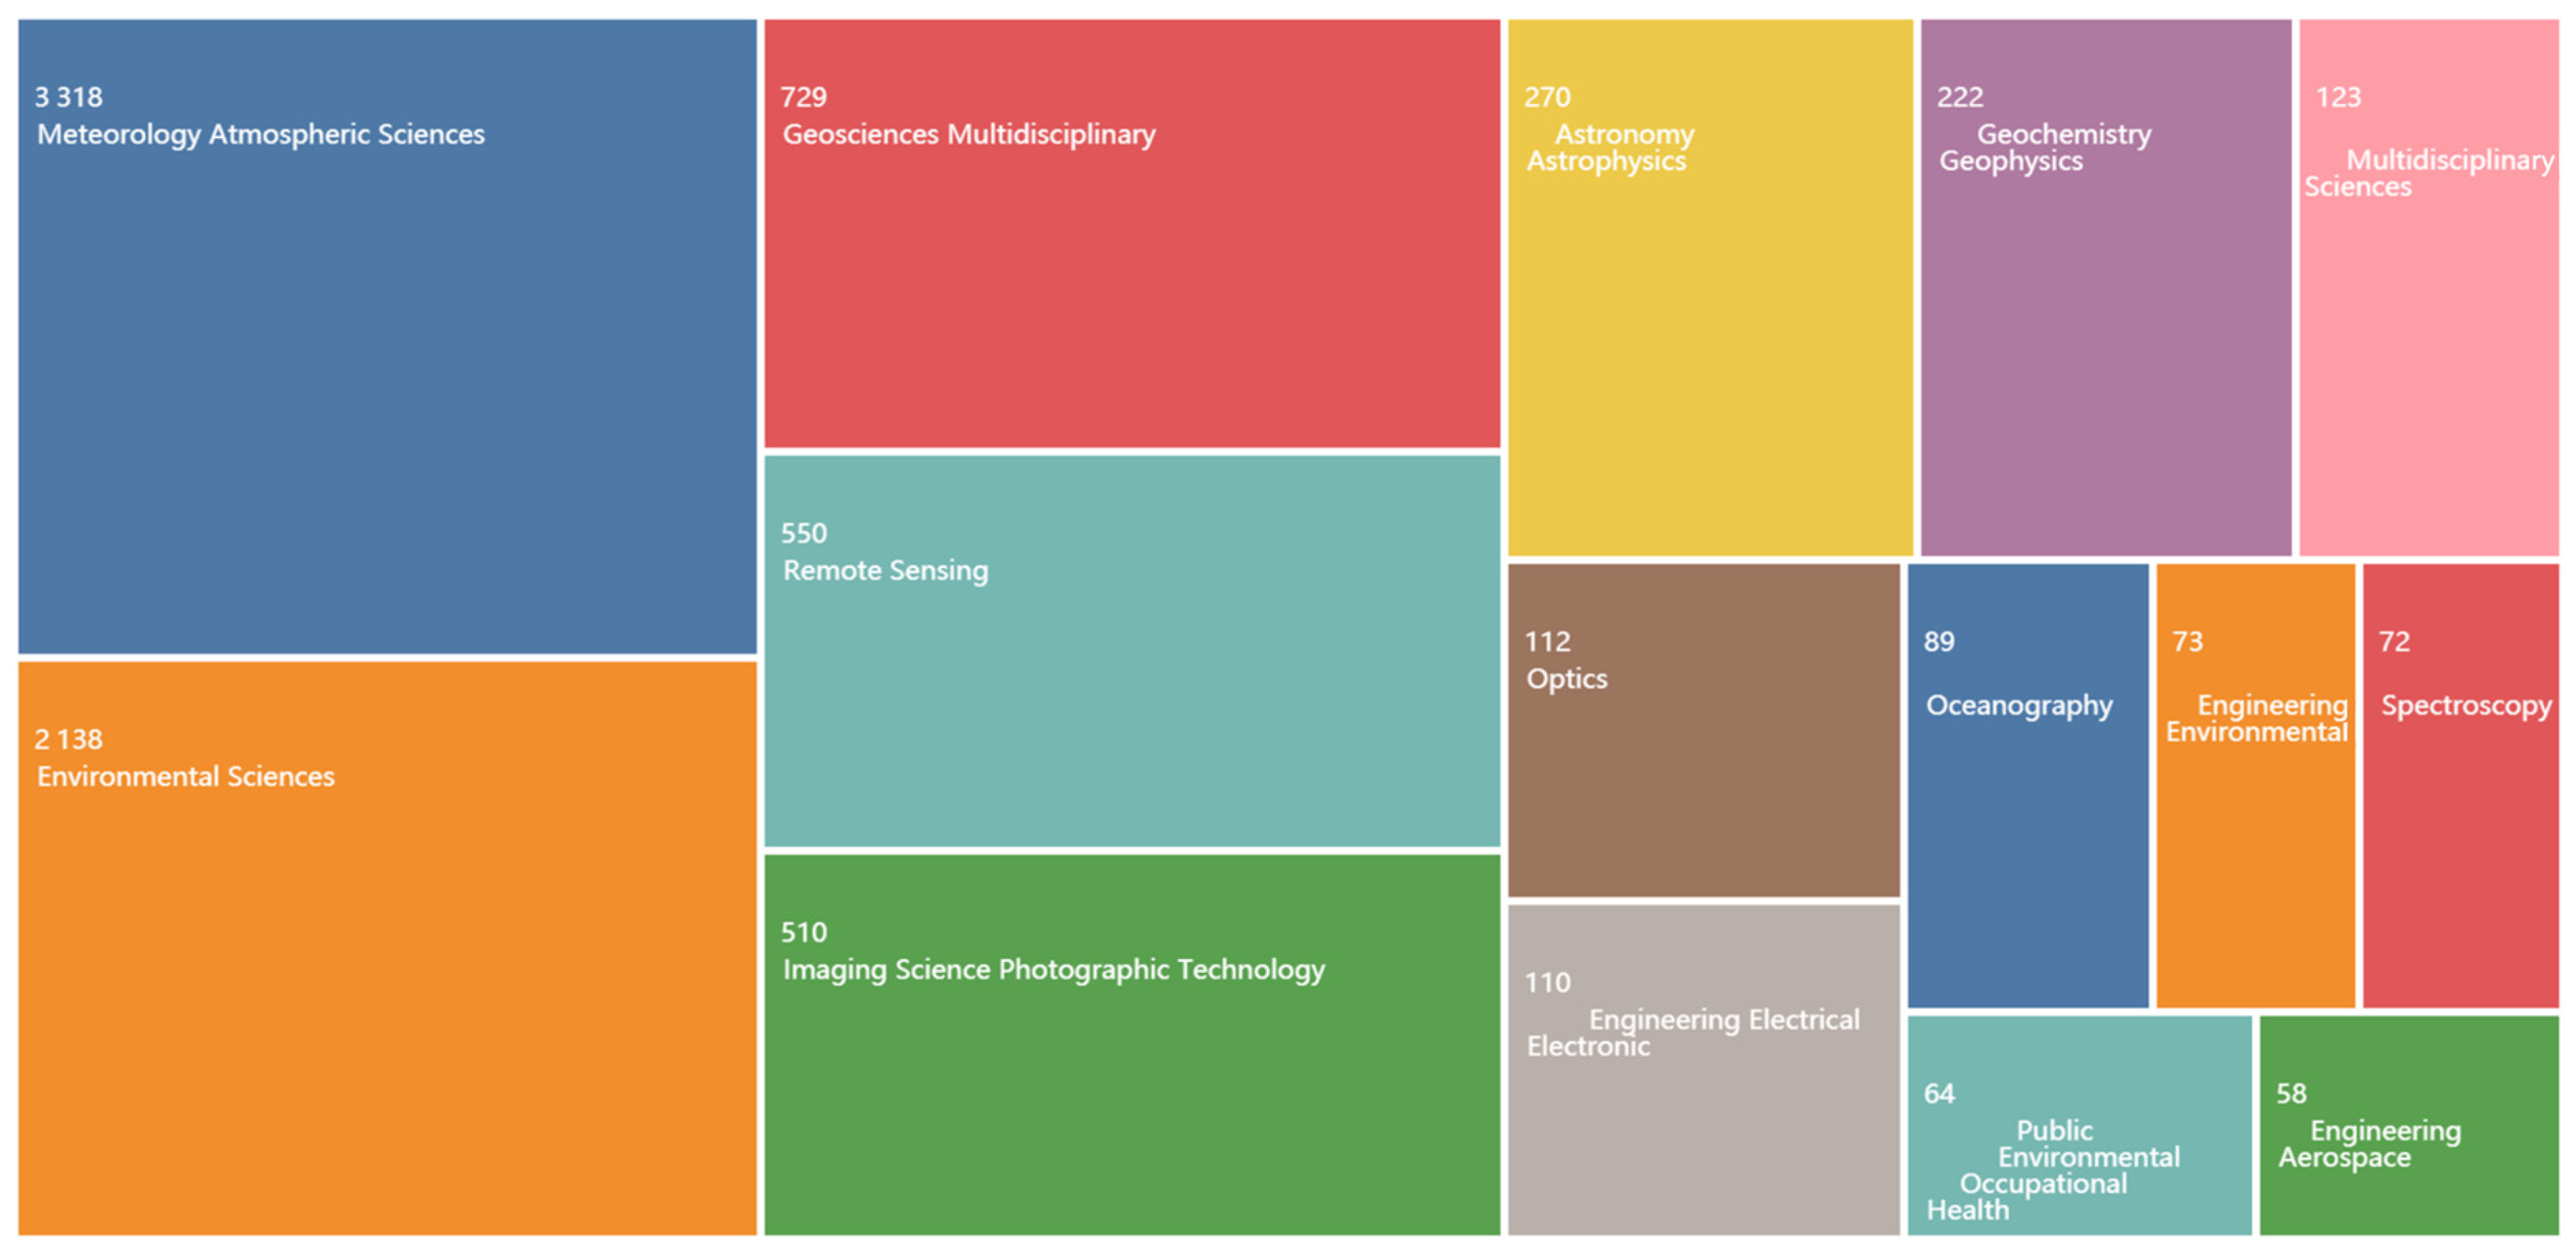
3.1. Overall Characteristics

Figure 2 illustrates the yearly and cumulative publication count in the realm of satellite ozone research. It can be observed that the number of publications in the field of satellite ozone has been gradually increasing each year from 2005 to 2023, reaching its peak value of 432 in 2022. Currently, the total number of research papers in the field of satellite ozone continues to rapidly rise, indicating a continuous increase in the level of attention towards this field.
Figure 3 displays the WoS categories of 5320 publications in this study. The statistical results indicate that research papers in the field of satellite ozone cover a wide range of WoS categories. Among them, the top three WoS categories are “Meteorology Atmospheric Sciences”, “Environmental Sciences”, and “Geosciences Multidisciplinary”, with 3318, 2138, and 729 articles, respectively, accounting for proportions of 61.845%, 39.851%, and 13.588% of the total number of articles.

3.2. Collaboration Analysis

Collaborative analysis serves as a powerful method for exploring the interconnected scientific network, enabling the recognition of prominent researchers across various levels, such as national affiliation, institutional association, and individual authorship [29].

3.2.1. Country Collaboration Network

In Figure 4, the network of collaborative partnerships among countries is illustrated, encompassing 125 nodes and 937 links during the period from 2005 to 2023. The color coding of the nodes corresponds to the publication timeline, while the connecting lines between the nodes depict the collaborative relationships between the respective countries. Additionally, Table 1 provides an overview of the top 10 countries in terms of both publication volume and betweenness centralities. The betweenness centrality of a node in a network quantifies the likelihood of that node being part of the shortest path between any two nodes. Nodes with high betweenness centrality often serve as bridges connecting distinct communities or sub-networks, which is why they are referred to as “betweenness” centrality [31]. Based on Figure 4 and Table 1, it can be observed that the USA has the highest publication count with 2564, far ahead of other countries. Germany, China, and France closely follow with publication counts reaching 1037, 869, and 629, respectively. It is worth noting that although the USA has the highest publication count, its betweenness centrality is only 0.01. Meanwhile, France has the highest betweenness centrality at 0.26, yet it ranks fourth in terms of publication count. This indicates that there is no clear positive correlation between publication count and betweenness centrality. Researchers conducting the literature analysis should take note of this issue. On the whole, developed countries demonstrate a higher level of research excellence in the field of satellite ozone compared to developing countries, evidenced by their superior performance in publication count and betweenness centrality. In addition, Figure 4 indicates that international collaborative research on satellite ozone among two or even multiple countries is currently the mainstream trend.

3.2.2. Institution Collaboration Network

The visual representation in Figure 5 demonstrates the establishment of academic partnerships among a network of 556 nodes and 941 links. The nodes in the network correspond to the volume of publications, while the interconnecting links signify the cooperative relationships established among the institutions. Table 2 provides a compilation of the top 10 institutions that have made remarkable contributions in terms of research publications. Noteworthy examples include the National Aeronautics and Space Administration (NASA) with 1264 publications, the NASA Goddard Space Flight Center with 704 publications, the Helmholtz Association with 546 publications, the Centre National de la Recherche Scientifique with 533 publications, the California Institute of Technology with 458 publications, the National Oceanic Atmospheric Administration with 455 publications, the NASA Jet Propulsion Laboratory with 453 publications, the National Center Atmospheric Research with 446 publications, the UDICE-French Research Universities with 403 publications, and the University System of Maryland with 380 publications. Among the top 10 academic institutions, apart from 1 institution from Germany and 2 institutions from France, the rest are all from the United States. This phenomenon indicates that American institutions have shown extremely active involvement in the field of satellite ozone research. It is worth noting that the top 10 institutions in terms of publication count had already started collaborative research on satellite ozone as early as 2005, which coincided with the time when the concept of satellite ozone was first introduced. Furthermore, Figure 5 also indicates that the vast majority of institutions have cooperative relationships, which suggests that academic collaboration plays a crucial role in the development of the satellite ozone research field.

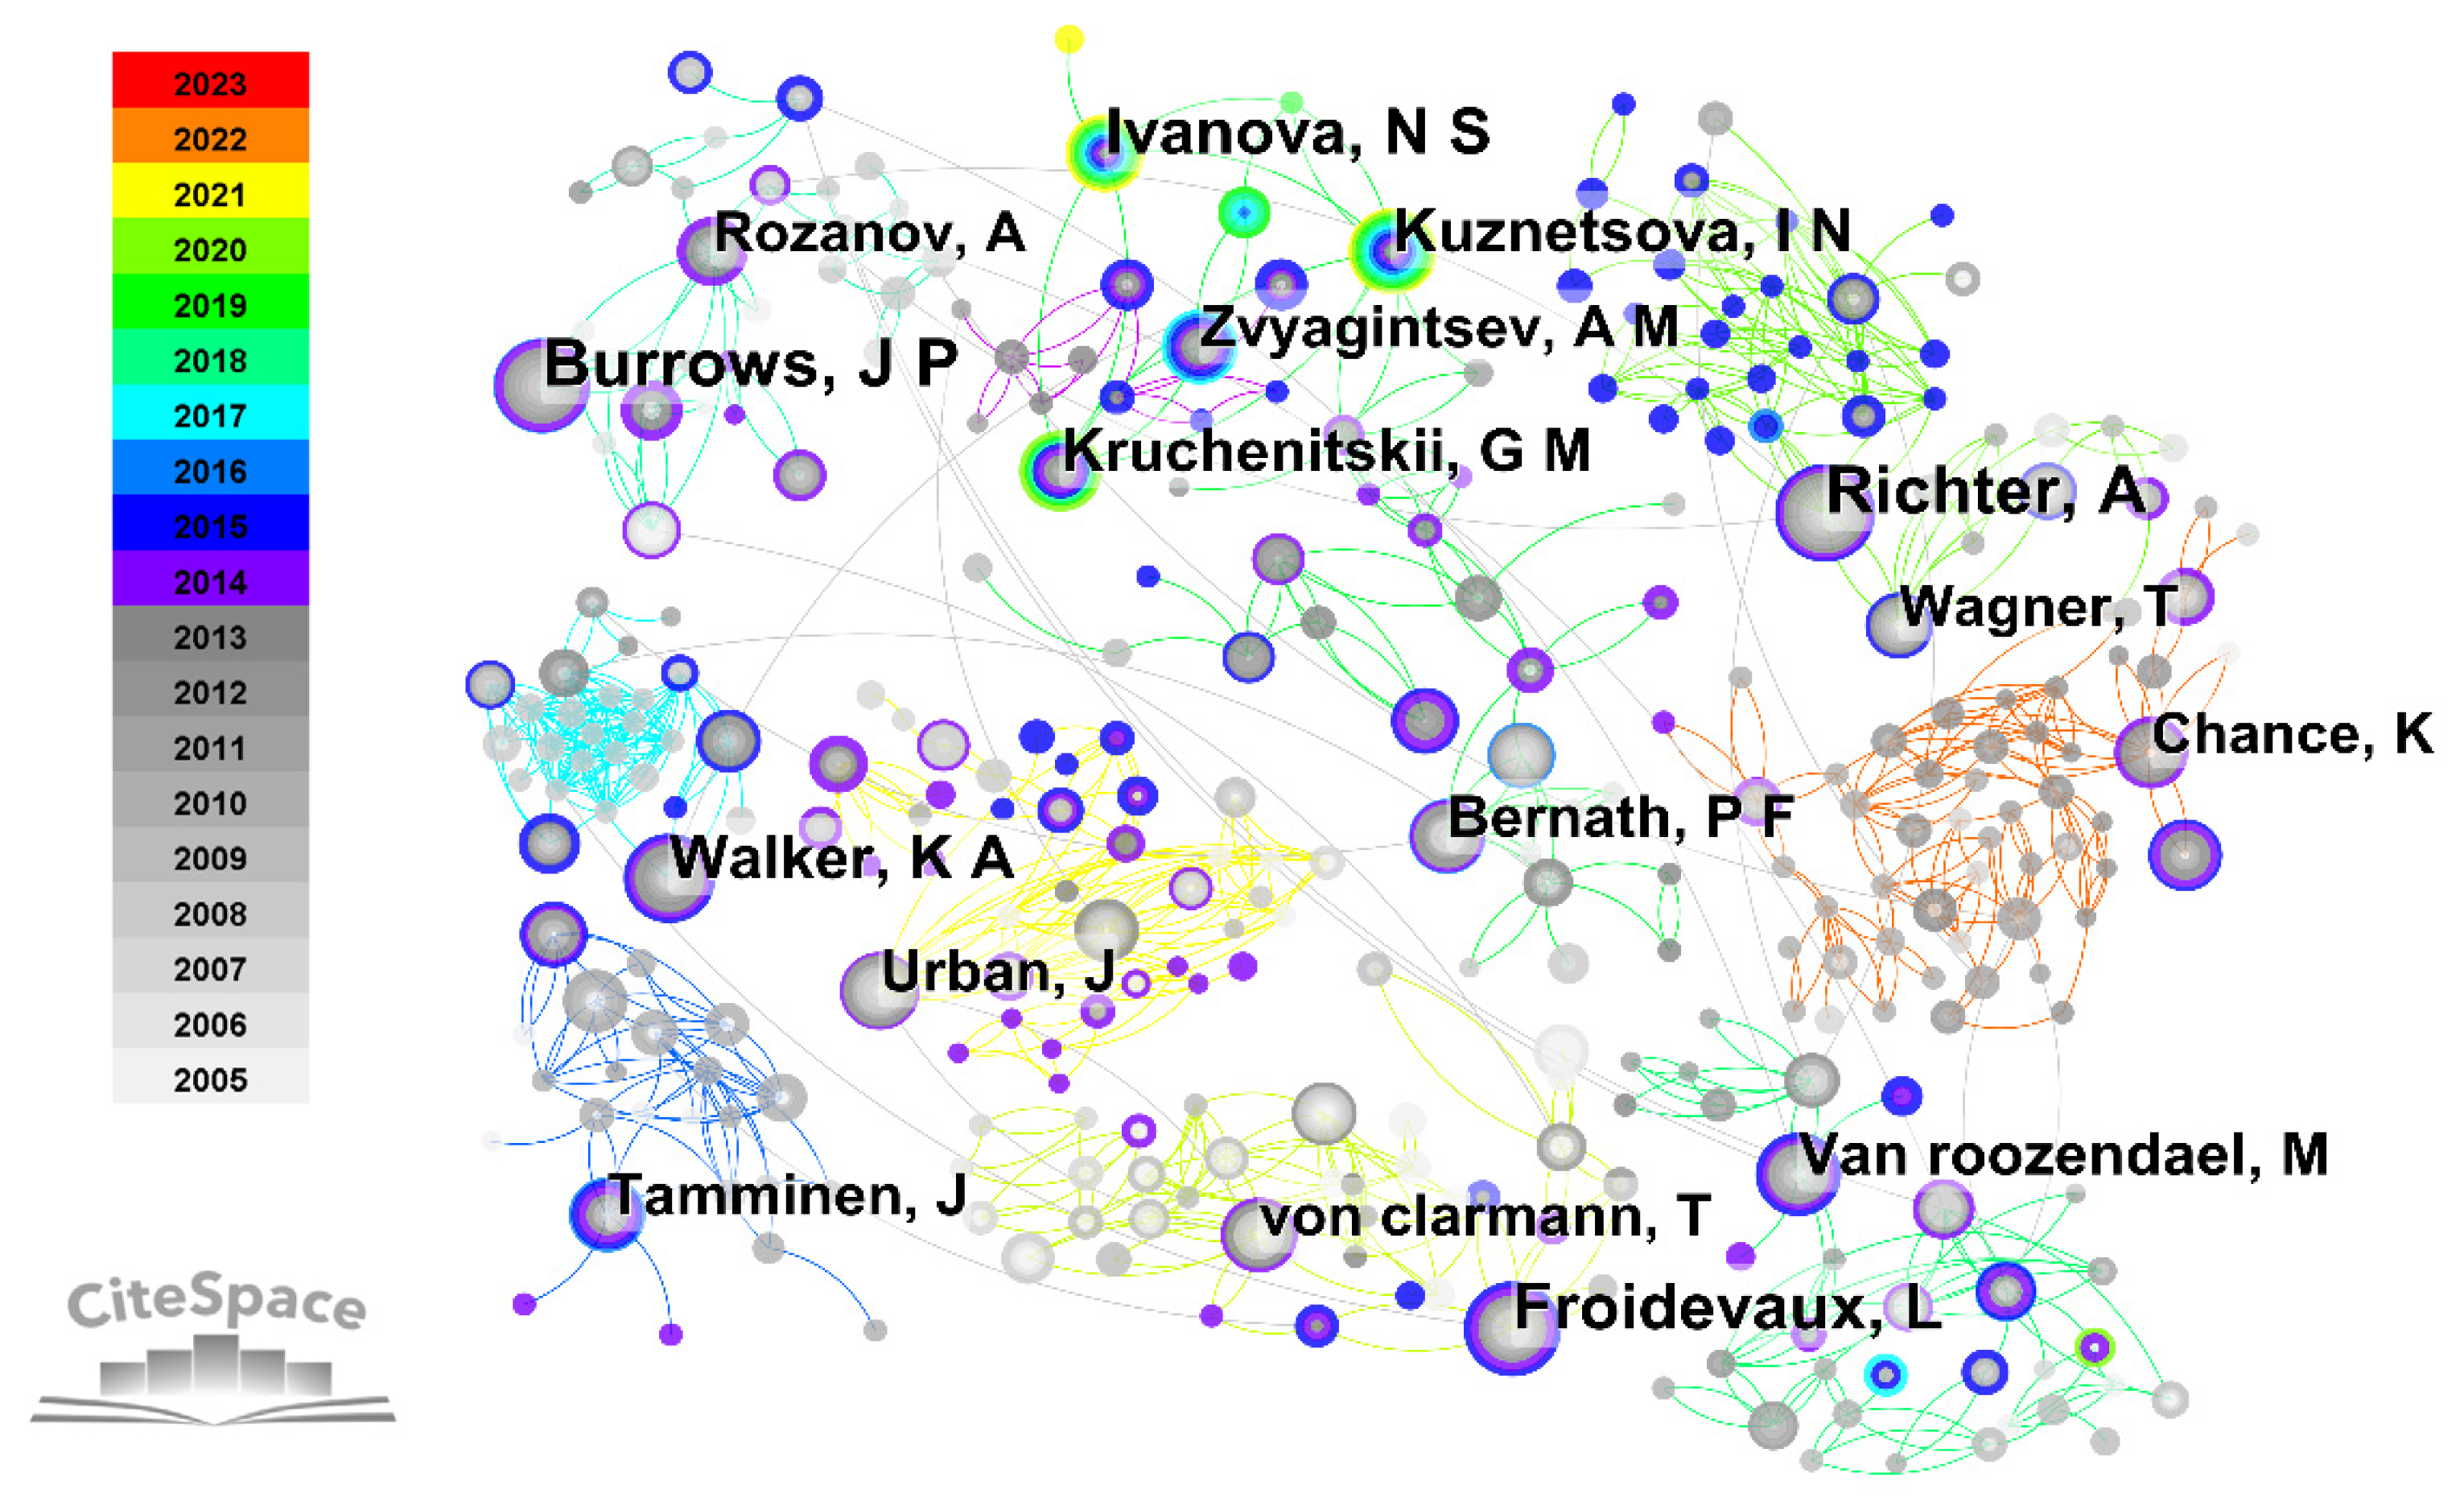
3.2.3. Author Collaboration Network

The visual representation depicted in Figure 6 showcases the intricate network of author collaborations, comprising 948 individual nodes and 3016 interconnected links spanning from 2005 to 2023. The advancement of the research community can be discerned based on a specific network characterized by a highly organized framework. Table 3 displays the ranking of the top 10 authors who have made significant publication contributions. Richter A., a distinguished researcher hailing from the Institute of Environmental Physics at the University of Bremen, stands out as the top contributor in the study of satellite ozone, with an exceptional publication record of 62 articles. Meanwhile, Richter A. holds the highest centrality score (0.06) and has the earliest publication date (2005) among all authors in this field. Therefore, researchers interested in understanding the origins and development of the satellite ozone field are advised to refer to the publications authored by Richter A. and their team. It is worth mentioning that Joanna Joiner, a scholar from NASA Goddard Space Flight Center, has accumulated 39 publications on satellite ozone since her first paper in 2015. As a result, her ranking in publications has rapidly climbed to ninth place. Researchers interested in the latest research hotspots and development trends in satellite ozone are advised to pay special attention to the publications by Joanna Joiner and her team.

3.3. Co-Citation Analysis

Co-citations denote the situation where the third article cites both of the referenced sources. In general, when the third article includes citations to both sources in any location, they are regarded as co-cited. If the complete text of the third article is accessible, it enables a more refined analysis by focusing on specific sections, paragraphs, or sentences. Co-citation analysis is typically classified into three categories: reference co-citation analysis, author co-citation analysis, and journal co-citation analysis [29].

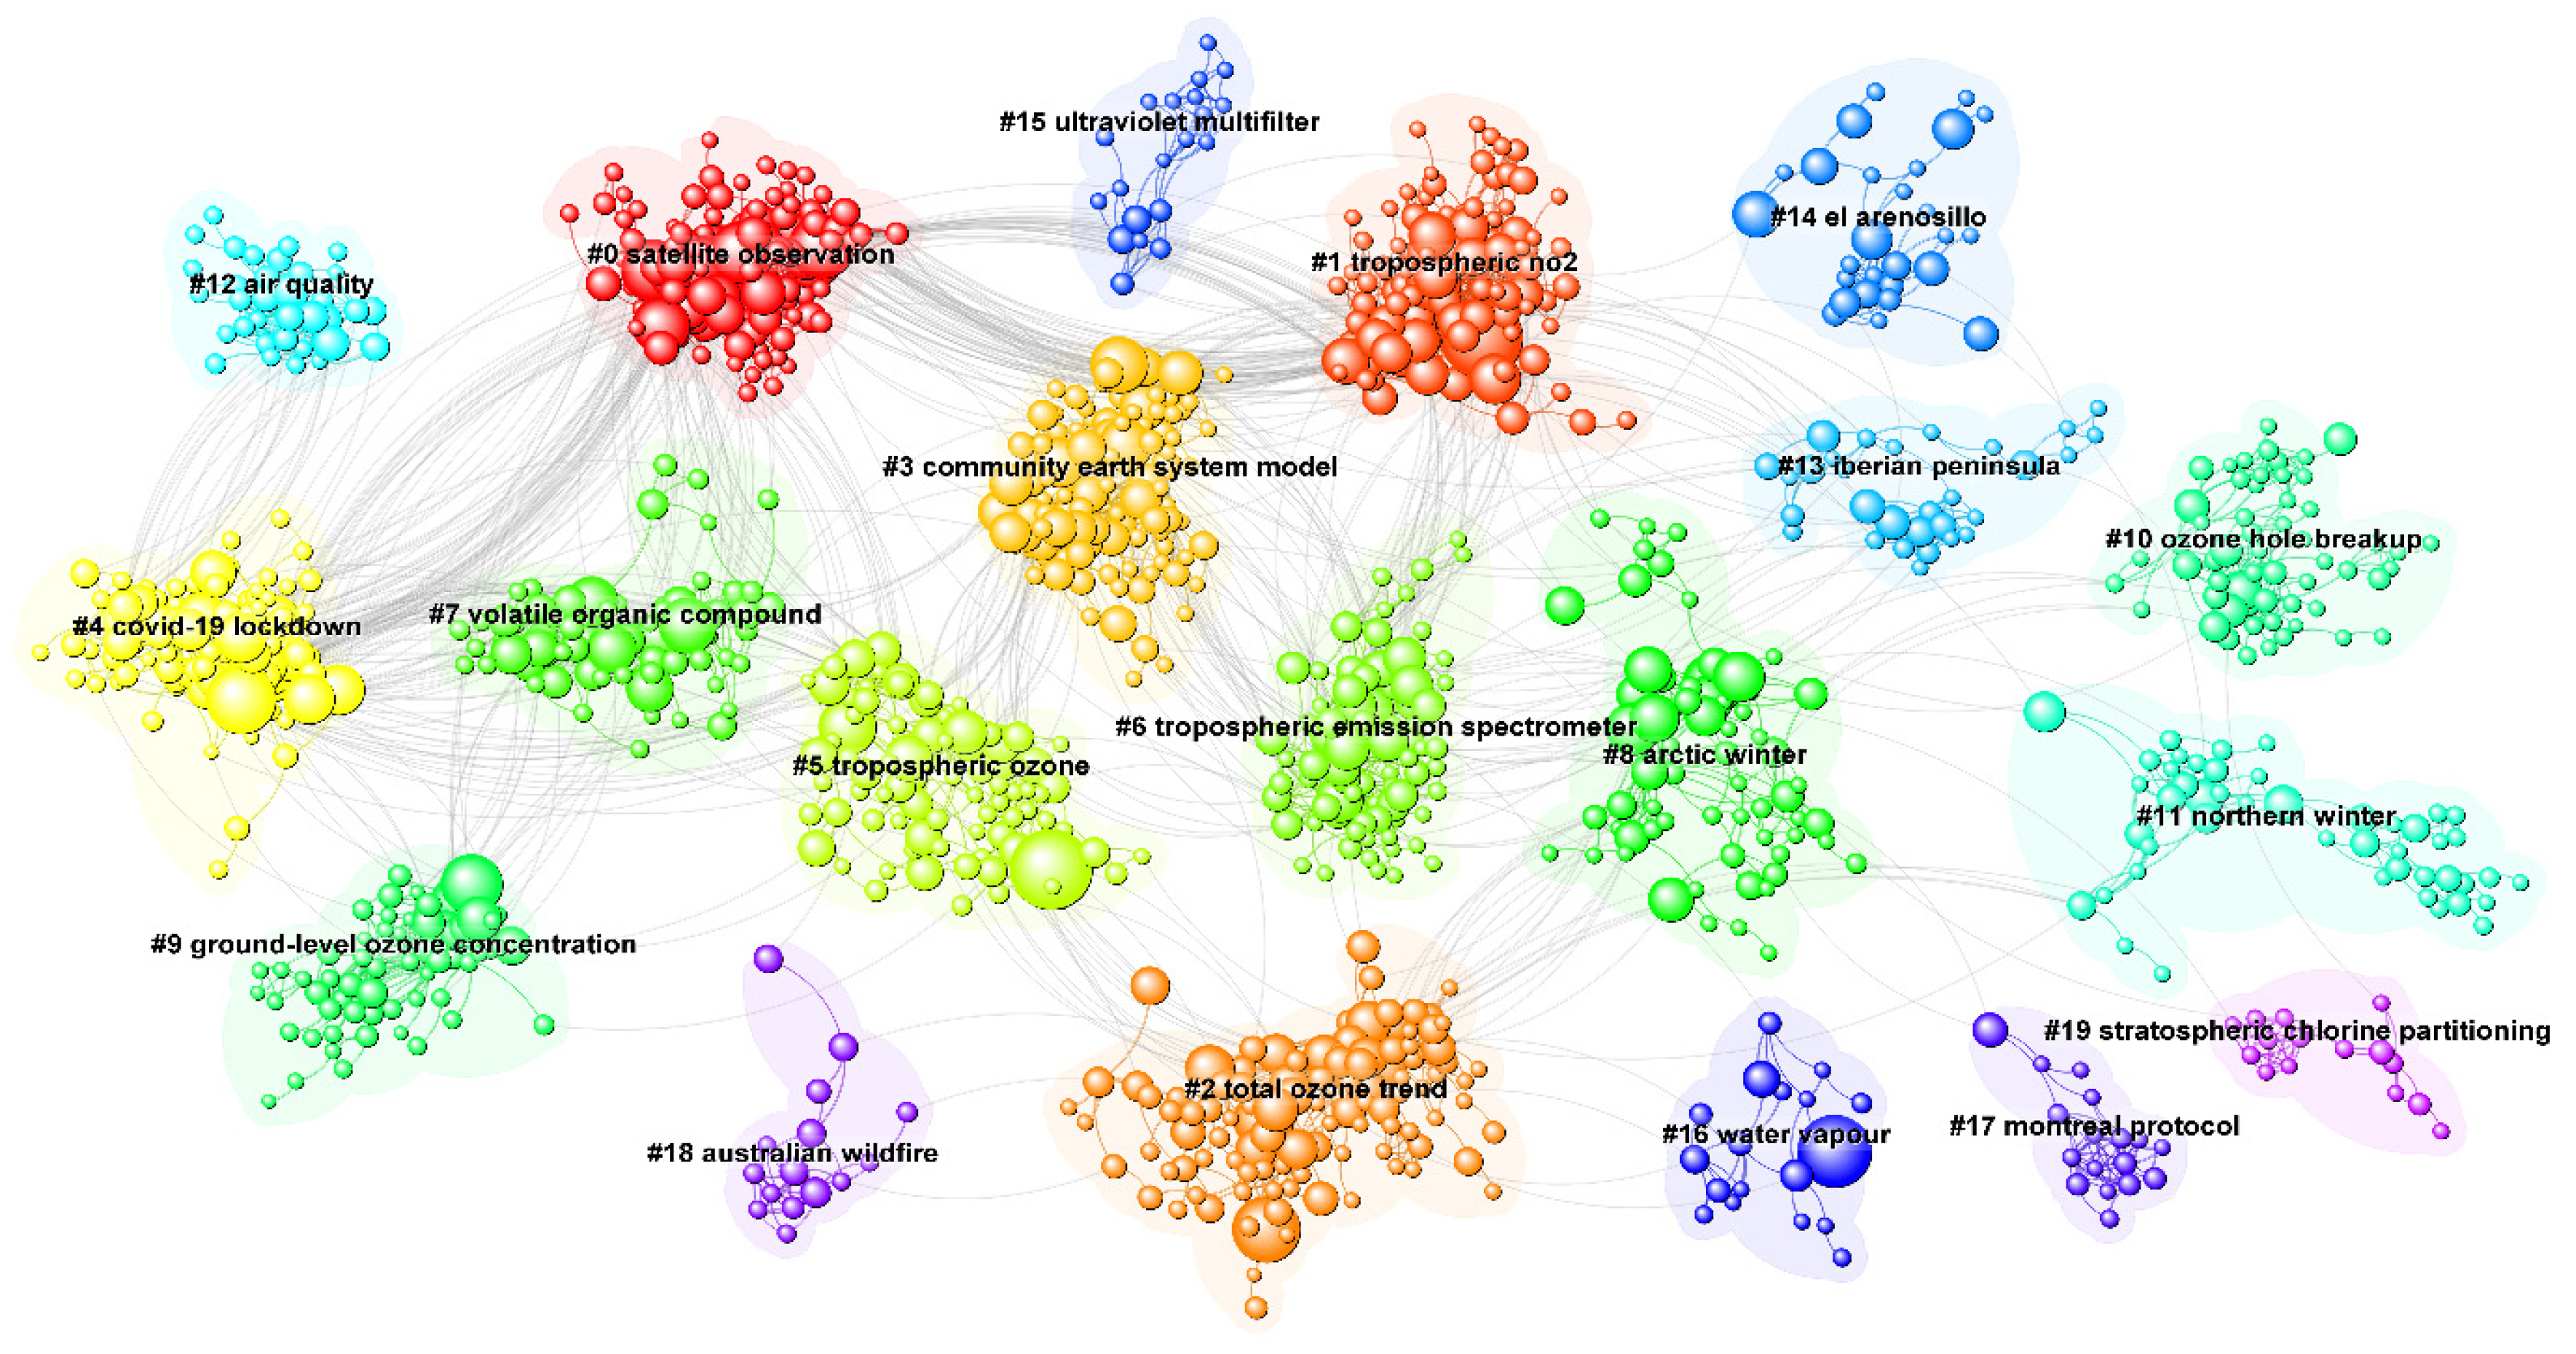
3.3.1. Reference Co-Citation Analysis

In this study, the construction of the reference co-citation network involves employing a log-likelihood ratio (LLR) weighting algorithm to assess the articles and their cited references within the dataset. The LLR algorithm aids in assigning specific professional terminology to accurately identify and categorize the clusters [32]. According to the visual representation in Figure 7, the co-citation network comprises 1449 nodes and 5031 links. This network is segmented into 20 distinct co-citation clusters, and the specific characteristics of each cluster can be found in Table 4. It should be noted that all clusters achieved a remarkable silhouette score, suggesting a strong level of consistency within the co-citation network. The labels assigned to the clusters in Table 4 represent well-established and enduring research subjects within the domain of satellite ozone. Consequently, in order to elucidate the knowledge structure of this domain, a thorough examination and analysis of the clusters must be conducted. In this study, the top three clusters based on their size are selected for detailed analysis.
(1)
Satellite observation
The cluster with the highest membership count, termed as “Satellite observation”, encompasses 137 individuals and demonstrates a silhouette value of 0.911. The major citing article of the cluster is “The ozone monitoring instrument: overview of 14 years in space” by Levelt P. F., published in the journal Atmos. Chem. Phys. in 2018 [33]. The most cited member in this cluster is “A global catalogue of large SO2 sources and emissions derived from the Ozone Monitoring Instrument” published by Krotkov N. A. in the journal Atmos. Chem. Phys. in 2016 [34], with a citation count of 141 times.
(2)
Tropospheric NO2
The second prominent cluster titled “Tropospheric NO2” consists of 119 members and exhibits a silhouette value of 0.928. The major citing article of the cluster is “Space-based constraints on the production of nitric oxide by lightning” by Martin R. V., published in the journal J. Geophys. Res.-Atmos. in 2007 [35]. The most cited member in this cluster is “Science objectives of the Ozone Monitoring Instrument” published by Levelt P. F. in the journal IEEE Trans. Geosci. Remote Sens. in 2006 [36], with a citation count of 152 times.
(3)
Total ozone trend
The cluster related to “Total ozone trend” is the third largest, consisting of 112 members and achieving a silhouette value of 0.929. The major citing article of the cluster is “The ozone monitoring instrument: overview of 14 years in space” by Levelt P. F., published in the journal Atmos. Chem. Phys. in 2018 [33]. The most cited member in this cluster is “The ERA5 global reanalysis” published by Hersbach H. in the journal Q. J. R. Meteorol. Soc. in 2020 [37], with a citation count of 103 times.
Figure 7. Reference co-citation network.
Atmosphere 14 01245 g007
Table 4. Summary of the 20 largest clusters.
Cluster IDSizeSilhouetteAverage YearLabel
01370.9112013Satellite observation
11190.9282004Tropospheric NO2
21120.9292015Total ozone trend
31110.8812010Community earth system model
41020.822018COVID-19 lockdown
5900.8862016Tropospheric ozone
6850.8812008Tropospheric emission spectrometer
7710.8922016Volatile organic compound
8660.922007Arctic winter
9600.9382019Ground-level ozone concentration
10570.942003Ozone hole breakup
11470.9642005Northern winter
12340.9822020Air quality
13300.9412006Iberian Peninsula
14270.9992007El Arenosillo
15200.9972001Ultraviolet multifilter
16180.9932011Water vapor
17170.9862004Montreal Protocol
18150.9872019Australian wildfire
19150.9992005Stratospheric chlorine partitioning

3.3.2. Author Co-Citation Analysis

The objective of author co-citation analysis is to identify frequently referenced researchers and examine the thematic coverage of their contributions in the domain of satellite ozone research. Based on the data presented in Figure 8, a merged network of co-citation among authors is constructed, comprising 1215 nodes and 7985 co-citation links. In this network, each node represents an individual author, while the links represent the co-citation relationships between them. It can be observed that the highest number of influential authors emerged in 2005, and there has been relatively little variation in the number of influential authors each year since then. At the same time, there has been a consistent and stable succession in the field of satellite ozone research from 2005 to 2023. Additionally, Table 5 also showcases the top 10 authors ranked by their co-citation frequency, centrality, and burst strength. For aspiring researchers interested in the field of satellite ozone studies, referring to Table 5 allows them to swiftly identify highly cited authors, key influential authors, and researchers involved in cutting-edge investigations. Consequently, they can selectively pursue continuous follow-up and attention.

3.3.3. Journal Co-Citation Analysis

In a manner akin to author co-citation analysis, the primary goal of journal co-citation analysis is to ascertain commonly cited journals and assess their thematic involvement in the realm of satellite ozone research. The construction of a consolidated network that captures co-citation interactions between journals, as illustrated in Figure 9, consists of 1412 nodes and 8827 links representing co-citation associations. Within this network, every individual journal is symbolized by a node, whereas the co-citation relationships between them are represented by the interconnected links. The results indicate that the early journals in the field of satellite ozone research have consistently established co-citation relationships with subsequent related journals. This phenomenon is particularly evident in the top nine clusters, which highlights the significant influence of milestone papers published in the early journals on the development of the satellite ozone research field. In order to enhance the clarity of the analysis findings, Table 6 presents the top 10 journals ranked by their co-citation frequency, centrality, and burst strength. Scholars, both those preparing for and those currently engaged in satellite ozone research, can find respective recommendations for highly cited journals, key influential journals, and cutting-edge hot topic journals in Table 6.

3.4. Keyword Co-Occurrence Analysis

In order to stay updated on the latest progress and foremost areas of research in the satellite ozone field, an analysis of keyword co-occurrence is carried out. The outcomes of this analysis are depicted in Table 7, showcasing a network of interconnected keywords comprising 732 nodes and 6139 links. In Table 7, the duration of keyword presence in the satellite ozone field is represented by bold lines, while the prominence or occurrence of keyword bursts is indicated by the use of red color. It can be observed that in the initial stage of satellite ozone research, the primary research hotspots are satellite ozone observation instruments (TOMS, GOME, EOS MLS, spectra) and satellite ozone observation experiments (the halogen occultation experiment, ozone monitoring experiment, polar vortex, vortex, transport). In recent years, the research hotspots in this field have significantly shifted towards atmospheric pollution and atmospheric environment (PM2.5, anthropogenic emissions, air quality, particulate matter, quality, air pollution). In particular, the keyword “air quality” has reached the highest burst strength value of 25.49, indicating that it is currently the most prominent research hotspot and an important future research trend in the field of satellite ozone.

4. Potential Future Research Directions

Significant strides have been made in exploring the realm of satellite ozone research over the past 18 years. As our understanding deepens, it is inevitable that novel avenues and methodologies will emerge. Thus, drawing upon the findings presented in Section 3, we outline the following directions that warrant exploration in future research.
(1)
Generally, the outbreak of pollution incidents originates from the anthropogenic emissions of various pollutants, which interact and react with each other under adverse meteorological conditions, and then transported within a regional scale, ultimately leading to the outbreak of ozone or particulate matter pollution [38,39,40]. Currently, air pollution has become not only a hot topic of concern for scientists, but also a global focal point for governments and international environmental organizations [41,42,43]. Satellite ozone observation has advantages, such as wide monitoring range and high spatiotemporal resolution, which can play an important role in clarifying pollutant transport fluxes, elucidating the source–sink mechanism of primary pollutants, determining the vertical structure of ozone formation controls, and formulating action plans for ozone and other pollutant control. Meanwhile, by combining satellite ozone observation with ground-based observation, it is possible to further establish a cross-regional vertical monitoring network and conduct research on the spatiotemporal variation patterns of ozone and its precursors, as well as the vertical structure of ozone formation sensitivity.
(2)
With the rapid development of meteorological satellite technology, an increasing number of atmospheric ozone detection instruments have been launched into space, providing high-precision, global, all-weather satellite ozone data. Representative satellite ozone detection instruments, such as the Total Ozone Mapping Spectrometer (TOMS), Global Ozone Monitoring Experiment (GOME), Ozone Monitoring Instrument (OMI), Atmospheric Infrared Sounder (AIRS), Infrared Atmospheric Sounding Interferometer (IASI), and Cross-track Infrared Sounder (CrIS) have greatly promoted the rapid development of satellite ozone research. In recent years, China has successively launched the Fengyun series of meteorological satellites, which are equipped with stable performance ozone detection instruments, such as the Total Ozone Unit (TOU) and Solar Backscatter Ultraviolet Sounder (SBUS) [44]. The observed products are accurate and reliable, and they have gradually been widely applied by scholars from various countries around the world. Correspondingly, as shown in Table 1, Table 3, Table 5 and Table 7, some Chinese scholars have already begun to demonstrate significant influence in the field of satellite ozone. In the future, it will be an important research direction to enhance the performance of satellite ozone detection instruments through active international cooperation, carry out cross-calibration of different satellite ozone detection instruments, optimize the inversion algorithms of satellite ozone data, and improve the accuracy of products.
(3)
Ozone is an important tracer gas in weather systems, and its concentration variations are closely linked to weather-scale fluctuations. By integrating ground-based station data, radiosonde data, and satellite ozone data, it is possible to study the impact of weather phenomena, such as the Antarctic polar vortex, Arctic polar vortex, and tropical cyclones on ozone distribution. With the continuous improvement of satellite spectral resolution, especially the development and application of high-spectral resolution ozone detection instruments in recent years, it has become possible to conduct fine-scale quantitative research on the relationship between some catastrophic weather phenomena (such as hurricanes) and the vertical distribution of atmospheric ozone. Some scholars have made preliminary attempts to assimilate satellite ozone data in numerical models, effectively improving the forecast accuracy of hurricane tracks and intensities [16,19,25,45,46,47]. The numerical application of satellite ozone data has demonstrated significant potential and will be a focus of future research.
(4)
Currently, multiple satellite platforms worldwide have accumulated various types of satellite ozone data with different spatiotemporal resolutions and time spans [33]. It is a highly challenging research task to correct and integrate multi-source satellite ozone data and establish a high-resolution, long-term atmospheric ozone dataset. Based on this dataset, the feasibility of climate research can be demonstrated, and the mutual relationships between atmospheric ozone and various climate phenomena can be studied, with particular emphasis on the Antarctic ozone hole and Arctic ozone depletion. Additionally, due to the unique geographical features of the Qinghai–Tibet Plateau, satellite data has become an important source of information for studying climate phenomena in this region [48,49,50]. However, current research mainly focuses on phenomenological analysis, and the analysis of mechanisms is not yet sufficiently in-depth. In future studies, the advantages of multi-source satellite ozone data should be fully utilized, and efforts should be made to strengthen mechanism analysis, further explaining the formation principles of low ozone values in the Qinghai–Tibet Plateau and their impacts.

5. Conclusions

The primary objective of this study is to investigate the present status and dynamic trends observed in the field of satellite ozone research during the period from 2005 to 2023. To achieve this, a comprehensive analysis utilizing scientometric methods, such as collaboration analysis, co-citation analysis, and keyword co-occurrence analysis is conducted. A dataset comprising 5320 bibliographic records from the WoS core collection database is analyzed to uncover and illustrate the underlying intellectual frameworks that shape the knowledge domain of satellite ozone over the past 18 years. Subsequently, this study further analyzes and discusses the future development directions in the field of satellite ozone research. In summary, the following can be discerned:
(1)
The study of satellite ozone is primarily led by the United States, Germany, France, and China, with active participation from their respective institutions and authors. Collaborative partnerships between the United States and European countries play a pivotal role in advancing research efforts in this field.
(2)
Twenty unique co-citation clusters have been identified, delineating the knowledge framework within the field of satellite ozone research. Both author co-citation analysis and journal co-citation analysis indicate that there has been a consistent and stable progression in the field of satellite ozone research from 2005 to 2023. In the initial stage of this research field, there are relatively more high-impact authors and milestone papers.
(3)
Over the past 18 years, the focus of research in the field of satellite ozone has shifted from initially emphasizing satellite ozone observation instruments and experiments to encompassing broader areas, such as atmospheric pollution and environmental conditions. Notably, the investigation of “air quality” has emerged as a prominent research area and a significant future trend within the realm of satellite ozone studies.
(4)
Based on the above analysis, this study proposes four major research directions for the field of satellite ozone: understanding the mechanisms of atmospheric pollution and developing key technologies for its prevention and control, enhancing the performance of spaceborne ozone detectors and improving inversion algorithms, utilizing satellite ozone data in weather phenomena, and applying satellite ozone data in climate phenomena.
In practical terms, this study aims to offer valuable assistance to scholars with a keen interest in satellite ozone research by providing a profound comprehension of its developmental trajectory. The results obtained from this study can serve as an effective handbook, enabling researchers to swiftly identify relevant target publications for quick referencing and appropriate journals for article submission. Additionally, policymakers can rely on this systematic review as a well-structured point of reference. However, there is still room for further improvements in this study. For instance, the reference list in this investigation comprises of scholarly articles obtained from the WoS core collection database, which undergo a rigorous peer-review process. While WoS represents a reputable source of studies, diversifying the data sources in future research endeavors could potentially contribute to more precise knowledge frameworks within the sphere of satellite ozone. Moreover, scientometric mapping is a data-driven and unbiased methodology for analyzing knowledge domains, with the goal of minimizing subjective biases. Nevertheless, the interpretation of mapping results necessitates the incorporation of expert insights and domain-specific knowledge. In future studies, it might be more rational to engage independent specialists to scrutinize the findings and their interpretation.

Funding

This research was funded by the Joint Research Project for Meteorological Capacity Improvement (22NLTSY009), the Key Scientific Research Projects of Jiangsu Provincial Meteorological Bureau (KZ202203), the fund of “Key Laboratory of Atmosphere Sounding, CMA” (2021KLAS01M), the Open Grants of the State Key Laboratory of Severe Weather (2020LASW-B11), and the Innovation and Development Project of China Meteorological Administration (CXFZ2023J022).

Data Availability Statement

The data are available upon reasonable request from the author of the paper.

Conflicts of Interest

The author declares no conflict of interest. The funders had no role in the design of the study; in the collection, analyses, or interpretation of data; in the writing of the manuscript; or in the decision to publish the results.

References

  1. Danielsen, E.F. Stratospheric-tropospheric exchange based on radio-activity, ozone, and potential vorticity. J. Atmos. Sci. 1968, 25, 502–518. [Google Scholar] [CrossRef]
  2. Carsey, T.P.; Willoughby, H.E. Ozone measurements from eyewall transects of two Atlantic tropical cyclones. Mon. Weather. Rev. 2005, 133, 166–174. [Google Scholar] [CrossRef]
  3. Jiang, X.; Pawson, S.; Camp, C.D.; Nielsen, J.E.; Shia, R.L.; Liao, T.; Limpasuvan, V.; Yung, Y.L. Interannual variability and trends of extratropical ozone. Part I: Northern Hemisphere. J. Atmos. Sci. 2008, 65, 3013–3029. [Google Scholar] [CrossRef] [Green Version]
  4. Normand, C. Atmospheric ozone and the upper-air conditions. Q. J. R. Meteorol. Soc. 1953, 79, 39–50. [Google Scholar] [CrossRef]
  5. Ohring, G.; Muench, H.S. Relationships between ozone and meteorological parameters in the lower stratosphere. J. Atmos. Sci. 1960, 17, 195–206. [Google Scholar] [CrossRef]
  6. Shapiro, M.A.; Krueger, A.J.; Kennedy, P.J. Nowcasting the position and intensity of jet streams using a satellite-borne total ozone mapping spectrometer. In Nowcasting; Browning, K., Ed.; Academic Press: Cambridge, MA, USA, 1982; pp. 137–145. [Google Scholar]
  7. Davis, C.; Low-Nam, S.; Shapiro, M.A.; Zou, X.; Krueger, A.J. Direct retrieval of wind from Total Ozone Mapping Spectrometer (TOMS) data: Examples from FASTEX. Q. J. R. Meteorol. Soc. 1999, 125, 3375–3391. [Google Scholar]
  8. Mateer, C.L.; Heath, D.F.; Krueger, A.J. Estimation of total ozone from satellite measurements of backscattered ultraviolet Earth radiance. J. Atmos. Sci. 1971, 28, 1307–1311. [Google Scholar] [CrossRef]
  9. Hoogen, R.; Rozanov, V.V.; Burrows, J.P. Ozone profiles from GOME satellite data: Algorithm description and first validation. J. Geophys. Res. 1999, 104, 8263–8280. [Google Scholar] [CrossRef]
  10. Aumann, H.H.; Chahine, M.T.; Gautier, C.; Goldberg, M.D.; Kalnay, E.; McMillin, L.M.; Revercomb, H.; Rosenkranz, P.W.; Smith, W.L.; Staelin, D.H.; et al. AIRS/AMSU/HSB on the Aqua mission: Design, science objectives, data products, and processing systems. IEEE Trans. Geosci. Remote Sens. 2003, 41, 253–264. [Google Scholar] [CrossRef] [Green Version]
  11. Pittman, J.V.; Pan, L.L.; Wei, J.C.; Irion, F.W.; Liu, X.; Maddy, E.S.; Barnet, C.D.; Chance, K.; Gao, R.-S. Evaluation of AIRS, IASI, and OMI ozone profile retrievals in the extratropical tropopause region using in situ aircraft measurements. J. Geophys. Res. 2009, 114, D24109. [Google Scholar] [CrossRef] [Green Version]
  12. Weisz, E.; Menzel, W.P.; Smith, N.; Frey, R.; Borbas, E.E.; Baum, B.A. An approach for improving cirrus cloud-top pressure/height estimation by merging high-spatial-resolution infrared-window imager data with high-spectral-resolution sounder data. J. Appl. Meteorol. Climatol. 2012, 51, 1477–1488. [Google Scholar] [CrossRef]
  13. Jang, K.I.; Zou, X.; De Pondeca, M.S.F.V.; Shapiro, M.; Davis, C.; Krueger, A. Incorporating TOMS ozone measurements into the prediction of the Washington, D.C., winter storm during 24–25 January 2000. J. Appl. Meteorol. 2003, 42, 797–812. [Google Scholar] [CrossRef]
  14. Bian, J.; Gettelman, A.; Chen, H.; Pan, L.L. Validation of satellite ozone profile retrievals using Beijing ozonesonde data. J. Geophys. Res. 2007, 112, D06305. [Google Scholar] [CrossRef] [Green Version]
  15. Monahan, K.P.; Pan, L.L.; McDonald, A.J.; Bodeker, G.E.; Wei, J.; George, S.E.; Barnet, C.D.; Maddy, E. Validation of AIRS v4 ozone profiles in the UTLS using ozonesondes from Lauder, NZ and Boulder, USA. J. Geophys. Res. 2007, 112, D17304. [Google Scholar] [CrossRef] [Green Version]
  16. Liu, Y.; Zou, X. Impact of 4DVAR assimilation of AIRS total column ozone observations on the simulation of Hurricane Earl. J. Meteorol. Res. 2015, 29, 257–271. [Google Scholar] [CrossRef]
  17. Rodgers, E.B.; Stout, J.; Steranka, J.; Chang, S. Tropical cyclone-upper atmospheric interaction as inferred from satellite total ozone observations. J. Appl. Meteorol. 1990, 29, 934–954. [Google Scholar] [CrossRef]
  18. Zou, X.; Wu, Y. On the relationship between Total Ozone Mapping Spectrometer (TOMS) ozone and hurricanes. J. Geophys. Res. 2005, 110, D06109. [Google Scholar] [CrossRef] [Green Version]
  19. Liu, Y.; Zhang, W. Improved hurricane forecasting from a variational bogus and ozone data assimilation (BODA) scheme: Case study. Meteorol. Atmos. Phys. 2016, 128, 715–732. [Google Scholar] [CrossRef]
  20. Liu, Y.; Zou, X. The development and application of satellite ozone data: A review. Acta Meteorol. Sin. 2016, 1, 1–17. (In Chinese) [Google Scholar]
  21. Zhao, S.; Yang, X.; Li, Z.; Wang, Z.; Zhang, Y.; Wang, Y.; Zhou, C.; Ma, P. Advances of ozone satellite remote sensing in 60 years. Natl. Remote Sens. Bull. 2022, 26, 817–833. (In Chinese) [Google Scholar] [CrossRef]
  22. Uccellini, L.W.; Keyser, D.; Brill, K.F.; Wash, C.H. The Presidents’ Day cyclone of 18–19 February 1979: Influence of upstream trough amplification and associated tropopause folding on rapid cyclogenesis. Mon. Weather. Rev. 1985, 113, 962–988. [Google Scholar] [CrossRef]
  23. Gabis, I.P. Quasi-biennial oscillation (QBO) of tropical total ozone under alternative QBO scenarios of equatorial stratospheric wind. Adv. Space Res. 2014, 54, 2499–2510. [Google Scholar] [CrossRef]
  24. Zhou, L.B.; Zou, H.; Ma, S.P.; Li, P. The Tibetan ozone low and its long-term variation during 1979–2010. Acta Meteorol. Sin. 2013, 27, 75–86. [Google Scholar] [CrossRef]
  25. Liu, Y.; Zou, X. Quality control of AIRS total column ozone data within tropical cyclones. Front. Earth Sci. 2016, 10, 222–235. [Google Scholar] [CrossRef]
  26. Nalimov, V.V.; Mul’chenko, Z.M. Measurement of Science. Study of the Development of Science as an Information Process; U.S. Air Force Systems Command, Foreign Technology Division: Virginia, CA, USA, 1971.
  27. van Eck, N.J.; Waltman, L. Software Survey: VOSviewer, a Computer Program for Bibliometric Mapping. Scientometrics 2010, 84, 523–538. [Google Scholar] [CrossRef] [Green Version]
  28. Garfield, E. From the Science of Science to Scientometrics Visualizing the History of Science with HistCite Software. J. Inf. 2009, 3, 173–179. [Google Scholar] [CrossRef] [Green Version]
  29. Chen, C.; Hu, Z.; Liu, S.; Tseng, H. Emerging Trends in Regenerative Medicine: A Scientometric Analysis in CiteSpace. Expert Opin. Biol. Ther. 2012, 12, 593–608. [Google Scholar] [CrossRef]
  30. Mingers, J.; Leydesdorff, L. A Review of Theory and Practice in Scientometrics. Eur. J. Oper. Res. 2015, 246, 1–19. [Google Scholar] [CrossRef] [Green Version]
  31. Chen, C. CiteSpace II: Detecting and Visualizing Emerging Trends and Transient Patterns in Scientific Literature. J. Am. Soc. Inf. Sci. Technol. 2006, 57, 359–377. [Google Scholar] [CrossRef] [Green Version]
  32. Chen, C.; Dubin, R.; Kim, M.C. Emerging Trends and New Developments in Regenerative Medicine: A Scientometric Update (2000–2014). Expert Opin. Biol. Ther. 2014, 14, 1295–1317. [Google Scholar] [CrossRef] [Green Version]
  33. Levelt, P.F.; Joiner, J.; Tamminen, J.; Veefkind, J.P.; Bhartia, P.K.; Zweers, D.C.S.; Duncan, B.N.; Streets, D.G.; Eskes, H.; Van Der A, R.; et al. The Ozone Monitoring Instrument: Overview of 14 years in space. Atmos. Chem. Phys. 2018, 18, 5699–5745. [Google Scholar]
  34. Fioletov, V.E.; McLinden, C.A.; Krotkov, N.; Li, C.; Joiner, J.; Theys, N.; Carn, S.; Moran, M.D. A global catalogue of large SO2 sources and emissions derived from the Ozone Monitoring Instrument. Atmos. Chem. Phys. 2016, 16, 11497–11519. [Google Scholar] [CrossRef] [Green Version]
  35. Martin, R.V.; Sauvage, B.; Folkins, I.; Sioris, C.E.; Boone, C.; Bernath, P.; Ziemke, J. Space-based constraints on the production of nitric oxide by lightning. J. Geophys. Res. 2007, 112, D9. [Google Scholar] [CrossRef] [Green Version]
  36. Levelt, P.F.; Hilsenrath, E.; Leppelmeier, G.W.; van den Oord, G.H.J.; Bhartia, P.K.; Tamminen, J.; De Haan, J.F.; Veefkind, J.P. Science objectives of the Ozone Monitoring Instrument. IEEE Trans. Geosci. Remote Sens. 2006, 44, 1199–1208. [Google Scholar] [CrossRef]
  37. Hersbach, H.; Bell, B.; Berrisford, P.; Hirahara, S.; Horányi, A.; Muñoz-Sabater, J.; Nicolas, J.; Peubey, C.; Radu, R.; Schepers, D.; et al. The ERA5 global reanalysis. Q. J. R. Meteorol. Soc. 2020, 146, 1999–2049. [Google Scholar] [CrossRef]
  38. Ouyang, H.L.; Tang, X.; Kumar, R.; Zhang, R.H.; Brasseur, G.; Churchill, B.; Alam, M.; Kan, H.D.; Liao, H.; Zhu, T. Toward better and healthier air quality: Implementation of WHO 2021 global air quality guidelines in Asia. Bull. Am. Meteorol. Soc. 2022, 103, 1696–1703. [Google Scholar] [CrossRef]
  39. Zhao, S.; Wang, Q.; Li, Y.; Liu, S.; Wang, Z.; Zhu, L.; Wang, Z. An overview of satellite remote sensing technology used in China’s environmental protection. Earth Sci. Inform. 2017, 10, 137–148. [Google Scholar] [CrossRef]
  40. Seftor, C.J.; Jaross, G.; Kowitt, M.; Haken, M.; Li, J.; Flynn, L. Postlaunch Performance of the Suomi National Polar Orbiting Partnership Ozone Mapping and Profiler Suite (OMPS) Nadir Sensors. J. Geophys. Res. Atmos. 2014, 119, 4413–4428. [Google Scholar] [CrossRef] [Green Version]
  41. Zhao, S.; Feng, H. Investigation of the 60-year relationship between energy consumption and environmental quality in China. Environ. Sci. Pollut. Res. 2022, 29, 14453–14468. [Google Scholar] [CrossRef]
  42. Wang, H.; Ding, K.; Huang, X.; Wang, W.; Ding, A. Insight into ozone profile climatology over northeast China from aircraft measurement and numerical simulation. Sci. Total Environ. 2021, 785, 147308. [Google Scholar] [CrossRef]
  43. Potdar, S.S.; Nade, D.P.; Pawar, R.P.; Victor, N.J.; Nikte, S.; Chavan, G.; Taori, A.; Siingh, D. Statistical analysis of total column ozone during three recent solar cycles over India. J. Atmos. Sol.-Terr. Phys. 2018, 181, 44–54. [Google Scholar] [CrossRef]
  44. Shi, Y.; Luo, Z.; Chen, X.; Zhang, Q.; Liu, Y.; Liu, C. Effects of joint assimilation of FY-4A AGRI and ground-based microwave radiometer on heavy rainfall prediction. Front. Environ. Sci. 2023, 11, 1083517. [Google Scholar] [CrossRef]
  45. Wu, Y.; Zou, X. Numerical test of a simple approach for using TOMS total ozone data in hurricane environment. Q. J. R. Meteorol. Soc. 2008, 134, 1397–1408. [Google Scholar] [CrossRef]
  46. Zhao, H.; Shu, Y.; Mao, Y.; Liu, Y.; Yu, K. The Assimilation Effect of Multi-New Types Observation Data in the Forecasts of Meiyu-Front Rainstorm. Atmosphere 2023, 14, 693. [Google Scholar] [CrossRef]
  47. Liu, Y. A Hurricane Initialization Scheme with 4DEnVAR Satellite Ozone and Bogus Data Assimilation (SOBDA) and Its Application: Case Study. Atmosphere 2023, 14, 866. [Google Scholar] [CrossRef]
  48. Ye, Z.J.; Xu, Y.F. Climate characteristics of ozone over Tibetan Plateau. J. Geophys. Res. 2003, 108, 4654. [Google Scholar] [CrossRef]
  49. Tian, W.S.; Chipperfield, M.; Huang, Q. Effects of the Tibetan Plateau on total column ozone distribution. Tellus B 2008, 60, 622–635. [Google Scholar] [CrossRef]
  50. Bian, J.C.; Yan, R.C.; Chen, H.B.; Lü, D.; Massie, S.T. Formation of the summertime ozone valley over the Tibetan Plateau: The Asian summer monsoon and air column variations. Adv. Atmos. Sci. 2011, 28, 1318–1325. [Google Scholar] [CrossRef]
Figure 1. Research framework.
Atmosphere 14 01245 g001
Figure 2. The yearly and cumulative publication counts in the realm of satellite ozone research.
Atmosphere 14 01245 g002
Figure 3. The WoS categories of 5320 publications in this study.
Atmosphere 14 01245 g003
Figure 4. Country collaboration network.
Atmosphere 14 01245 g004
Figure 5. Institution collaboration network.
Atmosphere 14 01245 g005
Figure 6. Author collaboration network.
Atmosphere 14 01245 g006
Figure 8. Author co-citation network: a timezone view.
Atmosphere 14 01245 g008
Figure 9. Journal co-citation network: a timeline view.
Atmosphere 14 01245 g009
Table 1. The top 10 countries in terms of publication count.
CountryPublicationsCentralityCountryPublicationsCentrality
USA25640.01Canada5530.01
Germany10370.03Netherlands4130.05
China8690.01India3760.01
France6290.26Belgium3490.03
England6020.03Russia3020.01
Table 2. The top 10 institutions in terms of publication count.
InstitutionPublicationsYearCountry
National Aeronautics and Space Administration (NASA)12642005USA
NASA Goddard Space Flight Center7042005USA
Helmholtz Association5462005Germany
Centre National de la Recherche Scientifique (CNRS)5332005France
California Institute of Technology4582005USA
National Oceanic Atmospheric Admin (NOAA)4552005USA
NASA Jet Propulsion Laboratory (JPL)4532005USA
National Center Atmospheric Research (NCAR)4462005USA
UDICE-French Research Universities4032005France
University System of Maryland3802005USA
Table 3. The top 10 authors in terms of publication count.
AuthorPublicationsCentralityYearAuthorPublicationsCentralityYear
Richter A.620.062005Burrows John P.450.012006
Burrows J. P.620.022006Walker K. A.440.032007
Froidevaux L.580.042006Kuznetsova I. N.410.012009
Ivanova N. S.500.012009Joiner Joanna390.012015
Liu Xiong480.022011Van roozendael M.380.022006
Table 5. The top 10 authors ranked by their co-citation frequency, centrality, and burst strength.
Co-Citation FrequencyCentralityBurst Strength
Levelt P. F. (918)Krotkov N. A. (0.06)Hersbach H. (54.95)
Solomon S. (801)Chin M. (0.05)Gelaro R. (49.38)
Boersma K. F. (633)Fioletov V. E. (0.05)Li K. (41.13)
Martin R. V. (581)Martin R. V. (0.05)Zheng B. (40.44)
Randel W. J. (517)Mclinden C. A. (0.05)Liu F. (40.01)
Burrows J. P. (490)Boersma K. F. (0.04)Lu X. (38.17)
Richter A. (483)Irie H. (0.04)Veefkind J. P. (37.52)
Duncan B. N. (463)Lamarque J. F. (0.04)Koelemeijer R. B. A. (36.61)
Bovensmann H. (463)Randel W. J. (0.04)Goldberg D. L. (35.94)
Krotkov N. A. (457)Shindell D. T. (0.04)Bauwens M. (33.32)
Table 6. The top 10 journals ranked by their co-citation frequency, centrality, and burst strength.
Co-Citation FrequencyCentralityBurst Strength
J. Geophys. Res.-Atmos. (4851)Global Planet Change (0.05)Remote Sens.-Basel (117.90)
Geophys. Res. Lett. (4249)Acta Astronaut. (0.05)Sci. Total Environ. (99.92)
Atmos. Chem. Phys. (4124)Arch. Environ. Health (0.04)Atmosphere-Basel (92.19)
Atmos. Environ. (2556)AIP Conf. Proc. (0.04)Appl. Optics (82.05)
J. Atmos. Sci. (2283)Biogeochemistry (0.03)J. Atmos. Sci. (76.53)
Science (2274)Chem. Rev. (0.03)Sci. Rep.-UK (73.09)
Nature (2216)Deep-Sea Res. Pt. I (0.03)Environ. Pollut. (60.42)
Atmos. Meas. Tech. (2055)Ambio (0.03)Earth Syst. Sci. Data (58.28)
IEEE T. Geosci. Remote (1993)Epidemiology (0.03)Sci. Adv. (48.71)
B. Am. Meteorol. Soc. (1575)Chem. Geol. (0.03)J. Geophys. Res. (45.99)
Table 7. The top 25 keywords with the strongest citation bursts.
KeywordsYearStrengthBeginEnd2005–2023
TOMS200517.5120052012▃ ▃ ▃ ▃ ▃ ▃ ▃ ▃ ▂ ▂ ▂ ▂ ▂ ▂ ▂ ▂ ▂ ▂ ▂
Halogen occultation experiment200515.4420052009▃ ▃ ▃ ▃ ▃ ▂ ▂ ▂ ▂ ▂ ▂ ▂ ▂ ▂ ▂ ▂ ▂ ▂ ▂ 
Profiles200515.0320052008▃ ▃ ▃ ▃ ▂ ▂ ▂ ▂ ▂ ▂ ▂ ▂ ▂ ▂ ▂ ▂ ▂ ▂ ▂ 
Ozone monitoring experiment200513.8920052009▃ ▃ ▃ ▃ ▃ ▂ ▂ ▂ ▂ ▂ ▂ ▂ ▂ ▂ ▂ ▂ ▂ ▂ ▂ 
Winter200513.2420052012▃ ▃ ▃ ▃ ▃ ▃ ▃ ▃ ▂ ▂ ▂ ▂ ▂ ▂ ▂ ▂ ▂ ▂ ▂ 
Polar vortex200511.9620052011▃ ▃ ▃ ▃ ▃ ▃ ▃ ▂ ▂ ▂ ▂ ▂ ▂ ▂ ▂ ▂ ▂ ▂ ▂ 
Spectra200511.2720052008▃ ▃ ▃ ▃ ▂ ▂ ▂ ▂ ▂ ▂ ▂ ▂ ▂ ▂ ▂ ▂ ▂ ▂ ▂ 
Vortex200510.9920052007▃ ▃ ▃ ▂ ▂ ▂ ▂ ▂ ▂ ▂ ▂ ▂ ▂ ▂ ▂ ▂ ▂ ▂ ▂ 
EOS MLS200615.4920062012▂ ▃ ▃ ▃ ▃ ▃ ▃ ▃ ▂ ▂ ▂ ▂ ▂ ▂ ▂ ▂ ▂ ▂ ▂ 
Art200614.120062008▂ ▃ ▃ ▃ ▂ ▂ ▂ ▂ ▂ ▂ ▂ ▂ ▂ ▂ ▂ ▂ ▂ ▂ ▂ 
GOME200521.9520072011 ▂ ▂ ▃ ▃ ▃ ▃ ▃ ▂ ▂ ▂ ▂ ▂ ▂ ▂ ▂ ▂ ▂ ▂ ▂ 
Transport200511.2320092010▂ ▂ ▂ ▂ ▃ ▃ ▂ ▂ ▂ ▂ ▂ ▂ ▂ ▂ ▂ ▂ ▂ ▂ ▂ 
Tropospheric nitrogen dioxide200810.7420152019▂ ▂ ▂ ▂ ▂ ▂ ▂ ▂ ▂ ▂ ▃ ▃ ▃ ▃ ▃ ▂ ▂ ▂ ▂ 
PM2.5201718.2820192023▂ ▂ ▂ ▂ ▂ ▂ ▂ ▂ ▂ ▂ ▂ ▂ ▂ ▂ ▃ ▃ ▃ ▃ ▃ 
Anthropogenic emissions201516.5420192023▂ ▂ ▂ ▂ ▂ ▂ ▂ ▂ ▂ ▂ ▂ ▂ ▂ ▂ ▃ ▃ ▃ ▃ ▃ 
Exposure201313.0720192023▂ ▂ ▂ ▂ ▂ ▂ ▂ ▂ ▂ ▂ ▂ ▂ ▂ ▂ ▃ ▃ ▃ ▃ ▃ 
Impacts201412.0520192023▂ ▂ ▂ ▂ ▂ ▂ ▂ ▂ ▂ ▂ ▂ ▂ ▂ ▂ ▃ ▃ ▃ ▃ ▃ 
Air quality200525.4920202023▂ ▂ ▂ ▂ ▂ ▂ ▂ ▂ ▂ ▂ ▂ ▂ ▂ ▂ ▂ ▃ ▃ ▃ ▃ 
TROPOMI202017.8820202023▂ ▂ ▂ ▂ ▂ ▂ ▂ ▂ ▂ ▂ ▂ ▂ ▂ ▂ ▂ ▃ ▃ ▃ ▃ 
Particulate matter200917.3920202023▂ ▂ ▂ ▂ ▂ ▂ ▂ ▂ ▂ ▂ ▂ ▂ ▂ ▂ ▂ ▃ ▃ ▃ ▃ 
Sentinel 5 Precursor202014.1320202023▂ ▂ ▂ ▂ ▂ ▂ ▂ ▂ ▂ ▂ ▂ ▂ ▂ ▂ ▂ ▃ ▃ ▃ ▃ 
Quality200911.9220202021▂ ▂ ▂ ▂ ▂ ▂ ▂ ▂ ▂ ▂ ▂ ▂ ▂ ▂ ▂ ▃ ▃ ▂ ▂ 
China200711.8320202023▂ ▂ ▂ ▂ ▂ ▂ ▂ ▂ ▂ ▂ ▂ ▂ ▂ ▂ ▂ ▃ ▃ ▃ ▃ 
Air pollution200517.8320212023▂ ▂ ▂ ▂ ▂ ▂ ▂ ▂ ▂ ▂ ▂ ▂ ▂ ▂ ▂ ▂ ▃ ▃ ▃ 
Resolution201211.9420212023▂ ▂ ▂ ▂ ▂ ▂ ▂ ▂ ▂ ▂ ▂ ▂ ▂ ▂ ▂ ▂ ▃ ▃ ▃ 
Disclaimer/Publisher’s Note: The statements, opinions and data contained in all publications are solely those of the individual author(s) and contributor(s) and not of MDPI and/or the editor(s). MDPI and/or the editor(s) disclaim responsibility for any injury to people or property resulting from any ideas, methods, instructions or products referred to in the content.

