Article

Chinese Provincial Air Pollutant Concentration Prediction over the Long Term

1
School of Management Engineering and Business, Hebei University of Engineering, Handan 056038, China
2
School of Marxism, Hebei University of Engineering, Handan 056038, China
*
Author to whom correspondence should be addressed.
Atmosphere 2023, 14(8), 1211; https://doi.org/10.3390/atmos14081211
Submission received: 8 June 2023 / Revised: 16 July 2023 / Accepted: 24 July 2023 / Published: 27 July 2023
(This article belongs to the Section Air Quality)

Abstract

:
Although China’s urban air quality has improved, there are still many cities that do not meet China’s ambient air quality standards and experience serious air pollution problems, causing tremendous damage to people’s health and sustainable social development. For the sake of obtaining the specific time when China’s ambient air quality will reach the standard, the annual mean air pollutant concentrations of 27 Chinese provinces are predicted and analyzed. Based on original data from air pollutant concentrations in 27 Chinese provinces from 2017 to 2021, a gray prediction model with fractional order accumulation is established to analyze and predict the concentration of pollutants in 27 provinces. The applicability of the model is then validated by mean absolute percentage error values. According to the forecast results, by 2026, the concentrations of six pollutants, PM2.5, PM10, SO2, NO2, CO, and O3, will all meet Class II air quality standards in 25 Chinese provinces, namely Beijing, Chongqing, Shanghai, Hebei, Jiangsu, Shanxi, Zhejiang, Liaoning, Anhui, Jilin, Fujian, Heilongjiang, Jiangxi, Hubei, Qinghai, Hunan, Guangdong, Hainan, Guangxi, Guizhou, Shaanxi, Gansu, Yunnan, Inner Mongolia, and Xinjiang (corrected for the effect of sandstorms). Tianjin, Sichuan, and Xinjiang (not corrected for the effect of sandstorms) still exceed the standard in the annual mean concentration of PM2.5, NO2, and PM10, respectively. Sichuan and Tianjin are, respectively, expected to meet Class II air quality standards in 2027 and 2030, and Xinjiang (not corrected for the effect of sandstorms) is expected to fail to meet Class II standards in the next 15 years. Finally, the current situation with respect to China’s ambient air quality in 27 Chinese provinces is analyzed, and corresponding suggestions are put forward to offer an explicit direction for relevant departments.

1. Introduction

In recent years, with the continuous acceleration of the industrialization process in China, the air quality on which people depend has been seriously damaged. Problems with air quality have seriously affected people’s travel [1] and also endangered people’s health [2,3,4]. Reducing air pollutants in the environment has become a crucial issue in China, and an important part of improving air quality is to predict and analyze air quality [5]. Prediction of air pollutant concentrations is a vital task in the process of air pollution control.
China has realized many remarkable achievements in air quality in recent years. In the prediction research of air quality, the prophet forecasting model was used to predict air pollutant concentrations in Jiangsu Province [6]. A deep learning model was used to forecast PM2.5 and O3 concentrations [7]. A machine learning model was employed to predict the air quality in six megacities in China [8]. Air quality is also affected by population, energy prices [9] and socioeconomic factors [10], and it is necessary to study the main impact of air quality from multiple perspectives in China [11]. In addition to China, other developing countries also have corresponding air pollution problems, such as India, Iran, Colombia, and so on. Air pollution affects the health of people. It has been investigated in major cities in India [12]. In Bogotá, air pollution has also aroused national and public concern, with PM10 and PM2.5 the most serious air pollutant factors in this city [13]. Systems and methods of studying air quality have gradually been developed, including a brand-new regression imputation framework [14], a comprehensive artificial neural network model [15], the NEMO model [16], and the Air Pollution Index (API) system [17].
The aforementioned research mainly focuses on the prediction of air quality in a single province and does not involve the study of multiple provinces or regions. Additionally, the prediction of air pollutant concentrations mainly focuses on PM2.5, PM10, and O3. There is rarely any analysis or prediction involving all six pollutants at the same time: PM2.5, PM10, NO2, SO2, O3, and CO. There is a lack of predictions that consider the influence of multiple provinces and multiple indicators. And there is little research on air quality prediction in the Xinjiang region under the influence of sandstorms. Therefore, in order to fill the research gap, which very few people have considered, in terms of predicting multiple air pollutant concentrations for multiple provinces, and simultaneously predicting PM2.5 and PM10 concentrations in Xinjiang under the influence of sandstorms, this study predicts the concentration values and development trends for six main air quality indicators in 27 provinces of China for the next five years. These six indicators include PM2.5, PM10, SO2, NO2, CO, and O3. Since the concentrations of PM2.5 and PM10 in Xinjiang are greatly affected by sandstorms, research has been carried out on the prediction and analysis of the concentration of particulate matter in the air in Xinjiang (whether corrected for the effect of sandstorms or not).
Due to the lack of annual data, a statistical model is not suitable. Therefore, in this study, a high-precision FGM(1,1) model [18] was used to predict concentration values and development trends for six main air quality indicators in 27 provinces of China for the next five years. First, this study investigated air quality in 27 provinces and regions in China and analyzed six main pollutant factors in the air. Air pollutant concentration data from 2017 to 2021 were collected from the Environmental Quality Status Bulletin of the Department of Ecology and Environment of each province. Then, using the FGM(1,1) model to predict the six air quality indicators in 27 provinces and regions in China from 2022 to 2026, the results clearly show the pollution degree and future pollution development trend in these regions. Finally, some reasonable and effective suggestions are put forward according to the predicted results.

2. Models and Methods

2.1. Study Provinces Overview

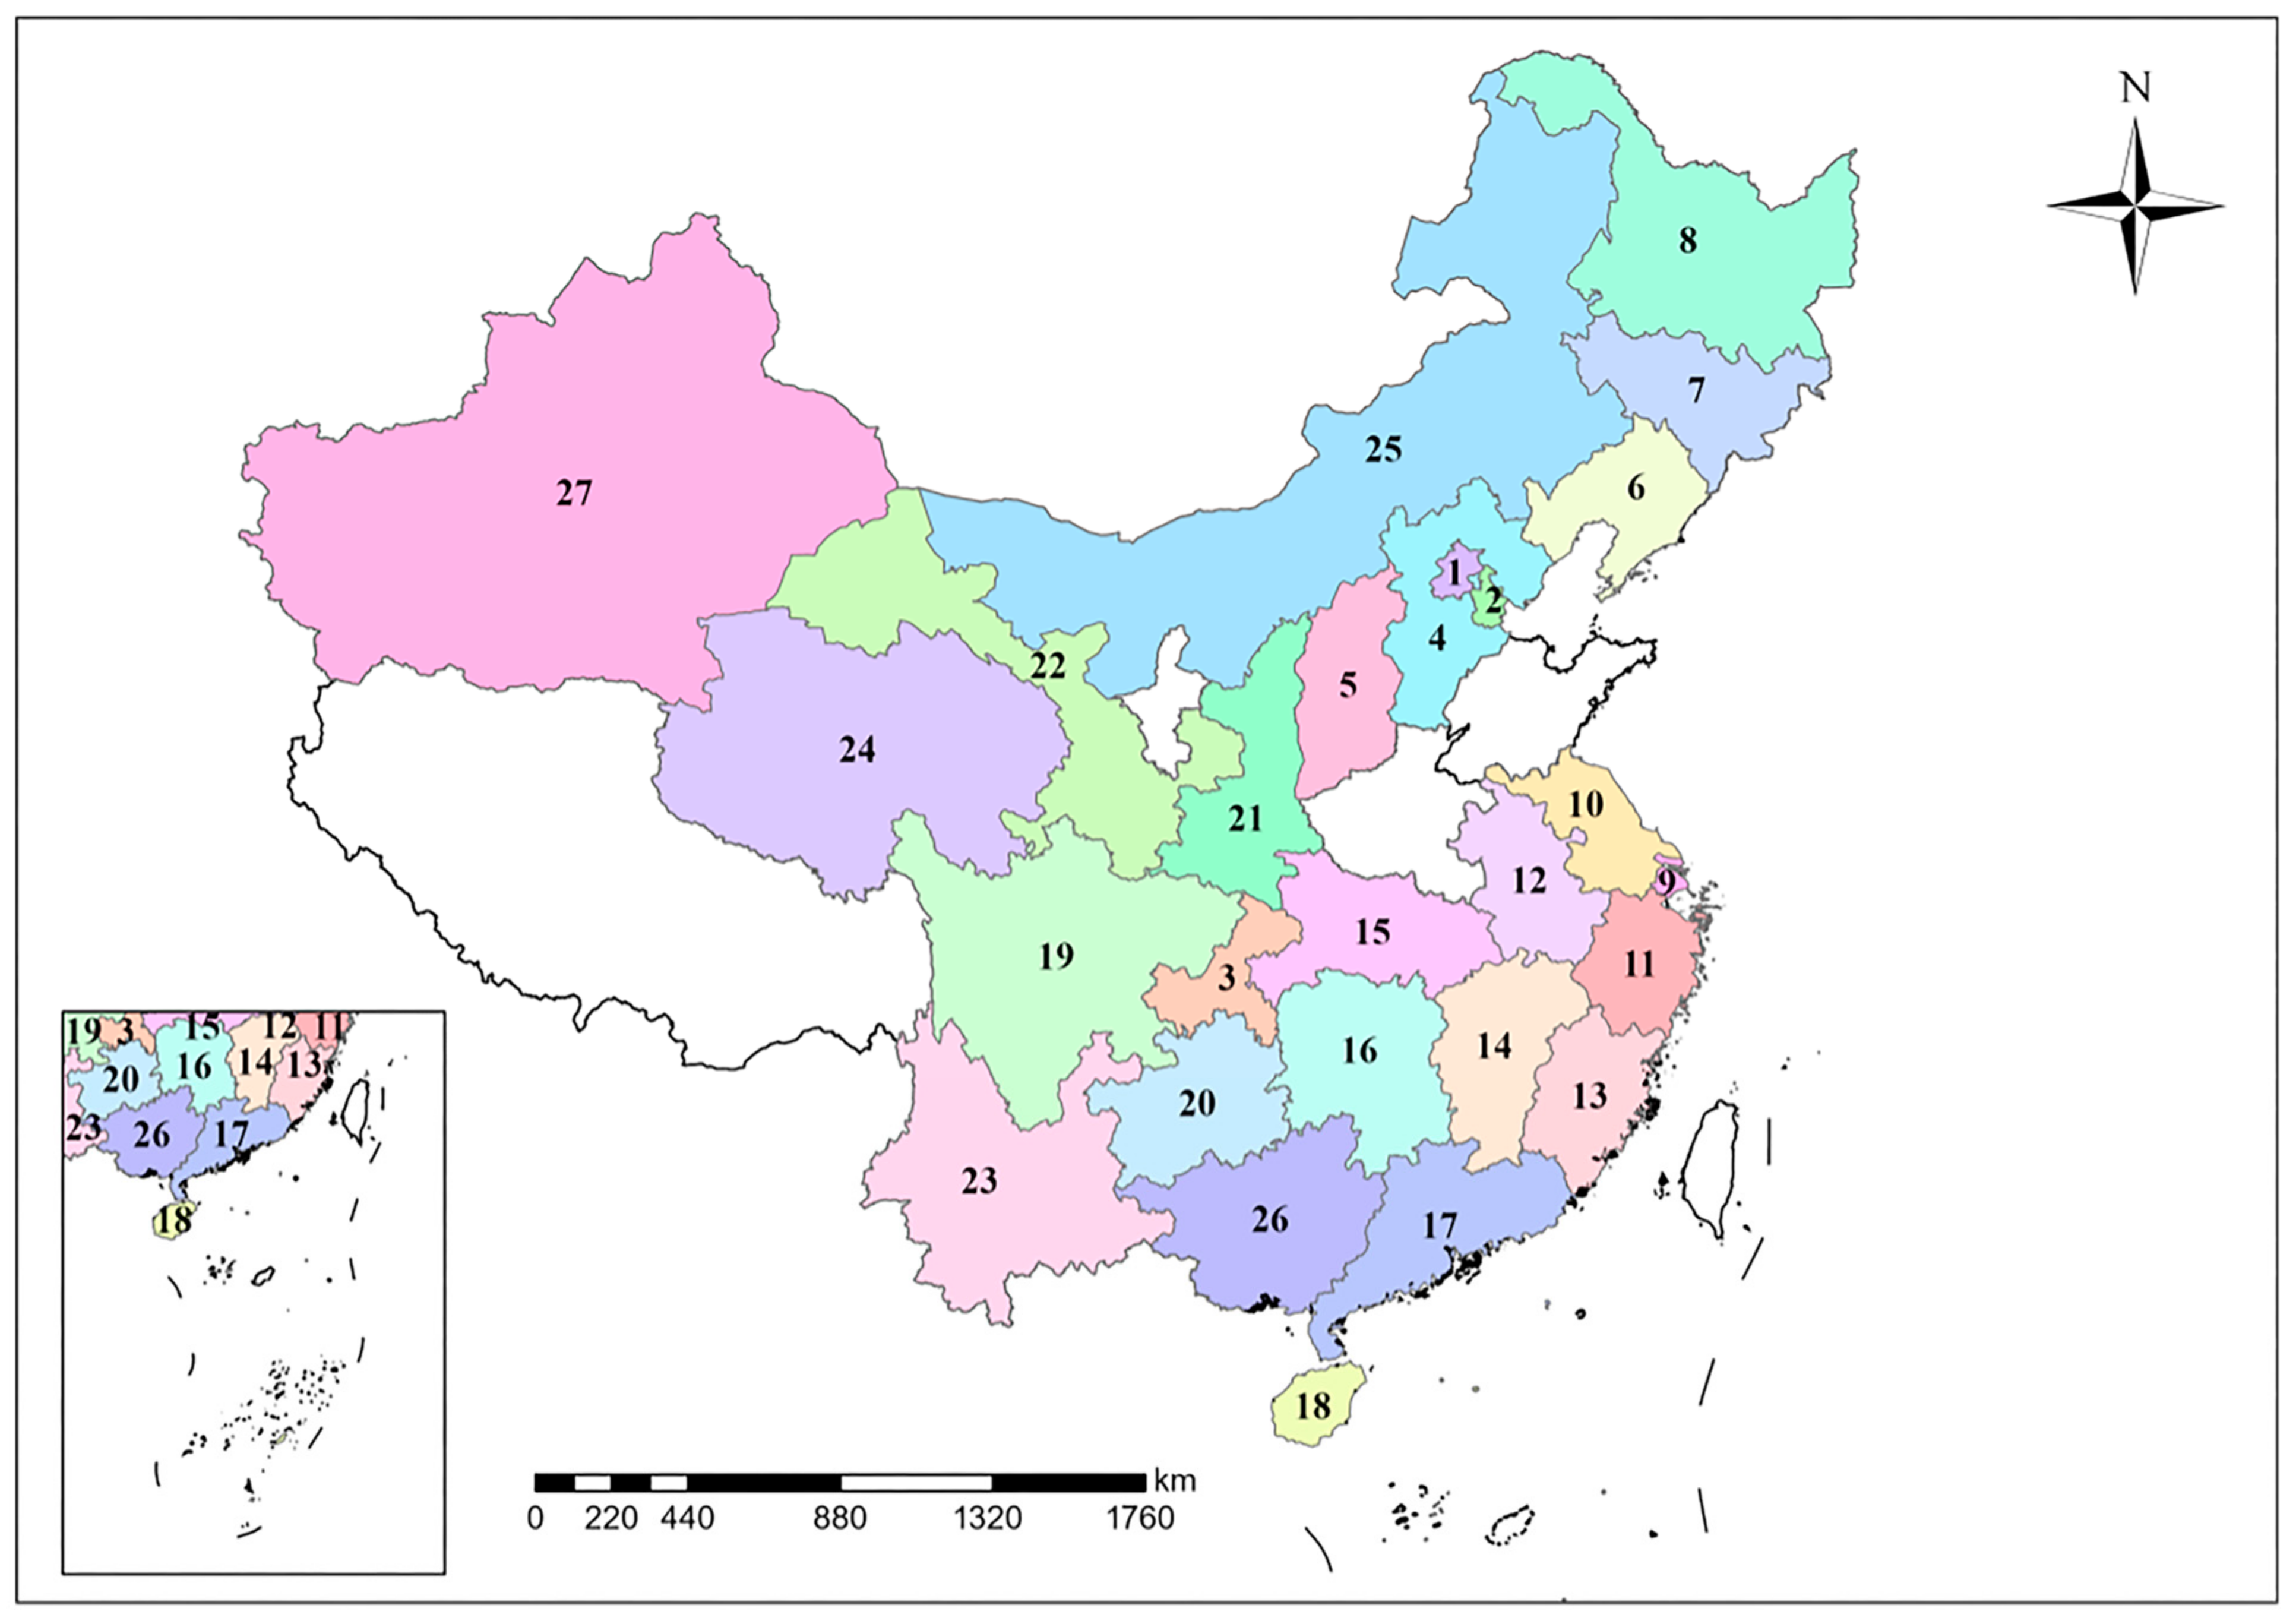
In this paper, twenty Chinese provinces are studied: Hebei, Shanxi, Liaoning, Jilin, Heilongjiang, Jiangsu, Zhejiang, Anhui, Fujian, Jiangxi, Hubei, Hunan, Guangdong, Hainan, Sichuan, Guizhou, Shaanxi, Gansu, Yunnan, and Qinghai. There are three autonomous regions, namely Guangxi Zhuang Autonomous Region, Inner Mongolia Autonomous Region, and Xinjiang Uygur Autonomous Region. And there are four municipalities directly under the Central Government, namely Beijing, Tianjin, Shanghai, and Chongqing. These provinces, municipalities and autonomous regions are hereinafter referred to as provinces. Among them, the blank areas with boundary lines on the map are territories of China. Due to an inability to obtain all the data, only 27 provinces and regions of China were studied. The Chinese provinces and regions that were not studied in this paper were not filled with color. These provinces are distributed in 27 different regions; their respective geographical locations are shown in Figure 1, and the provinces represented by the geographical location numbers are shown in Table 1.

2.2. Data Sources

In this paper, air pollutant concentration data from 2017 to 2021 were collected from the Environmental Quality Status Bulletin of the Department of Ecology and Environment of each province. Since the data from other provinces were not available, only the annual data for 6 major air pollutants in 27 provinces were obtained; therefore, only the concentrations of air pollutants in these 27 provinces were studied. Due to the limited data samples, the gray forecasting theory was considered for prediction. On this basis, the fractional accumulative gray forecast model (FGM(1,1)) was used to forecast the primary pollutants in 27 Chinese provinces from 2022 to 2026. The problems caused by air pollution have attracted much attention in recent years, as well as concentrations of different pollutants adopting China’s ambient air quality standards [19].

2.3. Model Application

In this study, the gray system model with fractional order accumulation (FGM(1,1)) [20] was used to forecast the annual mean concentration of PM2.5, SO2, NO2, PM10, CO (the 95th percentile of the daily mean concentrations), and O3 (the 90th percentile of the daily maximum 8 h moving average) of the six major air pollution indicators in 27 Chinese provinces from 2022 to 2026, and mean absolute percentage error (MAPE) was used to assess the accuracy of model fit [21]. The order of the fractional gray model is adjusted to predict the future data for each pollutant, and then the forecast data for six major pollution indicators of air quality in 27 provinces and regions from 2022 to 2026 are obtained.
Taking the air pollutant concentration data for Anhui Province as an example, the FGM(1,1) model was established to predict the annual mean concentration of fine particulate matter (PM2.5) in Anhui Province from 2022 to 2026, based on data from 2017 to 2021.
(1) The annual mean PM2.5 concentration from 2017 to 2021 is
X ( 0 ) = { 56 , 49 , 46 , 39 , 35 }
(2) The 0.6 order accumulation sequence is
X ( 0.6 ) = { x ( 0.6 ) ( 1 ) , x ( 0.6 ) ( 2 ) , x ( 0.6 ) ( 3 ) , x ( 0.6 ) ( 4 ) , x ( 0.6 ) ( 5 ) }   = { 56.0 , 82.6 , 102.3 , 113.4 , 121.8 }
(3) The parameters a ^ ,   b ^ can be computed by the following equation:
a ^ b ^ = ( B T B ) 1 B T Y = 0.3901 54.2241
where
B = 69.3000 1 92.4400 1 107.8480 1 117.6232 1 , Y = 26.6000 19.6800 11.1360 8.4144
(4) Next,
x ^ ( 0.6 ) ( k + 1 ) = 56 54.2241 0.3901 e 0.3901 k + 54.2241 0.3901
We can obtain
X ^ ( 0.6 ) = { x ^ ( 0.6 ) ( 1 ) , x ^ ( 0.6 ) ( 2 ) , , x ^ ( 0.6 ) ( 10 ) } = { 56.0 , 82.8 , 101.0 , 113.2 , 121.6 , 127.2 , 131.0 , 133.6 , 135.3 , 136.5 }
(5) Therefore,
X ^ ( 1 ) = { x ^ ( 0.6 ) ( 0.4 ) ( 1 ) , x ^ ( 0.6 ) ( 0.4 ) ( 2 ) , , x ^ ( 0.6 ) ( 0.4 ) ( 10 ) } = { 56.0 , 105.2 , 149.8 , 189.4 , 224.3 , 255.3 , 282.8 , 307.5 , 329.8 , 350.2 }
The sequence is
X ^ ( 0 ) = { x ^ ( 0 ) ( 1 ) , x ^ ( 0 ) ( 2 ) , , x ^ ( 0 ) ( 10 ) } = { 56.0 , 49.2 , 44.6 , 39.6 , 35.0 , 31.0 , 27.5 , 24.7 , 22.3 , 20.4 }
The fitting results of the PM2.5 air pollutant concentration data for Anhui Province are shown in Table 2. Based on MATLAB R2018A, the particle swarm optimization algorithm can obtain the optimal result of the FGM(1,1) and traditional gray model (GM(1,1)) [22] prediction.
According to Table 2, it can be concluded that the prediction accuracy of the FGM(1,1) model is better than that of the GM(1,1) model. Therefore, the application of the FGM(1,1) model to predict the concentration of PM2.5 in Anhui Province from 2022 to 2026 has a good effect. The predicted results for PM2.5 in Anhui Province are shown in Table 3.
In order to further verify the validity of the FGM(1,1) prediction results, pollutant concentrations from 2017 to 2020 are used as sample data. The concentrations of the six main pollutants in Anhui Province in 2021 are predicted, and the predicted results are compared with the actual values in 2021, as shown in Table 4.
According to Table 4, the MAPE values for the FGM(1,1) prediction results are all less than 10%, so the FGM(1,1) can better predict the annual mean concentration of the six pollutants in Anhui Province.

3. Prediction and Analysis of Atmospheric Pollutant Concentrations

In this section, we first predict the annual mean concentrations of typical atmospheric pollutants for each of the 27 provinces. Next, we analyze the main causes for the generation of these pollutants, and mitigation measures are proposed. Finally, we summarize the provinces where air quality shows an improvement trend and the provinces where air quality has not yet met the standards, while also analyzing the causes of these phenomena and proposing mitigation measures. In this study, the prediction of air pollutant concentrations for 27 provinces will only focus on provinces that show an upward trend in the future and cities where the air pollutant concentrations do not meet China’s second-level standards. Specific analysis will be conducted, and corresponding recommendations will be proposed for the relevant government departments to refer to. For provinces where the air pollutant concentrations show a downward trend, only future development trends will be provided as a reference. No specific analysis or recommendations will be made in this paper.

3.1. Prediction and Analysis of Annual Mean PM2.5 Concentration

Particulate matter (PM2.5) with a diameter of less than 2.5 microns has the ability to float in the air for extended periods of time and be carried by the wind over extended distances. When inhaled into the lungs, PM2.5 can cause harm to the body [23,24]. PM2.5 limits sustainable economic development, which has caused widespread concern [25,26]. To control PM2.5, it is necessary to understand its main sources. PM2.5 can be divided into natural sources and anthropogenic sources. Natural sources mainly include airborne dust, volcanic ash, and forest fires. Anthropogenic sources mainly include pollution from fuel combustion, industrial raw material production, and vehicle power fuel combustion [27]. Therefore, predicting future PM2.5 concentrations in urban air is a necessary step in developing appropriate protective measures.
The PM2.5 concentrations in the 27 provinces over the 2017–2021 period and the fitting error values, calculated as mean absolute percentage error (MAPE) values, are shown in Table 5. Because no official data were available for Xinjiang (corrected for the effect of sandstorms) in 2018, the mean of the annual mean PM2.5 concentrations for 2017 and 2019 was taken as the annual mean PM2.5 concentration for 2018. Next, the FGM(1,1) model was used to predict the PM2.5 concentrations for the 27 provinces from 2022 to 2026, and the predicted results are shown in Table 6.
As shown in Table 5, the MAPE values for the annual mean PM2.5 concentration in the 27 provinces over the 2017–2021 period are below 10%. These values include Xinjiang under two conditions—not corrected for the effect of sandstorms and corrected for the effect of sandstorms. According to the evaluation criteria, these data indicated that the FGM(1,1) model fit the PM2.5 annual mean concentration data for the 27 provinces well.
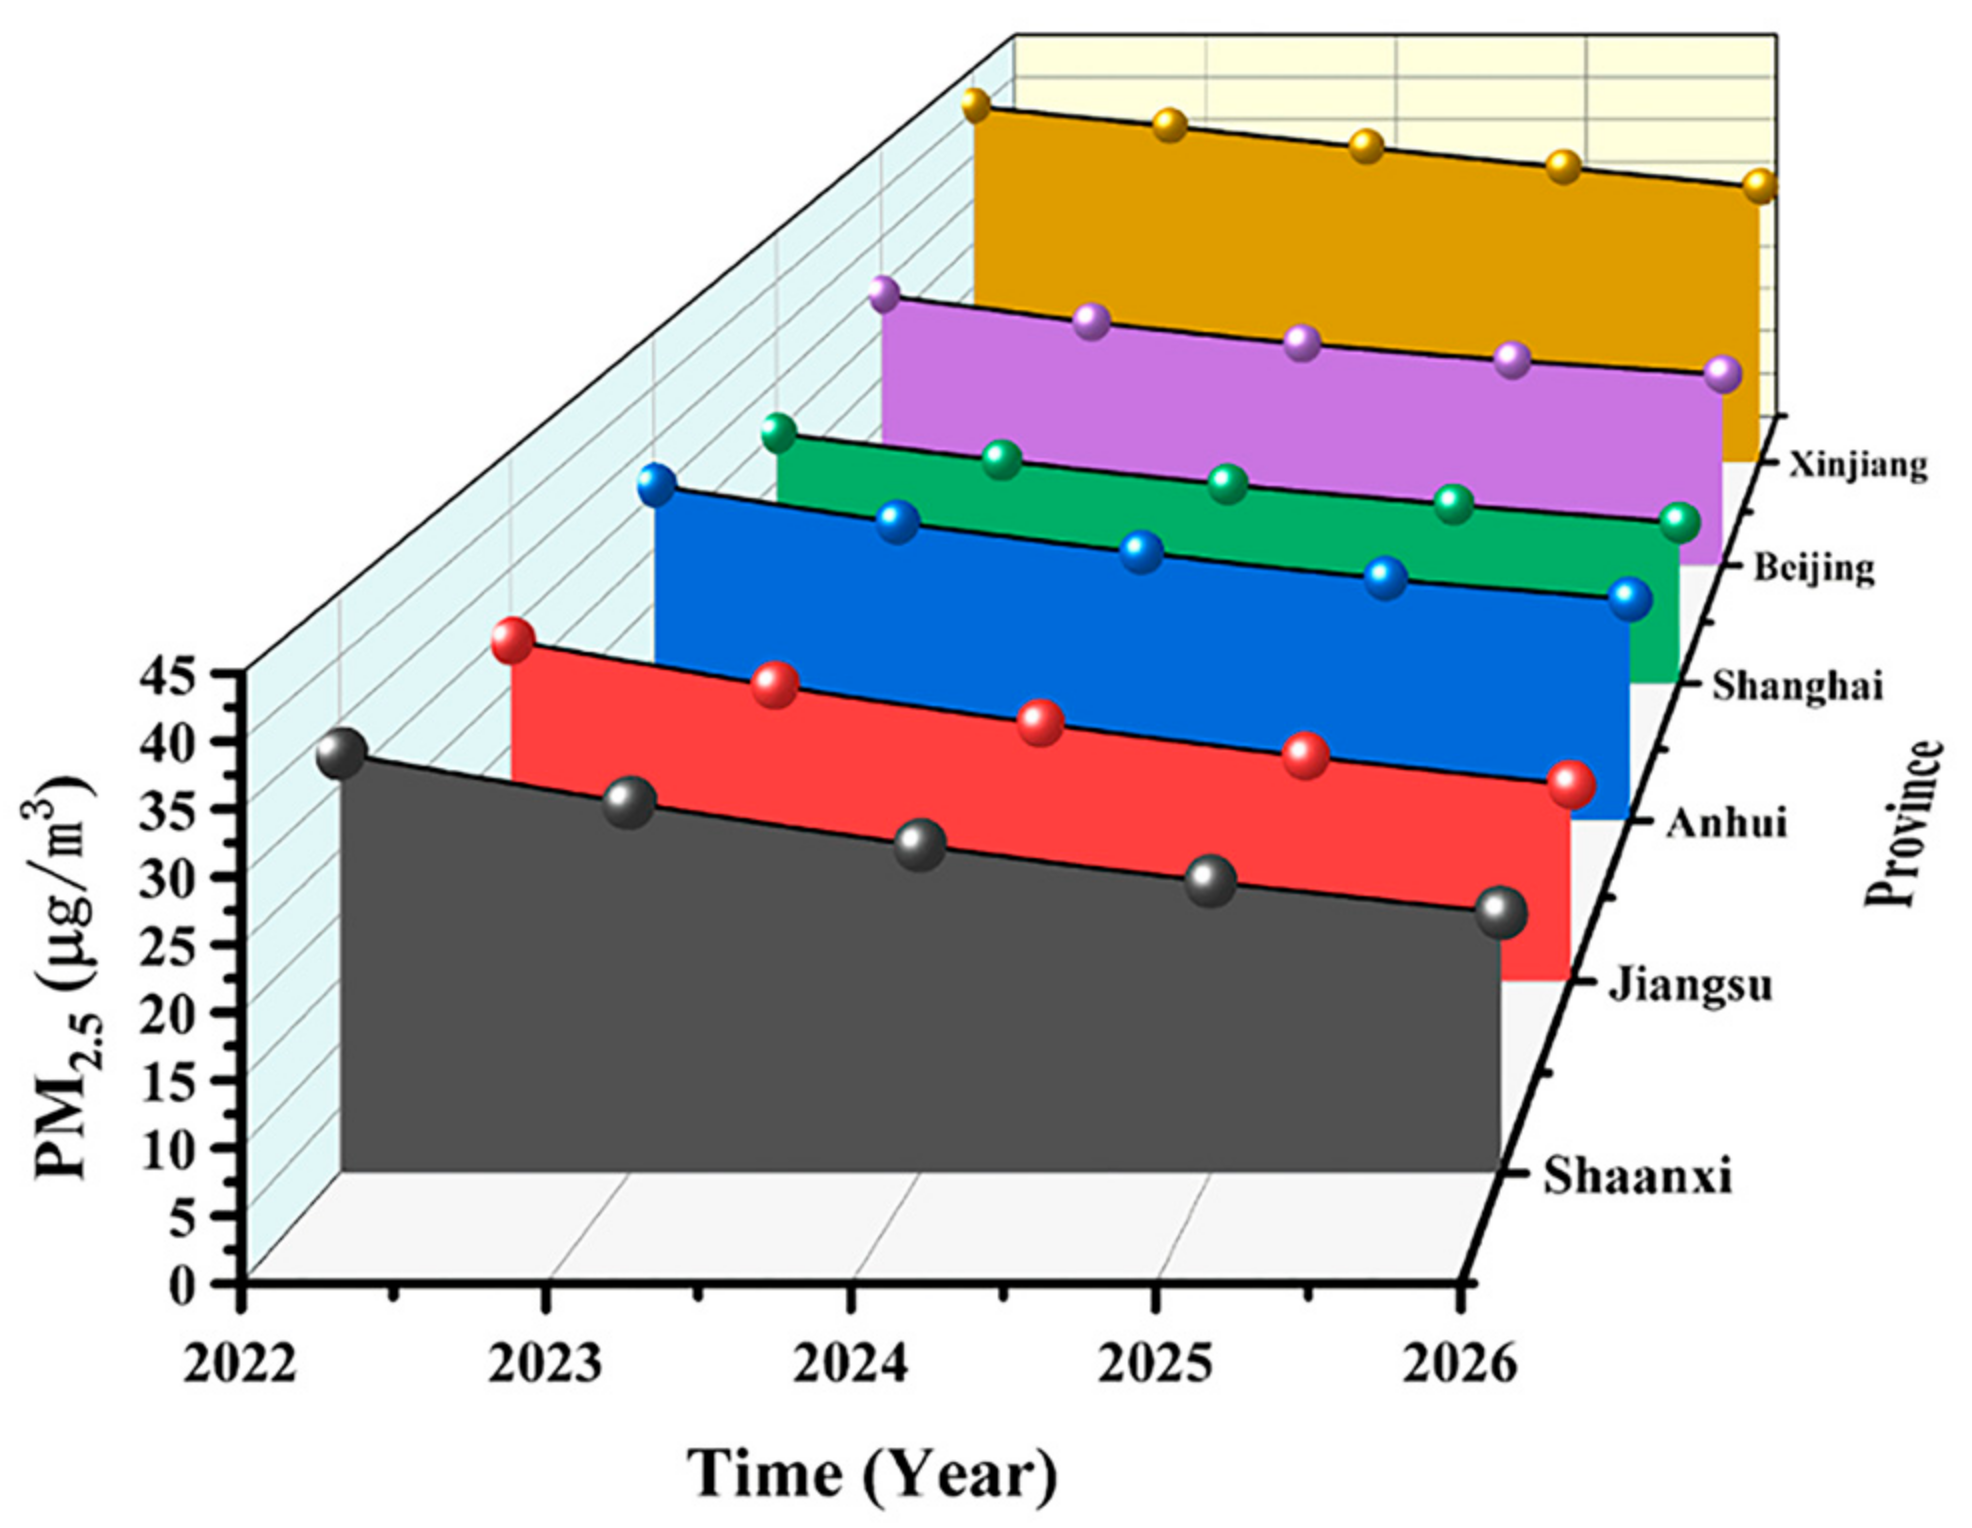
As shown in Table 6, the PM2.5 concentrations in the 27 provinces all show a decreasing trend, with Shanxi Province showing the most obvious decrease, followed by Jiangsu, Anhui, Xinjiang (not corrected for the effect of sandstorms), Shanghai, and Beijing. The annual mean PM2.5 concentrations in Shanxi, Jiangsu, Anhui, Xinjiang, Shanghai, and Beijing are projected to decrease to 20.2, 16.7, 20.4, 31.5, 16, and 20.4 µg/m3 by 2026, respectively. The decreasing trends of these six provinces are shown in Figure 2. It is projected that by 2026, the province with the lowest annual mean PM2.5 concentration will be Sichuan at 6.2 µg/m3, and the province with the highest annual mean PM2.5 concentration will be Tianjin at 37.4 µg/m3. According to China’s ambient air quality standards, the annual mean PM2.5 concentration should be ≤15 µg/m3 for Class I air quality and ≤35 µg/m3 for Class II air quality. It is projected that by 2026, among the 27 provinces, only Tianjin will not reach the threshold concentration of 35 µg/m3 for Class II air quality, and the other 26 provinces, including Xinjiang (whether corrected for the effect of sandstorms or not), will reach the threshold concentration of Class II air quality. In particular, four of these provinces, namely Hunan, Sichuan, Guizhou, and Qinghai, will have annual mean PM2.5 concentrations of 9.9, 6.2, 6.6, and 11.8 µg/m3, respectively, all of which are below the threshold concentration for Class I air quality.
The PM2.5 concentrations in the four provinces of Shanxi, Hebei, Tianjin, and Xinjiang (not corrected for the effect of sandstorms) are projected to drop to 27.3, 31.8, 37.4, and 31.5 µg/m3 by 2026, respectively, indicating significant improvements. Among these provinces, Shanxi, Hebei, and Xinjiang (not corrected for the effect of sandstorms), in particular, have a clear downward trend, where the annual mean PM2.5 concentrations are projected to decrease from 35.5 µg/m3, 37.9 µg/m3, and 40.7 µg/m3 in 2022, respectively, to 27.3 µg/m3, 31.8 µg/m3, and 31.5 µg/m3 in 2026, respectively. It is projected that the annual mean PM2.5 concentrations in Shanxi, Hebei, and Xinjiang (not corrected for the effect of sandstorms) will drop to 32.7 µg/m3 in 2023, 34.3 µg/m3 in 2024, and 33.7 µg/m3 in 2025, all of which are below the threshold concentration of 35 µg/m3 for Class II air quality, indicating significant improvements in air quality.
For Tianjin, the annual mean PM2.5 concentration is projected to reach 37.4 µg/m3 in 2026, which will still exceed the threshold concentration for Class II air quality. The projected trends of the annual mean PM2.5 concentration in the four provinces of Xinjiang (not corrected for the effect of sandstorms), Shanxi, Hebei, and Tianjin are shown in Figure 3.
Only one of the 27 provinces, Tianjin, is not projected to meet Class II air quality by 2026. Therefore, the government of Tianjin should not relax its environmental preventive measures and should strengthen the management of ambient air quality. Without tighter controls, air pollution will easily rebound to higher levels and become more severe, which will worsen air quality.
The primary cause of PM2.5 pollution in Xinjiang (not corrected for the effect of sandstorms) is sandstorms. The high annual mean PM2.5 concentration in Shanxi is mainly attributed to the fact that Shanxi is a large coal resource province, where the production of coal raw materials (including their digging and transportation) leads to the emission of coal dust into the air, while the incomplete combustion of coal also contributes to the generation of PM2.5. The high annual mean PM2.5 concentration in Hebei is mainly attributed to the fact that Hebei is a province that contains heavy industry, is rich in mineral resources, and is high in energy consumption. For Tianjin, the high annual mean PM2.5 concentration is mainly due to high annual mean concentrations of volatile organic compounds (VOCs) and nitrogen oxides emitted by traffic in the urban area of Tianjin and the particulate matter generated by the chemical transformation of sulfur dioxide emitted by the surrounding industrial production. In short, while transportation brings convenience, it has also generated pollution. Booming industry has led to the consumption of a lot of fossil fuels and the emission of polluting gases into the air, which are the primary reasons for the increase in atmospheric PM2.5 concentrations [28,29].
In order to control the increase in PM2.5 concentrations in the future, the government should adopt two methods to address both natural and man-made sources of the problem. In terms of natural sources, forests should be protected to prevent wildfires, and afforestation should be promoted to control the occurrence of sandstorms. At the same time, corresponding urban air humidification facilities should be installed to prevent dust from flying. This can not only improve air quality but also protect people’s health. In terms of man-made sources, environmental education should be conducted regularly to raise people’s awareness of environmental protection. People should be encouraged to use low-carbon and environmentally friendly modes of transportation. The supervision and management of factories should be strengthened, and emission standards should be established. Factories that fail to meet the emission standards should be punished. With the efforts of various departments and the general public, future PM2.5 concentrations will be significantly reduced.
A series of mitigation measures have been taken, as mentioned above. The effectiveness of these measures has been verified to some extent. The government, society, and the public are all making efforts to improve air quality. However, further research and monitoring are still needed to evaluate the effectiveness of these measures and to continuously improve and adjust strategies to respond to new challenges.
In conclusion, in order to reduce the increase in PM2.5 concentration, the government should comprehensively consider both natural and man-made factors and take effective measures to reduce pollutant emissions. This requires extensive cooperation and joint efforts, including environmental protection education, regulatory measures, and technological innovation. Through continuous efforts, we can expect a significant reduction in future PM2.5 concentrations.
The other five pollutant concentrations are PM10, SO2, NO2, CO, and O3. To predict the annual mean concentrations of the five pollutants in each of the 27 provinces, the same calculation method will be adopted for prediction.

3.2. Prediction and Analysis of Annual Mean PM10 Concentration

PM10 is remarkably similar in nature to PM2.5. PM10 is respirable particulate matter with a particle size between 2.5 microns and 10 microns and can be inhaled into the lungs to cause damage, including organ lesions and many diseases in the human body. Burning straw and garbage in the open air, as well as abnormal emissions from construction dust and road dust, will all generate a large amount of particulate matter and pollutants. When dispersion conditions are unfavorable, the pollution becomes more severe. This is the main source of PM10 [30]. Therefore, it is also exceedingly necessary to control the concentrations of PM10.
The annual mean PM10 concentrations in the 27 provinces over the 2017–2021 period and the MAPE values are shown in Table 7. Because no official data were available for Xinjiang (corrected for the effect of sandstorms) in 2018, the mean of the annual mean PM10 concentrations for 2017 and 2019 was taken as the annual mean PM10 concentration for 2018. Next, the FGM(1,1) model was used to predict the PM10 concentrations in the 27 provinces over the 2022–2026 period (Table 8).
As shown in Table 7, the MAPE values for the annual mean PM10 concentration in the 27 provinces, including Xinjiang (whether corrected for the effect of sandstorms or not), over the 2017–2021 period fluctuate are below 10% and fluctuate around 3%. According to the evaluation criteria, these data indicated that the FGM(1,1) model fit the annual mean PM10 concentrations in the 27 provinces well.
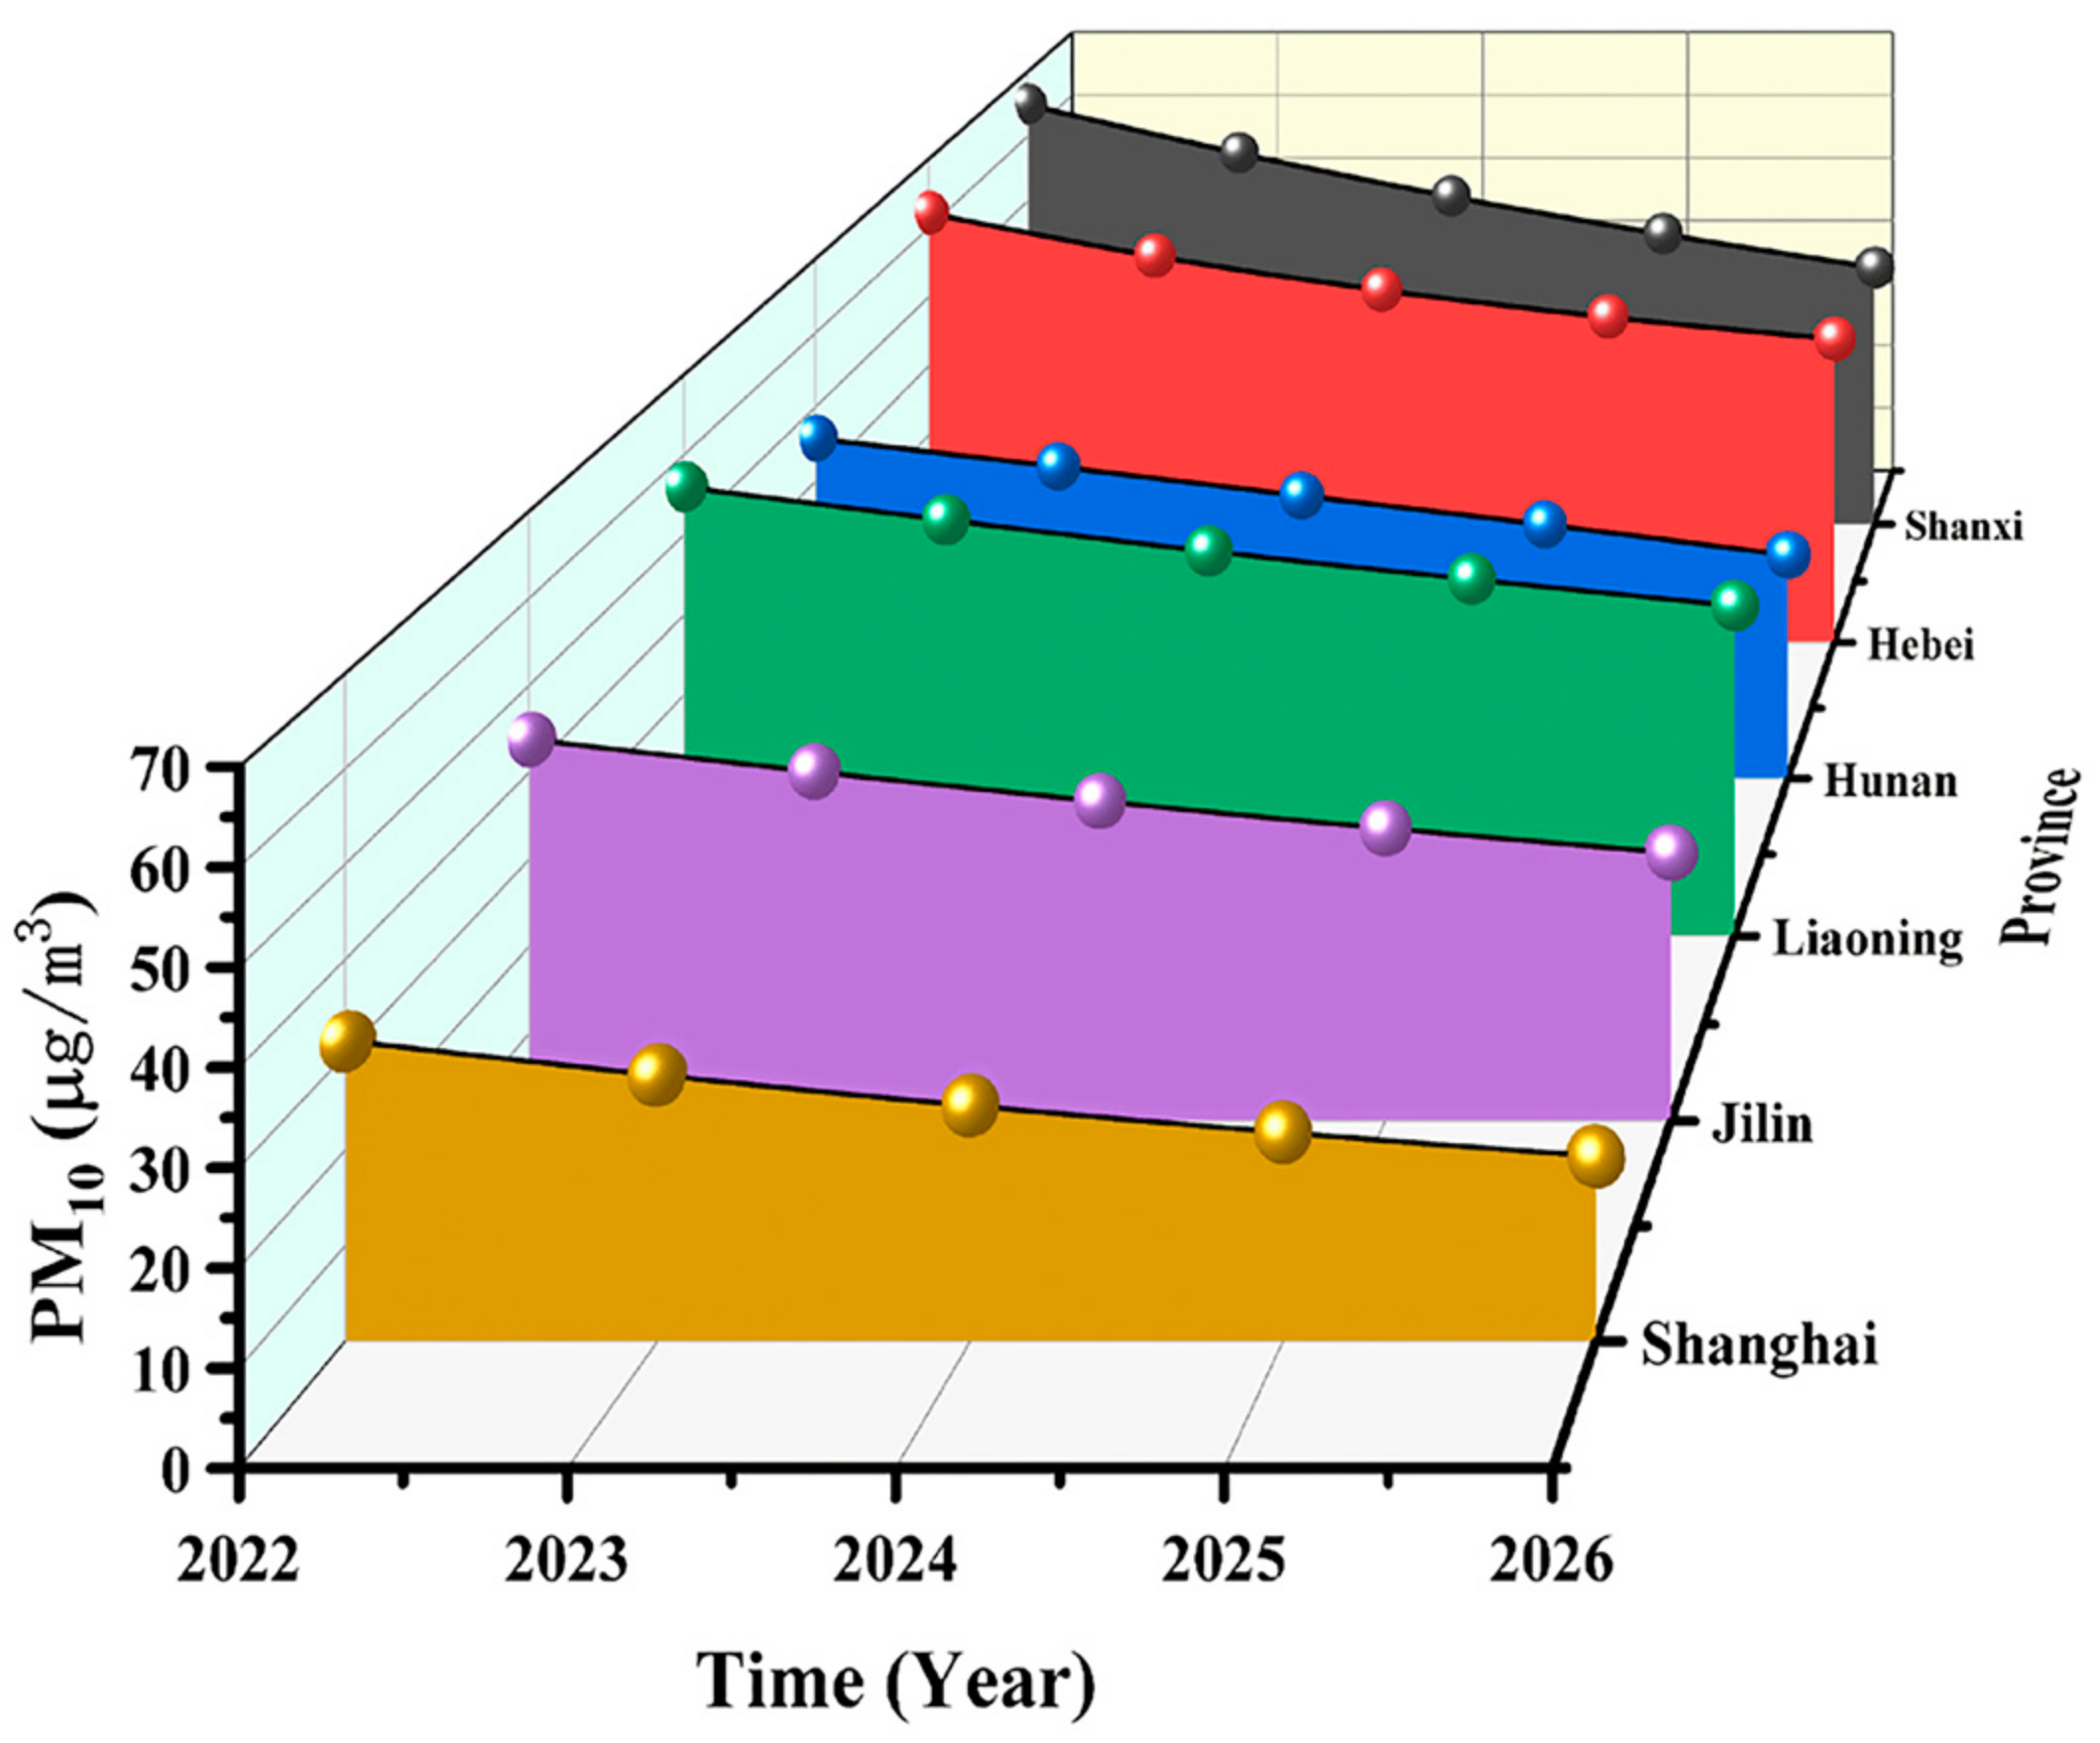
As shown in Table 8, all 27 provinces show a decreasing trend in the annual mean concentration of PM10. Among them, Shanxi Province has the most obvious decreasing trend, followed by Hebei, Hunan, Liaoning, Jilin, and Shanghai. It is projected that by 2026, the annual mean PM10 concentrations in Shanxi, Hebei, Hunan, Liaoning, Jilin, and Shanghai will be 39.7, 43.9, 30.1, 41.2, 30.8, and 19.4 µg/m3, respectively. The trends of the annual mean PM10 concentration in these six provinces are shown in Figure 4. The province with the lowest annual mean PM10 concentration is Hainan, with 17.3 µg/m3, while the province with the highest annual mean PM10 concentration is Xinjiang, with 114.3 µg/m3 (not corrected for the effect of sandstorms). According to China’s ambient air quality standards, the annual mean concentration of PM10 should be ≤40 µg/m3 for Class I air quality and ≤70 µg/m3 for Class II air quality. Of the 27 provinces, it is projected that only Xinjiang (not corrected for the effect of sandstorms) will fail to reach the Class II threshold concentration of 70 µg/m3 by 2026, while the other 26 provinces will all reach the Class II level of air quality standards. However, none of the provinces will be able to reach the Class I threshold concentration by 2026, so PM10 emissions control measures should remain stringent.
The trend of the PM10 annual mean concentration in Xinjiang (not corrected for the effect of sandstorms) is shown in Figure 5. From 2022 to 2026, its PM10 annual mean concentration shows a decreasing trend, from 119.6 µg/m3 in 2022 to 114.3 µg/m3 in 2026.
In Xinjiang, air pollution is mainly caused by dust storms. Every spring, strong winds, combined with ample sources of sand, dry air, and an unstable atmosphere, provide favorable conditions for the generation of sandstorms. The destruction of natural vegetation, overgrazing of pastures, excessive deforestation of the surrounding forests, insufficient water resources, droughts, and insufficient local resources to carry excessive numbers of people all jointly contribute to the generation of dust storms [31].
The measures taken by the Xinjiang government for environmental protection should be strictly maintained, with particular emphasis on controlling sandstorms. Sandstorm control is a challenging and time-consuming task, and considering the current technological level, we are unable to change atmospheric circulation and other natural factors. Firstly, it is recommended that the Xinjiang government strengthen environmental protection and control population growth to reduce environmental pressure. This includes measures to protect the environment, limit resource consumption, and promote sustainable development. Secondly, it is suggested that the government promote an increase in surface vegetation coverage, especially improving forest protection, stopping overgrazing, and preventing excessive development activities that damage natural vegetation. These measures can increase the absorption capacity of vegetation, reduce soil erosion, and improve air quality. In addition, it is recommended that the government establish and improve dynamic monitoring and early warning systems, conduct scientific research on sandstorms, and engage in disaster prevention and control. These measures can provide early warning of sandstorms, take appropriate measures to reduce their harm, and promote relevant scientific research to enhance understanding of disaster prevention. By implementing these measures, the government may effectively reduce the damage caused by sandstorms and make positive contributions to improving environmental conditions. However, further evaluation and monitoring of the effectiveness of these measures are needed to ensure their effectiveness and to make adjustments and improvements as necessary.

3.3. Prediction and Analysis of Annual Mean SO2 Concentration

Atmospheric SO2 is particularly harmful and is prone to forming sulfite when inhaled into the human respiratory tract, where sulfite harms the respiratory system [32]. This pollutant also causes acid rain, damages buildings, and pollutes drinking water. In addition, SO2 mainly comes from fixed sources such as coal combustion and industrial production [33]. Therefore, it is necessary to control atmospheric SO2 concentrations from such sources.
First, the annual mean SO2 concentration data for the 27 provinces over the 2017–2021 period and the MAPE values are shown in Table 9. The FGM(1,1) model was used to predict the SO2 concentrations in the 27 provinces over the 2022–2026 period (Table 10).
As shown in Table 9, the MAPE values for the annual mean SO2 concentration in the 27 provinces over the 2017–2021 period are below 10% and mostly fluctuate around 5%. According to the evaluation criteria, these data indicated that the FGM(1,1) model fit the annual mean SO2 concentrations in the 27 provinces well.
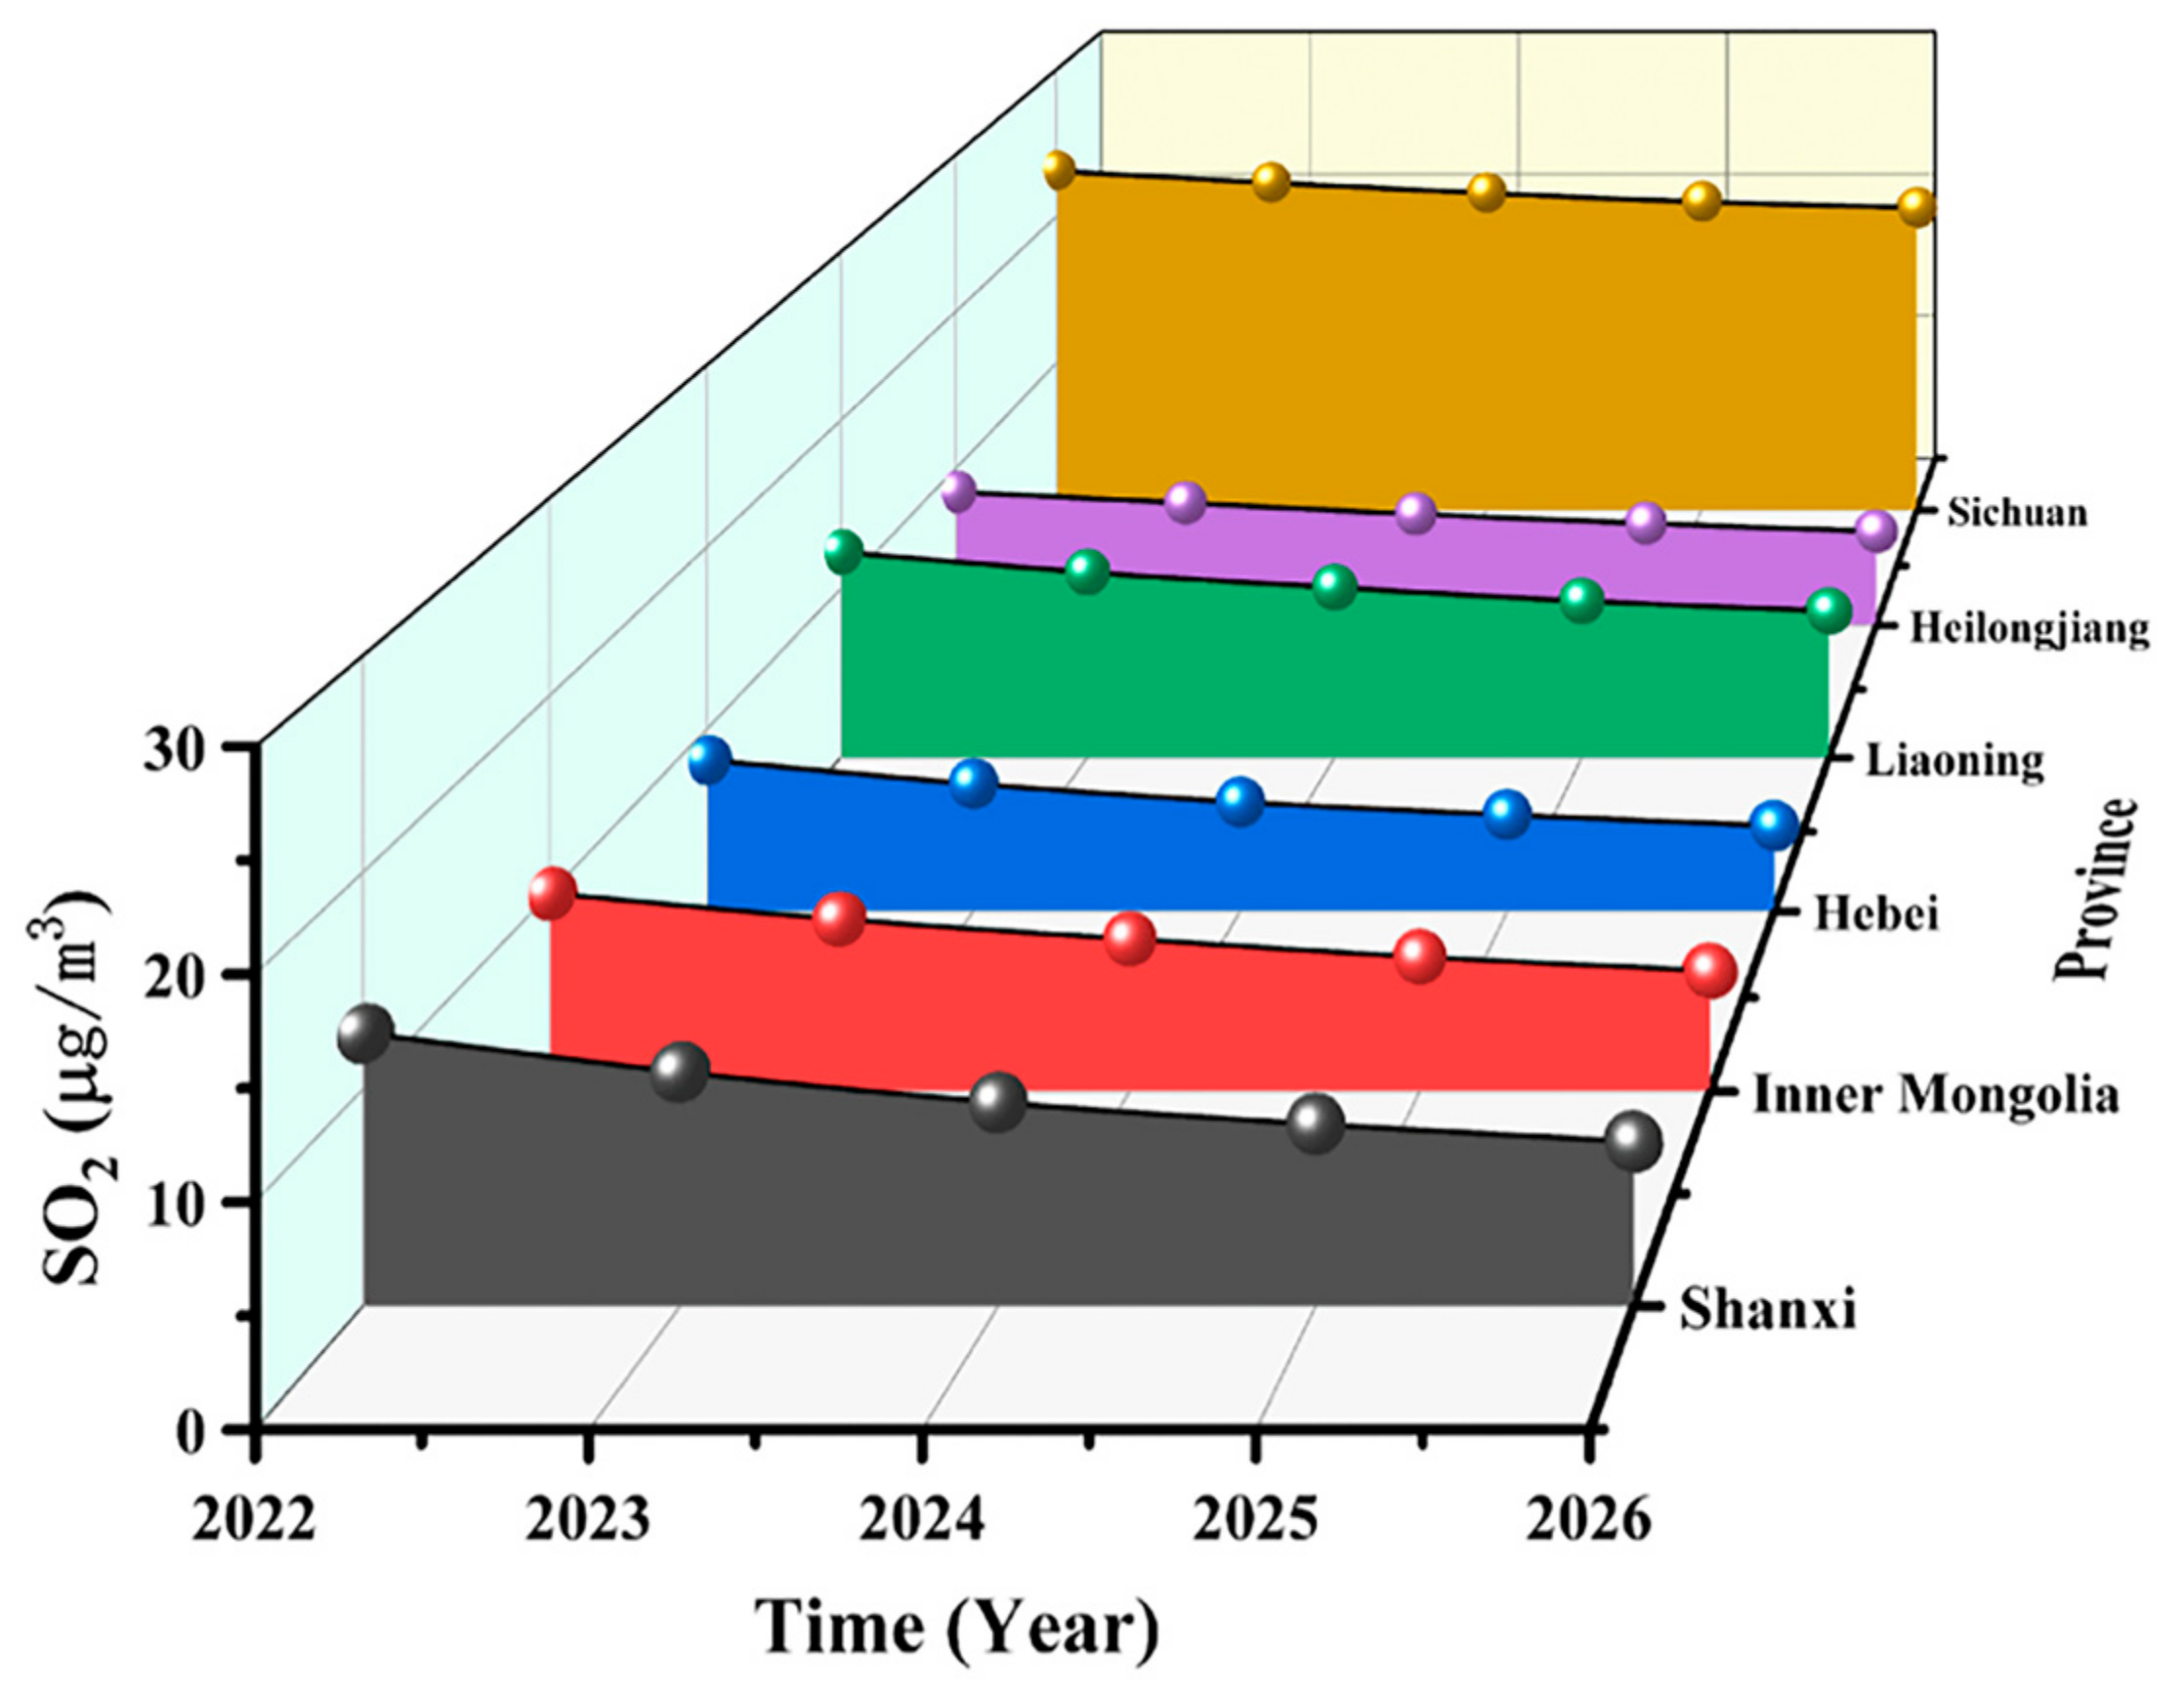
As shown in Table 10, except for Chongqing, where the annual mean SO2 concentration showed an increasing trend, 26 provinces showed a decreasing trend in the annual mean SO2 concentration. Among them, the six provinces with the most obvious decreasing trend were Shanxi, Inner Mongolia, Hebei, Liaoning, Heilongjiang, and Sichuan. The decreasing trends of the annual mean SO2 concentration in these six provinces are shown in Figure 6. By 2026, the annual mean SO2 concentrations in Shanxi, Inner Mongolia, Hebei, Liaoning, Heilongjiang, and Sichuan will decrease to 7.6, 6.1, 4.7, 8.7, 6.0, and 20.6 µg/m3, respectively. It is projected that by 2026, among these 26 provinces, Sichuan will have the highest annual mean SO2 concentration of 20.6 µg/m3 and Beijing will have the lowest annual mean SO2 concentration of 1.7 µg/m3. The annual mean SO2 concentration in China’s ambient air quality standard should be ≤20 µg/m3 for Class I air quality and ≤60 µg/m3 for Class II air quality. It is evident that by 2026, the annual mean SO2 concentration will reach the Class II threshold concentration in these 27 Chinese provinces, and even the Class I threshold concentration, except for Sichuan province.
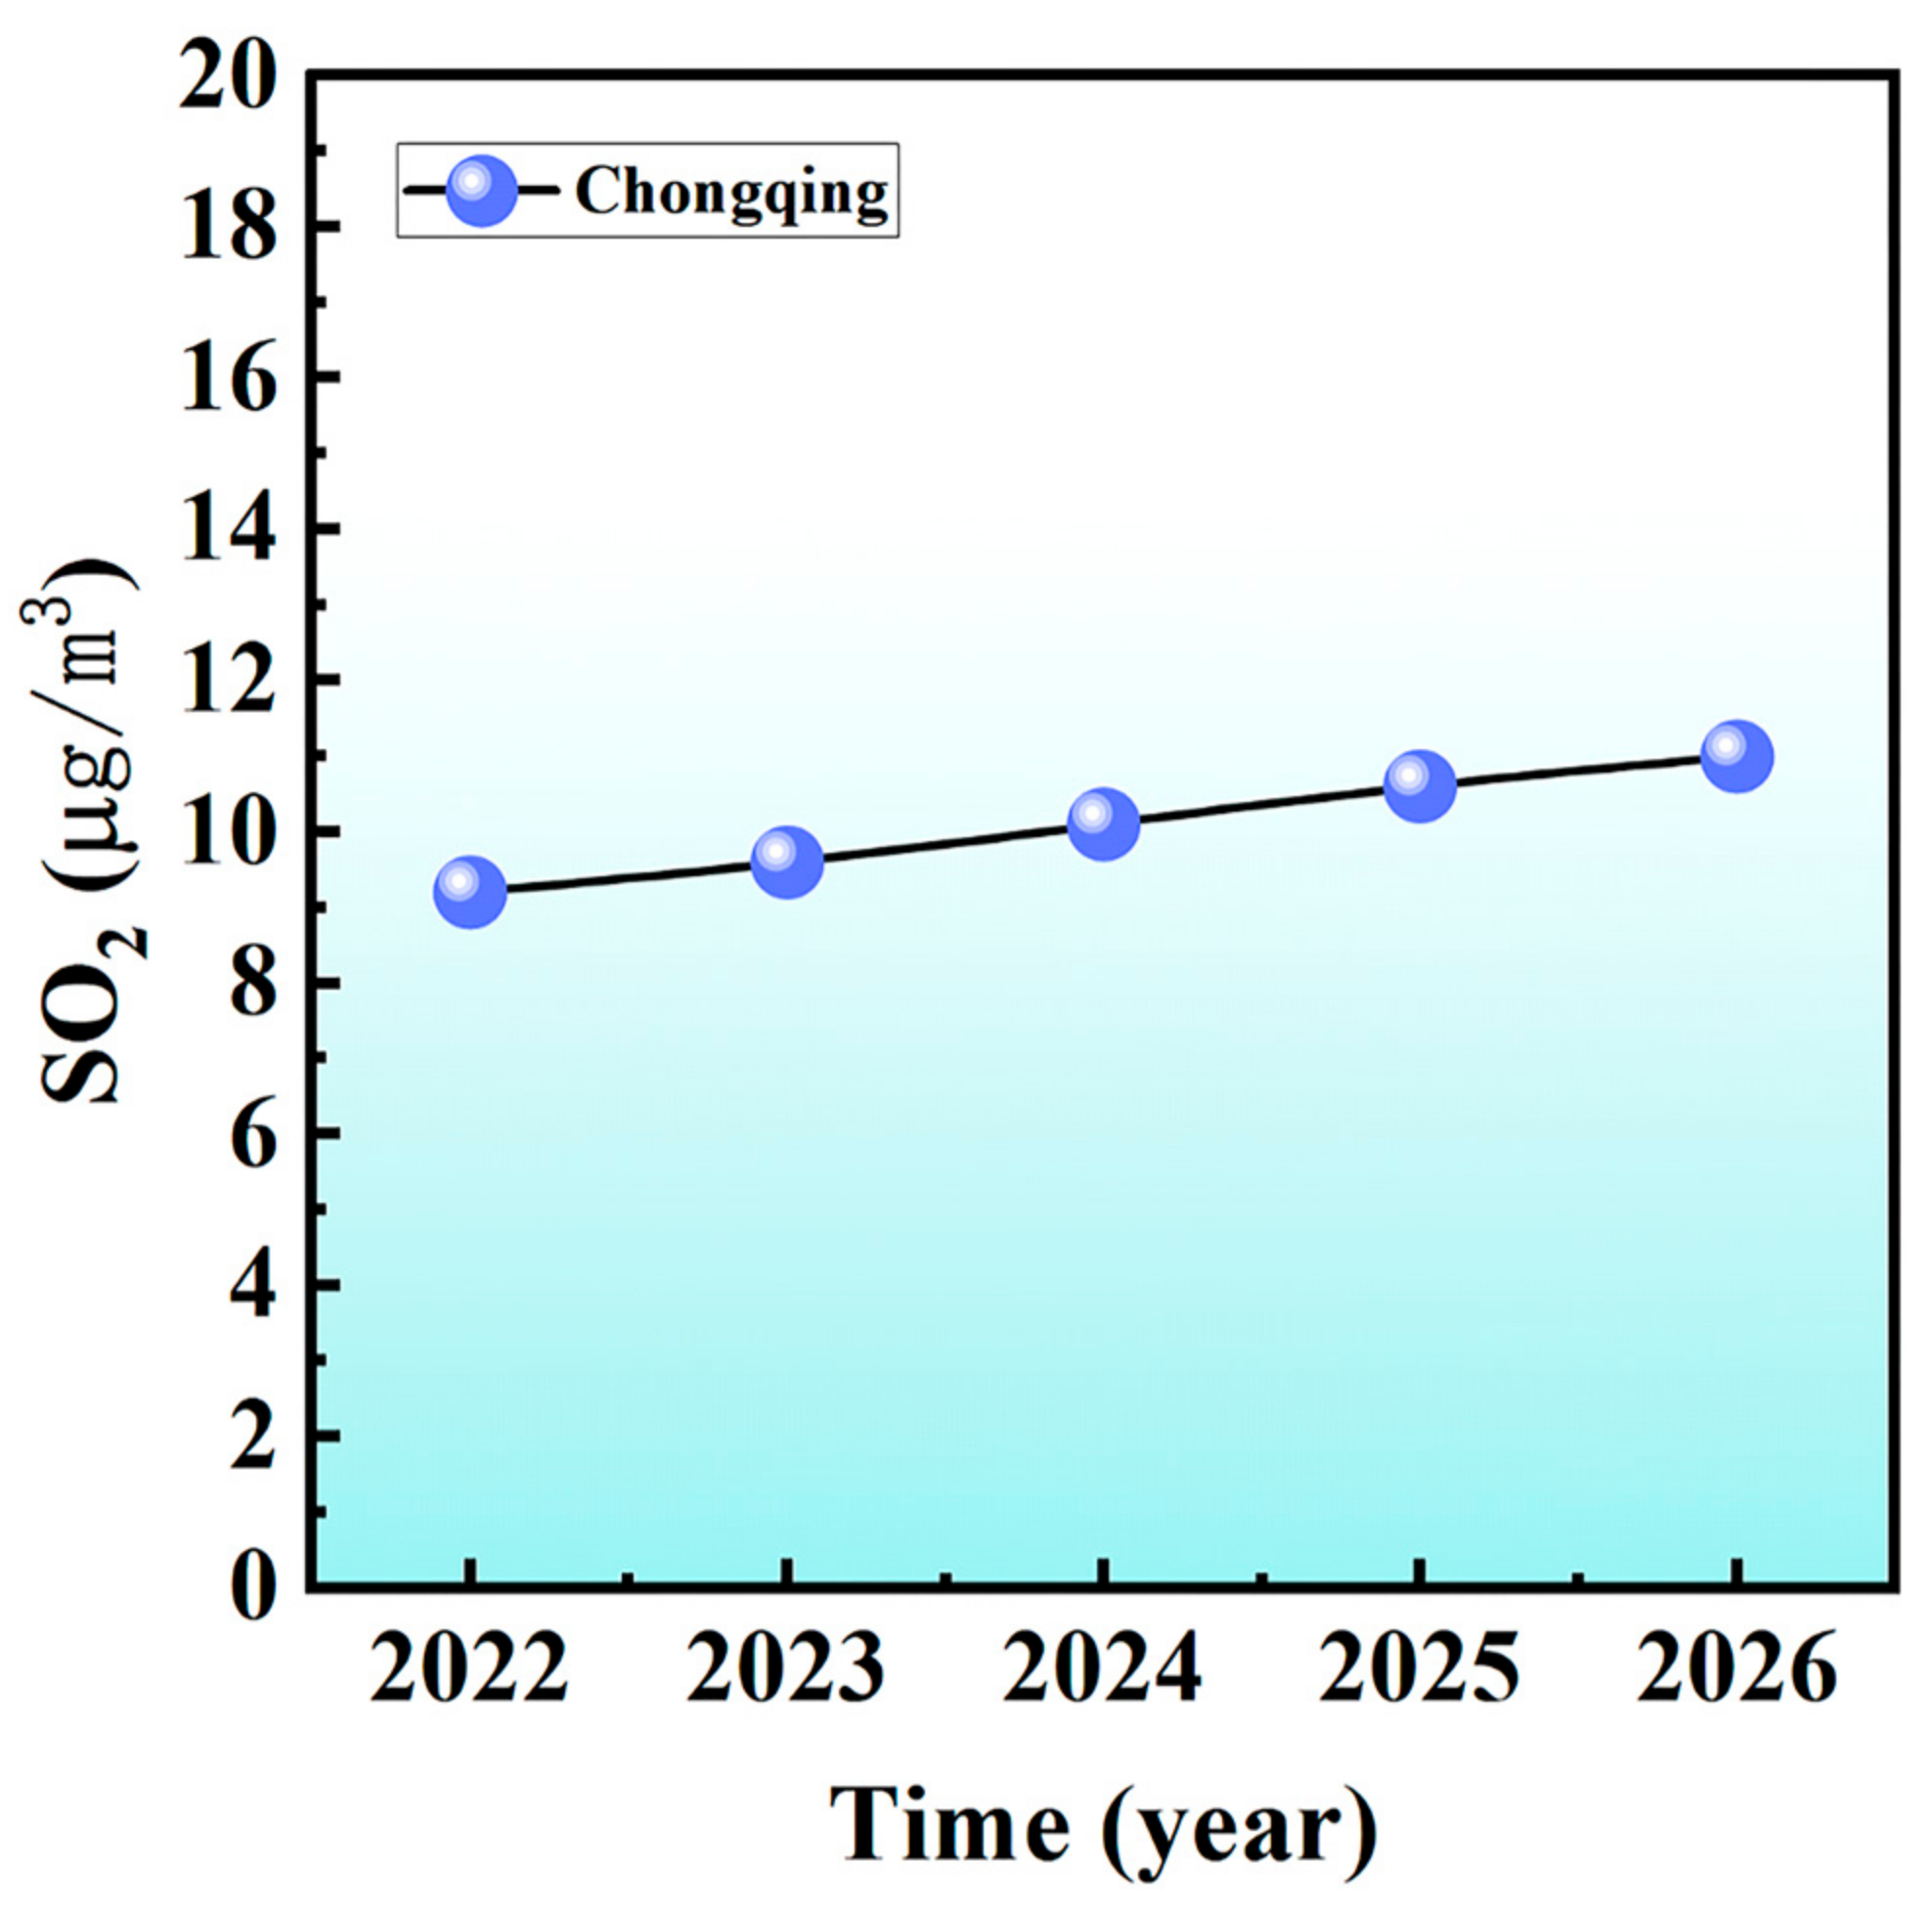
The trend of the annual mean SO2 concentration in Chongqing is shown in Figure 7. From 2022 to 2026, the annual mean SO2 concentration in Chongqing will show an increasing trend, from 9.2 µg/m3 in 2022 to 11.0 µg/m3 in 2026.
Although Chongqing is an area in southwest China that is subject to severe acid rain, its annual mean SO2 concentration has reached the Class I threshold concentration, indicating that the Chongqing Municipal Government’s efforts to control coal-combustion-derived SO2 have been effective. However, as shown by the data from the last five years and the projected trend over the next five years, the annual mean SO2 concentration in Chongqing has increased, which is mainly attributed to pollutant emissions, unfavorable diffusion conditions, limited environmental tolerance, and uneven spatial distribution [34,35].
In order to solve the problem, the Chongqing Municipal Government should strengthen the control of sulfur dioxide (SO2) produced by coal combustion and enhance the supervision of heavily polluted and outdated technologies and equipment. Factories should also improve their technologies, especially desulfurization technologies, to minimize the emission of SO2 into the air. Without these improvements, the concentration of SO2 will continue to rise, thereby reducing air quality. In addition, a series of mitigation measures have been taken to address this issue. The Chongqing Municipal Government has strengthened environmental regulation and law enforcement related to factories and enterprises, imposing strict restrictions on pollution emissions. At the same time, factories are continuously improving their technologies and introducing more advanced equipment and processes to reduce SO2 emissions. The effectiveness of these measures has been partially validated, but further efforts and monitoring are still needed to ensure their sustained effects.
In conclusion, the Chongqing Municipal Government should strengthen the control of SO2 emissions, and factories should continuously improve their technologies to reduce SO2 emissions. A series of mitigation measures have been implemented, but further efforts are needed to ensure the effectiveness of these measures and to continuously improve air quality.

3.4. Prediction and Analysis of Annual Mean NO2 Concentration

Nitrogen dioxide (NO2) is an important atmospheric pollutant, an important precursor of ozone and other photochemical reactions, and a major pollutant responsible for the formation of photochemical smog, nitric acid rain, and acid fog [36]. It is also a significant factor leading to global environmental degradation. When NO2 concentration in the air is high, it will appear as reddish brown photochemical smog, which aggravates the turbidity of atmospheric visibility to a certain extent. Thus, it affects vehicle travel and traffic safety to some extent. Moreover, NO2 pollution not only inconveniences people who travel but also affects their health. In addition, NO2 is mainly produced by human activities, such as the use of fossil fuels and emissions from car exhaust [37]. Therefore, it is necessary to predict the future trend of NO2 concentrations from such sources.
First, the annual mean NO2 concentrations in the 27 provinces over the 2017–2021 period and the MAPE values are shown in Table 11. The NO2 concentrations in the 27 provinces over the 2022–2026 period were predicted using the FGM(1,1) model (Table 12).
As shown in Table 11, the MAPE values for the annual mean NO2 concentration in the 27 provinces over 2017–2021 are all below 10% and fluctuate around 3%. According to the evaluation criteria, these data indicated that the FGM(1,1) model fit the annual mean NO2 concentrations in the 27 provinces well.
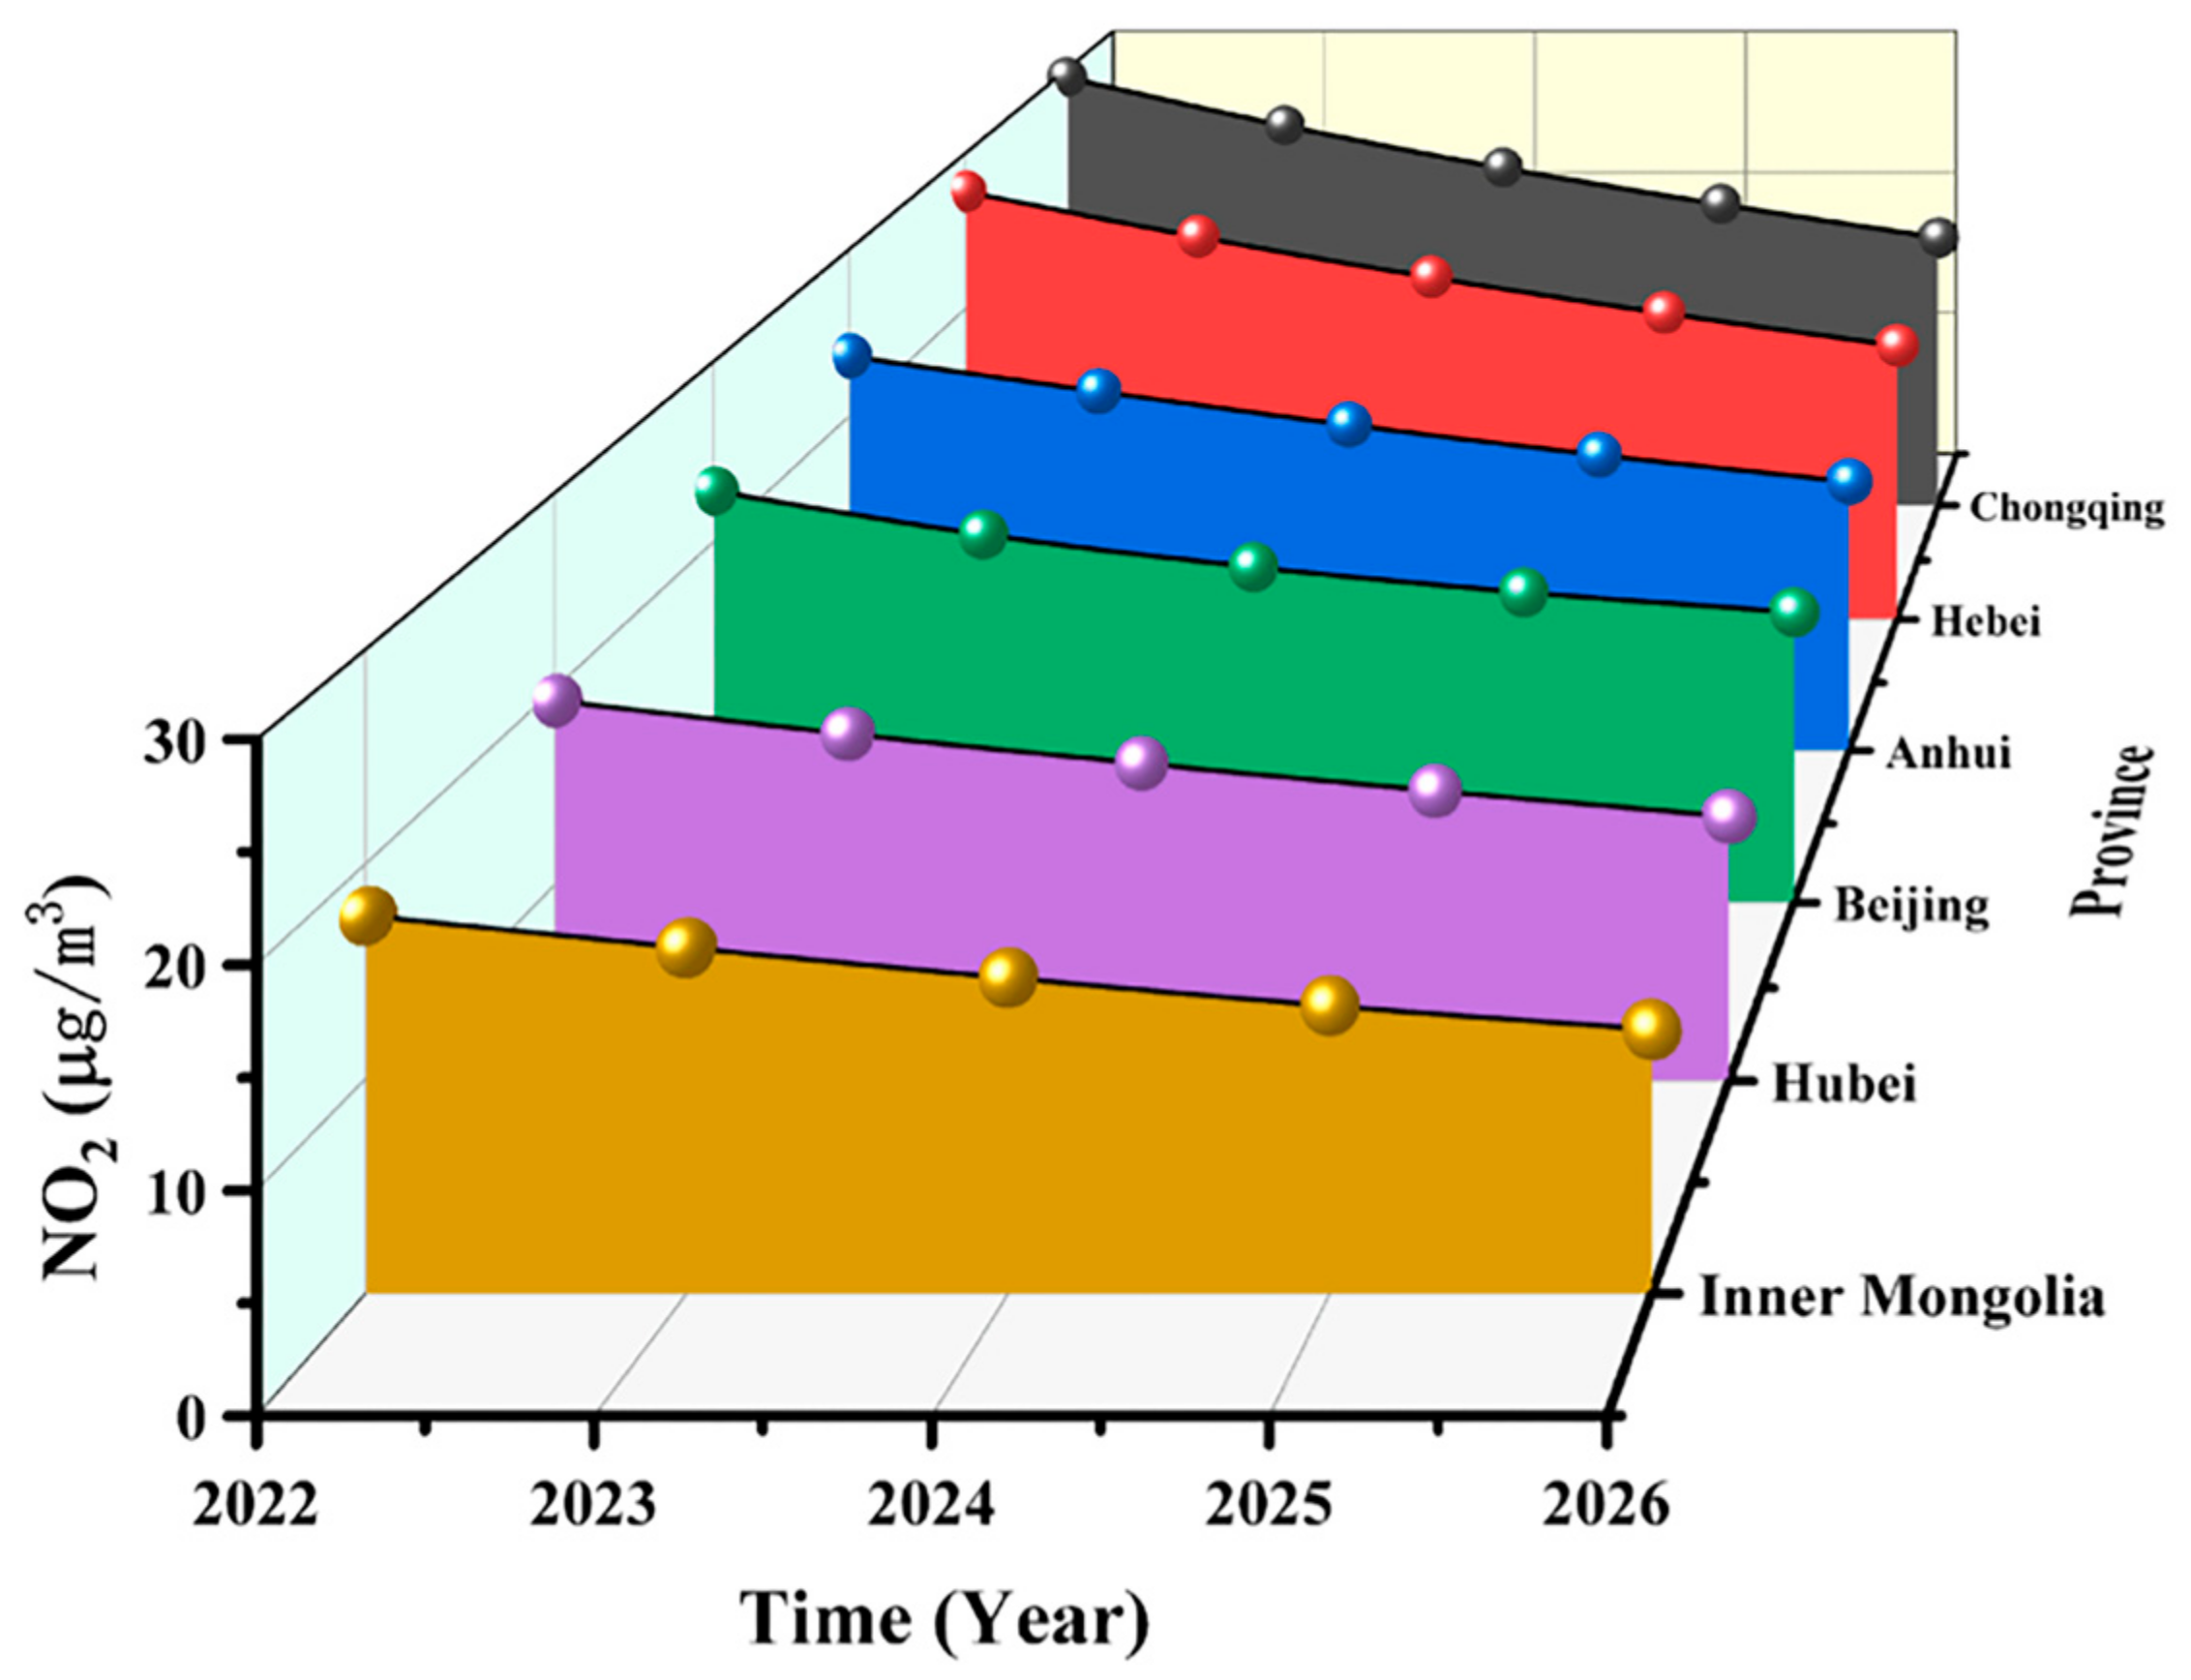
As shown in Table 12, the annual mean NO2 concentrations in the 27 provinces all show a decreasing trend, but preventive measures should remain stringent. Among them, the six provinces with the most obvious decreasing trends are Chongqing, Hebei, Anhui, Beijing, Hubei, and Inner Mongolia. The decreasing trends of these six provinces are shown in Figure 8. By 2026, the annual mean NO2 concentrations in Chongqing, Hebei, Anhui, Beijing, Hubei, and Inner Mongolia will fall to 18.4, 17.6, 16.1, 16.1, 13.5, and 12.3 µg/m3, respectively. It is projected that by 2026, Sichuan will have the highest annual mean NO2 concentration at 40.8 µg/m3 and Hunan will have the lowest annual mean NO2 concentration at 6.0 µg/m3 among the 27 provinces. According to the Chinese ambient air quality standards, annual mean NO2 concentration should be ≤40 µg/m3, whether for Class I or Class II air quality. It is evident that by 2026, 26 of the 27 Chinese provinces will reach the Class I threshold of annual mean NO2 concentration, with Sichuan as the only province to fail to reach Class II air quality.
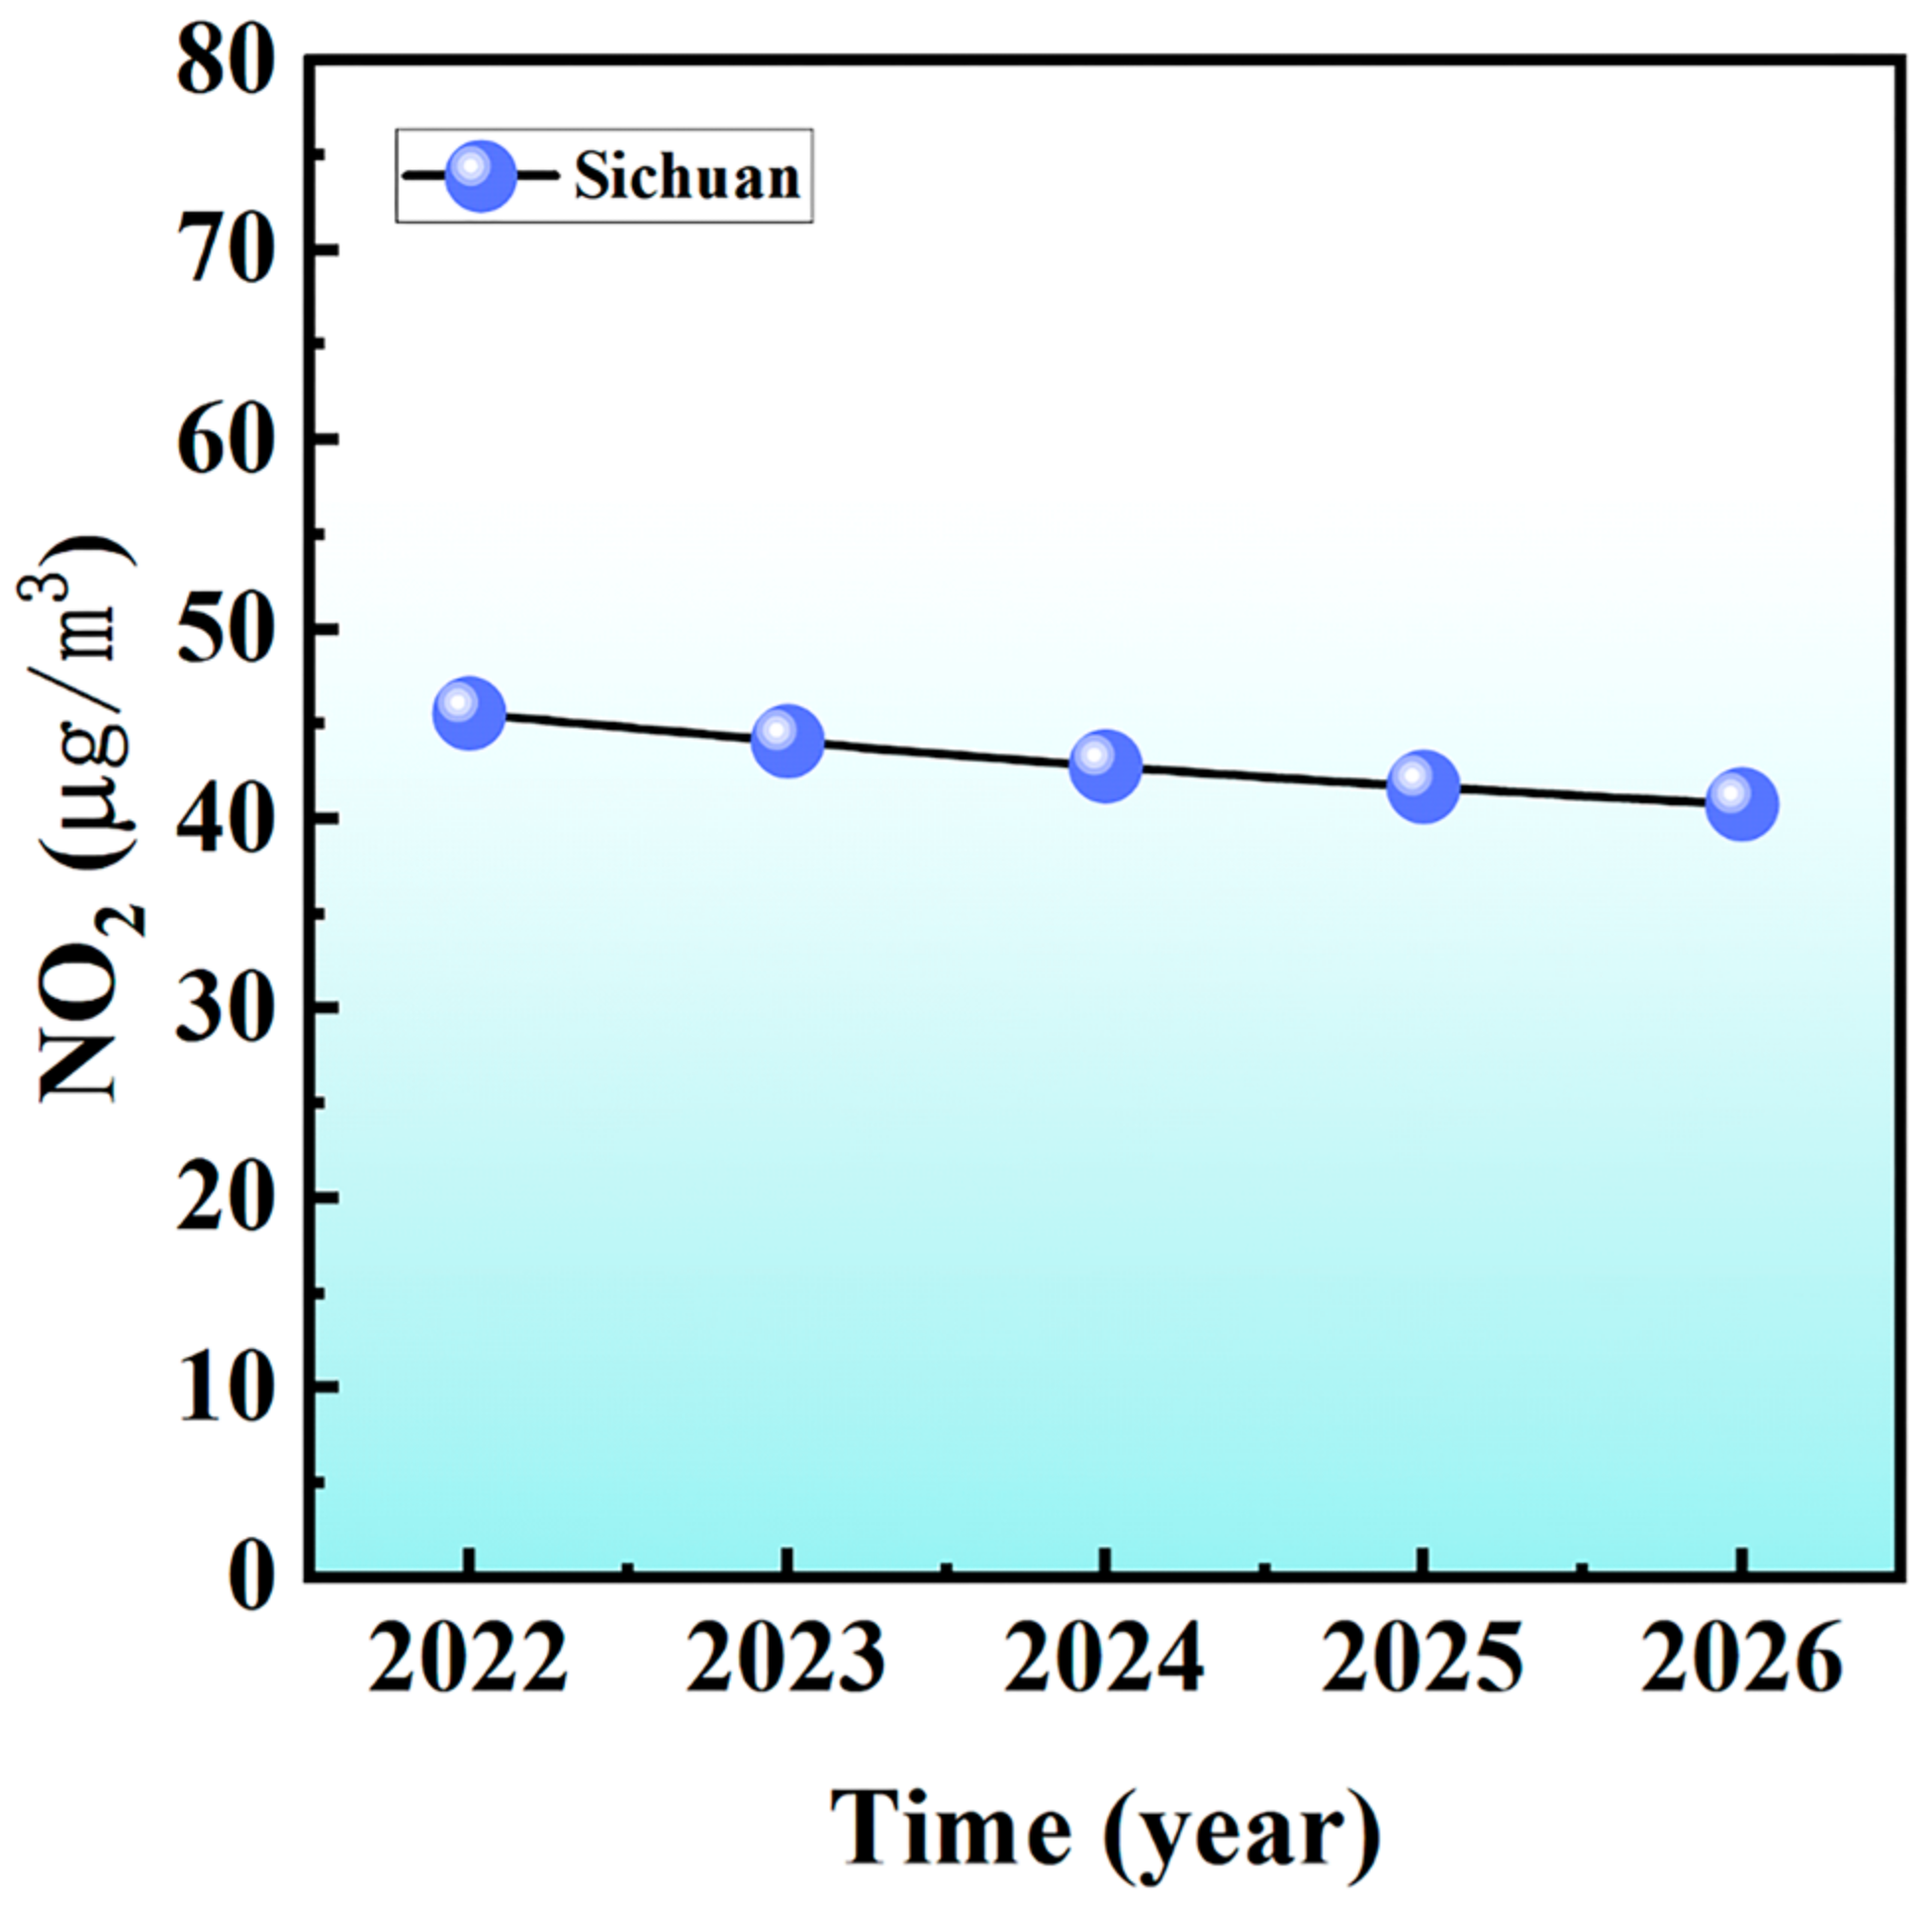
The trend of the annual mean NO2 concentration in Sichuan is shown in Figure 9. The annual mean NO2 concentration in Sichuan shows a decreasing trend over the 2022–2026 period, from 45.6 µg/m3 in 2022 to 40.8 µg/m3 in 2026. Therefore, Sichuan is projected to fail to reach the required air quality level by 2026, which suggests that the Sichuan provincial government still faces a very challenging situation with regard to environmental protection and should continue to strengthen preventive measures.
NO2 concentration is relatively high in Sichuan, a densely populated region with a high level of industrial and agricultural activities. NO2 concentration is highest during winter, which may be attributed to the fact that, in daily life, people prefer direct incineration for convenience when disposing of domestic waste [38]. Although direct incineration saves time, it causes serious environmental pollution. In addition, some factories discharge poorly treated wastewater directly into the environment to reduce costs. In winter, people drive motorized vehicles more frequently when traveling, which leads to increased exhaust emissions. All these factors cause NO2 concentrations to rise in an unsustainable manner.
In order to address these situations, the Sichuan provincial government should clearly prohibit individuals from burning household waste, promote centralized and pollution-free treatment of household waste, strengthen control over sewage discharge, improve sewage treatment levels, and enhance public awareness and education on environmental pollution issues, encouraging people to choose low-carbon and environmentally friendly modes of transportation. However, currently, there is insufficient discussion on the effectiveness of these mitigation measures and their efficacy. In order to evaluate the actual effects of these measures, comprehensive monitoring and evaluation are needed, including environmental monitoring data, pollutant emission inventories, and integrated analysis of relevant scientific research. This will allow for a more accurate assessment of current mitigation measures, as well as adjustments and improvements as needed. Therefore, further research and evaluation are needed to determine the actual effects of the measures taken by the Sichuan provincial government, especially the prohibition of individual burning of household waste and the promotion of pollution-free treatment, in order to determine their effectiveness in improving environmental conditions and to continue efforts to promote environmental protection and pollution reduction.

3.5. Prediction and Analysis of Annual Mean CO Concentration (the 95th Percentile of the Daily Mean Concentrations)

CO is also among the most important factors contributing to global environmental degradation. When CO enters the human body, it binds to hemoglobin, which prevents hemoglobin from binding to oxygen and thus causes hypoxia in the body’s tissues, leading to asphyxiation and even death. In addition, the combustion of petroleum products remains by far the largest source of CO [39]. Therefore, it is necessary to predict the future trend of CO concentrations.
First, the annual mean CO concentrations in the 27 provinces over the 2017–2021 period and the MAPE values are shown in Table 13. The CO concentrations in the 27 provinces over the 2022–2026 period were predicted using the FGM(1,1) model (Table 14).
As shown in Table 13, the MAPE values for the annual mean CO concentrations in the 27 provinces over the 2017–2021 period are all below 10% and are mostly around 3%. According to the evaluation criteria, these data indicated that the FGM(1,1) model fit the annual mean CO concentrations in the 27 provinces well.
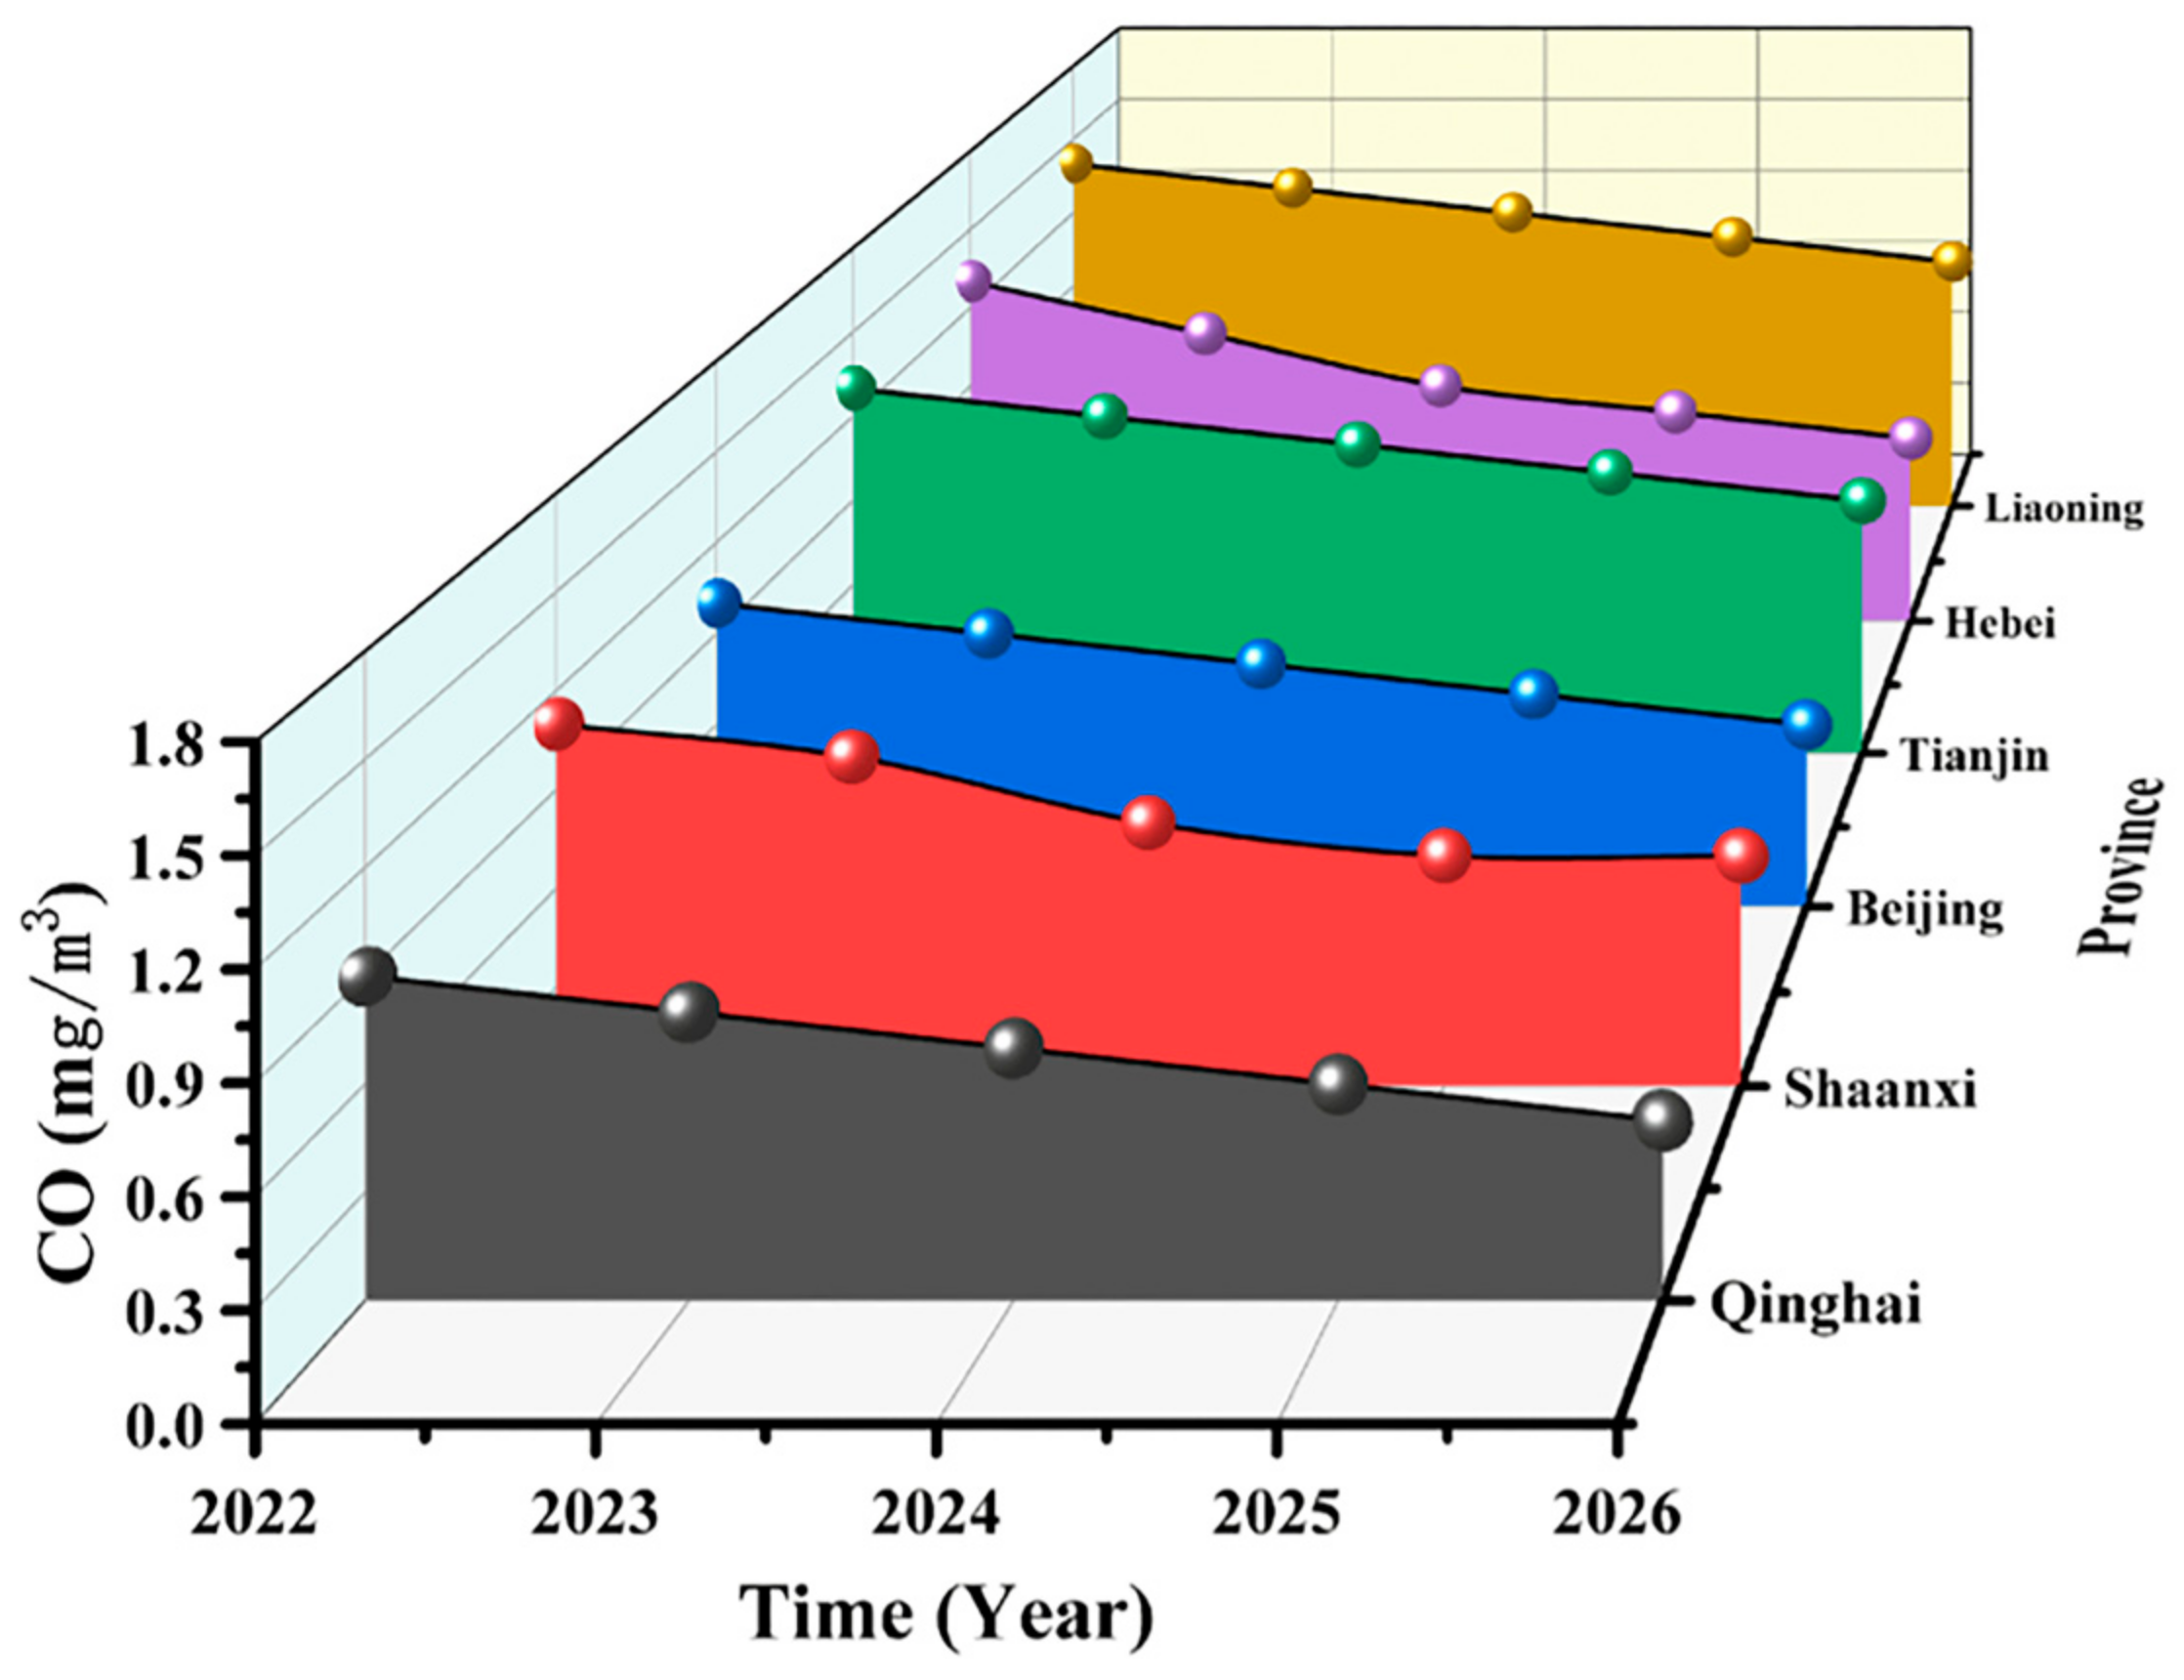
As shown in Table 14, 26 provinces show a decreasing trend in annual mean CO concentration, but Xinjiang shows an increasing trend. Among them, the six provinces with the most obvious decreasing trends are Hebei, Shaanxi, Tianjin, Liaoning, Qinghai, and Beijing. The decreasing trends of annual mean CO concentration in these six provinces are shown in Figure 10. By 2026, the annual mean CO concentrations in Hebei, Shaanxi, Tianjin, Liaoning, Qinghai, and Beijing will decrease to 0.7, 0.7, 0.9, 1.0, 0.5, and 0.6 mg/m3, respectively. It is projected that by 2026, Shanxi will have the highest annual mean CO concentration at 1.2 mg/m3 among the 26 provinces, while Shanghai, Fujian, Hunan, and Qinghai will have the lowest annual mean CO concentration at 5.0 mg/m3. According to China’s ambient air quality standards, the annual mean CO concentration should be ≤4 mg/m3, whether for Class I or Class II air quality. It is evident that by 2026, the annual mean CO concentrations in the 27 Chinese provinces will reach the Class I threshold concentration if the current preventive measures remain stringent.
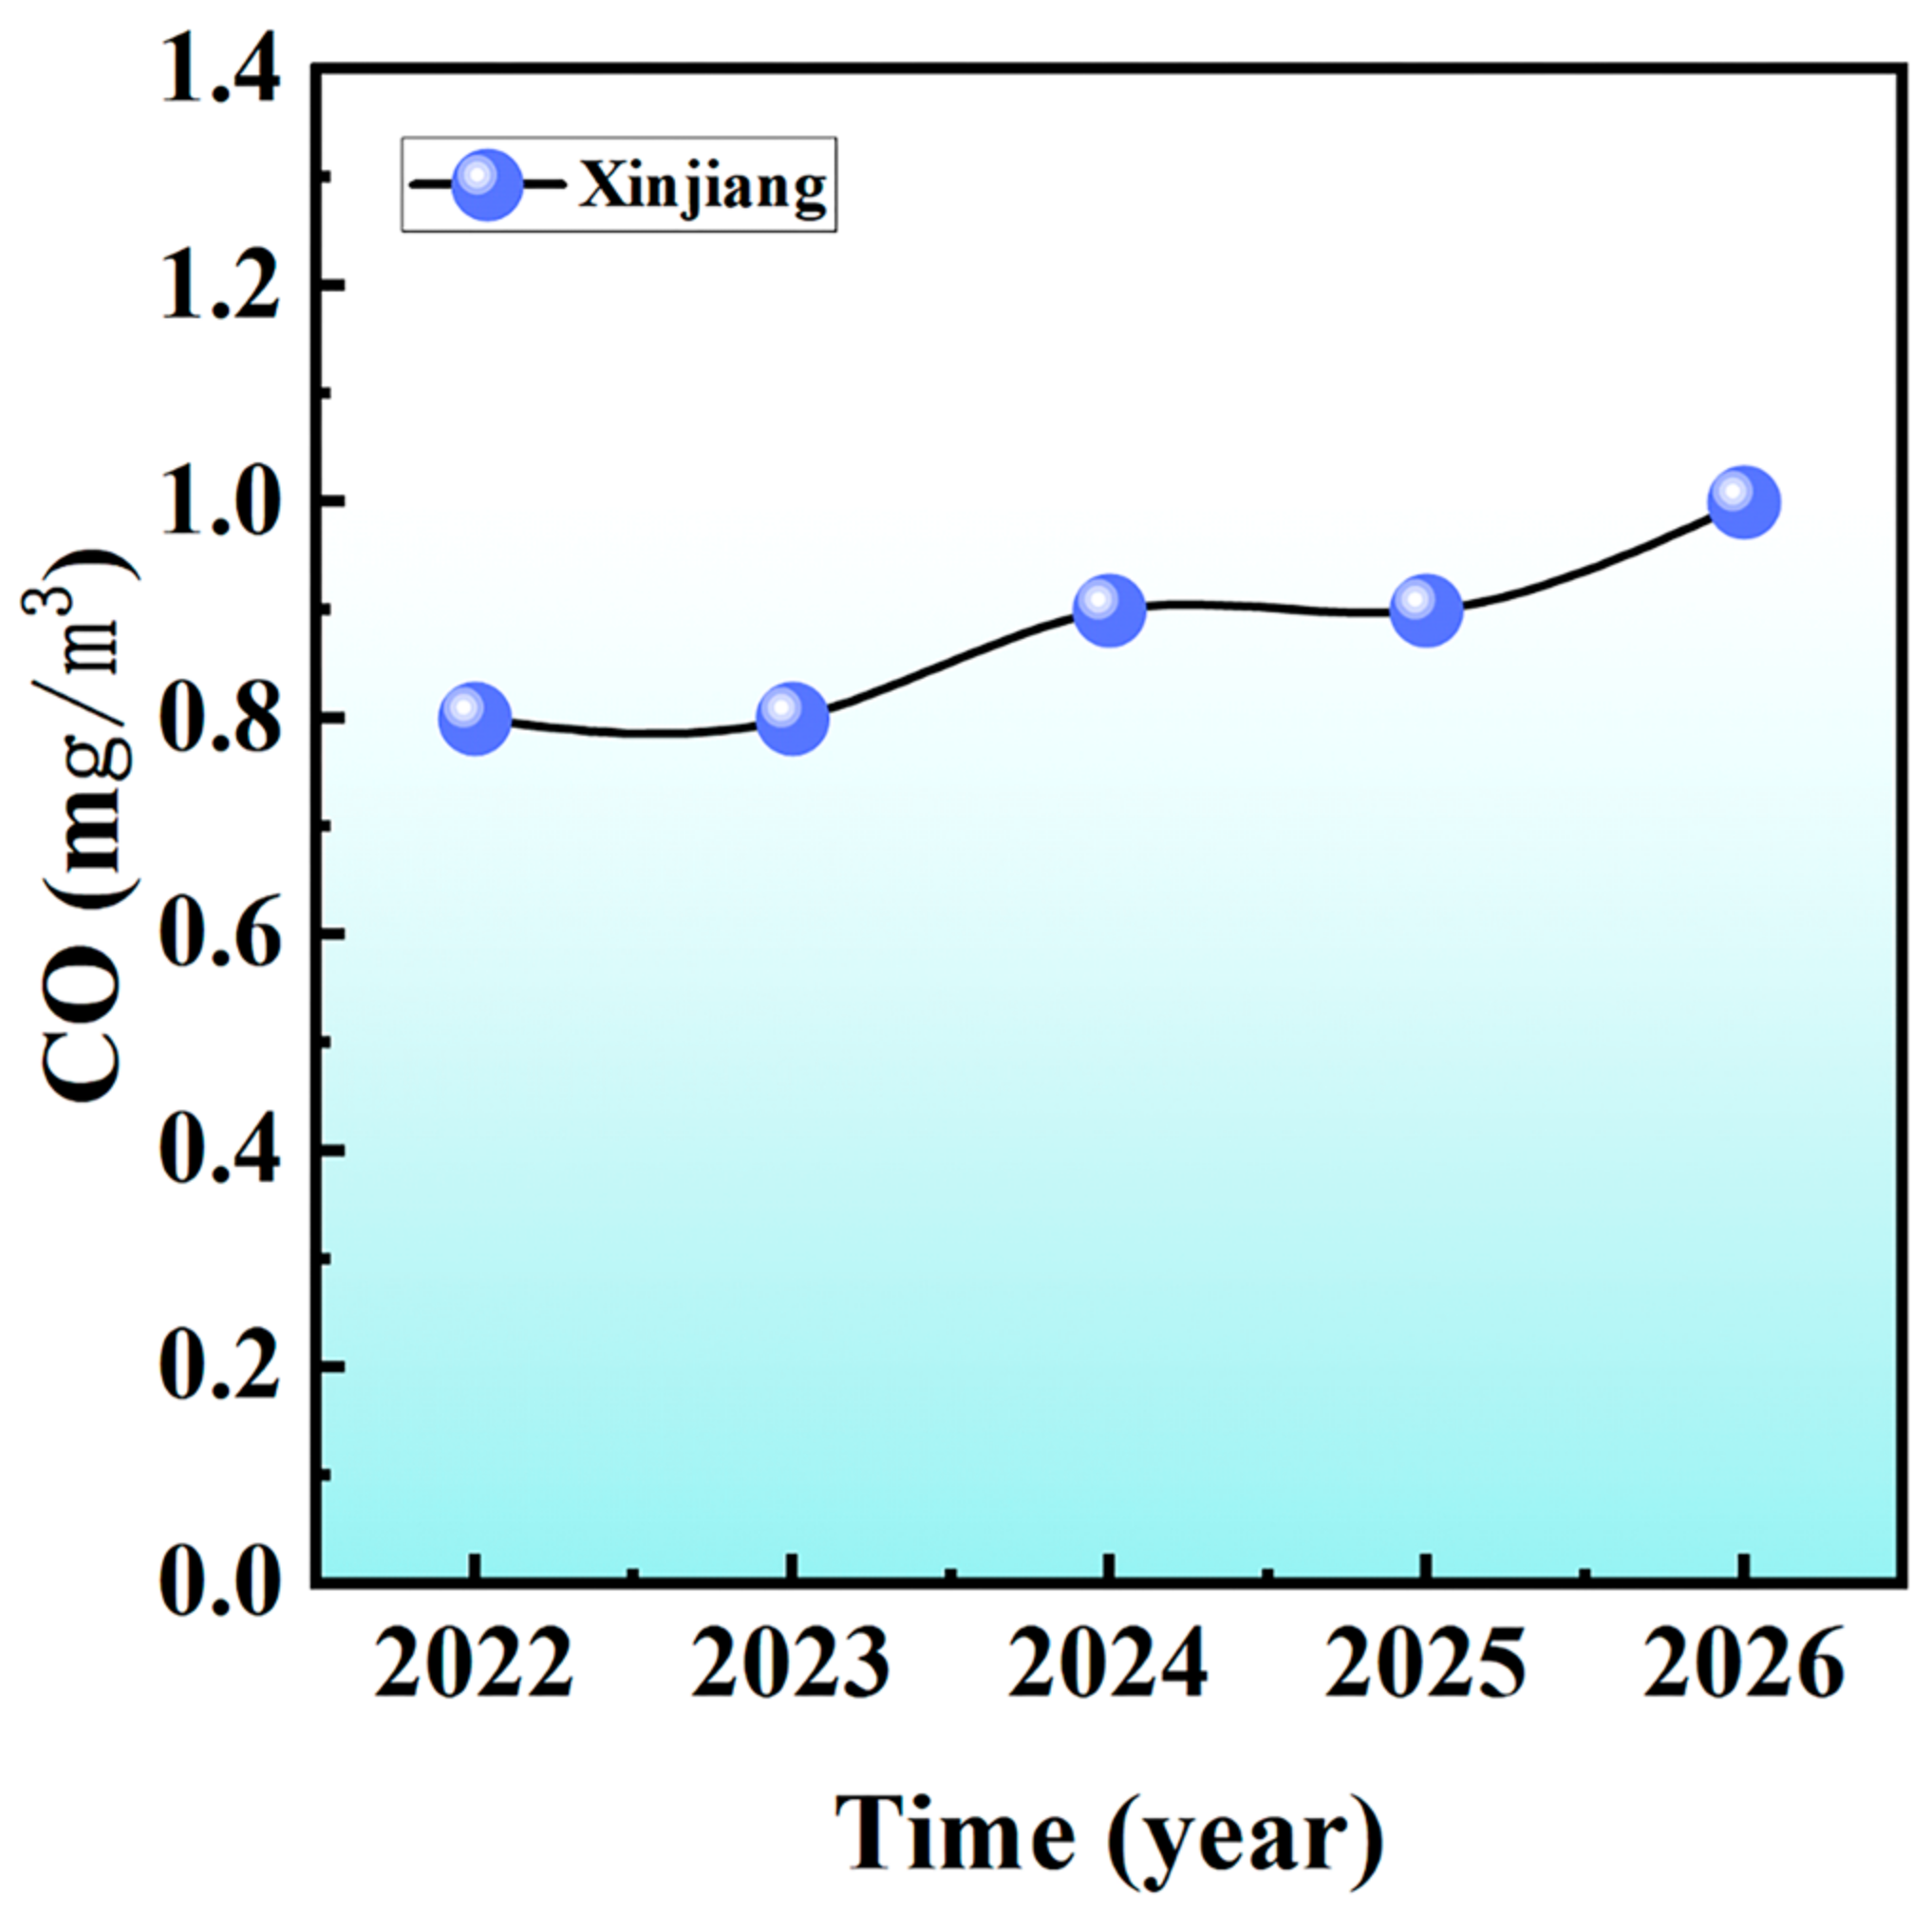
The trend of the annual mean CO concentration in Xinjiang is shown in Figure 11. From 2022 to 2026, the annual mean CO concentration in Xinjiang shows an increasing trend, from 0.8 mg/m3 in 2022 to 1.0 mg/m3 in 2026. Therefore, although Xinjiang has reached the Class I threshold concentration of CO, the annual mean CO concentration will rise to cause air pollution if the current preventive measures are relaxed.
To fundamentally reduce CO emissions, it is necessary to understand the anthropogenic causes of CO formation in the atmosphere. Atmospheric CO is partly caused by human activities, including pollutant gas emissions from industrial processes, vehicle exhaust emissions, and gas emissions from incompletely combusted coal [40].
Therefore, it is recommended that relevant government departments clearly prohibit people from setting off fireworks, strengthen supervision of industrial and mining enterprises, and strictly control the burning of petroleum products as fuel. Governments can also strengthen the control of CO and set standards for fuels used in industrial production. However, the effects of these mitigation measures currently in place, and their effectiveness, are not well discussed. To assess the actual effectiveness of these measures, comprehensive monitoring and evaluation are required, with adjustments and improvements made as necessary.
Therefore, in order to understand the actual effects of the proposed measures, especially the prohibition of the burning of petroleum products as fuel, relevant government departments need to strengthen the supervision of industrial and mining enterprises, and then conduct further research and evaluation. Governments should continue to determine the effects of the proposed measures on reducing CO emissions and improving environmental conditions, as well as continue their efforts to promote emission reduction and environmental protection.

3.6. Prediction and Analysis of Annual Mean O3 Concentration (the 90th Percentile of the Daily Maximum 8 h Moving Average)

Atmospheric O3 is mainly generated in situ via photochemical reactions of nitrogen oxides, sulfur oxides, and VOCs emitted by pollution sources. To control O3 pollution, it is necessary to control its precursor emissions. Although O3 has a strong germicidal effect, its inhalation into the human body can also be harmful to human health. Its negative effects include cell carcinogenesis, reduced lung function, lung tissue damage, loss of vision, dizziness, and headaches. In addition, tropospheric O3 can be produced through photochemical reactions of major pollutants, such as volatile organic compounds (VOCs) and nitrogen oxides (NOX, mainly including NO and NO2). This is the main source of O3 production [41]. Therefore, the hazards of O3 need to be taken seriously and its concentrations in the air should be strictly controlled.
First, the annual mean O3 concentrations in the 27 provinces over the 2017–2021 period and the MAPE values are shown in Table 15. The O3 concentrations in the 27 provinces over the 2022–2026 period were predicted using the FGM(1,1) model (Table 16).
As shown in Table 15, the MAPE values for the annual mean O3 concentration in the 27 provinces over the 2017–2021 period are below 10% and mostly fluctuate around 3%. According to the evaluation criteria, these data indicated that the FGM(1,1) model fit the annual mean O3 concentration in the 27 provinces well.
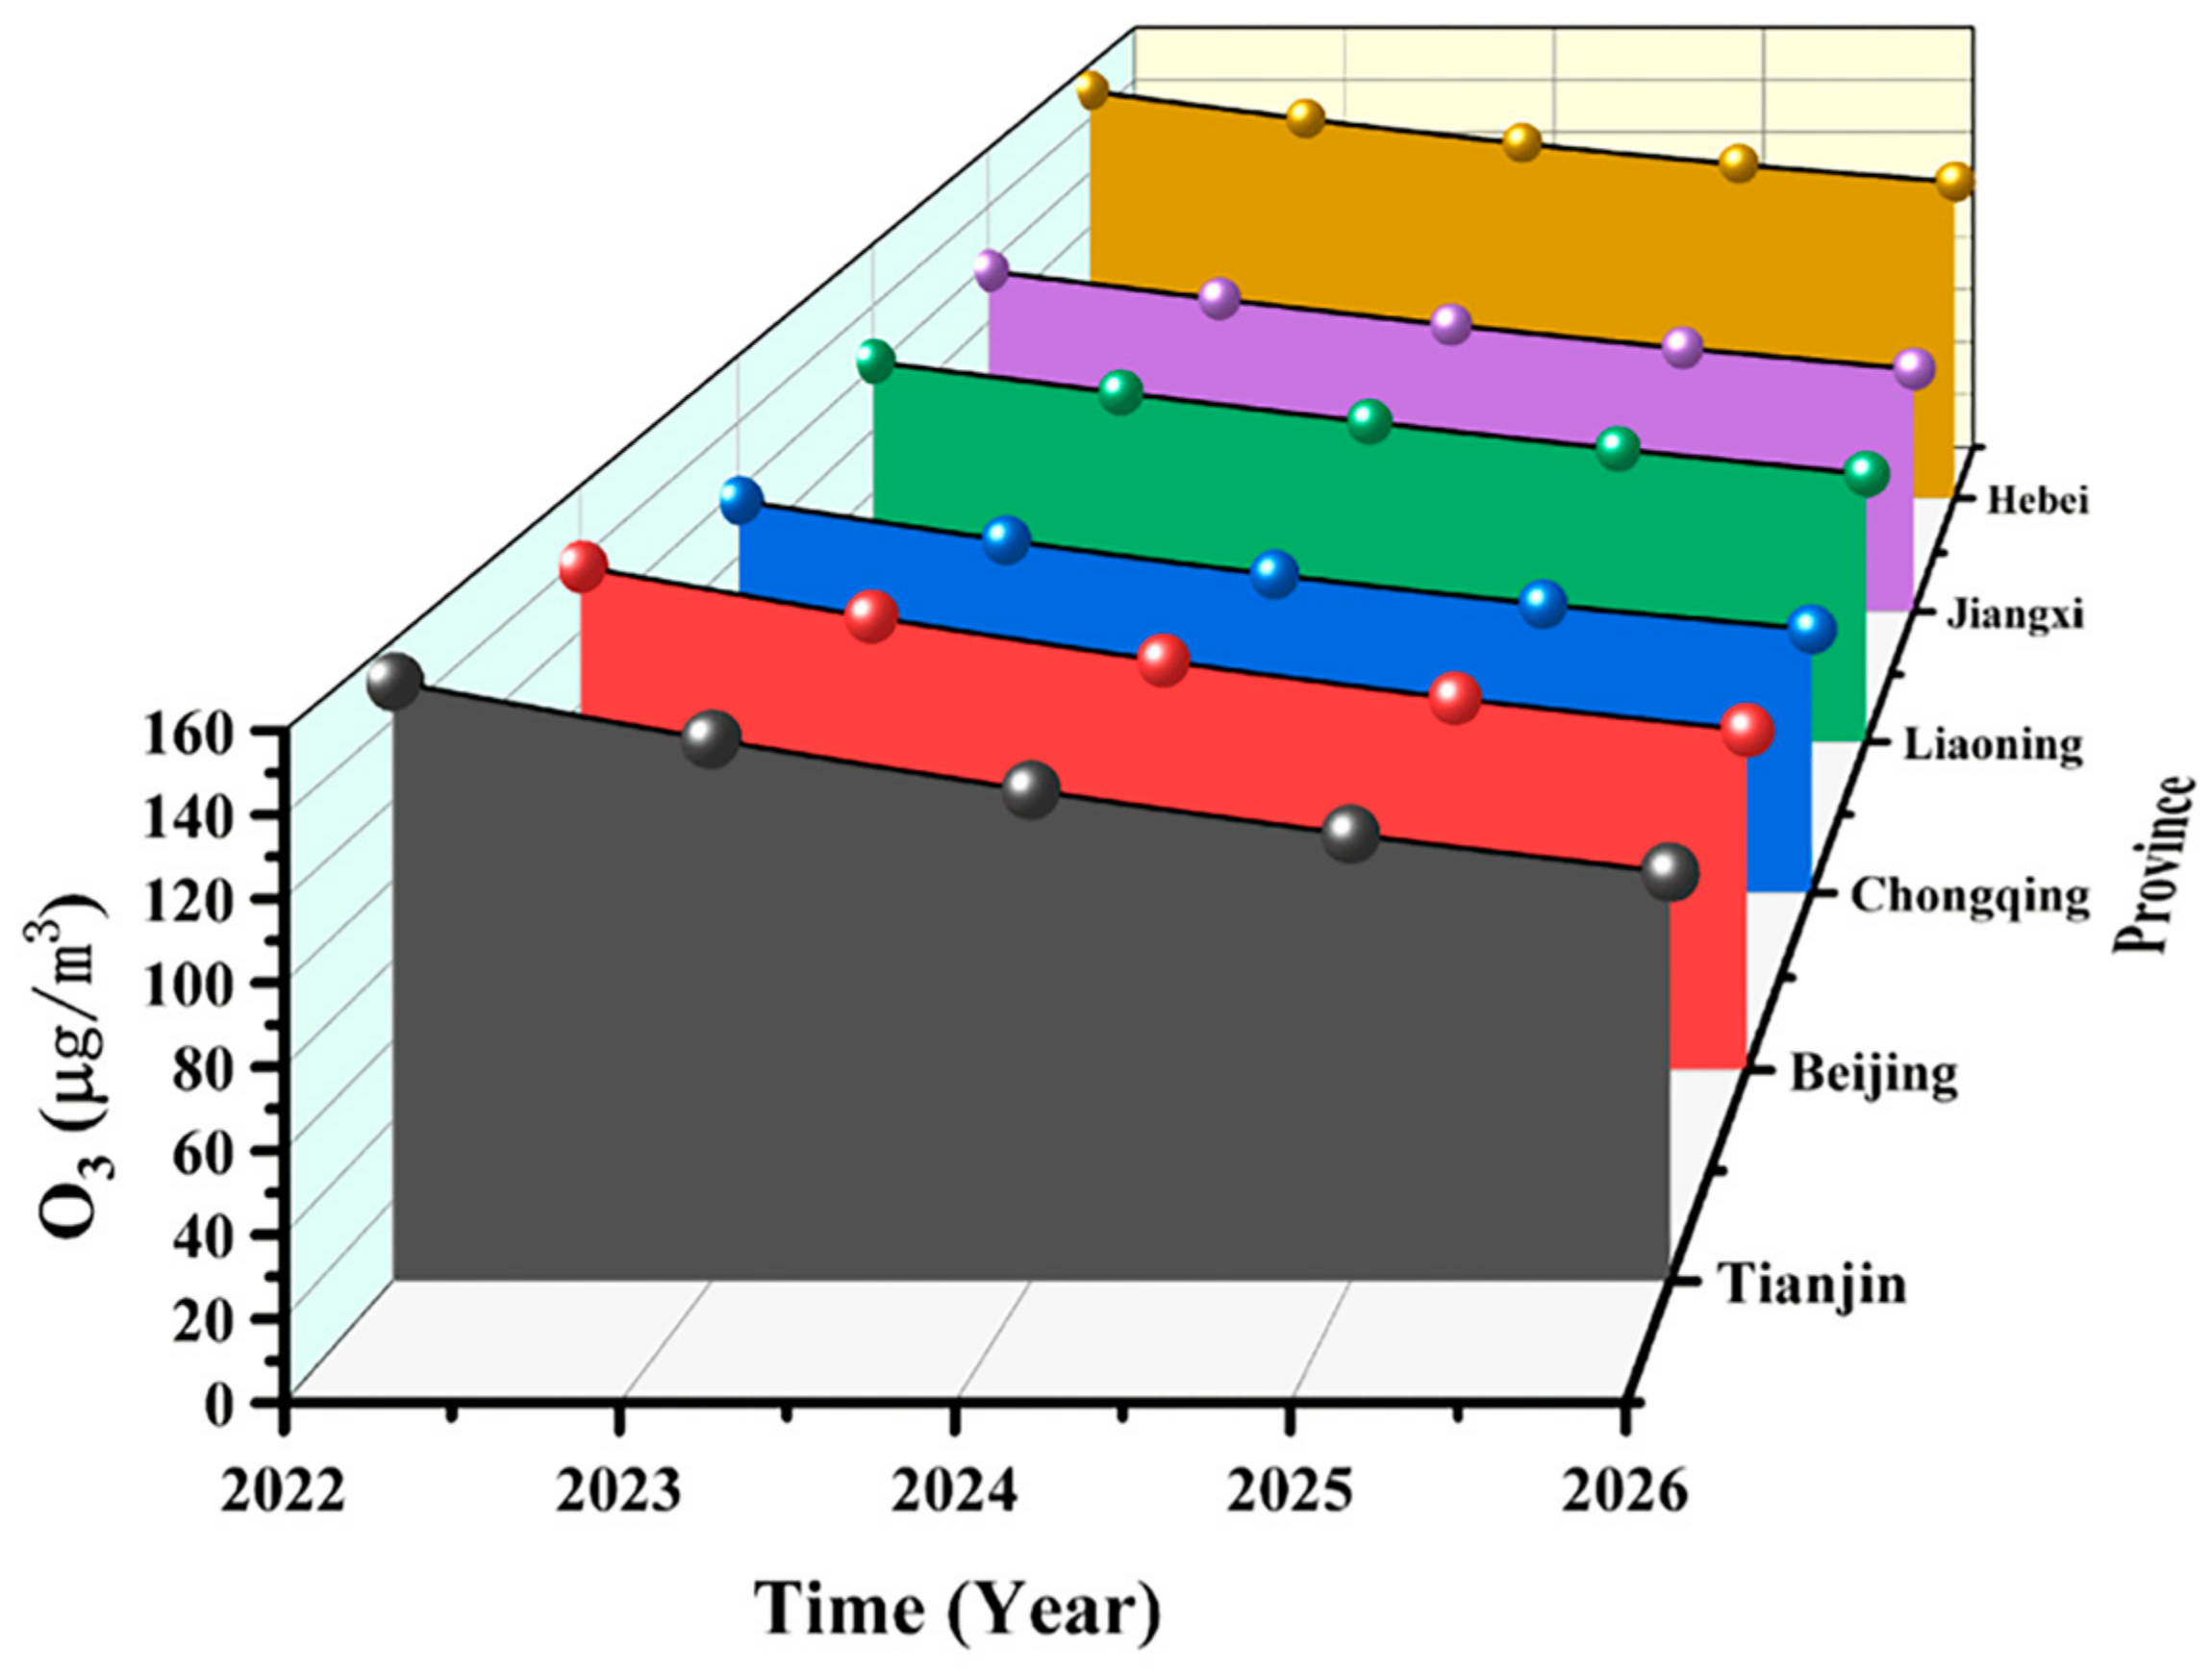
As shown in Table 16, 26 of the 27 provinces show a decreasing trend in annual mean O3 concentration, but Xinjiang shows an increasing trend. The six provinces with the most obvious decreasing trends are Tianjin, Beijing, Chongqing, Liaoning, Jiangxi, and Hebei. The decreasing trends of annual mean O3 concentration in these six provinces are shown in Figure 12. By 2026, the annual mean O3 concentrations in Tianjin, Beijing, Chongqing, Liaoning, Jiangxi, and Hebei will drop to 102.3, 93.1, 78.5, 86.1, 83.8, and 116.8 µg/m3, respectively. By 2026, the highest annual O3 concentration among the 27 provinces is projected to be 139.0 µg/m3 in Jiangsu, and the lowest annual mean O3 concentration is projected to be 78.5 µg/m3 in Chongqing. According to China’s ambient air quality standards, the annual mean O3 concentration should be ≤100 µg/m3 for Class I air quality and ≤160 µg/m3 for Class II air quality. It is evident that by 2026, the 27 Chinese provinces will reach the Class II threshold concentration of annual mean O3 concentration, and eight provinces will even reach the Class I threshold concentration.
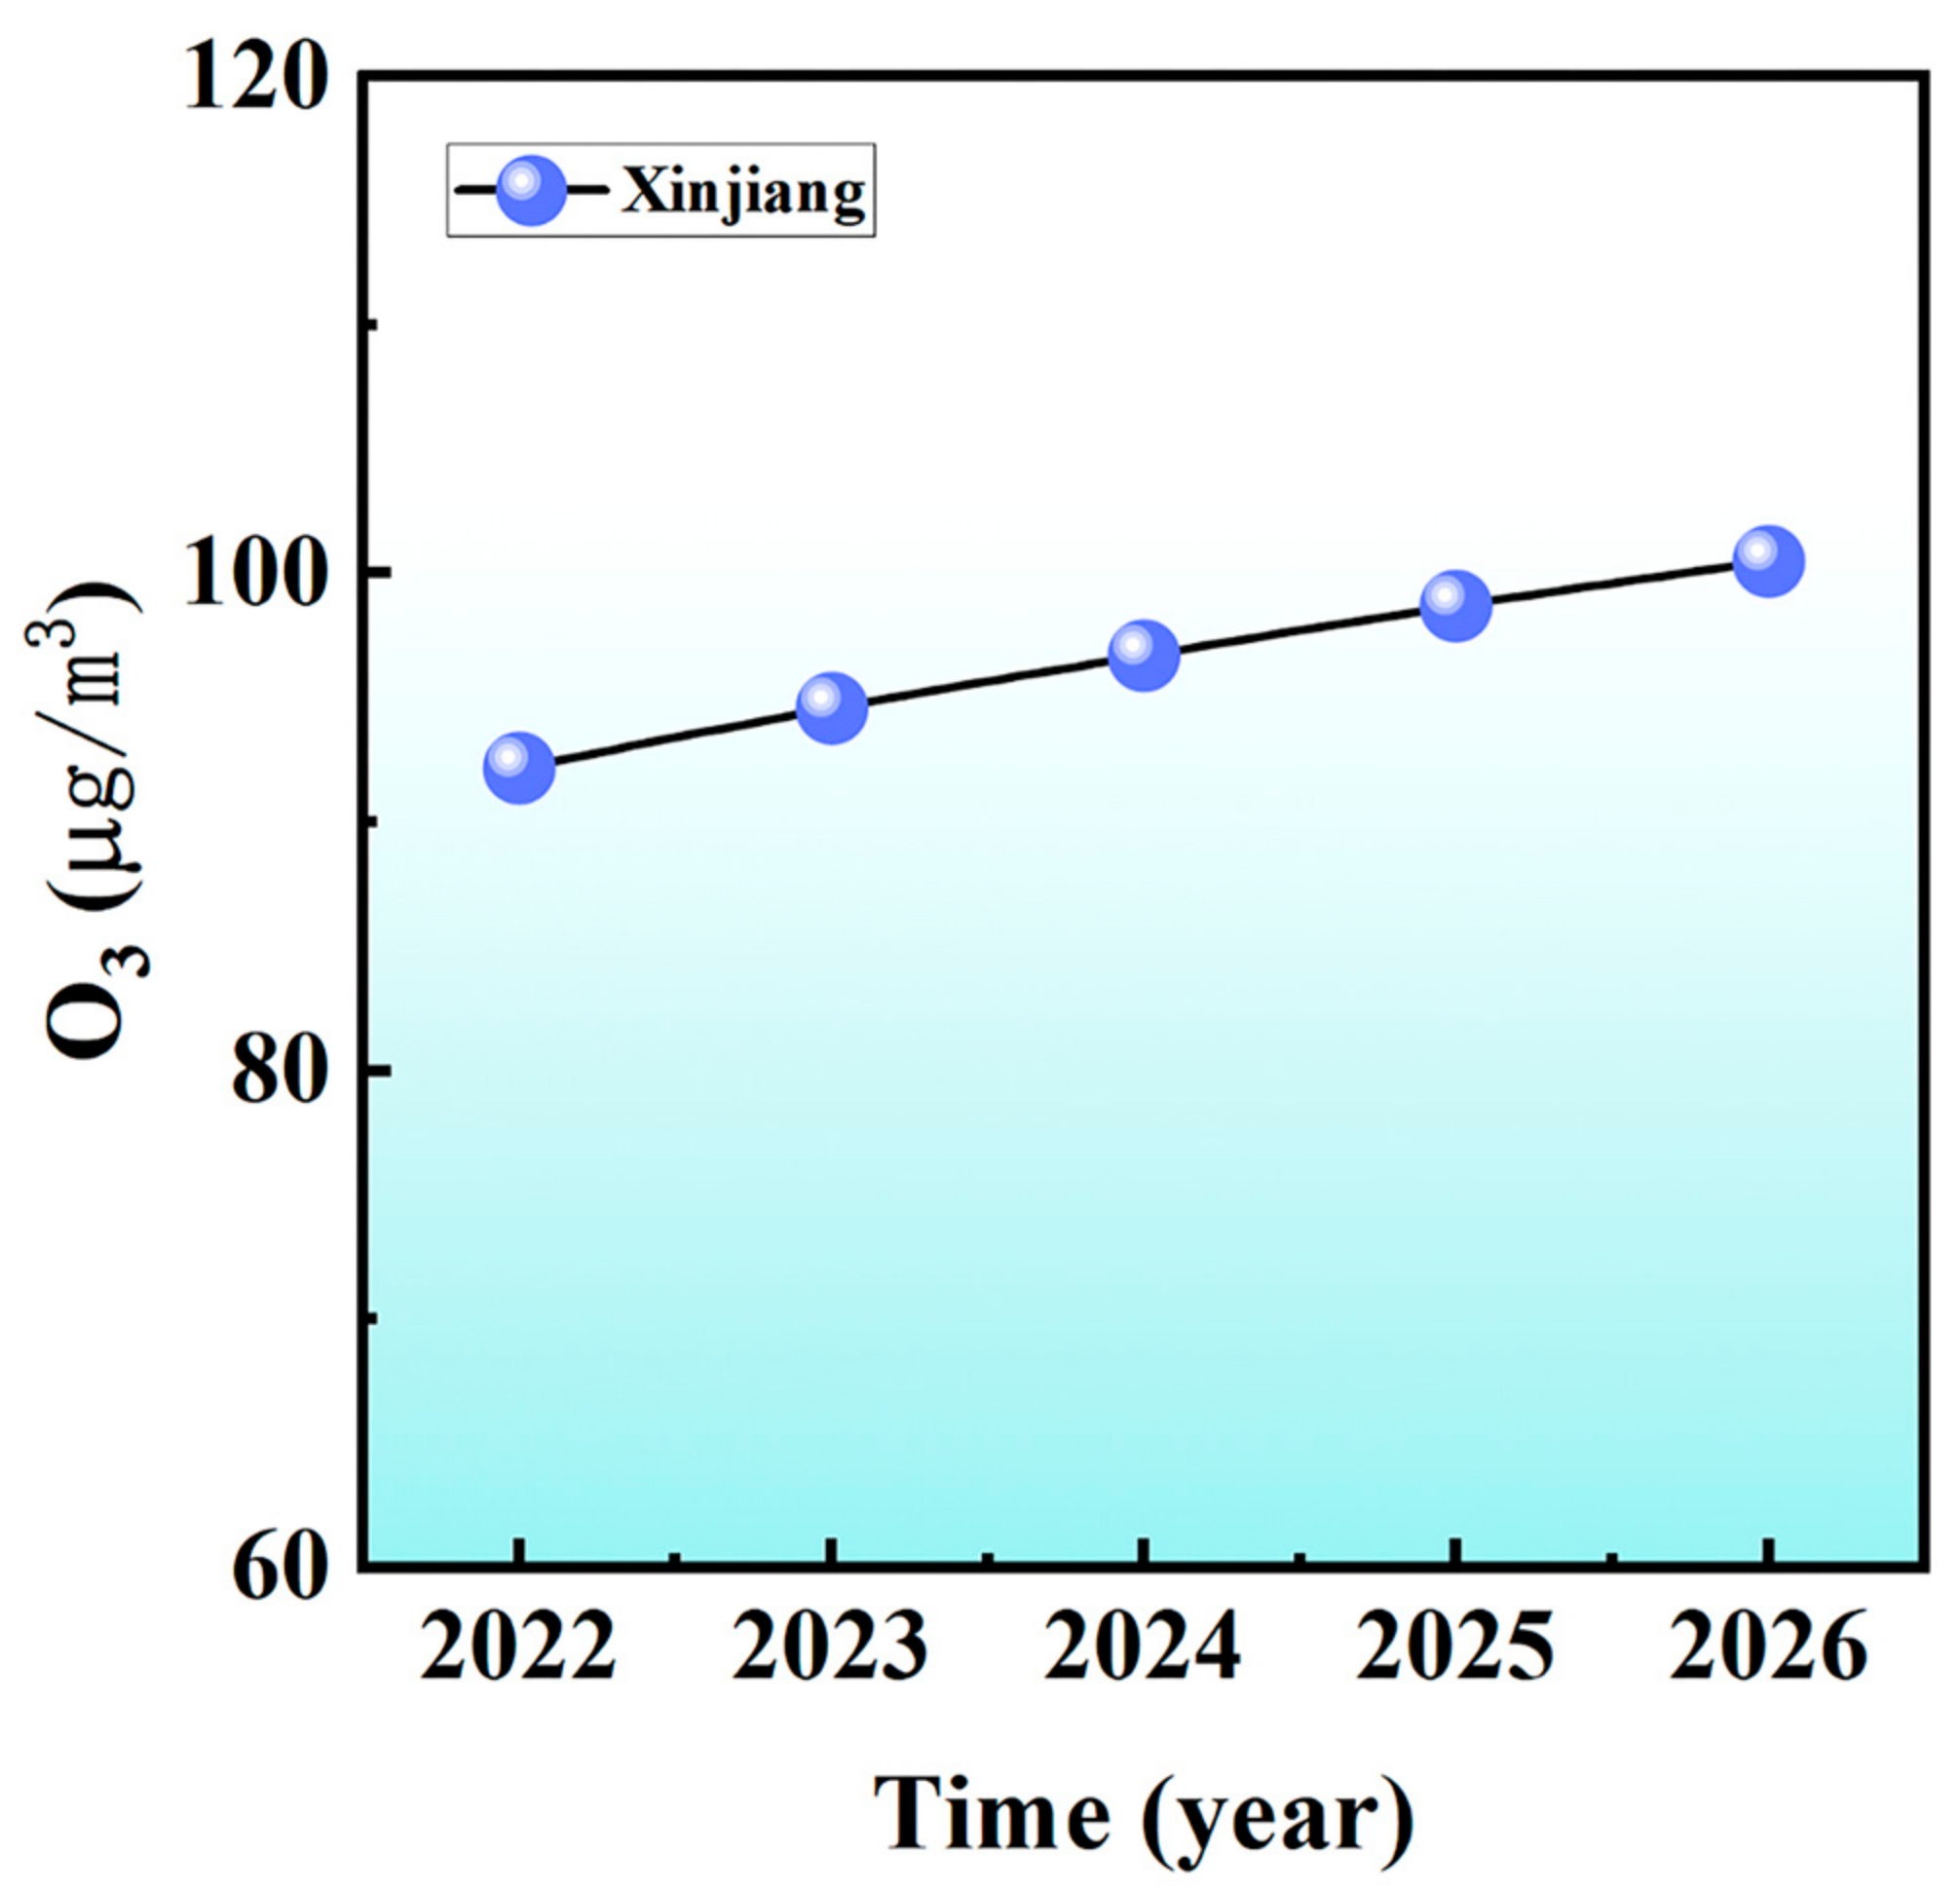
The trend of annual mean O3 concentration in Xinjiang is shown in Figure 13. From 2022 to 2026, the annual mean O3 concentration in Xinjiang shows an increasing trend, from 92.2 µg/m3 in 2022 to 100.5 µg/m3 in 2026. Therefore, appropriate preventive measures should be taken by the local government to curb the increasing trend of annual mean O3 concentration in Xinjiang.
The government should take the following measures to comprehensively prevent the formation of ozone pollution: strengthen the control of volatile organic compounds (VOCs) and nitrogen monoxide (NOX) emissions, formulate strict emission standards, and adopt effective control technologies; promote the use of renewable and clean energy and reduce dependence on fossil fuels; strengthen the supervision and management of industrial enterprises to ensure their compliance with emission standards; and strengthen environmental education and public awareness, and advocate for individuals to reduce their negative impact on the environment. Comprehensive implementation of these measures will effectively reduce the generation of ozone pollution and improve air quality. However, currently implemented mitigation measures need to be evaluated to ensure their effectiveness, and to adjust and improve them as needed.
4. Conclusions

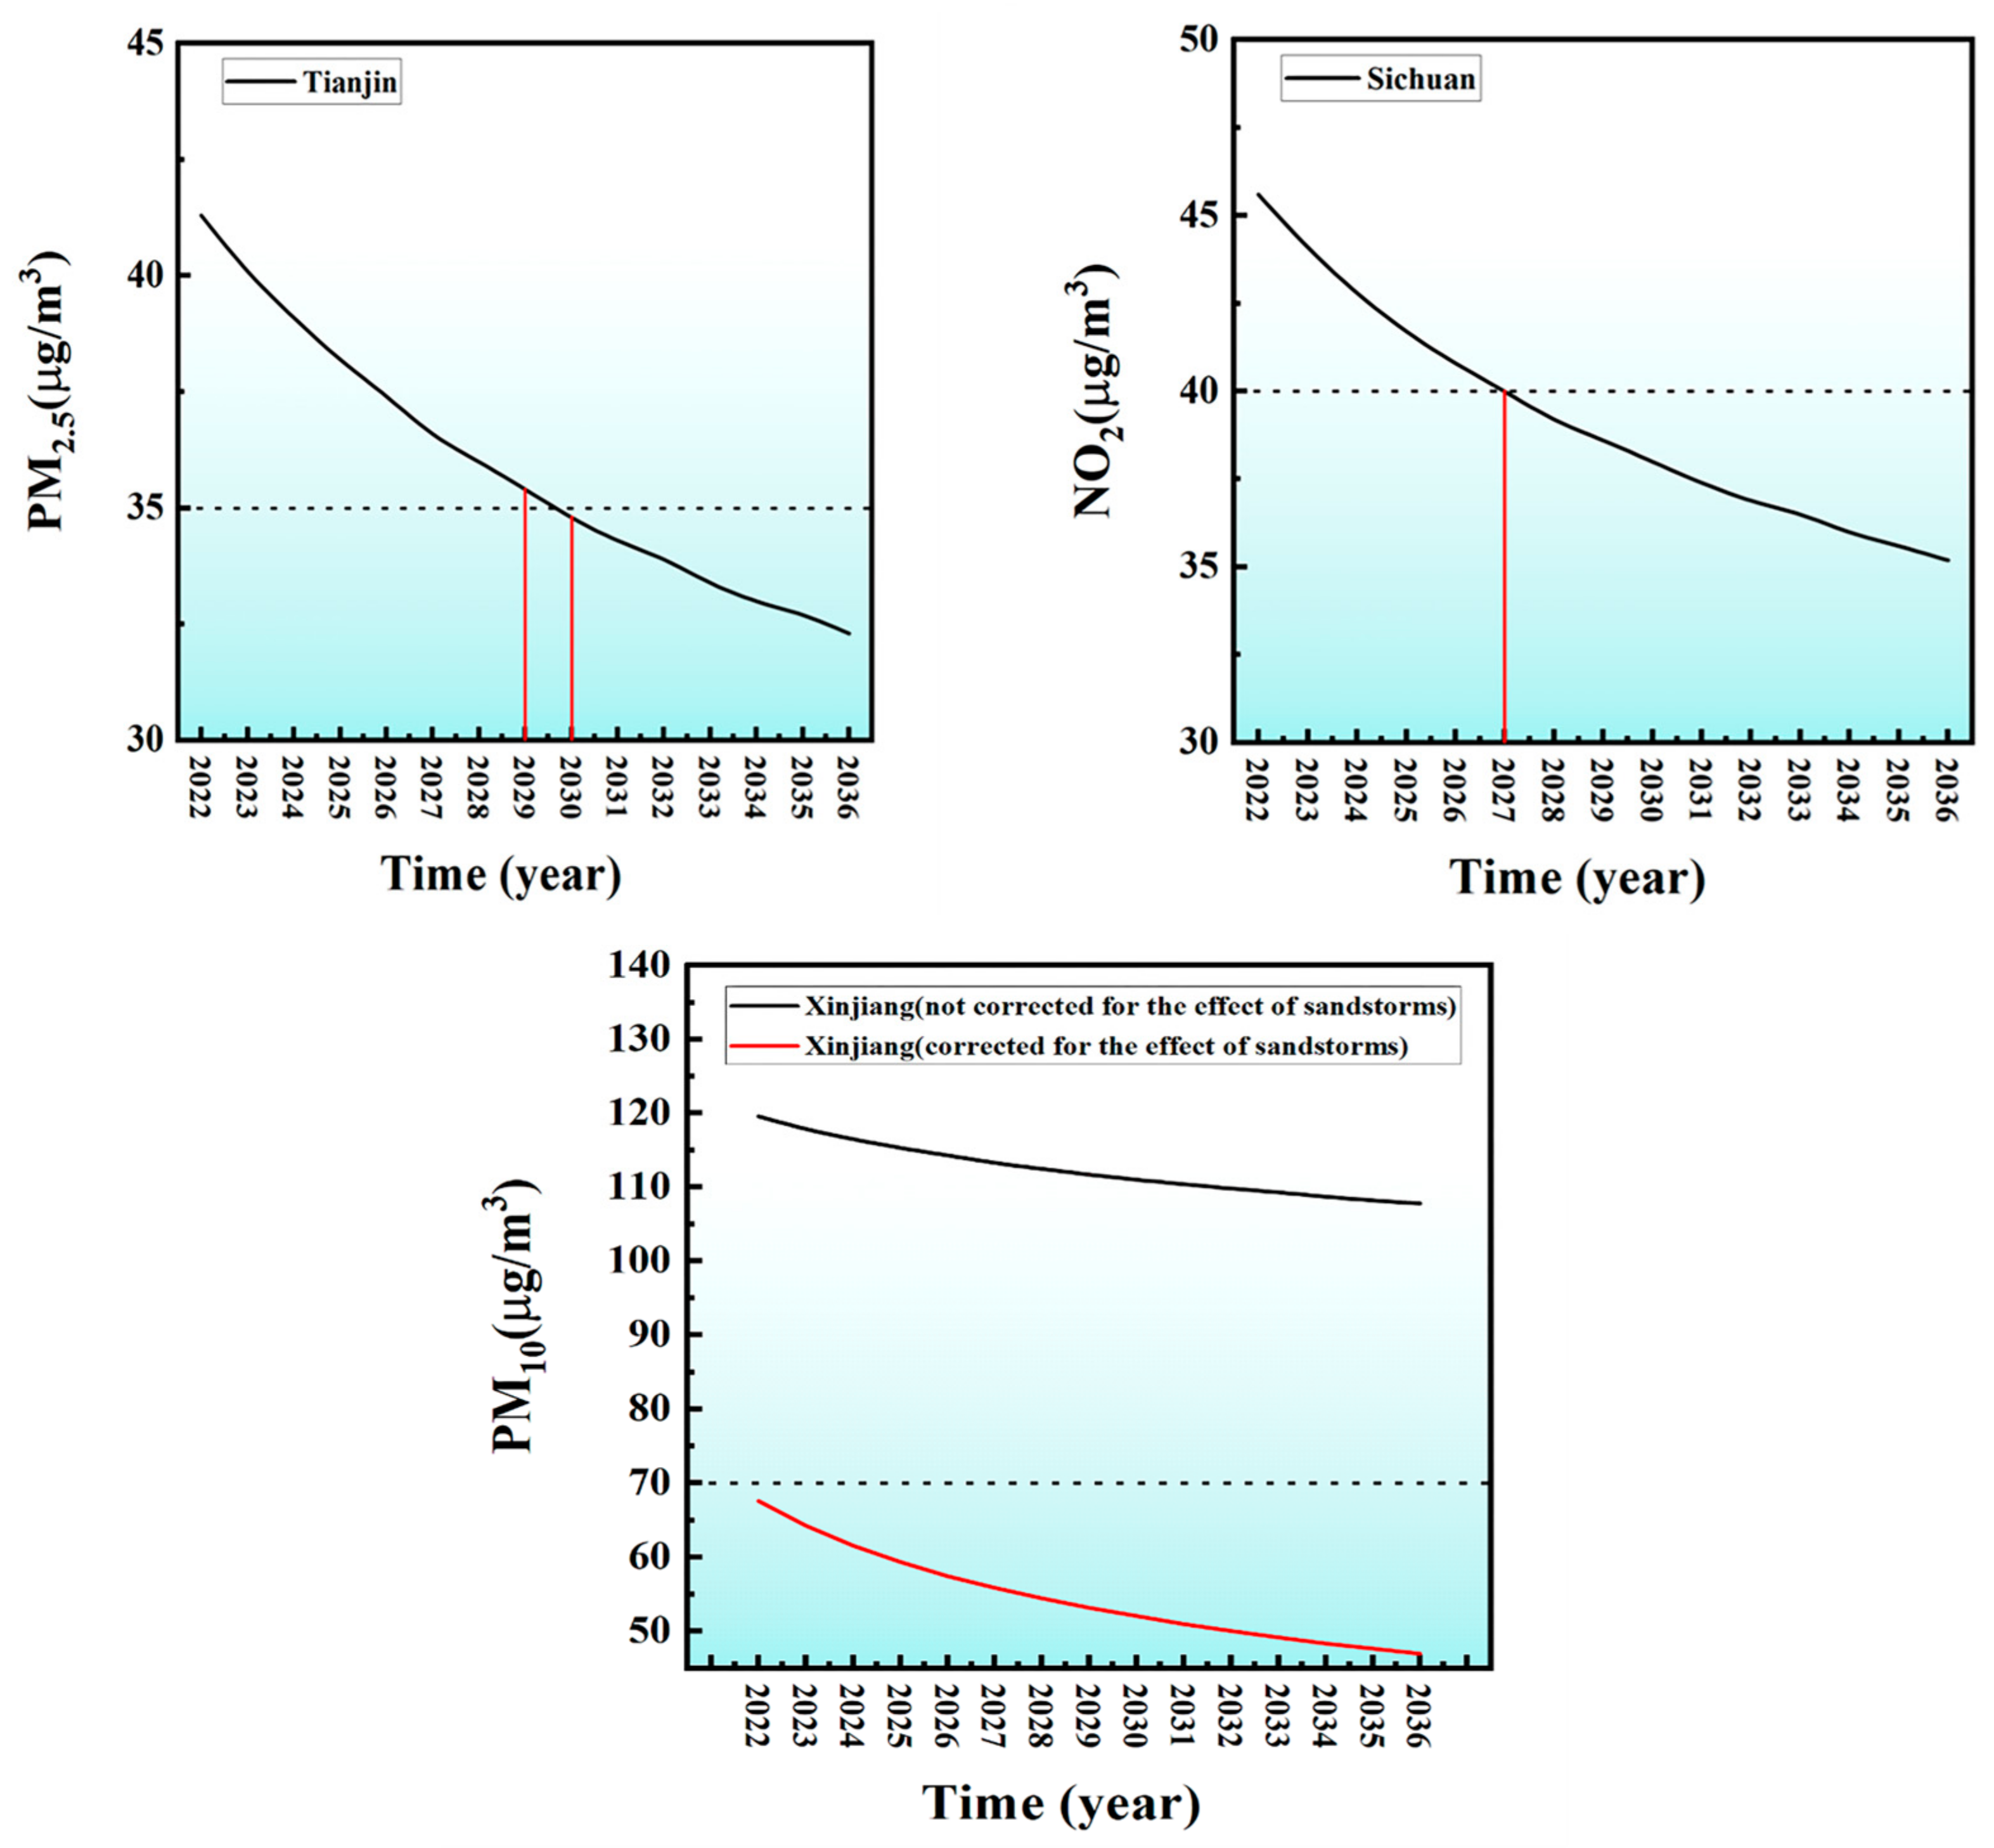
As shown by the above six sectors, the annual mean PM2.5 concentration in Tianjin is projected to show a decreasing trend over the 2022–2026 period, but it will still not reach the Class II threshold concentration by 2026. The annual mean NO2 concentration in Sichuan also shows a decreasing trend, but it will still not reach the Class II threshold concentration by 2026. And the annual mean PM10 concentration in Xinjiang (not corrected for the effect of sandstorms) shows a decreasing trend, but it will still not reach the Class II threshold concentration by 2026.
Tianjin, Sichuan, and Xinjiang (not corrected for the effect of sandstorms) show a decreasing trend in mean annual PM2.5, NO2, and PM10 concentrations, respectively. Mean annual PM2.5, NO2, and PM10 concentrations in the three provinces over the next 15 years were predicted using the FGM(1,1). The predicted values are shown in Table 17, and the predicted trends are shown in Figure 14.
As shown in Table 17, the annual mean PM2.5 concentration in Tianjin will reach the Class II threshold concentration by 2030, and the annual mean NO2 concentration in Sichuan will reach the Class II threshold concentration by 2027, but the annual mean PM10 concentration in Xinjiang (not corrected for the effect of sandstorms) will still not reach the Class II threshold concentration by 2036.
With continuous development, cities become increasingly dependent on transportation, which leads to heavy consumption of fossil fuels and the release of pollutants that affect air quality [42]. Many cities are continually being developed, and the numerous building sites and massive trucks transporting goods to these sites can contribute to air pollution [43]. Some factories fail to treat wastewater and exhaust gases as per national standards, but instead discharge pollutants directly into the environment, resulting in deteriorating environmental quality [44,45]. The reduction in surface vegetation cover and overexploitation activities, such as the overgrazing of pastures and the destruction of natural vegetation, also promote the occurrence of sandstorms [46].
Therefore, in this study, the FGM(1,1) model was utilized to estimate the pollution of 27 Chinese provinces based on data from six main air pollutants (PM2.5, PM10, SO2, NO2, O3, and CO) from 2017 to 2021. The annual mean concentrations of six major pollutants and their changing trends in each province from 2022 to 2026 were calculated. Compared with the traditional GM(1,1) model, this model optimizes the method of model accumulation and improves prediction accuracy.
The findings suggest that Tianjin may satisfy the Class II air quality criteria in 2030 but is predicted to fall short by 2026 with respect to the annual mean PM2.5 concentration. Shanxi and Hebei are expected to reach the Class II air quality standard in 2023 and 2024, respectively. While not being corrected for the effect of sandstorms, Xinjiang is expected to reach the Class II air quality standard in 2025; the other 23 provinces already reached the Class II air quality standard in 2021. For the annual mean PM10 concentration, it is estimated that, corrected for the effect of sandstorms, Xinjiang is expected to reach the Class II air quality standard in 2022. It is expected that, when not corrected for the effect of sandstorms, Xinjiang will not reach the Class II air quality standard in 2036, but the overall trend is downward; the other 26 provinces already reached the Class II air quality standard in 2021. For the annual mean NO2 concentration, it is estimated that by 2026, 26 provinces will meet the Class I air quality standard. Sichuan will not yet reach the Class II air quality standard by 2026, but is expected to reach the standard by 2027. For the annual mean SO2 concentration, it is estimated that by 2026, 27 provinces will reach the Class II air quality standard; however, SO2 is on the rise in Chongqing. For the annual mean O3 concentration, it is estimated that by 2026, 27 provinces will reach the Class II air quality standard level; however, O3 is on the rise in Xinjiang. For the annual mean CO concentration, it is estimated that by 2026, 27 provinces will reach the Class I air quality standard; however, CO is on the rise in Xinjiang.
This shows that China’s government has realized certain achievements in environmental protection in recent years. In the future, reducing PM2.5 concentrations in the air will be the focus of governance in Tianjin, Shanxi, Hebei, and Xinjiang (not corrected for the effect of sandstorms), PM10 concentrations will be the focus of governance in Xinjiang, and NO2 concentrations will be the focus of governance in Sichuan. Importantly, controlling SO2 concentrations will be the focus of governance in Chongqing, CO concentrations will be the focus of governance in Xinjiang, and O3 concentrations will be the focus of governance in Xinjiang.
The primary research challenge is the difficulty in acquiring data. The data obtained are highly volatile, requiring the adjustment of various methods to uncover the underlying patterns. In future studies on air quality, the concentrations of the six major pollutants can be utilized to create a comprehensive air quality index. This index can be used to predict the regional air quality for each province. Considering the spatial spillover effect, there may be a correlation between the air quality of different provinces. Therefore, future research directions will focus on the spatiotemporal prediction of air quality.

Author Contributions

K.Z.: conceptualization; data curation; investigation; methodology; formal analysis; writing—original draft; visualization and validation. L.X.: conceptualization; supervision; and writing—original draft. All authors have read and agreed to the published version of the manuscript.

Funding

The relevant research is supported by the key research project in humanity and social science of the Hebei Education Department (ZD202211).

Institutional Review Board Statement

Not applicable.

Informed Consent Statement

Not applicable.

Data Availability Statement

The data are available upon request.

Conflicts of Interest

The authors declare no conflict of interest.

References

  1. Yan, B.; Wu, L.; Chen, B.; Yang, Z.; Wu, J. How is air pollution regulated in China? A comparative case study on City X’s action network. China Popul. Resour. Environ. 2020, 30, 82–92. [Google Scholar]
  2. Li, L.; Xing, C.; Zhou, J.; Niu, L.; Luo, B.; Song, M.; Niu, J.; Ruan, Y.; Sun, X.; Lei, Y. Airborne particulate matter (PM2.5) triggers ocular hypertension and glaucoma through pyroptosis. Part. Fibre Toxicol. 2021, 18, 10. [Google Scholar] [CrossRef] [PubMed]
  3. Dong, Y. A study on ambient air quality’s effects on public health in China: Based on comparative analysis with G20. Popul. Econ. 2018, 2, 57–68. [Google Scholar]
  4. Van Zoest, V.; Hoek, G.; Osei, F.; Stein, A. Bayesian analysis of the short-term association of NO2 exposure with local burden of asthmatic symptoms in children. Sci. Total Environ. 2020, 720, 137544. [Google Scholar] [CrossRef] [PubMed]
  5. Guo, J.; Chen, Y.; Wu, L. Using the quarterly compound fractional grey model to predict the air quality in 22 cities of China. J. Math. 2021, 2021, 4959457. [Google Scholar] [CrossRef]
  6. Hasnain, A.; Sheng, Y.; Hashmi, M.Z.; Bhatti, U.A.; Hussain, A.; Hameed, M.; Marjan, S.; Bazai, S.U.; Hossain, M.A.; Sahabuddin; et al. Time series analysis and forecasting of air pollutants based on prophet forecasting model in Jiangsu province, China. Front. Environ. Sci. 2022, 10, 945628. [Google Scholar] [CrossRef]
  7. Xing, J.; Zheng, S.; Ding, D.; Kelly, J.T.; Wang, S.; Li, S.; Qin, T.; Ma, M.; Dong, Z.; Jang, C.; et al. Deep learning for prediction of the air quality response to emission changes. Environ. Sci. Technol. 2020, 54, 8589–8600. [Google Scholar] [CrossRef]
  8. Wang, Y.; Wen, Y.; Wang, Y.; Zhang, S.; Zhang, K.M.; Zheng, H.; Xing, J.; Wu, Y.; Hao, J. Four-month changes in air quality during and after the COVID-19 lockdown in six megacities in China. Environ. Sci. Technol. Lett. 2020, 7, 802. [Google Scholar] [CrossRef]
  9. Li, K.; Fang, L.; He, L. How population and energy price affect China’s environmental pollution. Energy Policy 2019, 129, 386–396. [Google Scholar] [CrossRef]
  10. Zhao, X.; Zhou, W.; Han, L.; Locke, D. Spatiotemporal variation in PM2.5 concentrations and their relationship with socioeconomic factors in China’s major cities. Environ. Int. 2019, 133 Pt A, 105145. [Google Scholar] [CrossRef]
  11. Han, X.; Li, H.; Liu, Q.; Liu, F.; Arif, A. Analysis of influential factors on air quality from global and local perspectives in China. Environ. Pollut. 2019, 248, 965–979. [Google Scholar] [CrossRef] [PubMed]
  12. Gurjar, B.R.; Ravindra, K.; Nagpure, A.S. Air pollution trends over Indian megacities and their local-to-global implications. Atmos. Environ. 2016, 142, 475–495. [Google Scholar] [CrossRef]
  13. Franceschi, F.; Cobo, M.; Figueredo, M. Discovering relationships and forecasting PM10 and PM2.5 concentrations in Bogotá, Colombia, using artificial neural networks, principal component analysis, and k-means clustering. Atmos. Pollut. Res. 2018, 9, 912–922. [Google Scholar] [CrossRef]
  14. Shahbazi, H.; Karimi, S.; Hosseini, V.; Yazgi, D.; Torbatian, S. A novel regression imputation framework for Tehran air pollution monitoring network using outputs from WRF and CAMx models. Atmos. Environ. 2018, 187, 24–33. [Google Scholar] [CrossRef]
  15. Patricio, P.; Jorge, R. An integrated neural network model for PM10 forecasting. Atmos. Environ. 2006, 40, 2845–2851. [Google Scholar]
  16. Kalapanidas, E.; Avouris, N. Short-term air quality prediction using a case-based classifier. Environ. Model. Softw. 2001, 16, 263–272. [Google Scholar] [CrossRef]
  17. Khanna, N. Measuring environmental quality: An index of pollution. Ecol. Econ. 2000, 35, 191–202. [Google Scholar] [CrossRef]
  18. Wu, L.; Liu, S.; Fang, Z.; Xu, H. Properties of the GM(1, 1) with fractional order accumulation. Appl. Math. Comput. 2015, 252, 287–293. [Google Scholar] [CrossRef]
  19. Wu, L.; Zhao, H. Forecasting air quality indicators for 33 cities in China. Clean—Soil Air Water 2020, 48, 1900097. [Google Scholar] [CrossRef]
  20. Wu, L.; Liu, S.; Yao, L.; Yan, S.; Liu, D. Grey system model with the fractional order accumulation. Commun. Nonlinear Sci. Numer. Simul. 2013, 18, 1775–1785. [Google Scholar] [CrossRef]
  21. Meng, X.; Fan, F.; Wu, L. Prediction of major pollutants discharge from wastewater in 31 cities of China. Sustain. Prod. Consum. 2021, 26, 54–64. [Google Scholar]
  22. Liu, S.; Deng, J. The range suitable for GM(1, 1). Syst. Eng.—Theory Pract. 2000, 20, 121–124. [Google Scholar]
  23. Shi, X. Research advances on the epidemiological study on acute health effects of ambient fine particulate matter and related components. J. Shandong Univ. Health Sci. 2018, 56, 1–11. [Google Scholar]
  24. Chen, G.; Zhang, W.; Li, S.; Zhang, Y.; Williams, G.; Huxley, R.; Ren, H.; Cao, W.; Guo, Y. The impact of ambient fine particles on influenza transmission and the modification effects of temperature in China: A multi-city study. Environ. Int. 2017, 98, 82–88. [Google Scholar] [CrossRef] [PubMed]
  25. Tie, X.X.; Wu, D.; Brasseur, G. Lung cancer mortality and exposure to atmospheric aerosol particles in Guangzhou, China. Atmos. Environ. 2009, 43, 2375–2377. [Google Scholar] [CrossRef]
  26. Cao, J.J.; Xu, H.M.; Xu, Q.; Chen, B.; Kan, H. Fine participate matter constituents and cardiopulmonary mortality in a heavily polluted Chinese city. Environ. Health Perspect. 2012, 120, 373–378. [Google Scholar] [CrossRef] [Green Version]
  27. Liu, C. PM2.5 sources and pollution control countermeasures. Leather Manuf. Environ. Technol. 2022, 3, 97–98+114. [Google Scholar]
  28. Zhao, X.; Zhao, X.; Liu, P.; Ye, C.; Xue, C.; Zhang, C.; Zhang, Y.; Liu, C.; Liu, J.; Chen, H.; et al. Pollution levels, composition characteristics and sources of atmospheric PM2.5 in a rural area of the North China Plain during winter. J. Environ. Sci. 2020, 95, 172–182. [Google Scholar] [CrossRef] [PubMed]
  29. Guo, J.; Tu, L.; Qiao, Z.; Wu, L. Forecasting the air quality in 18 cities of Henan Province by the compound accumulative grey model. J. Clean. Prod. 2021, 310, 127582. [Google Scholar] [CrossRef]
  30. Shen, G. Thoughts on urban motor vehicle exhaust pollution and control countermeasures. Environ. Dev. 2019, 31, 50+52. [Google Scholar]
  31. Wang, R.; Ayxamgvl; Yu, L.; Abdukirem; Li, F. Sandstorm weather in Kashgar Prefecture of Xinjiang Region: Spatial and temporal distribution characteristics and control measures. J. Glaciol. Geocryol. 2016, 38, 1553–1559. [Google Scholar]
  32. Choi, H.; Kang, Y.; Im, J.; Park, S.; Shin, M.; Kim, S.-M. Monitoring ground-level SO2 concentrations based on a stacking ensemble approach using satellite data and numerical models. Korean J. Remote Sens. 2020, 36, 1053–1066. [Google Scholar]
  33. Bu, X.; Fang, Z.; Feng, Q.; Liao, C.; Wang, H. Comprehensive evaluation of air quality based on principal component analysis—Take 21 cities in Sichuan province as an example. Sichuan Environ. 2023, 42, 51–56. [Google Scholar]
  34. Han, Y.; Zhou, G.; Chen, D.; Jiang, W.; Min, F. Analysis on distribution characteristics of air pollution and it’s correlation with meteorological factors in Chongqing area. Sichuan Environ. 2022, 41, 79–87. [Google Scholar]
  35. Jiang, W.; Zhou, G.; Chen, D.; Han, Y.; Wu, Z.; Zou, Q. Analysis on characteristics and influencing meteorological factors of air pollution in central urban area of Chongqing. J. Southwest China Norm. Univ. Nat. Sci. Ed. 2022, 47, 74–81. [Google Scholar]
  36. Wu, H.; Xing, B.; Lyu, Y. Spatiotemporal variations of air pollutants in the Beijing-Tianjin-Hebei region from 2015 to 2021. Ecol. Environ. Monit. Three Gorges 2023, 8, 17–27. [Google Scholar]
  37. Gong, T.; Zhang, Y.; Liu, B. Prediction of nitrogen dioxide concentration based on signal improvement deep learning neural network in Beijing-Tianjin-Hebei urban agglomeration. Environ. Monit. China 2021, 37, 120–128. [Google Scholar]
  38. Cao, Y.; Cheng, X.; Zhao, X. Distribution and variation of tropospheric NO2 column density over Sichuan province during 2010–2019. Meteorol. Environ. Sci. 2022, 45, 63–70. [Google Scholar]
  39. Cullis, C.F.; Hirschler, M.M. Man’s emissions of carbon monoxide and hydrocarbons into the atmosphere. Atmos. Environ. 1989, 23, 1195–1203. [Google Scholar] [CrossRef]
  40. Wang, L.; Zhang, Q.; Hao, J.; He, K. Anthropogenic CO emission inventory of Mainland China. Acta Sci. Circumst. 2005, 12, 8–13. [Google Scholar]
  41. Yu, R.; Lin, Y.; Zou, J.; Dan, Y.; Cheng, C. Review on atmospheric ozone pollution in China: Formation, spatiotemporal distribution, precursors and affecting factors. Atmosphere 2021, 12, 1675. [Google Scholar] [CrossRef]
  42. Zhang, S.; Worrell, E.; Crijins-Graus, W.; Wagner, F.; Cofala, J. Co-benefits of energy efficiency improvement and air pollution abate-ment in the Chinese iron and steel industry. Energy 2014, 78, 333–345. [Google Scholar] [CrossRef]
  43. Zhou, P. Influence and control of construction engineering on atmospheric environmental pollution. Leather Manuf. Environ. Technol. 2021, 2, 44–45. [Google Scholar]
  44. Zhang, S. Research on measures to improve long-term mechanism of air pollution prevention and control in steel industry cities. China Resour. Compr. Util. 2019, 37, 125–127. [Google Scholar]
  45. Zhang, D. Current situation of urban air pollution in China and its prevention and control measures. China Resour. Compr. Util. 2019, 37, 156–158. [Google Scholar]
  46. Han, X. Harm situation and control measures of sandstorm in northern region of China. J. Soil Water Conserv. 2003, 3, 167–169. [Google Scholar]
Figure 1. Geographical locations of 27 Chinese provinces.
Atmosphere 14 01211 g001
Figure 2. Decreasing trends of annual mean PM2.5 concentration in six provinces.
Atmosphere 14 01211 g002
Figure 3. Predicted trends of annual mean PM2.5 concentration in four provinces.
Atmosphere 14 01211 g003
Figure 4. Decreasing trends of annual mean PM10 concentration in six provinces.
Atmosphere 14 01211 g004
Figure 5. Predicted trend of annual mean PM10 concentration in Xinjiang.
Atmosphere 14 01211 g005
Figure 6. Decreasing trends of annual mean SO2 concentration in six provinces.
Atmosphere 14 01211 g006
Figure 7. Predicted trend of annual mean SO2 concentration in Chongqing.
Atmosphere 14 01211 g007
Figure 8. Decreasing trends of annual mean SO2 concentration in six provinces.
Atmosphere 14 01211 g008
Figure 9. Predicted trend of annual mean NO2 concentration in Sichuan.
Atmosphere 14 01211 g009
Figure 10. Decreasing trends of annual mean CO concentration in six provinces.
Atmosphere 14 01211 g010
Figure 11. Predicted trend of annual mean CO concentration in Xinjiang.
Atmosphere 14 01211 g011
Figure 12. Decreasing trends of annual mean O3 concentration in six provinces.
Atmosphere 14 01211 g012
Figure 13. Predicted trend of annual mean O3 concentration in Xinjiang.
Atmosphere 14 01211 g013
Figure 14. Predicted trends in Sichuan, Tianjin, and Xinjiang over the next 15 years.
Atmosphere 14 01211 g014
Table 1. The provinces represented by the geographical location numbers.
NumberProvinceNumberProvinceNumberProvinceNumberProvince
1Beijing2Tianjin3Chongqing4Hebei
5Shanxi6Liaoning7Jilin8Heilongjiang
9Shanghai10Jiangsu11Zhejiang12Anhui
13Fujian14Jiangxi15Hubei16Hunan
17Guangdong18Hainan19Sichuan20Guizhou
21Shaanxi22Gansu23Yunnan24Qinghai
25Inner Mongolia26Guangxi27Xinjiang
Table 2. Fitting results of PM2.5 indicators in Anhui Province (Unit: µg/m3).
YearActual ValueFGM(1,1)GM(1,1)
20175656.056.0
20184949.249.8
20194644.644.4
20203939.639.6
20213535.035.3
MAPE (%) 1.01.4
Table 3. Predicted results for PM2.5 concentration in Anhui Province (Unit: µg/m3).
YearFGM(1,1)
202230.9
202327.5
202424.7
202522.3
202620.4
Table 4. Comparison of predicted and actual values for six indicators in Anhui Province in 2021.
Actual ValuePredicted ValueMAPE (%)
PM2.53535.51.4
SO286.60.5
NO22626.10.8
PM106156.11.5
CO1.01.01.8
O31481411.4
Note: The unit for PM2.5, SO2, NO2, PM10, and O3 is µg/m3, and the unit for CO is mg/m3.
Table 5. PM2.5 concentration data for 27 provinces of China (Unit: µg/m3).
Province20172018201920202021MAPE (%)
Beijing58514238331.6
Tianjin62525148395.2
Chongqing45403833352.4
Hebei655650.244.838.81.9
Shanxi59554844390.9
Liaoning44384038352.0
Jilin40323231263.1
Heilongjiang36282828261.2
Shanghai39363532272.0
Jiangsu49484338330.2
Zhejiang35313125242.7
Anhui56494639351.0
Fujian25222118181.9
Jiangxi46383530291.5
Hubei49444235342.0
Hunan46414135352.2
Guangdong33312722222.8
Hainan18171613132.8
Sichuan13.912.29.4883.2
Guizhou1312101083.8
Shaanxi57514843361.7
Gansu33342626233.6
Yunnan24252221223.0
Qinghai30312321215.5
Inner Mongolia32312727232.4
Guangxi38353426284.5
Xinjiang
(Not corrected for the effect of sandstorms)
55474747421.7
Xinjiang
(Corrected for the effect of sandstorms)
46413835311.3
Table 6. PM2.5 concentration prediction data for 27 provinces of China (Unit: µg/m3).
Province20222023202420252026
Beijing28.926.023.721.920.4
Tianjin41.340.139.138.237.4
Chongqing33.532.832.231.631.2
Hebei37.935.934.332.931.8
Shanxi35.532.730.628.827.3
Liaoning33.932.030.128.226.4
Jilin25.123.121.319.518.0
Heilongjiang25.524.523.522.421.4
Shanghai24.922.219.817.816.0
Jiangsu28.925.121.919.116.7
Zhejiang22.020.419.117.917.0
Anhui30.927.524.722.320.4
Fujian17.216.616.115.715.3
Jiangxi26.925.524.323.322.5
Hubei31.629.928.527.326.4
Hunan33.632.431.530.729.9
Guangdong20.019.018.117.416.8
Hainan11.911.210.710.39.9
Sichuan7.47.06.76.46.2
Guizhou7.97.57.26.96.6
Shaanxi32.528.725.422.620.2
Gansu21.220.019.118.417.7
Yunnan20.820.520.219.919.7
Qinghai19.017.415.613.811.8
Inner Mongolia21.519.718.016.515.1
Guangxi25.123.722.621.720.9
Xinjiang
(Not corrected for the effect of sandstorms)
40.738.436.033.731.5
Xinjiang
(Corrected for the effect of sandstorms)
28.928.126.825.724.8
Table 7. PM10 concentration data for 27 provinces of China (Unit: µg/m3).
Province20172018201920202021MAPE (%)
Beijing84786856552.4
Tianjin94827668691.5
Chongqing72646055540.9
Hebei1171049379700.7
Shanxi1091079383740.5
Liaoning77697064601.1
Jilin67575652471.1
Heilongjiang61524946430.2
Shanghai55514541350.9
Jiangsu81767059571.8
Zhejiang57525345472.8
Anhui88767261612.0
Fujian45423934343.0
Jiangxi73645951511.9
Hubei77727057583.1
Hunan74666150503.0
Guangdong51494638403.4
Hainan29302825251.6
Sichuan4238.634.431322.3
Guizhou29282422233.2
Shaanxi1031048172661.8
Gansu76775856554.0
Yunnan44463833343.2
Qinghai67704642383.8
Inner Mongolia74806153512.6
Guangxi58575645483.9
Xinjiang
(Not corrected for the effect of sandstorms)
1211401261211252.4
Xinjiang
(Corrected for the effect of sandstorms)
94998775742.1
Table 8. PM10 concentration prediction data for 27 provinces of China (Unit: µg/m3).
Province20222023202420252026
Beijing50.647.945.743.942.4
Tianjin66.264.563.262.161.2
Chongqing51.950.248.647.245.8
Hebei62.155.951.047.143.9
Shanxi64.957.450.744.939.7
Liaoning56.051.948.044.541.2
Jilin43.840.136.733.630.8
Heilongjiang40.538.035.733.531.4
Shanghai31.527.924.721.919.4
Jiangsu52.749.747.445.543.9
Zhejiang46.345.745.244.844.4
Anhui57.654.852.450.348.5
Fujian31.729.927.925.723.2
Jiangxi48.245.943.942.240.6
Hubei55.853.852.250.949.7
Hunan45.842.038.134.230.1
Guangdong37.336.035.034.033.3
Hainan22.721.219.918.617.3
Sichuan29.428.427.626.826.2
Guizhou20.820.119.519.018.6
Shaanxi62.559.256.554.352.5
Gansu52.650.849.348.047.0
Yunnan32.131.030.129.328.7
Qinghai33.631.229.327.726.4
Inner Mongolia47.044.542.540.939.5
Guangxi44.843.241.940.839.9
Xinjiang
(Not corrected for the effect of sandstorms)
119.6117.9116.5115.3114.3
Xinjiang
(Corrected for the effect of sandstorms)
67.664.361.659.457.5
Table 9. SO2 concentration data for 27 provinces of China (Unit: µg/m3).
Province20172018201920202021MAPE (%)
Beijing864435.2
Tianjin161211884.0
Chongqing1297896.3
Hebei27201513102.2
Shanxi56332419150.6
Liaoning28231916140.6
Jilin20141112113.3
Heilongjiang1512111192.5
Shanghai12107664.3
Jiangsu16129871.5
Zhejiang977662.4
Anhui171310882.9
Fujian1098663.8
Jiangxi23171313122.5
Hubei13119882.7
Hunan14129883.7
Guangdong11109881.9
Hainan555550.2
Sichuan31.530.127.825241.1
Guizhou21201815152.5
Shaanxi20161210103.5
Gansu21181412134.9
Yunnan12119884.2
Qinghai20171313146.4
Inner Mongolia21171514112.2
Guangxi14131210102.5
Xinjiang13119871.0
Table 10. SO2 concentration prediction data for 27 provinces of China (Unit: µg/m3).
Province20222023202420252026
Beijing2.62.22.01.81.7
Tianjin7.26.76.35.95.6
Chongqing9.29.610.110.611.0
Hebei8.37.06.05.34.7
Shanxi12.610.89.48.47.6
Liaoning12.211.010.19.38.7
Jilin10.710.610.410.310.2
Heilongjiang8.57.87.16.56.0
Shanghai5.14.74.54.24.0
Jiangsu6.35.85.55.35.1
Zhejiang5.55.14.74.34.0
Anhui7.06.56.15.85.5
Fujian5.34.94.64.34.1
Jiangxi11.511.211.010.910.8
Hubei7.16.76.46.26.0
Hunan7.36.96.66.36.1
Guangdong7.67.26.96.66.3
Hainan4.94.94.84.84.7
Sichuan23.122.321.621.020.6
Guizhou13.612.812.211.711.3
Shaanxi8.57.97.47.16.7
Gansu11.210.610.19.79.4
Yunnan7.97.67.47.27.1
Qinghai12.712.211.611.210.7
Inner Mongolia10.08.77.76.86.1
Guangxi9.18.68.27.97.6
Xinjiang6.45.95.55.25.0
Table 11. NO2 concentration data for 27 provinces of China (Unit: µg/m3).
Province20172018201920202021MAPE (%)
Beijing46423729261.8
Tianjin50474239370.4
Chongqing46444039322.1
Hebei47433934310.7
Shanxi42403935311.8
Liaoning31302827260.7
Jilin28242322210.1
Heilongjiang23211918192.7
Shanghai44424237433.9
Jiangsu39383430291.4
Zhejiang27253129293.6
Anhui38353129260.8
Fujian18171513132.1
Jiangxi26252422221.2
Hubei28282622222.3
Hunan26262521212.4
Guangdong29282621223.6
Hainan988772.0
Sichuan67.762.652.949492.2
Guizhou50493833354.6
Shaanxi42403631301.7
Gansu29272524241.1
Yunnan19181616142.3
Qinghai22212019180.1
Inner Mongolia26232321191.3
Guangxi23222218193.4
Xinjiang31272724252.1
Table 12. NO2 concentration prediction data for 27 provinces of China (Unit: µg/m3).
Province20222023202420252026
Beijing22.820.418.617.216.1
Tianjin35.534.233.232.431.6
Chongqing29.426.123.220.718.4
Hebei27.524.622.019.717.6
Shanxi30.028.427.025.924.9
Liaoning25.825.425.024.724.4
Jilin20.119.218.417.616.8
Heilongjiang18.418.117.817.517.2
Shanghai40.540.340.139.939.7
Jiangsu26.424.923.822.822.0
Zhejiang29.429.128.627.927.2
Anhui23.621.519.517.716.1
Fujian11.711.010.510.19.7
Jiangxi20.619.618.717.917.0
Hubei19.417.716.214.813.5
Hunan20.119.418.818.317.9
Guangdong19.618.517.616.916.3
Hainan6.76.56.36.16.0
Sichuan45.644.142.841.740.8
Guizhou30.028.427.226.125.2
Shaanxi27.525.924.723.722.9
Gansu23.523.122.822.522.2
Yunnan13.813.413.012.612.3
Qinghai17.116.315.514.713.9
Inner Mongolia17.616.114.713.412.3
Guangxi17.817.216.716.215.8
Xinjiang24.323.823.423.022.6
Table 13. CO concentration data for 27 provinces of China (Unit: mg/m3).
Province20172018201920202021MAPE (%)
Beijing2.11.71.41.31.11.5
Tianjin2.81.91.81.71.42.7
Chongqing1.41.31.21.11.00.4
Hebei2.92.32.11.81.42.9
Shanxi3.02.52.21.91.53.4
Liaoning1.81.71.71.61.50.4
Jilin1.71.41.31.41.14.0
Heilongjiang1.41.21.11.11.01.4
Shanghai1.41.31.11.10.93.0
Jiangsu1.51.41.21.11.00.8
Zhejiang1.11.11.00.90.91.6
Anhui1.41.41.21.11.01.0
Fujian1.01.01.00.90.81.3
Jiangxi1.41.41.41.21.11.5
Hubei1.71.61.41.31.21.0
Hunan1.61.51.41.21.11.0
Guangdong1.21.11.21.00.93.5
Hainan1.00.90.80.80.72.0
Sichuan1.41.31.11.11.13.4
Guizhou1.21.11.00.90.91.5
Shaanxi2.321.81.51.30.7
Gansu1.61.51.31.11.12.3
Yunnan1.11.01.01.01.00.1
Qinghai1.61.51.21.21.03.2
Inner Mongolia1.61.21.21.31.04.9
Guangxi1.41.41.41.11.13.2
Xinjiang2.41.10.90.80.80.8
Table 14. CO concentration prediction data for 27 provinces of China (Unit: mg/m3).
Province20222023202420252026
Beijing1.00.90.80.70.6
Tianjin1.31.21.11.00.9
Chongqing0.90.80.80.70.7
Hebei1.31.10.90.80.7
Shanxi1.51.41.31.21.2
Liaoning1.41.31.21.11.0
Jilin1.11.00.90.90.8
Heilongjiang1.00.90.90.90.9
Shanghai0.80.70.60.60.5
Jiangsu0.90.90.80.80.8
Zhejiang0.80.80.80.80.7
Anhui0.90.90.80.80.8
Fujian0.70.70.60.50.5
Jiangxi1.00.90.80.70.7
Hubei1.11.01.01.00.9
Hunan1.00.90.90.80.8
Guangdong0.80.80.70.60.6
Hainan0.70.60.60.50.5
Sichuan1.01.01.00.90.9
Guizhou0.80.80.80.80.8
Shaanxi1.11.00.80.70.7
Gansu1.00.90.90.90.8
Yunnan1.01.01.00.90.9
Qinghai0.90.80.70.60.5
Inner Mongolia1.01.00.90.90.8
Guangxi1.01.00.90.90.8
Xinjiang0.80.80.90.91.0
Table 15. O3 concentration data for 27 provinces of China (Unit: µg/m3).
Province20172018201920202021MAPE(%)
Beijing1931921911741492.0
Tianjin1922012001901602.2
Chongqing1631661571501271.3
Hebei1931931901741620.5
Shanxi1861821801691690.9
Liaoning1571571511461310.8
Jilin1351411291231160.6
Heilongjiang1061201031071113.9
Shanghai1811601511521450.8
Jiangsu1771771731641630.6
Zhejiang1351421541451421.3
Anhui1601661651481481.6
Fujian1221251171091071.0
Jiangxi1411451511381261.5
Hubei1391541581391381.8
Hunan1371401481261272.6
Guangdong1531541581381442.4
Hainan1071071181051112.8
Sichuan140.5144.4134.11351271.2
Guizhou1081161181101111.3
Shaanxi1661641511451461.3
Gansu1401391311261291.6
Yunnan1221141271201262.1
Qinghai1331321351241291.7
Inner Mongolia1431461371301321.3
Guangxi1281281401171223.5
Xinjiang124898787900.4
Table 16. O3 concentration prediction data for 27 provinces of China (Unit: µg/m3).
Province20222023202420252026
Beijing137.8124.1112.1101.893.1
Tianjin149.9135.5122.8111.8102.3
Chongqing116.7104.994.785.978.5
Hebei150.3140.0131.0123.3116.8
Shanxi164.8162.0159.6157.6155.8
Liaoning122.2112.2102.894.186.1
Jilin108.1101.495.189.283.6
Heilongjiang103.2101.499.998.697.5
Shanghai142.3139.3136.5133.8131.3
Jiangsu156.8152.2147.6143.2139.0
Zhejiang135.8128.9121.9115.3108.9
Anhui140.1135.1130.9127.3124.3
Fujian100.697.094.091.589.3
Jiangxi117.6107.999.091.083.8
Hubei131.6126.8122.8119.5116.6
Hunan121.9117.6114.0110.9108.2
Guangdong140.1137.7135.7133.9132.4
Hainan109.6108.5107.3106.2105.1
Sichuan122.7118.1113.7109.5105.4
Guizhou104.298.993.588.283.0
Shaanxi140.5138.1136.1134.4132.9
Gansu123.4121.3119.5118.0116.6
Yunnan124.7123.4121.5119.2116.5
Qinghai125.5123.6121.9120.3119.0
Inner Mongolia126.6124.4122.6121.0119.7
Guangxi116.9113.1109.8106.8104.2
Xinjiang92.294.696.798.7100.5
Table 17. Predicted values for Sichuan, Tianjin, and Xinjiang from 2022 to 2026 (Unit: µg/m3).
YearSichuanTianjinXinjiang
(Not Corrected for the Effect of Sandstorms)
Xinjiang
(Corrected for the Effect of Sandstorms)
NO2PM2.5PM10PM10
201767.76212194
201862.65214099
201952.95112687
202049.04812175
202149.03912574
202245.641.3119.667.6
202344.140.1117.964.3
202442.839.1116.561.6
202541.738.2115.359.4
202640.837.4114.357.5
202740.036.6113.355.9
202839.236.0112.554.5
202938.635.4111.753.2
203038.034.8111.052.1
203137.434.3110.451.0
203236.933.9109.850.1
203336.533.4109.349.2
203436.033.0108.748.4
203535.632.7108.247.7
203635.232.3107.847.0
Disclaimer/Publisher’s Note: The statements, opinions and data contained in all publications are solely those of the individual author(s) and contributor(s) and not of MDPI and/or the editor(s). MDPI and/or the editor(s) disclaim responsibility for any injury to people or property resulting from any ideas, methods, instructions or products referred to in the content.