Article

A Study of Drought and Flood Cycles in Xinyang, China, Using the Wavelet Transform and M-K Test

1
State Key Laboratory of Hydraulic Engineering Simulation and Safety, School of Civil Engineering, Tianjin University, Tianjin 300072, China
2
State Key Laboratory of Simulation and Regulation of Water Cycle in River Basin, China Institute of Water Resources and Hydropower Research, Beijing 100044, China
3
College of Water Conservancy & Architectural Engineering, Shihezi University, Shihezi 832000, China
4
Chinese Research Academy of Environmental Sciences, Beijing 100012, China
5
School of Economics and Management, Southwest University of Science and Technology, Mianyang 621010, China
6
College of Management and Economics, Tianjin University, Tianjin 300072, China
*
Authors to whom correspondence should be addressed.
Atmosphere 2023, 14(8), 1196; https://doi.org/10.3390/atmos14081196
Submission received: 21 June 2023 / Revised: 24 July 2023 / Accepted: 24 July 2023 / Published: 25 July 2023
(This article belongs to the Special Issue Extreme Events and Risk of Disasters)

Abstract

:
Accurately identifying and predicting droughts can provide local managers with a basis for decision-making. The Xinyang region is prone to droughts and floods, which have a large impact on local agriculture and socio-economics. This paper employs precipitation data from the Xinyang region to provide a scientific basis for drought and flood control measures in this region. The data are first treated with standardized precipitation indices (SPIs) on three-month, six-month, and nine-month time scales. Subsequently, a Morlet wavelet analysis is performed for each of the three time scales analyzed for the SPI. The results show multiple time scales of drought and flood disasters in the Xinyang region. The cycles of drought and flood disasters in the Xinyang region show different fluctuations on different SPI scales. The SPI time series reflect a strong fluctuation period of 17a for drought and flood disasters in the Xinyang region. An analysis of the variance of the wavelet coefficients showed that the first main cycle of drought and flood disasters in the Xinyang region is 7a, and the second and third sub-cycles are 4a and 13a, respectively. We conclude that floods are more frequent than droughts in Xinyang and are more likely to occur from 2017 to 2021, with a subsequent shift to droughts. Local managers should put drought prevention measures in place to deal with droughts after 2021.

1. Introduction

In the context of global warming, the frequency, intensity, and impact of extreme meteorological and hydrological events such as droughts, heat waves, and floods are changing due to atmospheric circulation anomalies [1,2]. Drought events since the 1980s have been characterized by their long duration, widespread impact, high intensity, and high temperatures. Droughts are a frequent natural phenomenon and disaster in human societies, and due to their chain of transmission effects, they can cause a range of ecological problems [3]. Droughts can cause a range of ecological problems, such as cyclical water deficits in vegetation, reduced net primary productivity, changes in the species diversity of vegetation communities, shifts in vegetation types, and reduced ecosystem resilience [4]. These ecological issues lead to a chain reaction in human societies that depend on the affected vegetation for key resources and services [5]. The 2012–2015 1000-year drought in California, USA, led to widespread coniferous forest die-off [6]. The 2002–2010 1000-year drought in Australia caused over AUD 8.0 × 10⁸ in ecological losses to key services provided by hydrological ecosystems in the Murray–Darling region [7]. The 2018 severe drought in northwestern Europe caused EUR 9.0 × 10⁸ in losses to Danish agriculture alone [8].
Drought indices are important for describing drought variability and quantifying drought intensity [9]. Most drought indices are derived by transforming a drought indicator or integrating multiple drought indicators to produce a new series that allows for a more accurate analysis of characteristics such as drought onset, intensity, and impact [10]. Prior to the 1970s, drought indices were mainly constructed based on station precipitation data. In 1970, with the development of remote sensing technology, a number of new large-scale drought monitoring indices emerged [11]. Researchers now use a range of analytical methods to apply remotely sensed precipitation data to drought monitoring. These include the calculation of long-term precipitation anomalies and precipitation indices, such as the precipitation condition index (PCI) [12], the standardized precipitation index (SPI) [13], and the standardized precipitation evapotranspiration index (SPEI) [14]. The SPI developed by McKee et al. is one of the most commonly used precipitation indices for remotely sensed data and can be calculated using only the precipitation amounts [15]. It has the same probability of occurrence and can represent flood and drought events in continuous statistics. Until recently, the application of the SPI in remote sensing studies has been limited by the need for long-term precipitation records for its calculation (traditionally 30 years). With the advent of long-term records, the SPI can be calculated using remote sensing data alone, greatly improving the monitoring of meteorological droughts at large spatial scales [16].
At present, there have been a large number of studies on drought indicators by related scholars in China. Huang Wanghua et al. [17] used precipitation distance level percentages to analyze seasonal droughts’ spatial and temporal characteristics in southern regions. Ma Jianyong et al. [18] used a Morlet wavelet analysis to conclude that the precipitation in northeast China showed 9a and 24a periodic oscillations from May to September 1961–2009. Qiao Li et al. [19] used the Palmer drought index and precipitation spacing percentages for a comparative analysis of drought characteristics in Shaanxi Province. Due to the large number of parameters required for the relative wetness index, the Palmer drought index is limited by the number of stations, the surface structure, and the level of data assimilation [20]. Many scholars have used different analytical methods to analyze the characteristics of temperature–climate, and precipitation changes in Henan Province since the 1950s and 1960s [21,22,23]. Zhong Xinghua, Zhu Wenjie, and Yang Jinsheng mainly explored the characteristics of the formation mechanism of heavy rainstorms in the Xinyang area [24,25,26,27,28]. Using SPI, Ye Zhengwei analyzed the characteristics of drought and flood evolution in Yancheng City between 1960 and 2009 [29]. Zakari used SPI3 indicators from 13 stations to analyze the drought characteristics, trends, and cycles of the stations [30]. There are many current drought indicators that reflect regions, but the SPI is considered by most scholars to be the most valid indicator because of its different time-scale properties [31]. In addition, using the M-K test to find quantitative and qualitative aspects of rainfall trends has proven very effective [32]. Along with the methods above, using a wavelet analysis can effectively identify the periodicity of droughts and will improve the accuracy of drought trend determination [33].
The study of the cycles of droughts and floods in the Xinyang region can provide an important reference for the short-term and medium-to-long-term forecasting of droughts and floods in the region. This is of great importance to agriculture, ecology, industrial production, and life in the region. However, there are no studies on the cycles of multiple droughts and floods in the Xinyang region of China. How can the cycles and frequency of droughts in the Xinyang region be identified to provide a scientific basis for local drought and flood control measures? In this paper, we aim to (1) characterize the different drought fluctuations in the Xinyang region through different scales of the SPI; (2) characterize the periodicity of droughts in the Xinyang region through a wavelet analysis; and (3) determine the sudden changes in and trend effects of droughts in the Xinyang region through the M-K test. The main contributions of this study are the identification of drought and flood cycles in the Xinyang region and the further exploration of the frequency of droughts and flooding in the Xinyang region. The study can provide a basis for local managers to make decisions. The research framework of this paper is as follows (Figure 1).

2. Materials and Methods
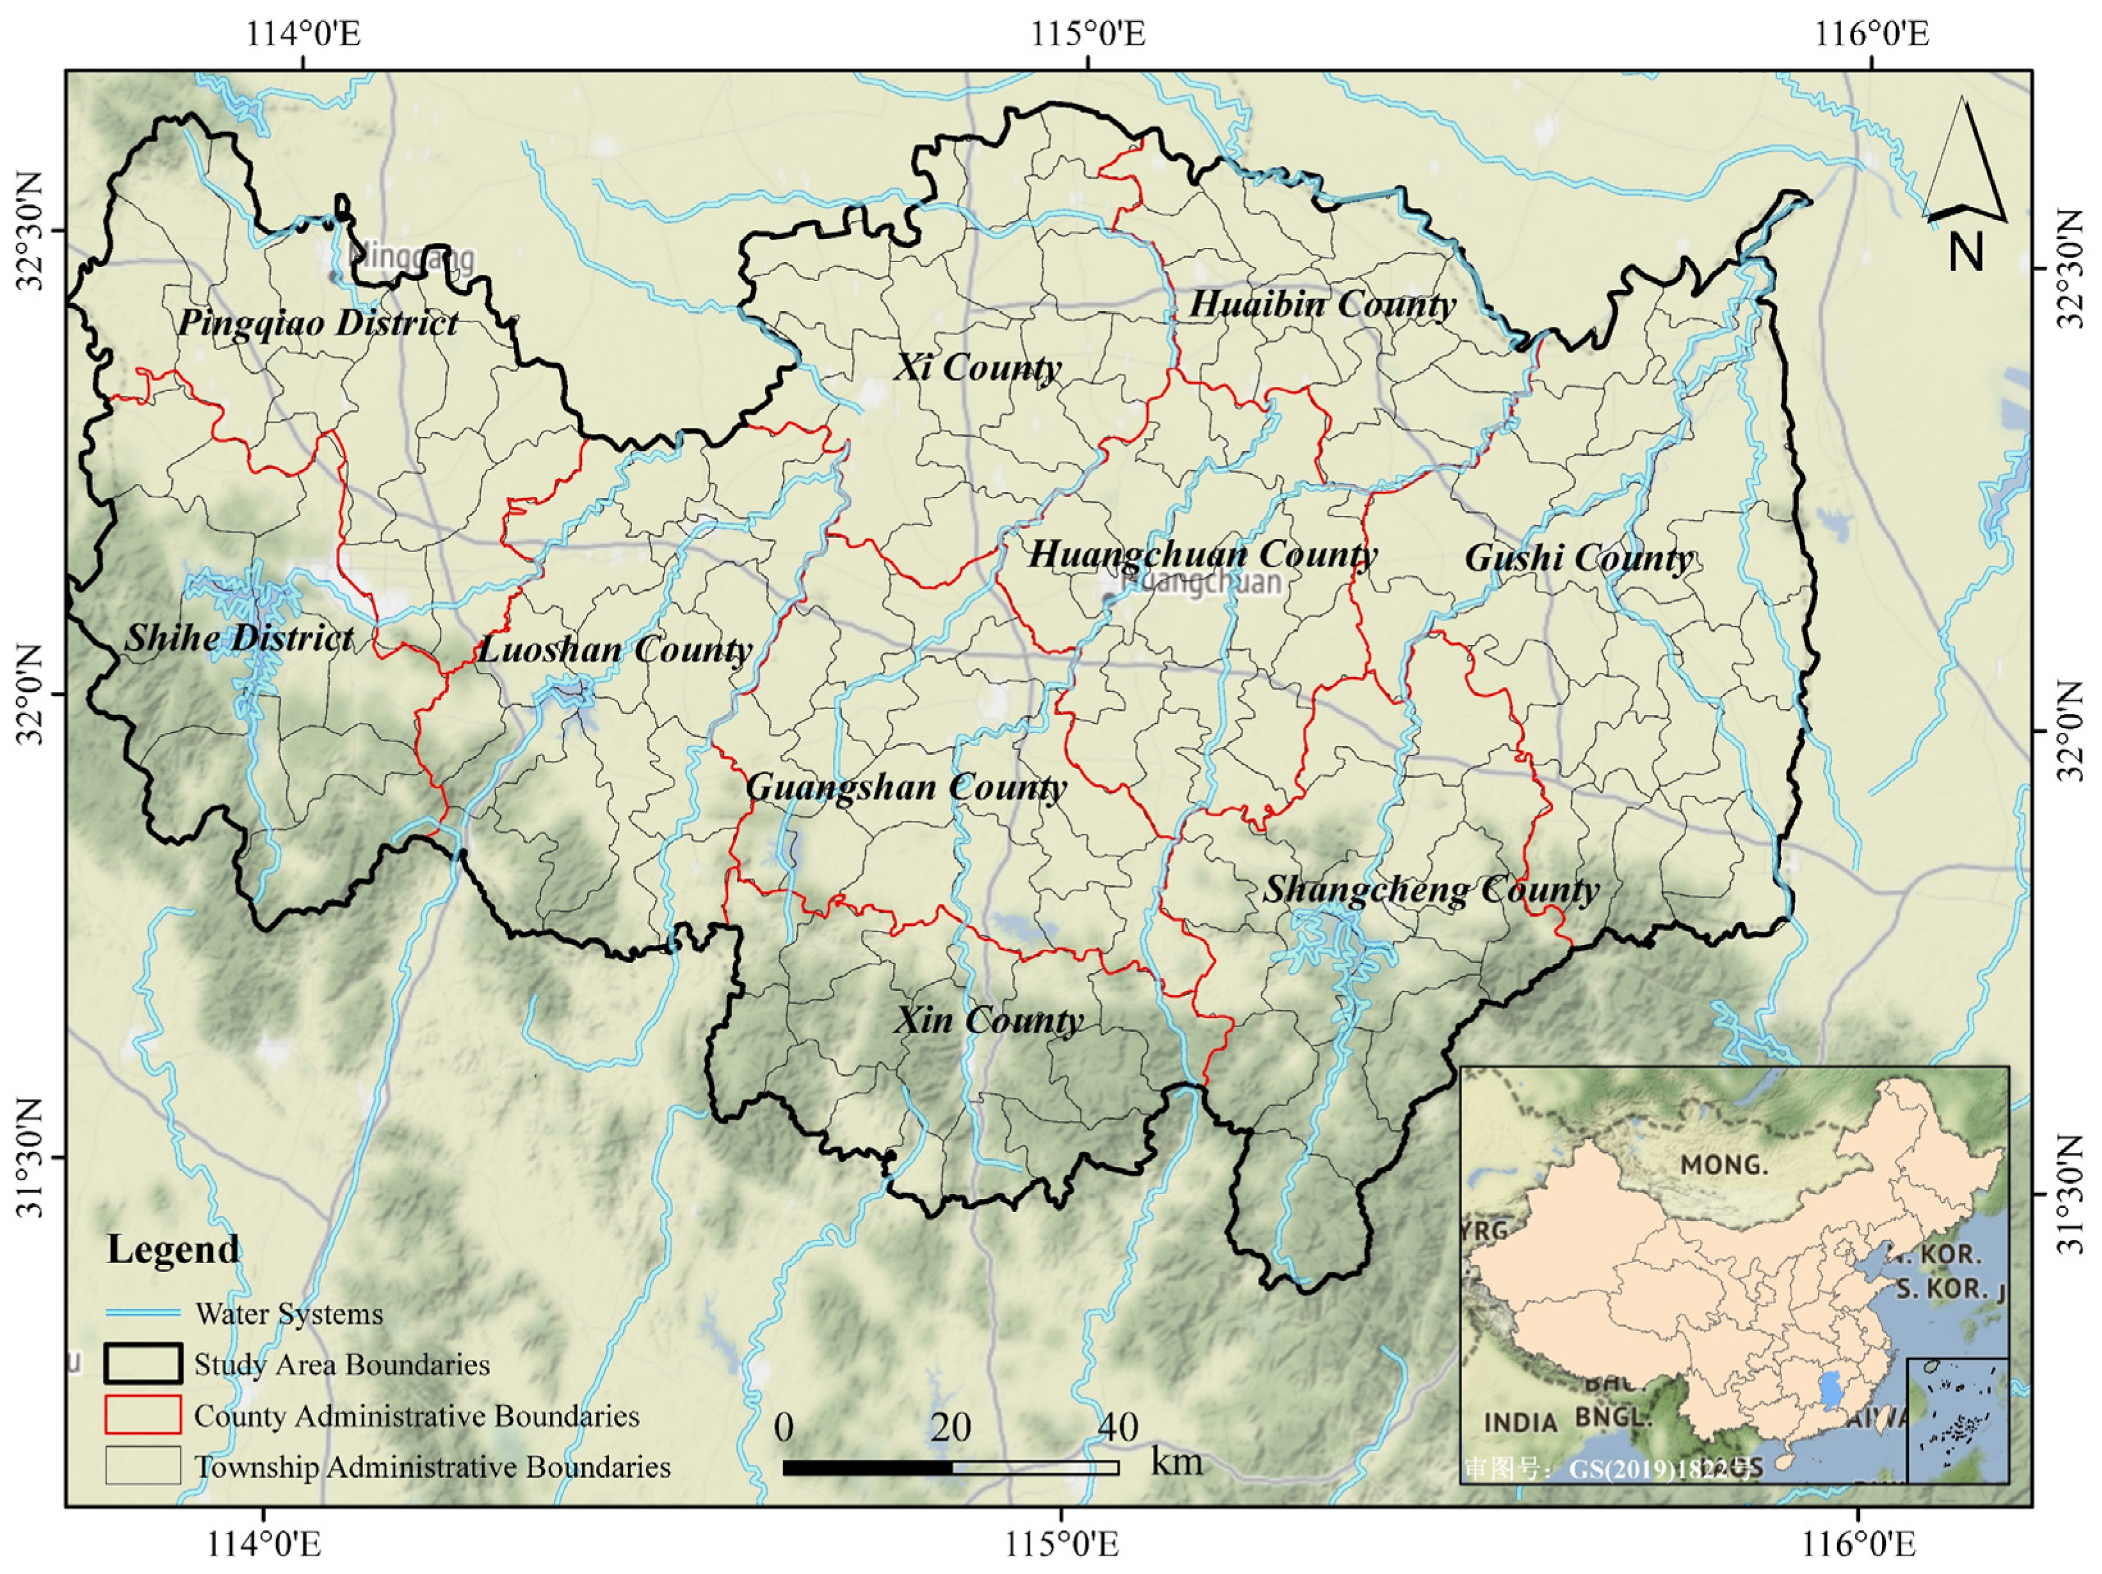
2.1. Study Area

The Xinyang region is located in the southernmost mountainous region of Henan Province, China, in the upper reaches of the Huai River (Figure 2). It is located at 31°125′ N and 114°06′ E. It is connected to Anhui in the east and Hubei in the south, with the Tongbai and Dabie mountains in the west and south, hilly and mountainous areas in the center, and plains and depressions in the north. The total area of the city is 18.90 × 10³ km2, with a population of 8.81 × 10⁶ [27,34]. The city’s topography is high in the south and low in the north, with a variety of shapes and forms. Its subtropical monsoon climate has a clear transition from the subtropical to the warm zone, abundant rainfall, and humid air. Xinyang has abundant rainfall, with an average annual rainfall of about 1300 mm, mainly in the summer, and an average annual temperature of 15.1–15.3 °C. There are many rivers in Xinyang, belonging to the two major water systems of the Yangtze and Huai Rivers. The city’s rivers have a water surface area of 370 km2, and the per capita water resources rank first in Henan Province [35].
Floods are frequent in Xinyang City. According to the hydrological and climatic history of droughts and floods in Henan Province and the statistical data of the “Chronology of Great Floods and Droughts in Henan Province”, the number of years of floods in Xinyang City was 164 during the 612 years from 1400 to 2011. The frequency of floods was 26.8%, averaging about once every three years. The total arable land in the city is about 37.00 × 10³ km2, with rice, wheat, corn, and oilseed rape as the main crops, making it an important food and oil production base in Henan Province. Xinyang Mao Jian tea is one of the top ten most famous teas in China and one of the famous specialties in Henan Province. Xinyang is the only industrial city in the upper reaches of the Huai River and is an important part of the Huai River flood control, which is a difficult task. Xinyang is also among the 81 most important flood control cities in China, and flooding has been one of the most serious natural disasters in the region. In the summer of 2014, heavy rains in Xinyang caused about 20,000 people to be affected and economic losses amounting to CNY tens of millions, so the importance of flood control in the Xinyang area is significant.

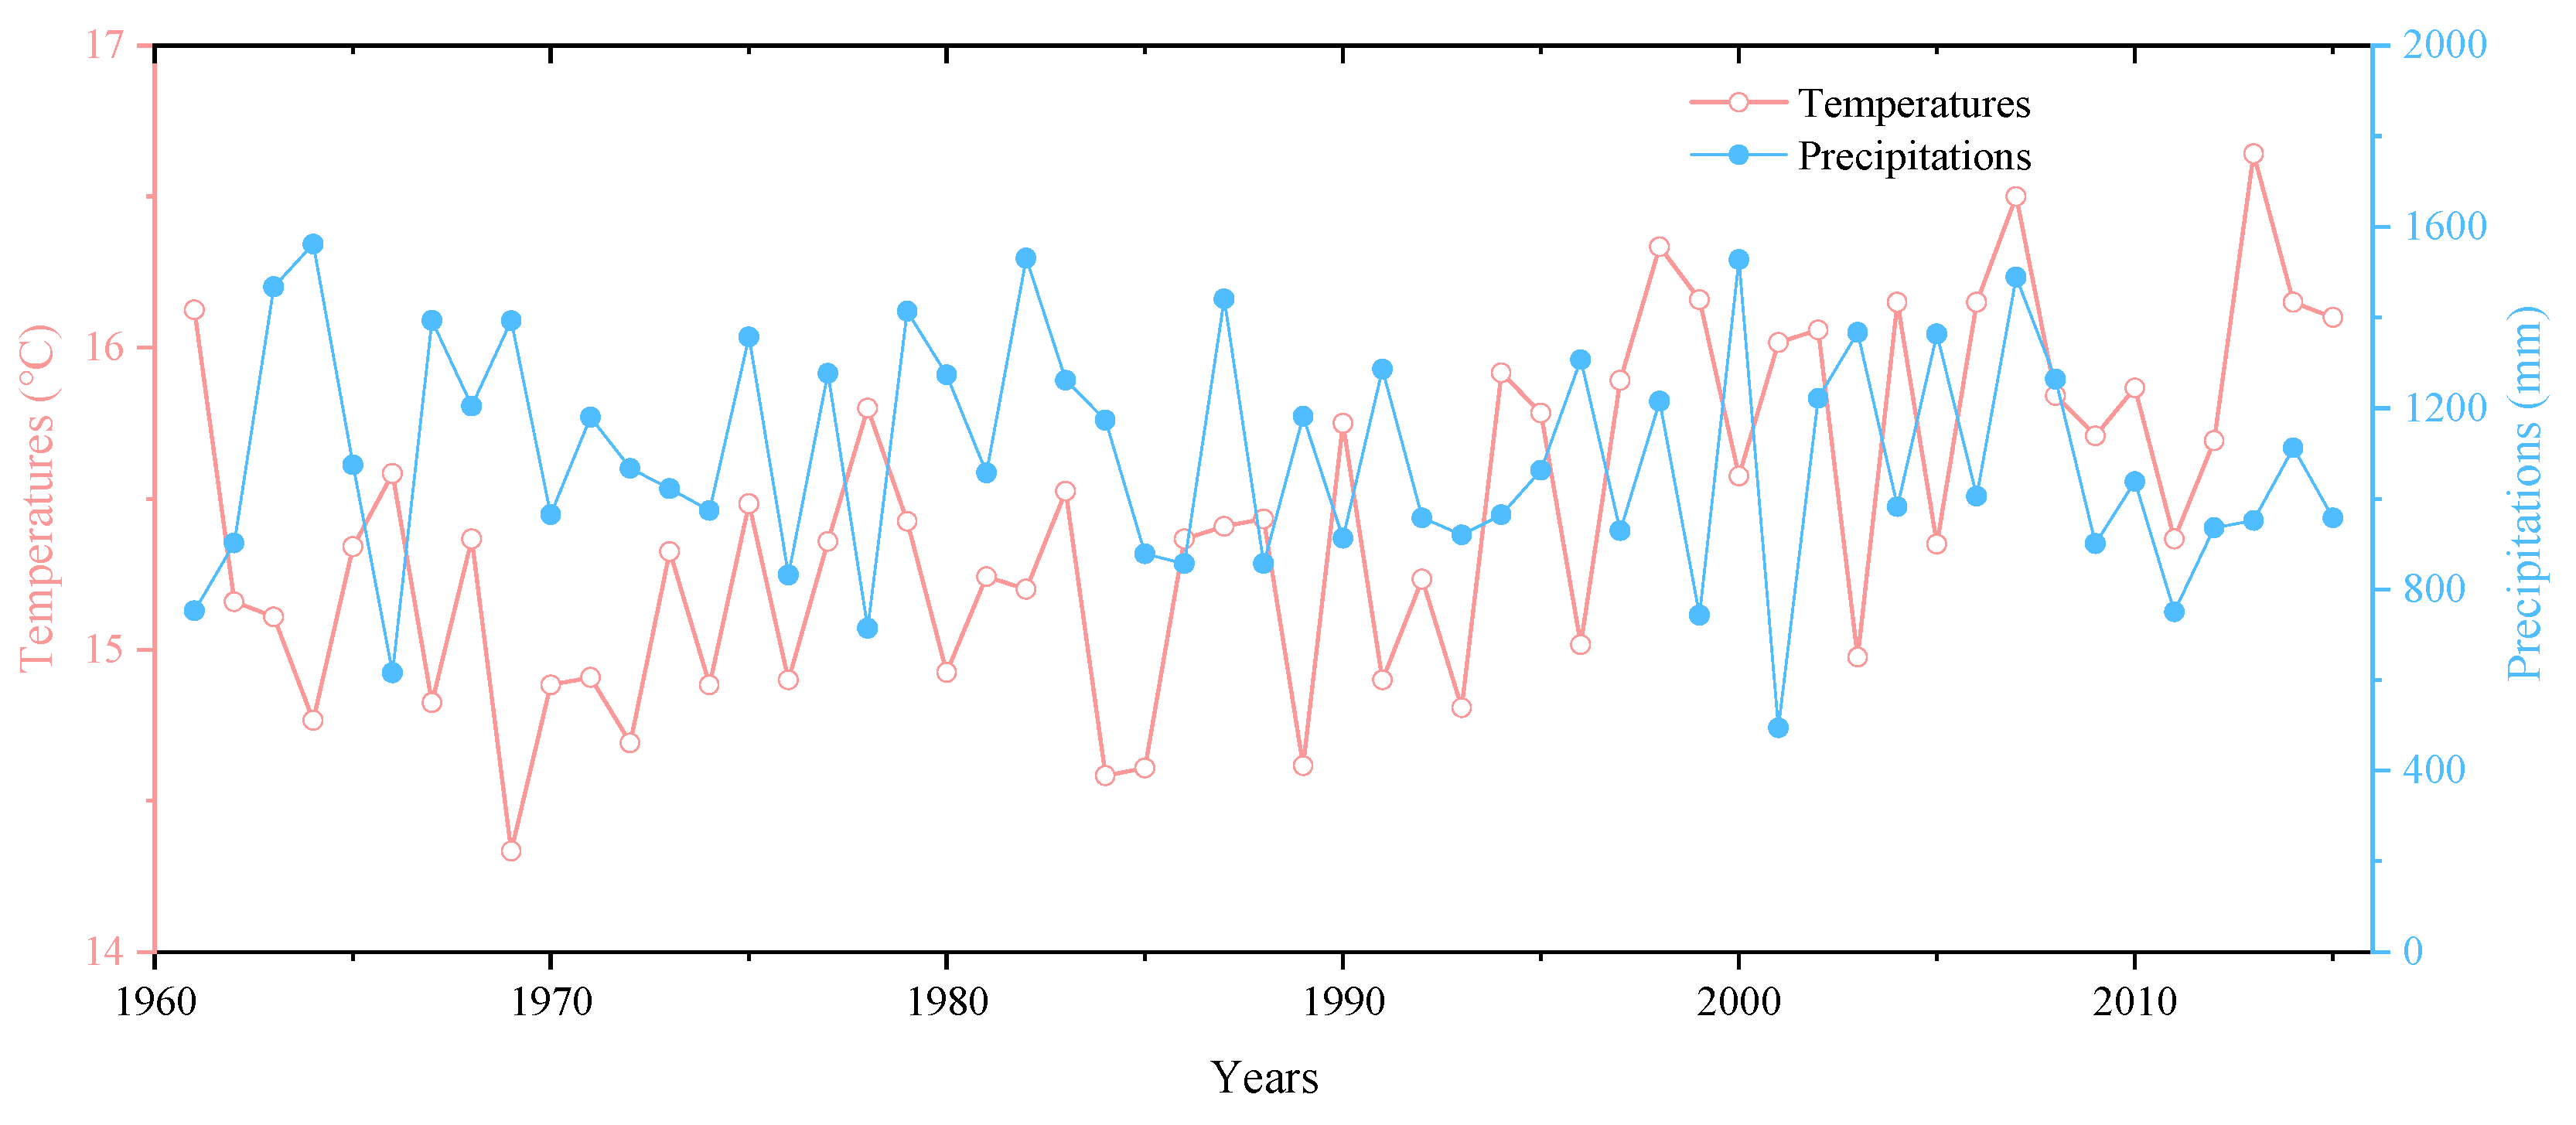
2.2. Data Sources and Pre-Processing

The data were obtained from the China Meteorological Administration (CMA) for a total of 45 years, from 1961 to 2015, from the Xinyang meteorological station located at 32°13′ N, 114°05′ E. The monthly precipitation data were calculated separately from the daily precipitation data. These are shown in Table 1 below.
The precipitation was processed for special values, and the exact data were populated using linear interpolation (Table 1). Then, we calculated the annual precipitation in the Xinyang area and tested it statistically using a one-sample t-test. The test results showed that the precipitation in the Xinyang region was statistically significant (Table 2).
For the SPI processing, the average SPI values for the 12 months of the year were used as the SPI values for the region. The SPI was graded using the grading method provided by the US Drought Mitigation Center [36]. This is shown in Table 3 below.
The main factors affecting drought are less precipitation and higher temperatures [37]. After processing the meteorological data, we preliminary analyzed the temperature and precipitation in the Xinyang area from 1961 to 2015 (Figure 3). In the last 20 years, the temperature has gradually increased, and the precipitation volatility has increased.

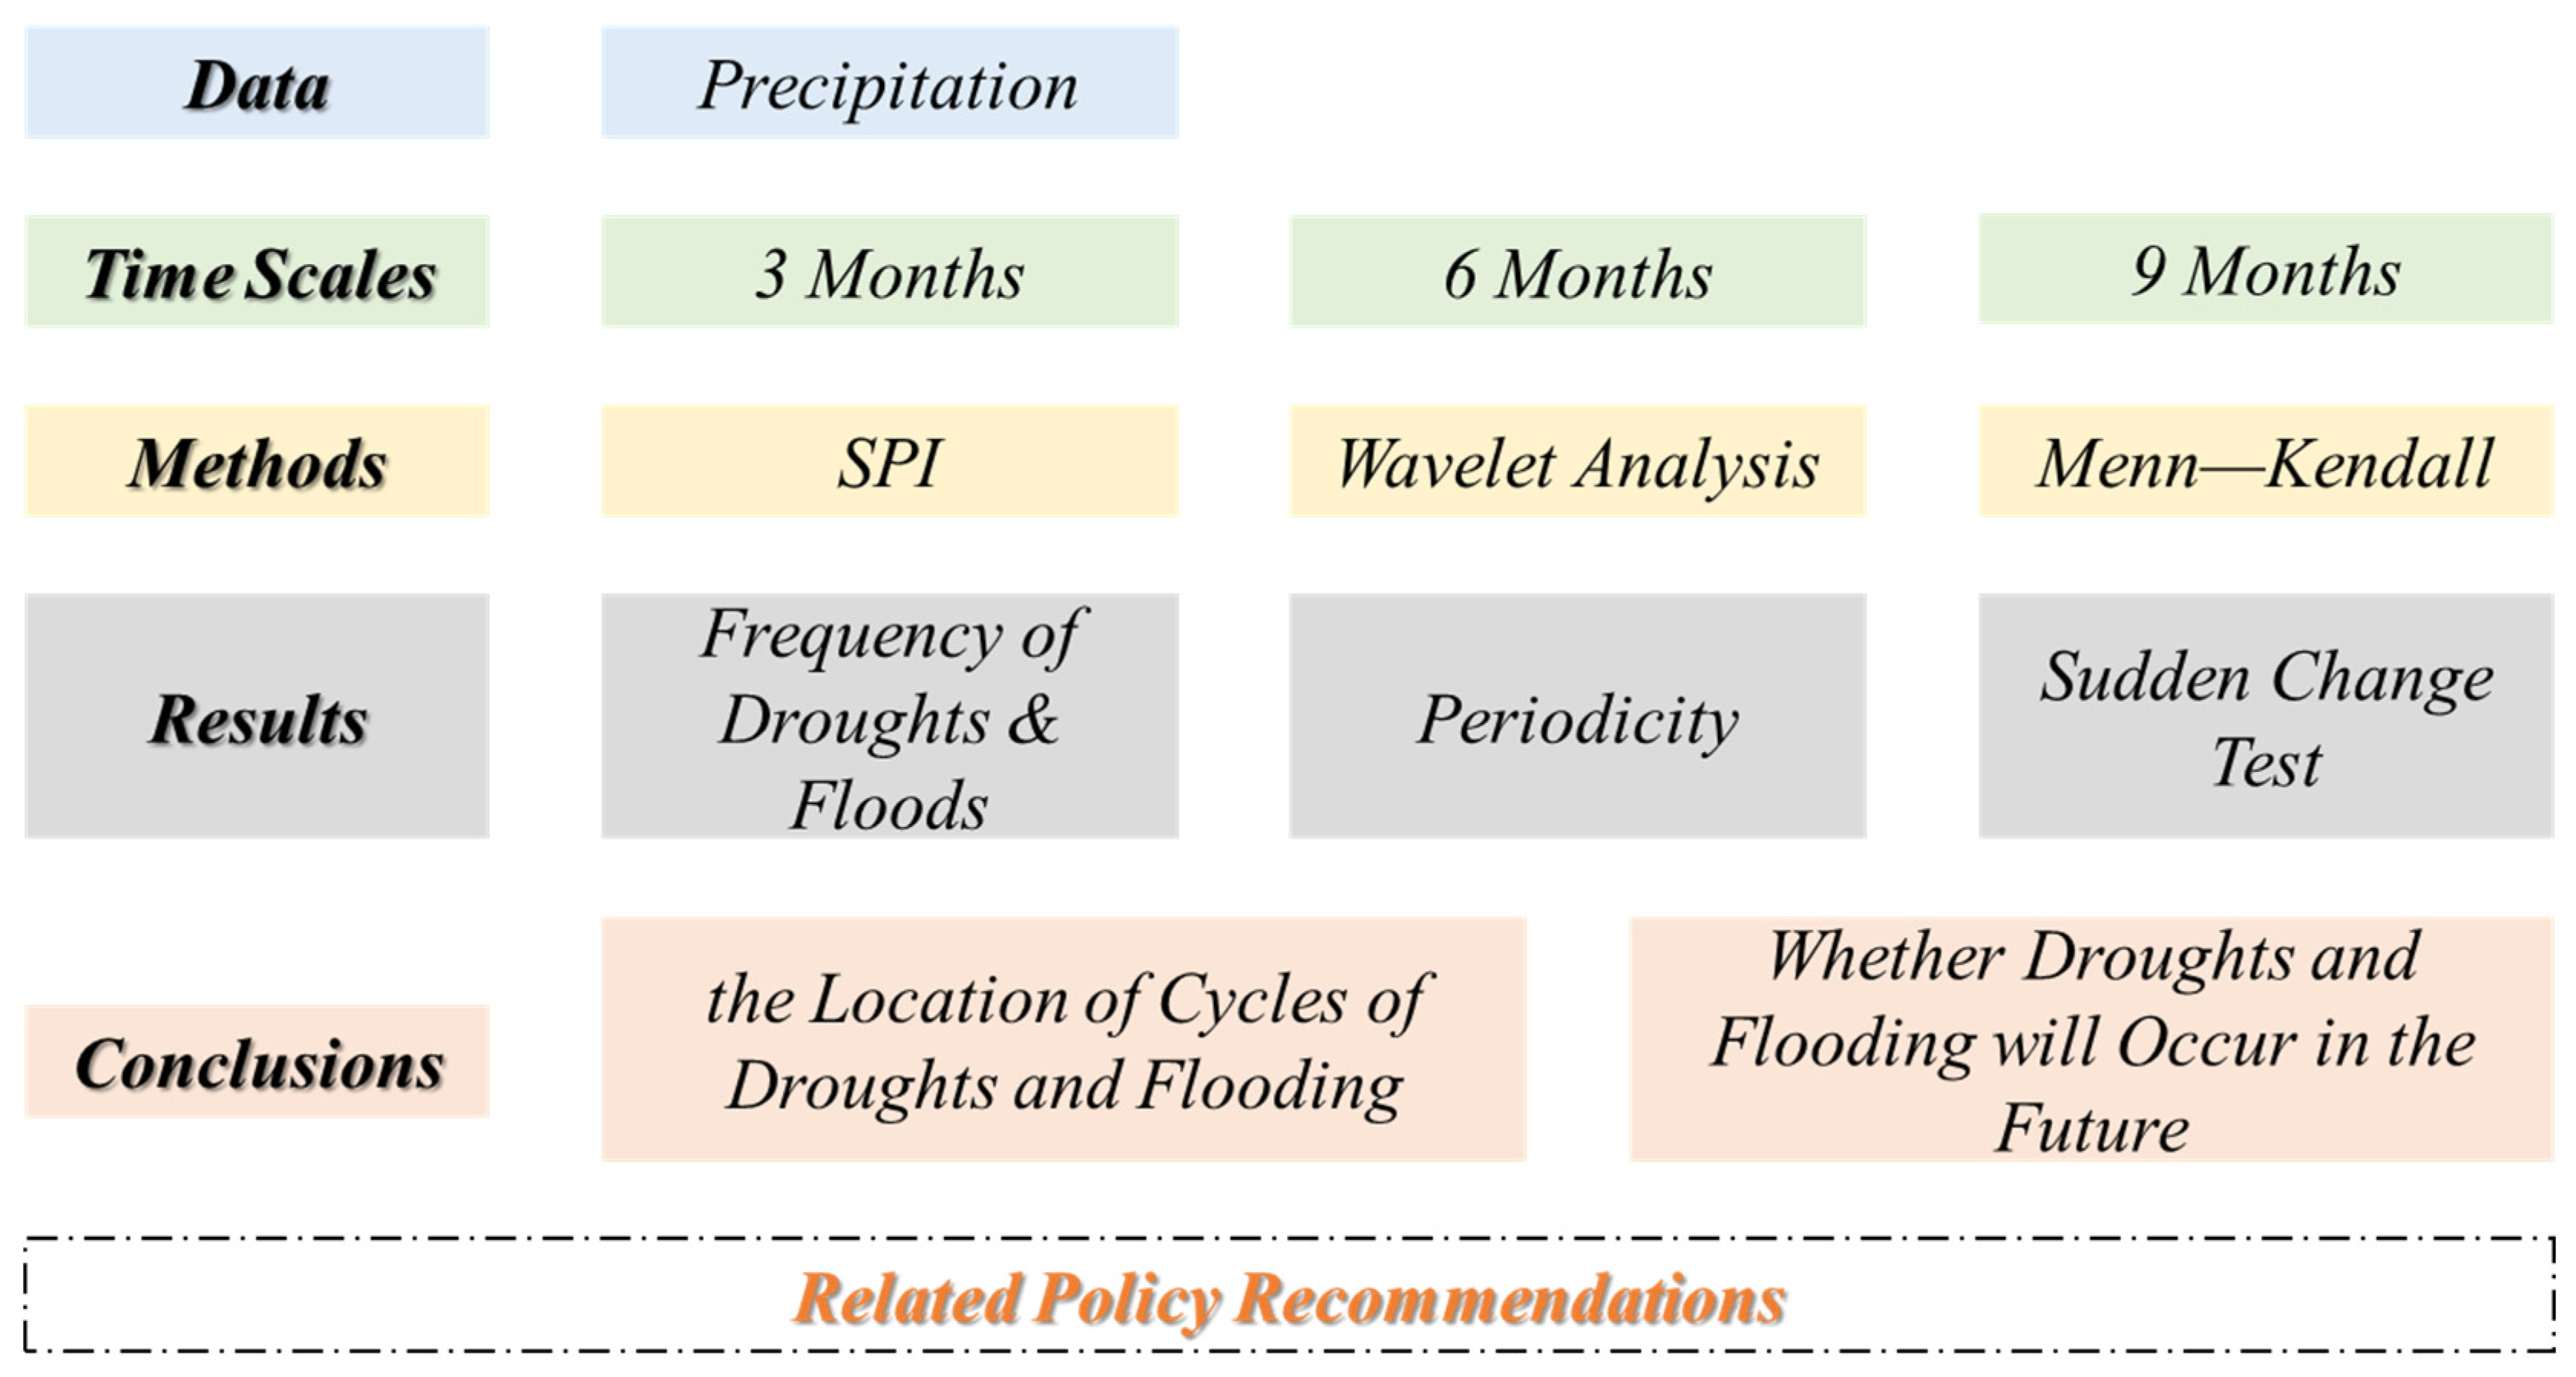
2.3. Research Methodology

US scholars developed the standardized precipitation index (SPI) to provide a quantitative characterization of the lack of precipitation over different time periods. The SPI drought index itself has the advantage of multiple time scales, such as the S P I 1 ,   S P I 3 ,   S P I 6 ,   S P I 12 , etc., for different time scales of study. Under extreme conditions, the SPI outperforms the Z index [38,39]. Yuan Wenping [40] compared the Z index and the standardized precipitation index and concluded that the SPI was better than the Z index and could better predict droughts and floods. The SPI is widely used to analyze the drought and flood situation of a region because the raw data are easily available, the calculation is relatively simple, and it can better reflect the intensity and duration of droughts in the region.
A multi-level time-scale structure and localization characterize climate change in the time domain, but a traditional Fourier analysis cannot analyze this feature. The rapid development of wavelet analysis methods in recent years has overcome this shortcoming by allowing the multi-scale refinement of functions or signal sequences to study the evolution of different scales over time. Due to the properties of the Morlet wavelet transform for time–frequency domain analysis [41], this paper uses Morlet wavelets for calculations.

2.3.1. SPI Calculation Method and Coefficient Setting

The SPI refers to the fact that, since precipitation varies greatly from time to time and from region to region, it is difficult to compare precipitation amounts on different spatial and temporal scales directly, and the precipitation distribution is skewed, not a normal distribution. Therefore, in precipitation analyses, the probability of the Γ distribution of precipitation in that time period should be calculated first. Then, the calculation results should be normalized to obtain the SPI value. The results mainly reflect the phenomena of drought and flooding based on precipitation.
The detailed steps for calculating the standardized precipitation index are as follows:
(1)
Assuming that the amount of precipitation in a given time period is a random variable, x, the probability density function of its Γ distribution is given by
f x = 1 β γ Γ γ x y 1 e x / β x > 0
where β > 0 and γ > 0 are the scale and shape parameters, respectively. β and γ are found using the maximum likelihood estimation method as follows:
γ ^ = 1 + 1 + 4 A / 3 4 A
β ^ = x ¯ / γ ^
A = lg x ¯ 1 n i = 1 n lg x i
where x i is a sample of precipitation information and x ¯ is the average precipitation.
After determining the parameters in the above probability density function, the probability of the event x < x 0 can be found for a given year of precipitation x 0 and is calculated as follows:
F x < x 0 = 0 x 0 f x d x
Using numerical integration, it is possible to calculate an approximate estimate of the probability of an event after bringing in Equation (5) using Equation (1).
(2)
The following equation estimates the probability of the event when the precipitation data are zero:
F x = x 0 = m / n
where m is the number of samples with zero precipitation and n is the total number of samples.
(3)
The probability values obtained from the above two equations are brought into the following normal distribution function to normalize the probabilities of the Γ distribution:
F x < x 0 = 1 2 π 0 x 0 e Z 2 / 2 d x
An approximate solution to the above equation yields
F Z = S t c 2 t + c 1 t + c 0 d 3 t + d 2 t + d 1 t + 1.0
where t = ln 1 F 2 and F is the probability derived from Equation (5) or Equation (6). When F > 0.5, F S = 1, and when F ≤ 0.5, S = 1 . c0 = 2.515517; c1 = 0.802853; c2 = 0.010328; d1 = 1.432788; d2 = 0.189369; and d3 = 0.001308.
The Z value derived from Equation (8) above is the standardized precipitation index, SPI.
Depending on the time scale, the standardized precipitation index can be classified into SPI1, SPI3, SPI6, …, SPI24, etc.
The SPI1 represents the SPI value for the current month. It can reflect short-term soil moisture and crop stress during the crop-growing season and can be approximated as the crop moisture index (CMI).
The SPI3 represents the last three months of precipitation data for droughts and floods. For instance, the SPI3 for July of a year results from the precipitation data calculation for May, June, and July of that year. The SPI3 reflects an area’s short- and medium-term moisture conditions and provides seasonal precipitation estimates. In agricultural areas, the SPI3 is a more sensitive indicator of the effective moisture conditions in agriculture than the Palmer index [20].
The SPI6 is calculated using the last six months of precipitation data. The SPI6 is considered a more sensitive indicator of medium-term precipitation and trends than the Palmer index.
The SPI9 is calculated using the last nine months of precipitation data. The SPI9 is able to reflect precipitation patterns on a moderate time scale for an area. As droughts usually take a season or more to develop, if the local SPI9 < −1.5 or SPI9 > 1.5 for a given area, then droughts and floods are likely to have already occurred and affected sectors such as agriculture, reservoirs, and groundwater levels in the area. Relevant government departments should pay sufficient attention to abnormal fluctuations in the SPI9.
The SPI12, SPI24, and longer SPI indices are in good agreement with the results of the Palmer index, and the differences between the two analysis methods are relatively small, so they were not used in this paper. In this paper, the three time scales of SPI3, SPI6, and SPI9 were mainly used to analyze the droughts and floods in Xinyang City.

2.3.2. Morlet Wavelet Analysis

Choosing a suitable basis wavelet function is a prerequisite for wavelet analysis. According to the specific problem under study, the Morlet wavelet basis function was used in this paper for analytical calculations.
The wavelet function Ψ t L 2 R conforms to
+ Ψ t d t = 0
where Ψ t is the Morlet wavelet basis function, which can form a family of cluster functions by studying the scale-stretching transformations and translations on the time axis as follows:
Ψ a ,   b t = a 1 / 2 Ψ t b a a ,   b R ,   a 0
where Ψ a , b t is the subwavelet; a is the scale factor, reflecting the period length of the wavelet; and b is the translation factor, reflecting the translation in time.
If Ψ a , b t is a subwavelet given by Equation (10) for a given energy-limited signal f t L 2 R , its continuous wavelet transform is
W f a ,   b = a 1 / 2 R   f t Ψ ¯ t b a   d t
where W f a ,   b is the wavelet transform coefficient; f t is a signal or square productable function; a is the scaling scale; b is the translation parameter; and Ψ ¯ x b a is the complex conjugate function of Ψ x b a .
As the time-series precipitation data used in this study were discrete, the function f k Δ t   k   =   1 ,   2 ,   ,   N ;   Δ t   is   the   sampling   interval can be set. Then, the transformed continuous wavelet transform function takes the form of
W f a ,   b = a 1 / 2 Δ t k = 1 N f k Δ t Ψ ¯ k Δ t b a
The above-transformed variance gives the corresponding wavelet coefficients, which can be analyzed to obtain the evolutionary characteristics of the time series for different SPI values.
Integrating the squared values of the wavelet coefficients over the b-domain gives the wavelet variance, i.e.,
V a r a = + W f a ,   b 2 d b
The process of variation in the wavelet variance with scale a is called a wavelet variogram. The strength of the perturbations at different scales under the time series and the principal periods present can be determined by analyzing the wavelet variogram.

2.3.3. Trend Analysis

One of the most common non-parametric methods used to test for trends or mutations in hydrological time series is the Mann–Kendall (MK) test. This test has the advantages of not requiring the sample to follow a certain distribution, not being disturbed by a few outliers, being more applicable to type and order variables, and being simpler to calculate [42,43]. Under the assumption of random independence of the time series, the statistic can be defined as
V a r a = + W f a ,   b 2 d b
For a time series X with n sample sizes, an order column can be constructed:
S k = i = 1 k r i r i = 1 x i > x j 0 e l s e j = 1 ,   2 , , i
It can be seen that the order column, S k , is the cumulative count of the number of values at moment i greater than the number of values at moment j . Under the assumption of the random independence of the time series, the statistic is defined as
U F k = S k E S k V a r S k k = 1 ,   2 , , n
where U F 1 = 0 and E S k and V a r S k are the mean and variance of the cumulative, S k , respectively. They can be calculated by the following equation when x 1 , x 2 , …, x n are independent of each other and have the same continuous distribution (where E S k = n ( n 1 ) 4 ):
V a r S k = n ( n 1 ) 2 n + 5 72
U F i is the standard normal distribution, which is a sequence of statistics calculated in the order of time series, x : x 1 , x 2 , …, x n , given a significance level α. The normal distribution table is checked, and if U F i > U a , it indicates that there is a significant trend change in the series. The above procedure is repeated for time series x in reverse order: x n , x n 1 , …, x 1 , while making U B k = U F k   ( k = 1 ,   2 , , n ) and U B 1 = 0 .
The graphs of U F k and U B k were analyzed. Values greater than 0 indicated an upward trend, while values less than 0 indicated a downward trend. The upward or downward trend was significant when it exceeded a critical line. The range beyond the critical line was identified as the time region where the sudden change occurred. If the two curves intersected and the point of intersection was between the critical lines, then the intersection point was when the mutation began. As there have been numerous studies in this area [44], this paper used a multivariate Mann–Kendall test to analyze the precipitation trends in the Xinyang area.

3. Results and Discussion

3.1. Temporal Characteristics of Droughts and Floods in Xinyang

Figure 4 shows the SPI3, SPI6, and SPI9 variation curves of Xinyang City for 3, 6, and 9 months from 1961 to 2015, respectively. The analysis is based on the precipitation data for a total of 45 years, from 1961 to 2015. Additionally, the moving average of the three SPI variation curves is computed for 9, 18, and 36 months, respectively. The three SPI curves averaged 9, 18, and 36 months, respectively. In general, Xinyang City experienced sharp fluctuations in its drought indices during 1962–1967, 1979–1984, and 1999–2003. They all went through the process of changing from normal to heavy flooding to moderate drought to exceptional drought. The droughts and flooding in Xinyang City during this period were significant and included periods of sharp changes, with a period of sharp changes of about 17a severe drought and flooding fluctuations. There is a higher possibility of drought and flooding in the next four years.
The distribution of the SPI3 shows that the SPI3 can better reflect the characteristics of short-term droughts and floods, i.e., the intra-year seasonal variation in droughts and floods. This indicates that droughts and floods have become more frequent and severe in recent years. For the distribution of the SPI6, there were still fewer severe floods than severe droughts, with four and seven, respectively. There were two consecutive years of severe droughts in 2001 and 2002. The SPI9 better reflected the long-term drought and flood characteristics, and the fluctuations in the drought index were relatively stable, with general flooding in the 1960s and 1970s followed by a gradual averaging and a large change after the 1990s.
The specific characteristics of droughts and floods in Xinyang City are as follows: (1) In general, there are more flood years and fewer drought years; (2) the frequency of floods is high; (3) the frequency of droughts is low; and (4) the sharp alternation of droughts and floods shows cyclical characteristics.

3.2. Cycle Variation Characteristics of Droughts and Floods in Xinyang

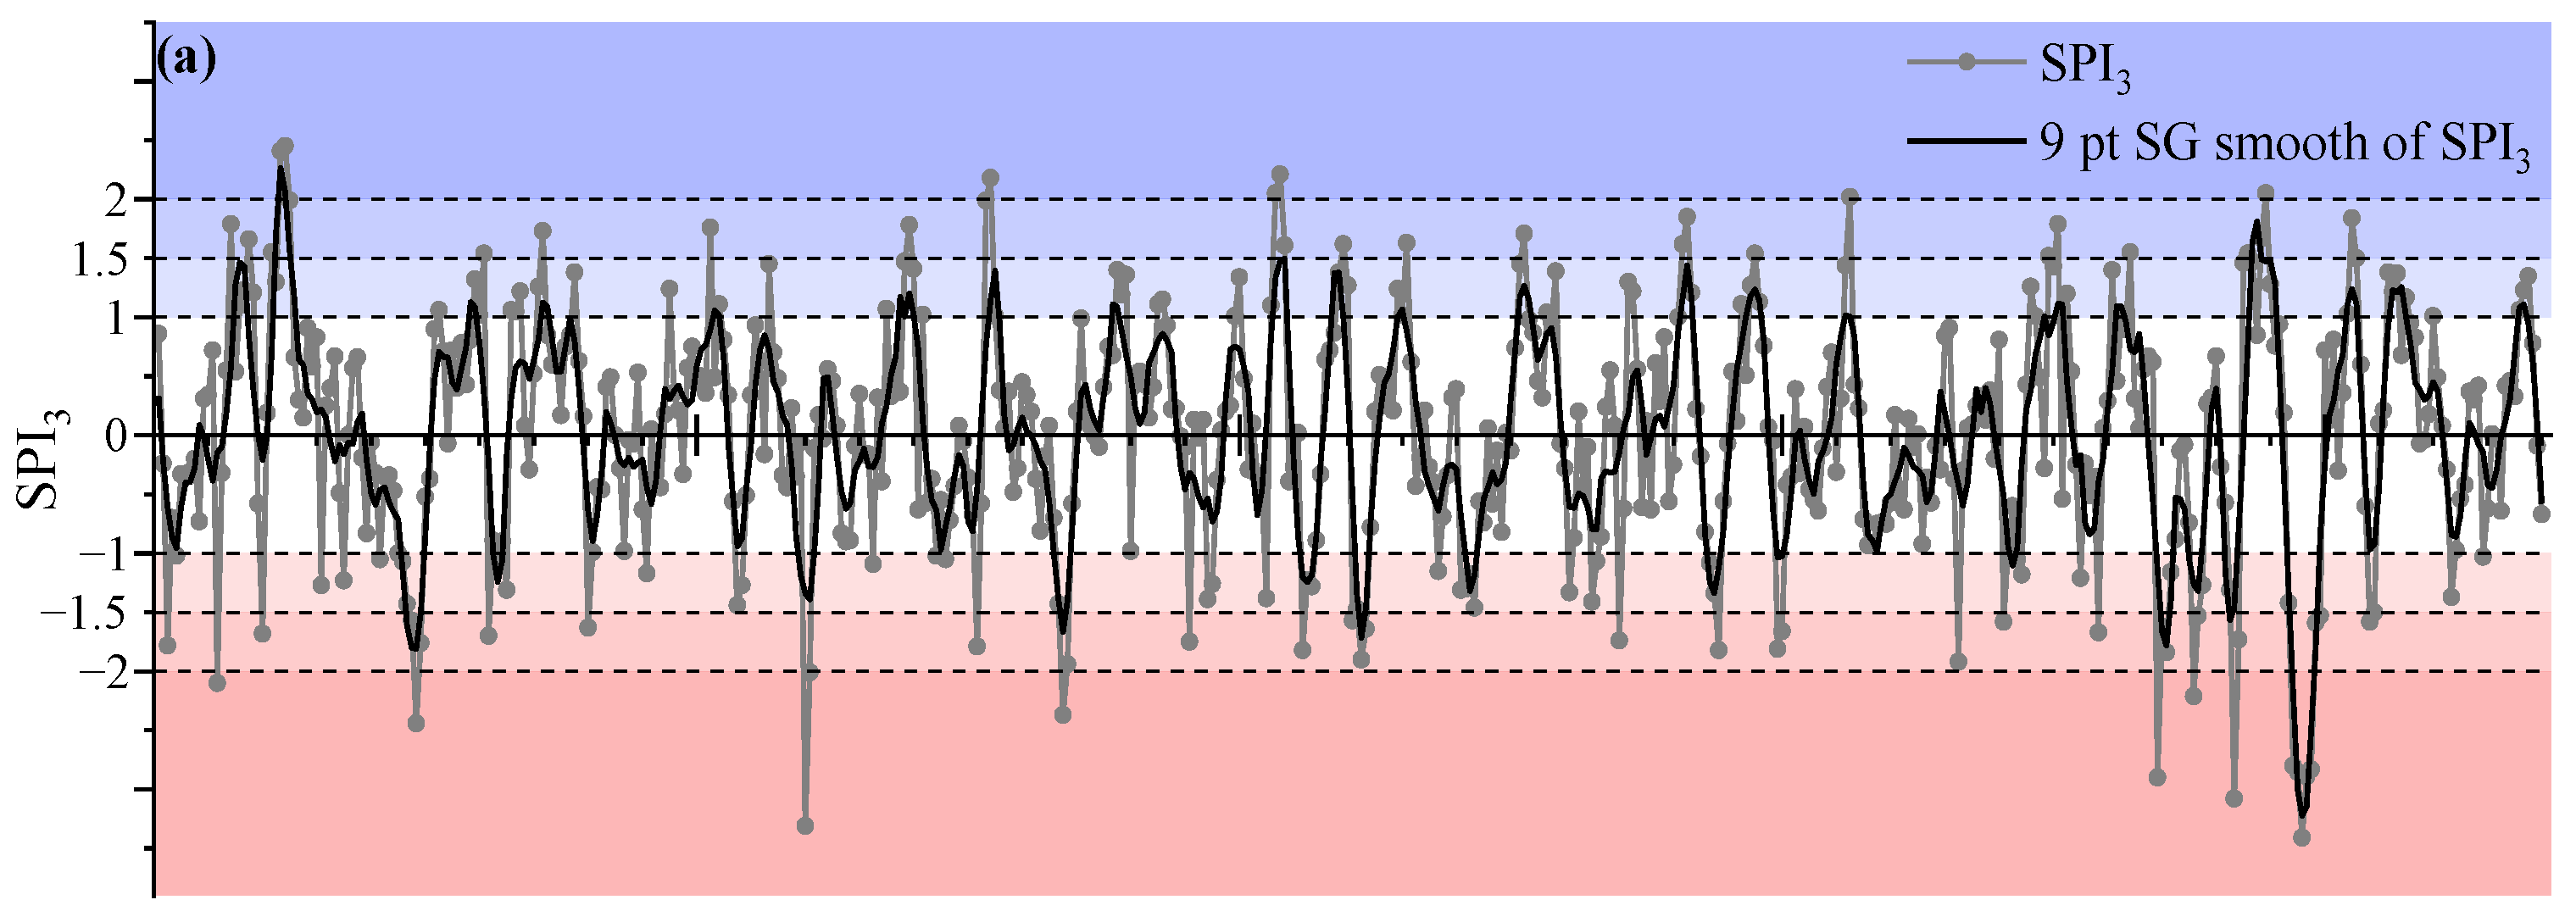
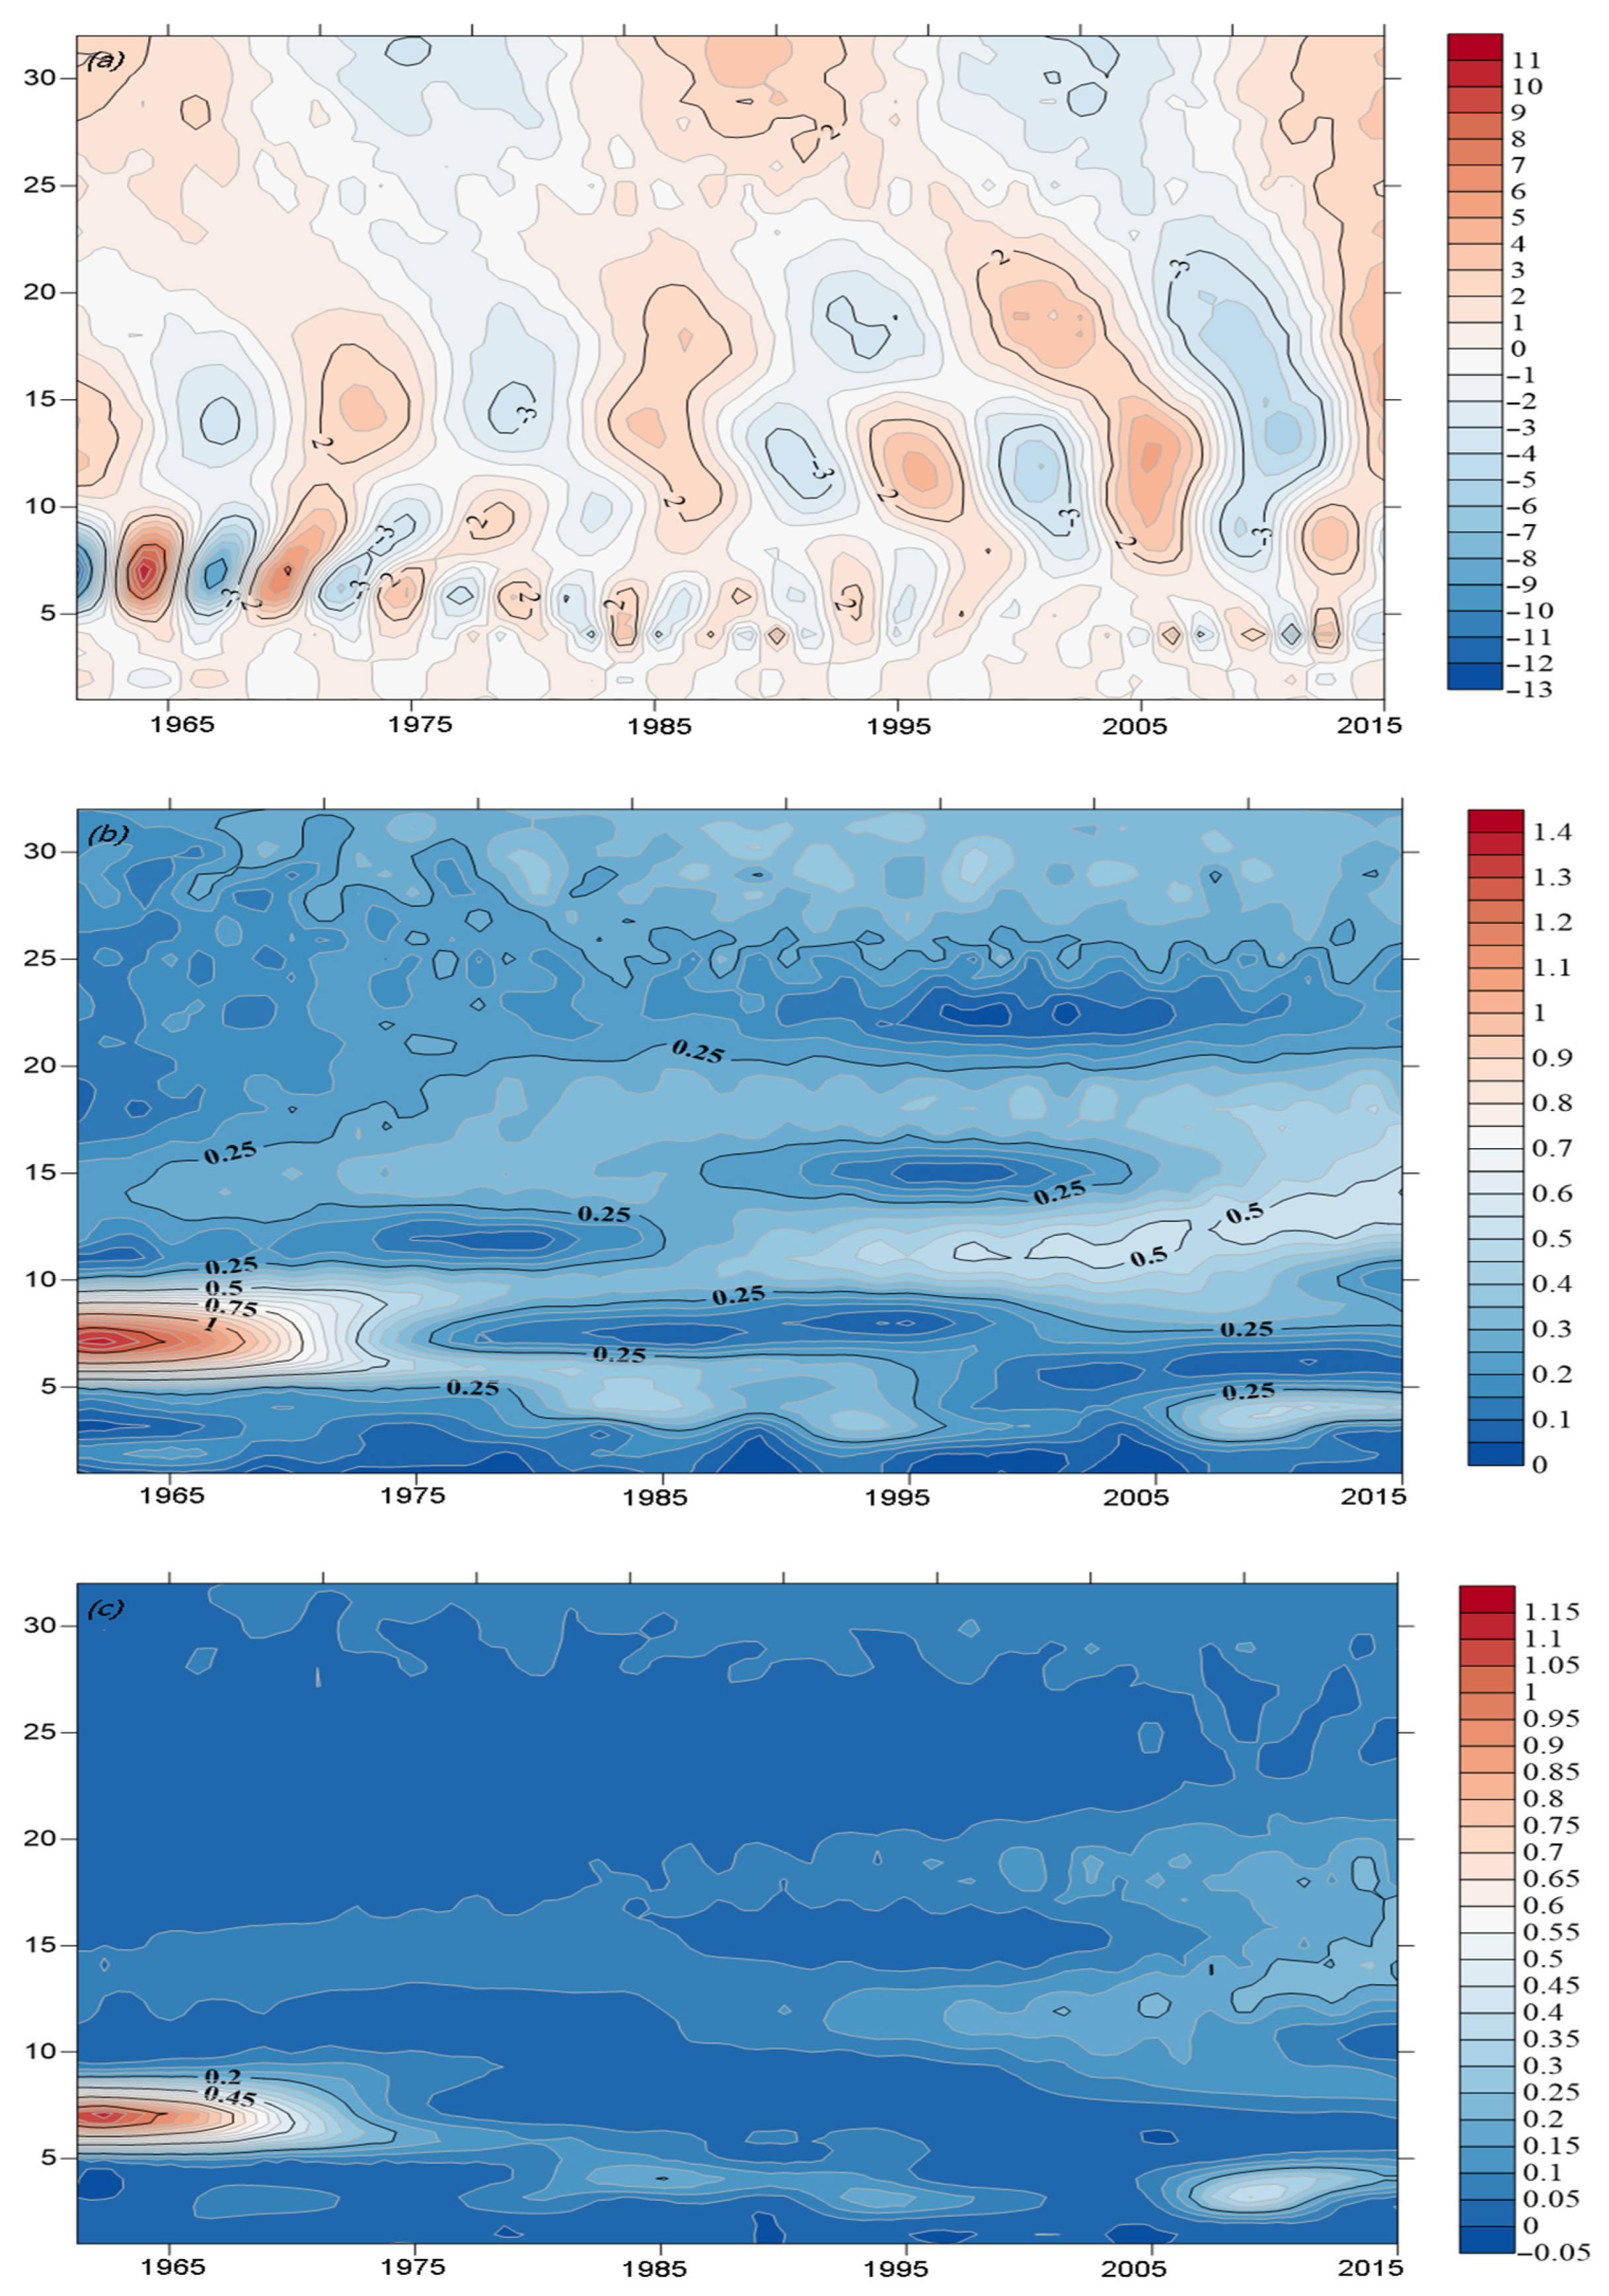
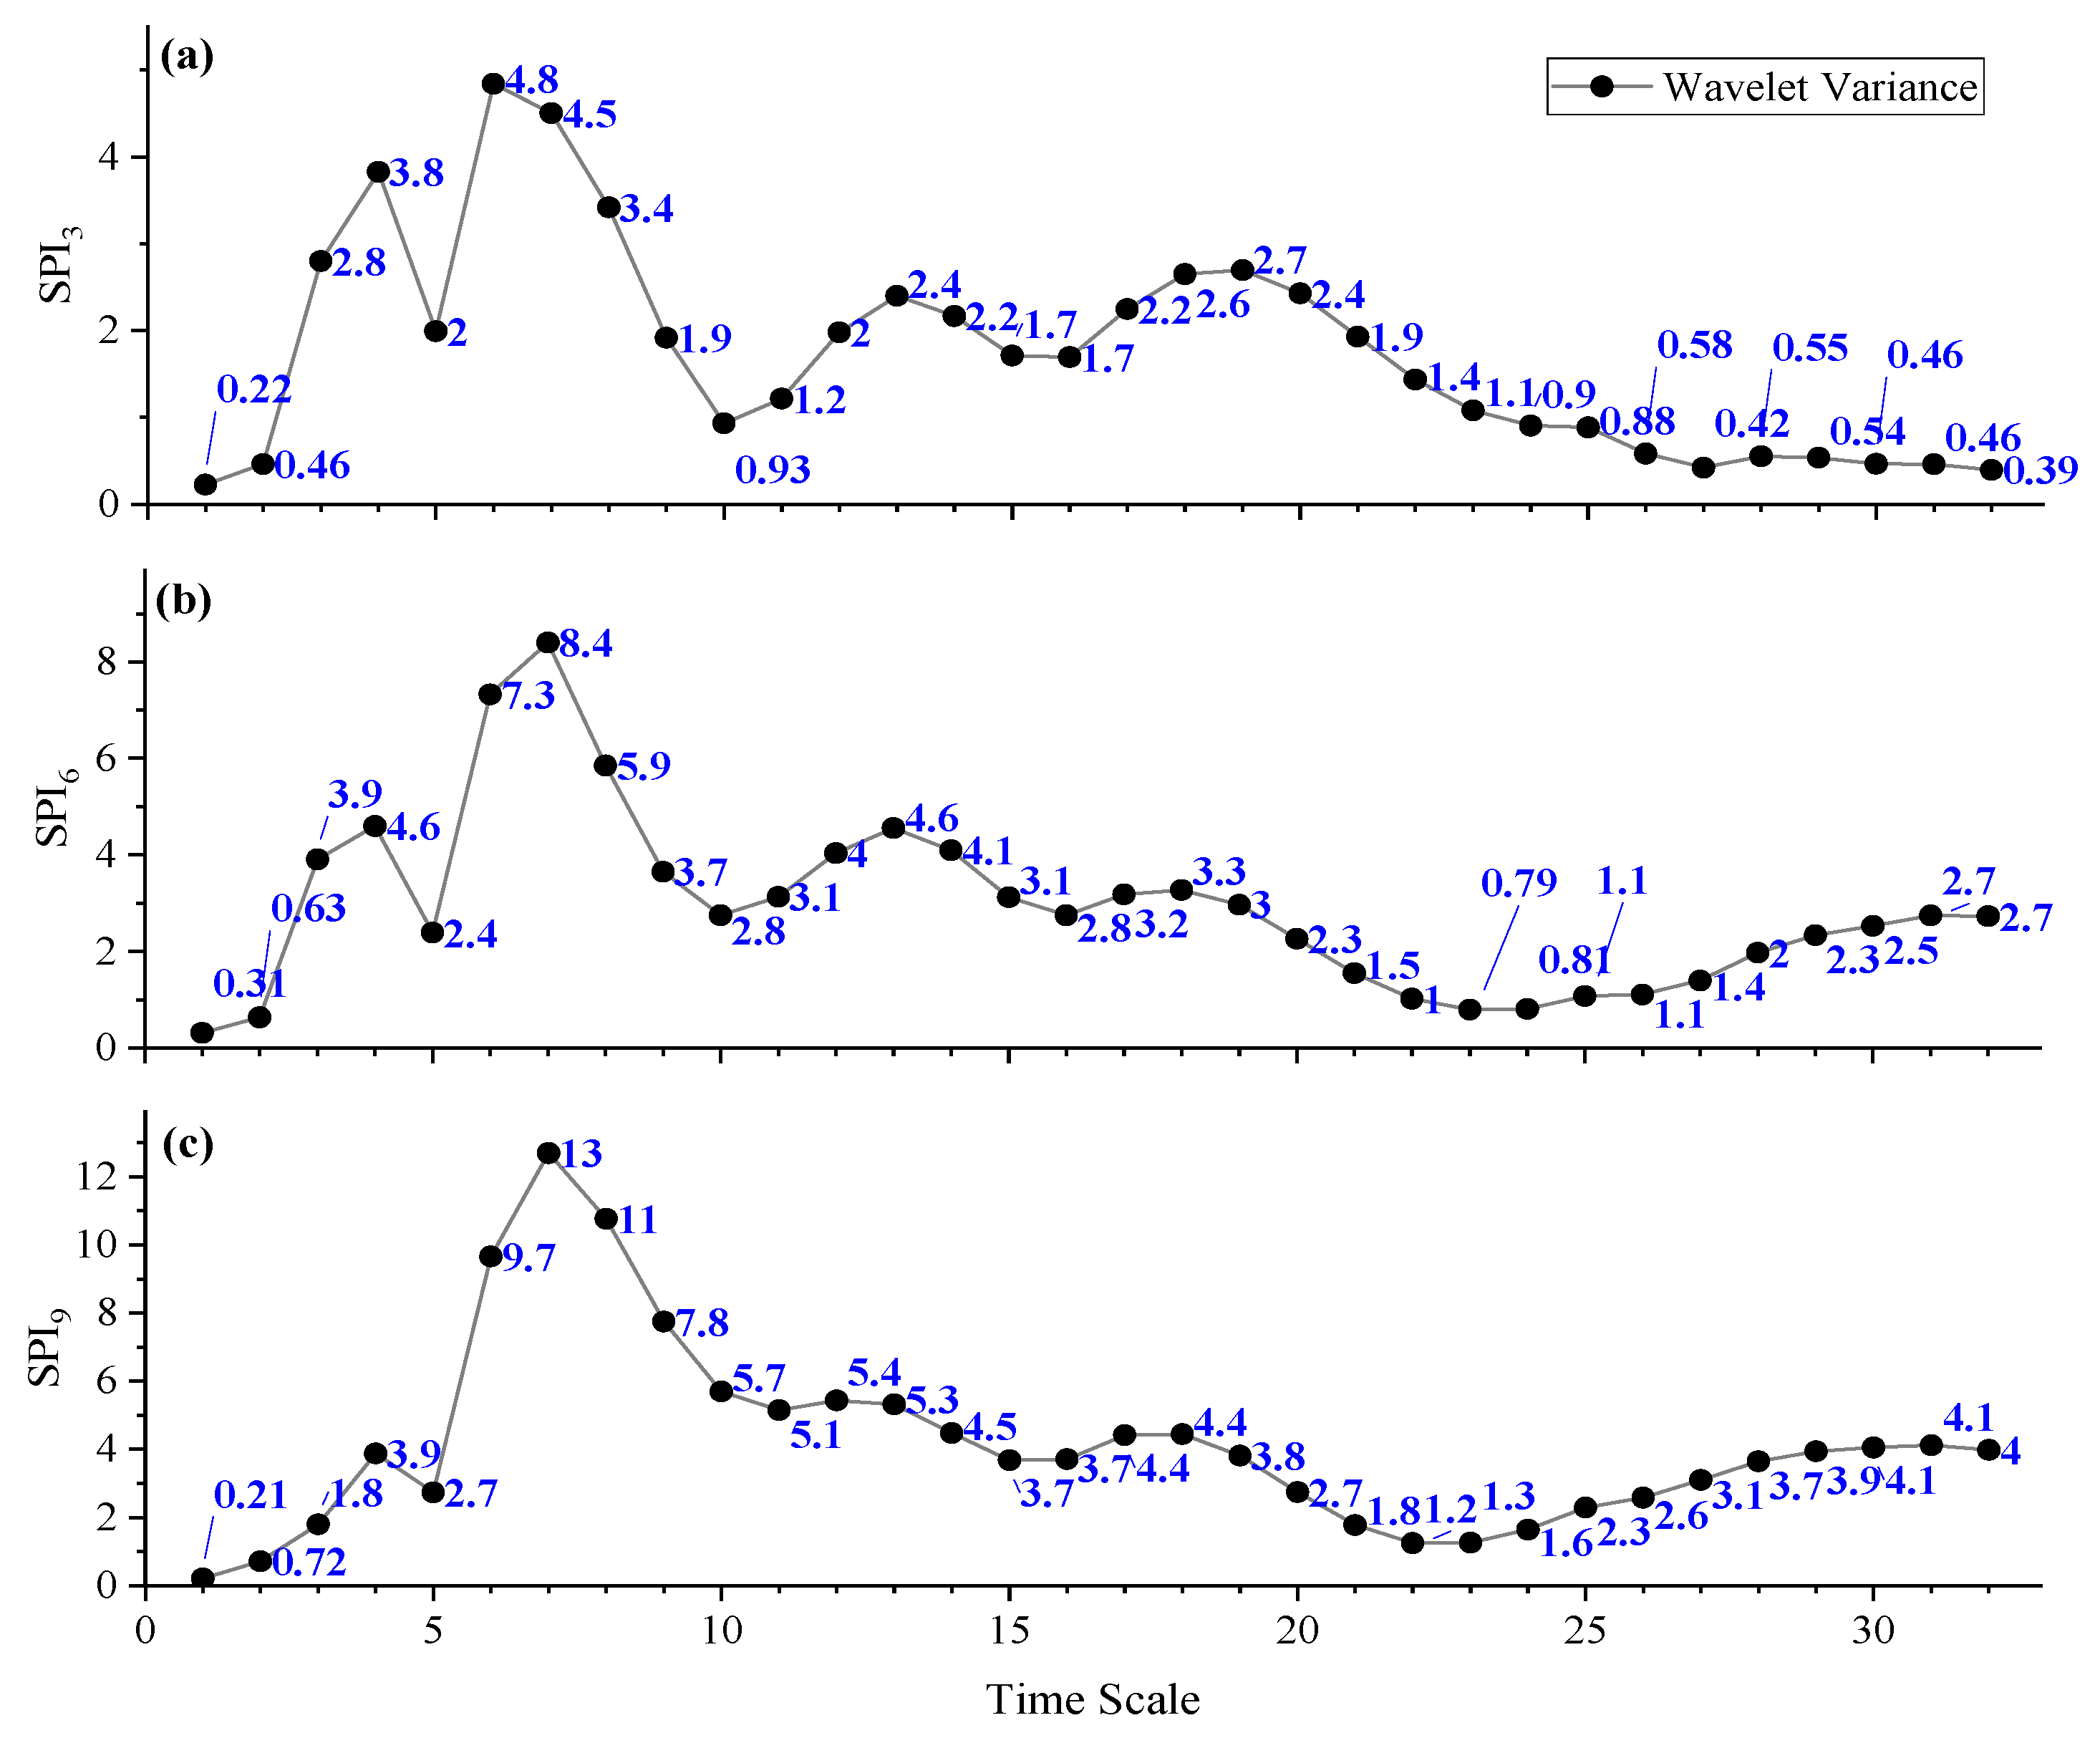
3.2.1. SPI3 Cycle Variation

A cyclical analysis of the SPI index was carried out in order to explore the in-depth cyclical variation of the longer time-series aridification trend in the Xinyang region (Figure 5). The period analysis mainly used a Morlet wavelet transform. At present, Morlet wavelets have been commonly applied to meteorological analyses [41]. By performing a Morlet wavelet analysis on the SPI time-series data of the Xinyang region, three contour maps were generated: a wavelet real part contour map, a modal contour map, and a modulus squared contour map. These maps reflect the variation in the time series of the SPI values, the period of variation, the energy density over the studied time region, and the SPI oscillation energy at different periods, respectively, with the modal contour map corresponding to the mode value. The larger the mode value, the more periodic the corresponding time period or scale.
The temporal distribution of the SPI3 showed three main types of scales of cyclical variation in the evolutionary process: 14–18 years, 8–13 years, and 3–7 years. However, the 18–27-year time scale had the strongest energy and the most significant period, although the periodicity became weaker and started to decline during 1998–2015. The 13–18-year time scale had the second strongest energy and a stronger periodicity, and the time-scale energy showed a gradual weakening during 1998–2015 when the periodicity of the precipitation started to decline.

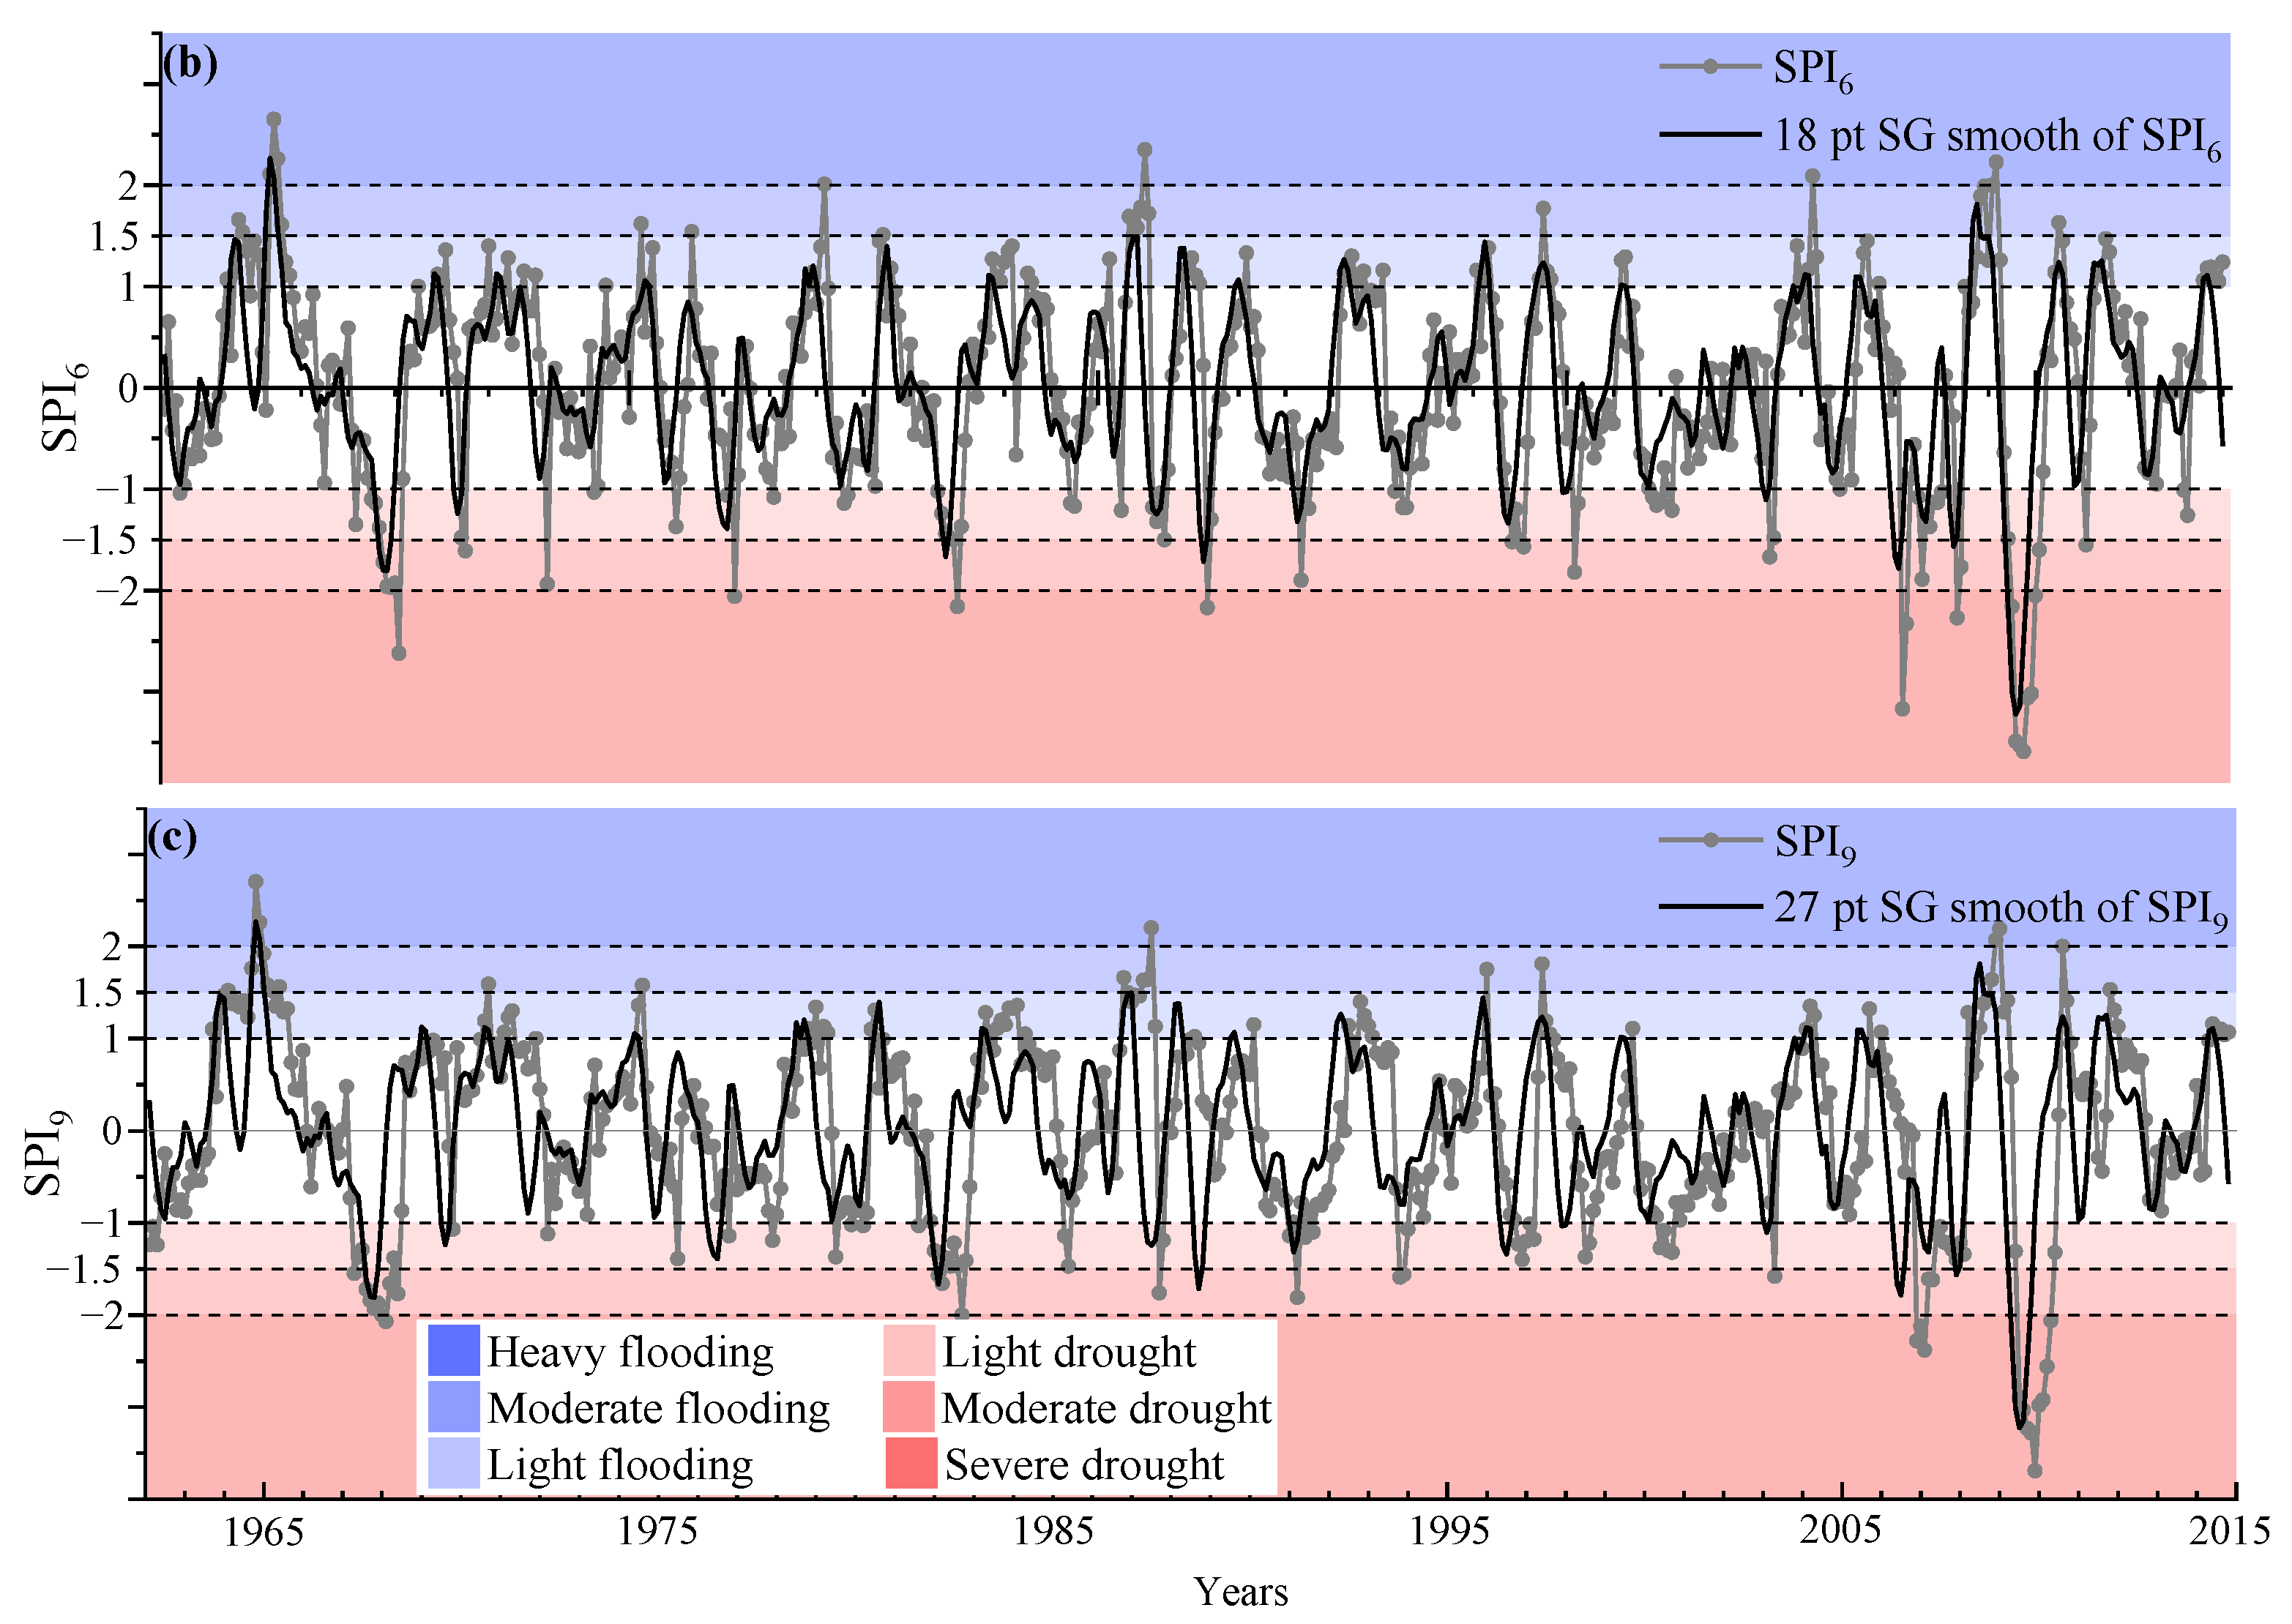
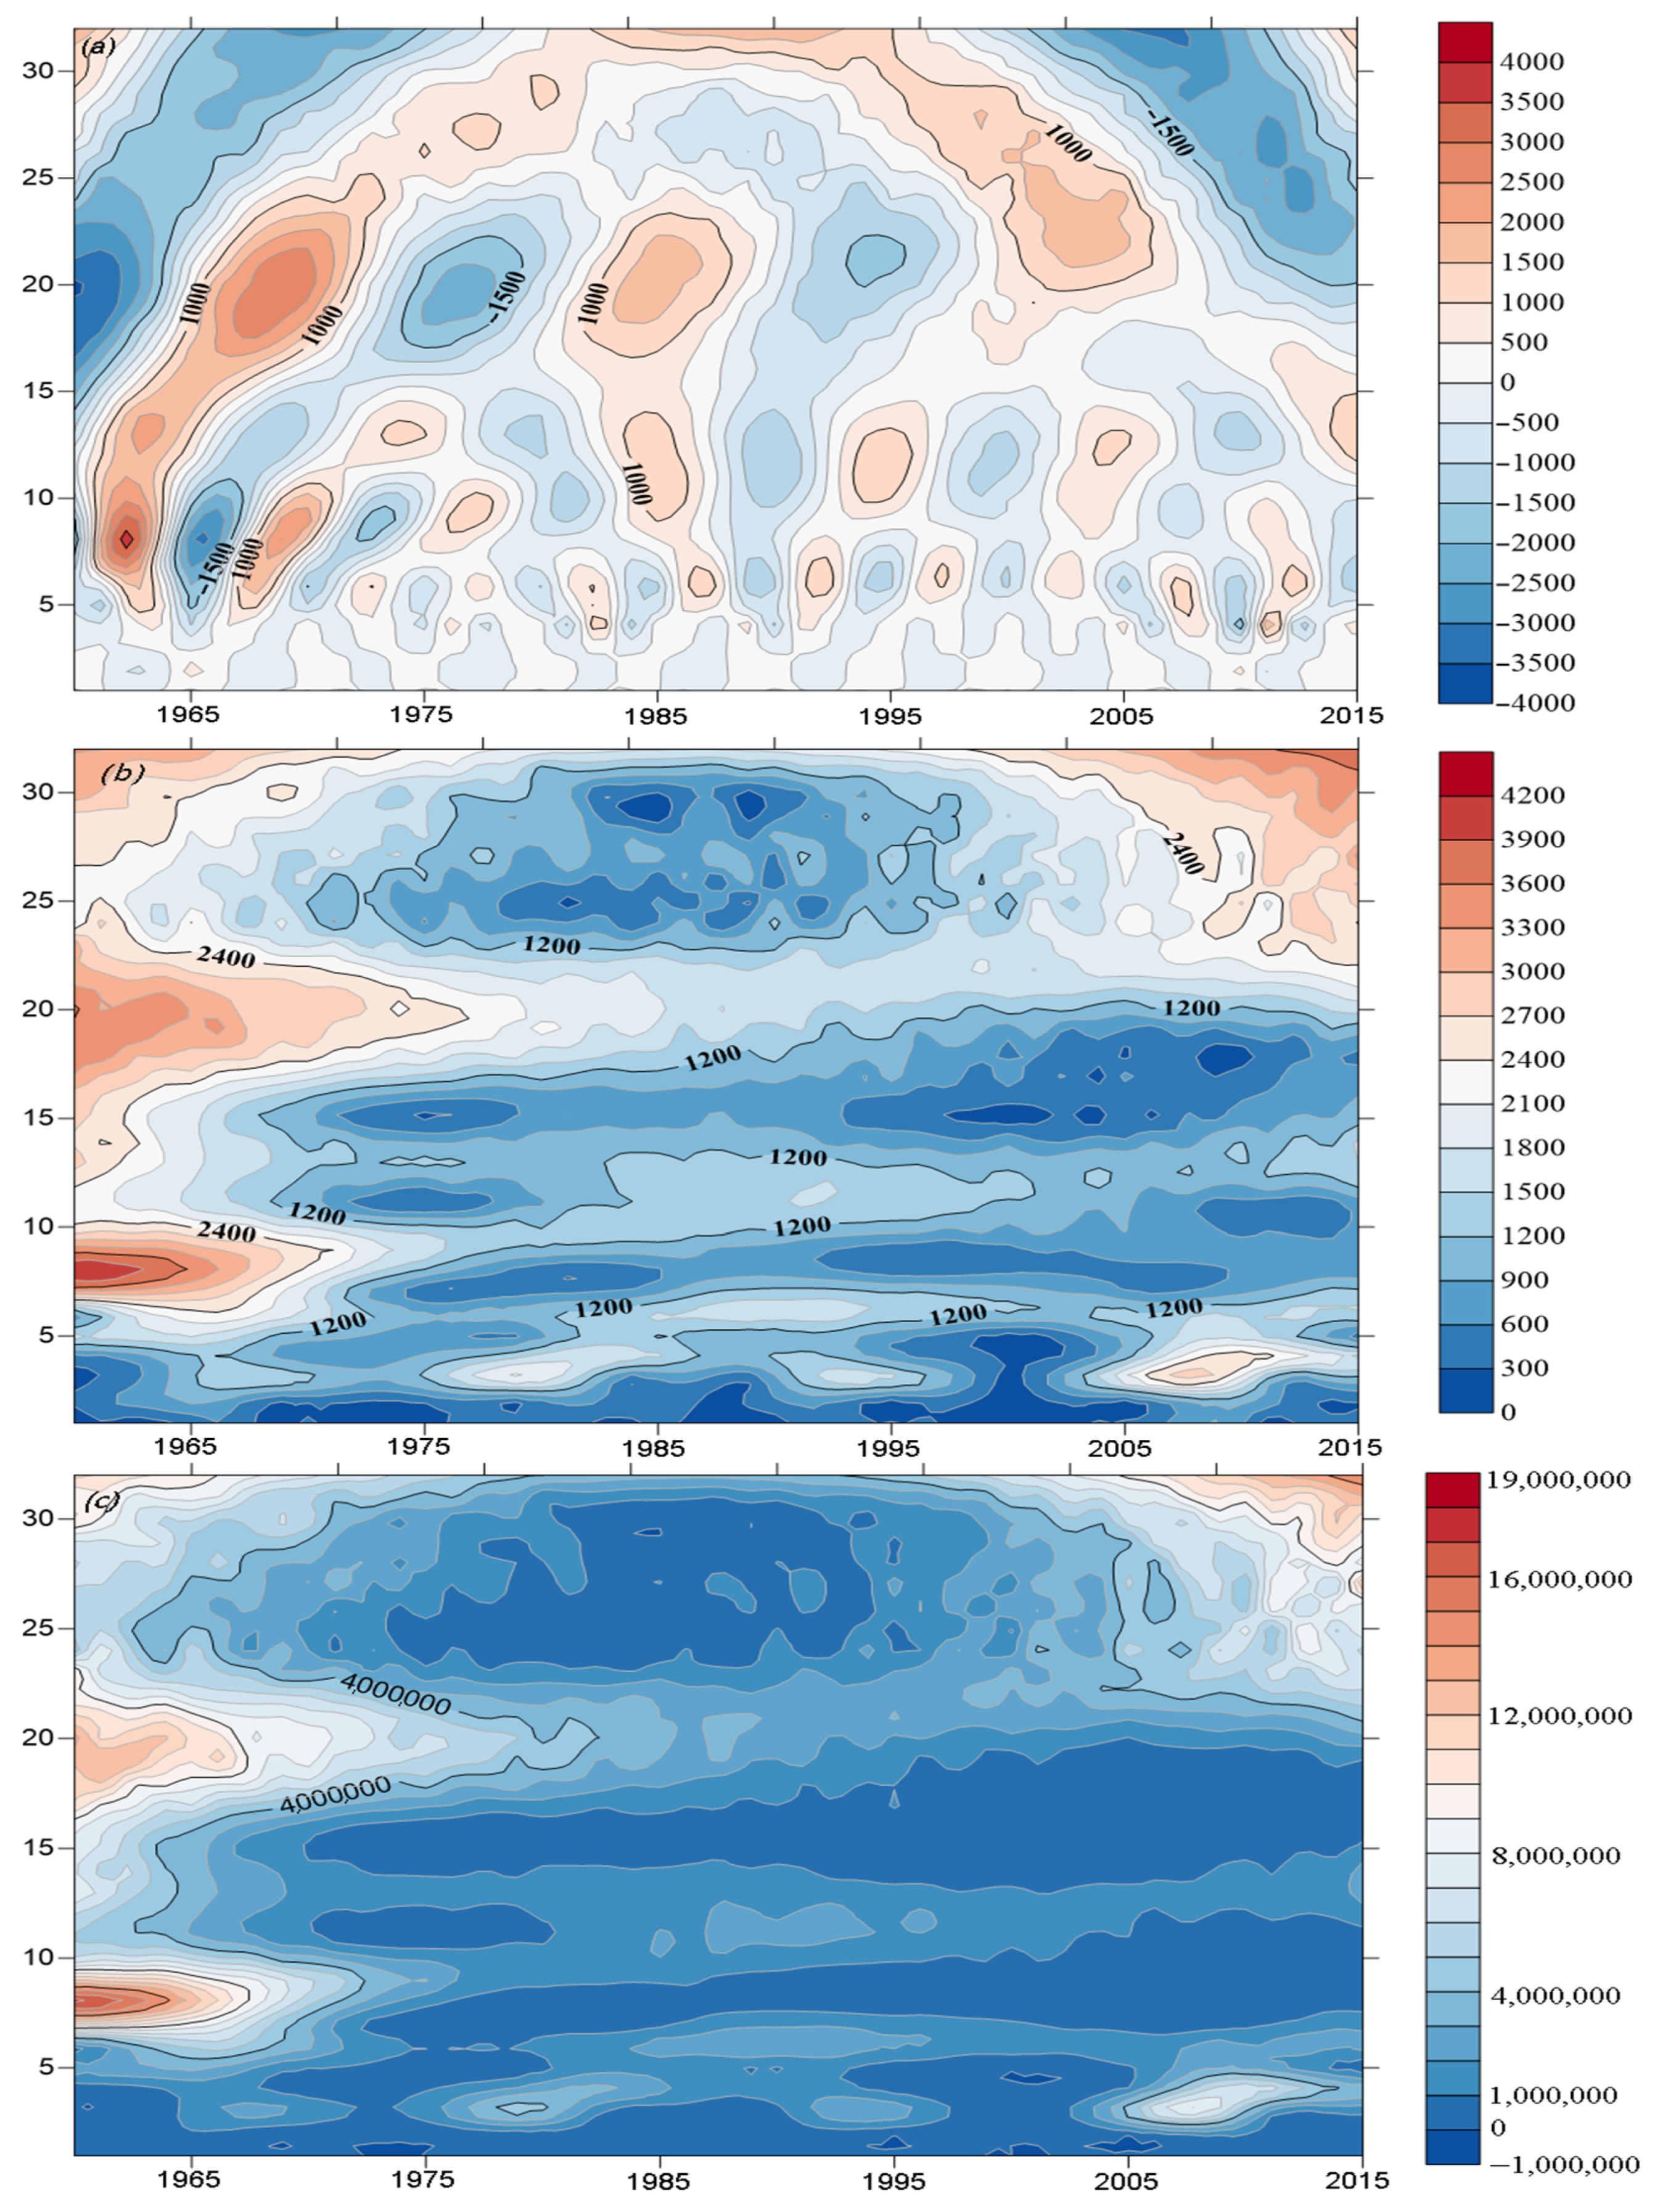
3.2.2. SPI6 Cycle Variation

In the time-series distribution of the SPI6 (Figure 6), the temporal changes were less obvious than those in the short term. There was a similar pattern of cyclical changes to that of the SPI3, with the 18–27-year time scale decreasing in periodicity and the cycle's center not changing significantly. However, there were two trends in the oscillatory energy during the period 1998–2015. The time scale became weaker in this time frame, and the periodicity began to decline. The 7–13-year time scale had little change in energy and was more stable, and its cyclical peak began to shift downwards, showing the characteristics of a constant and shorter periodicity.

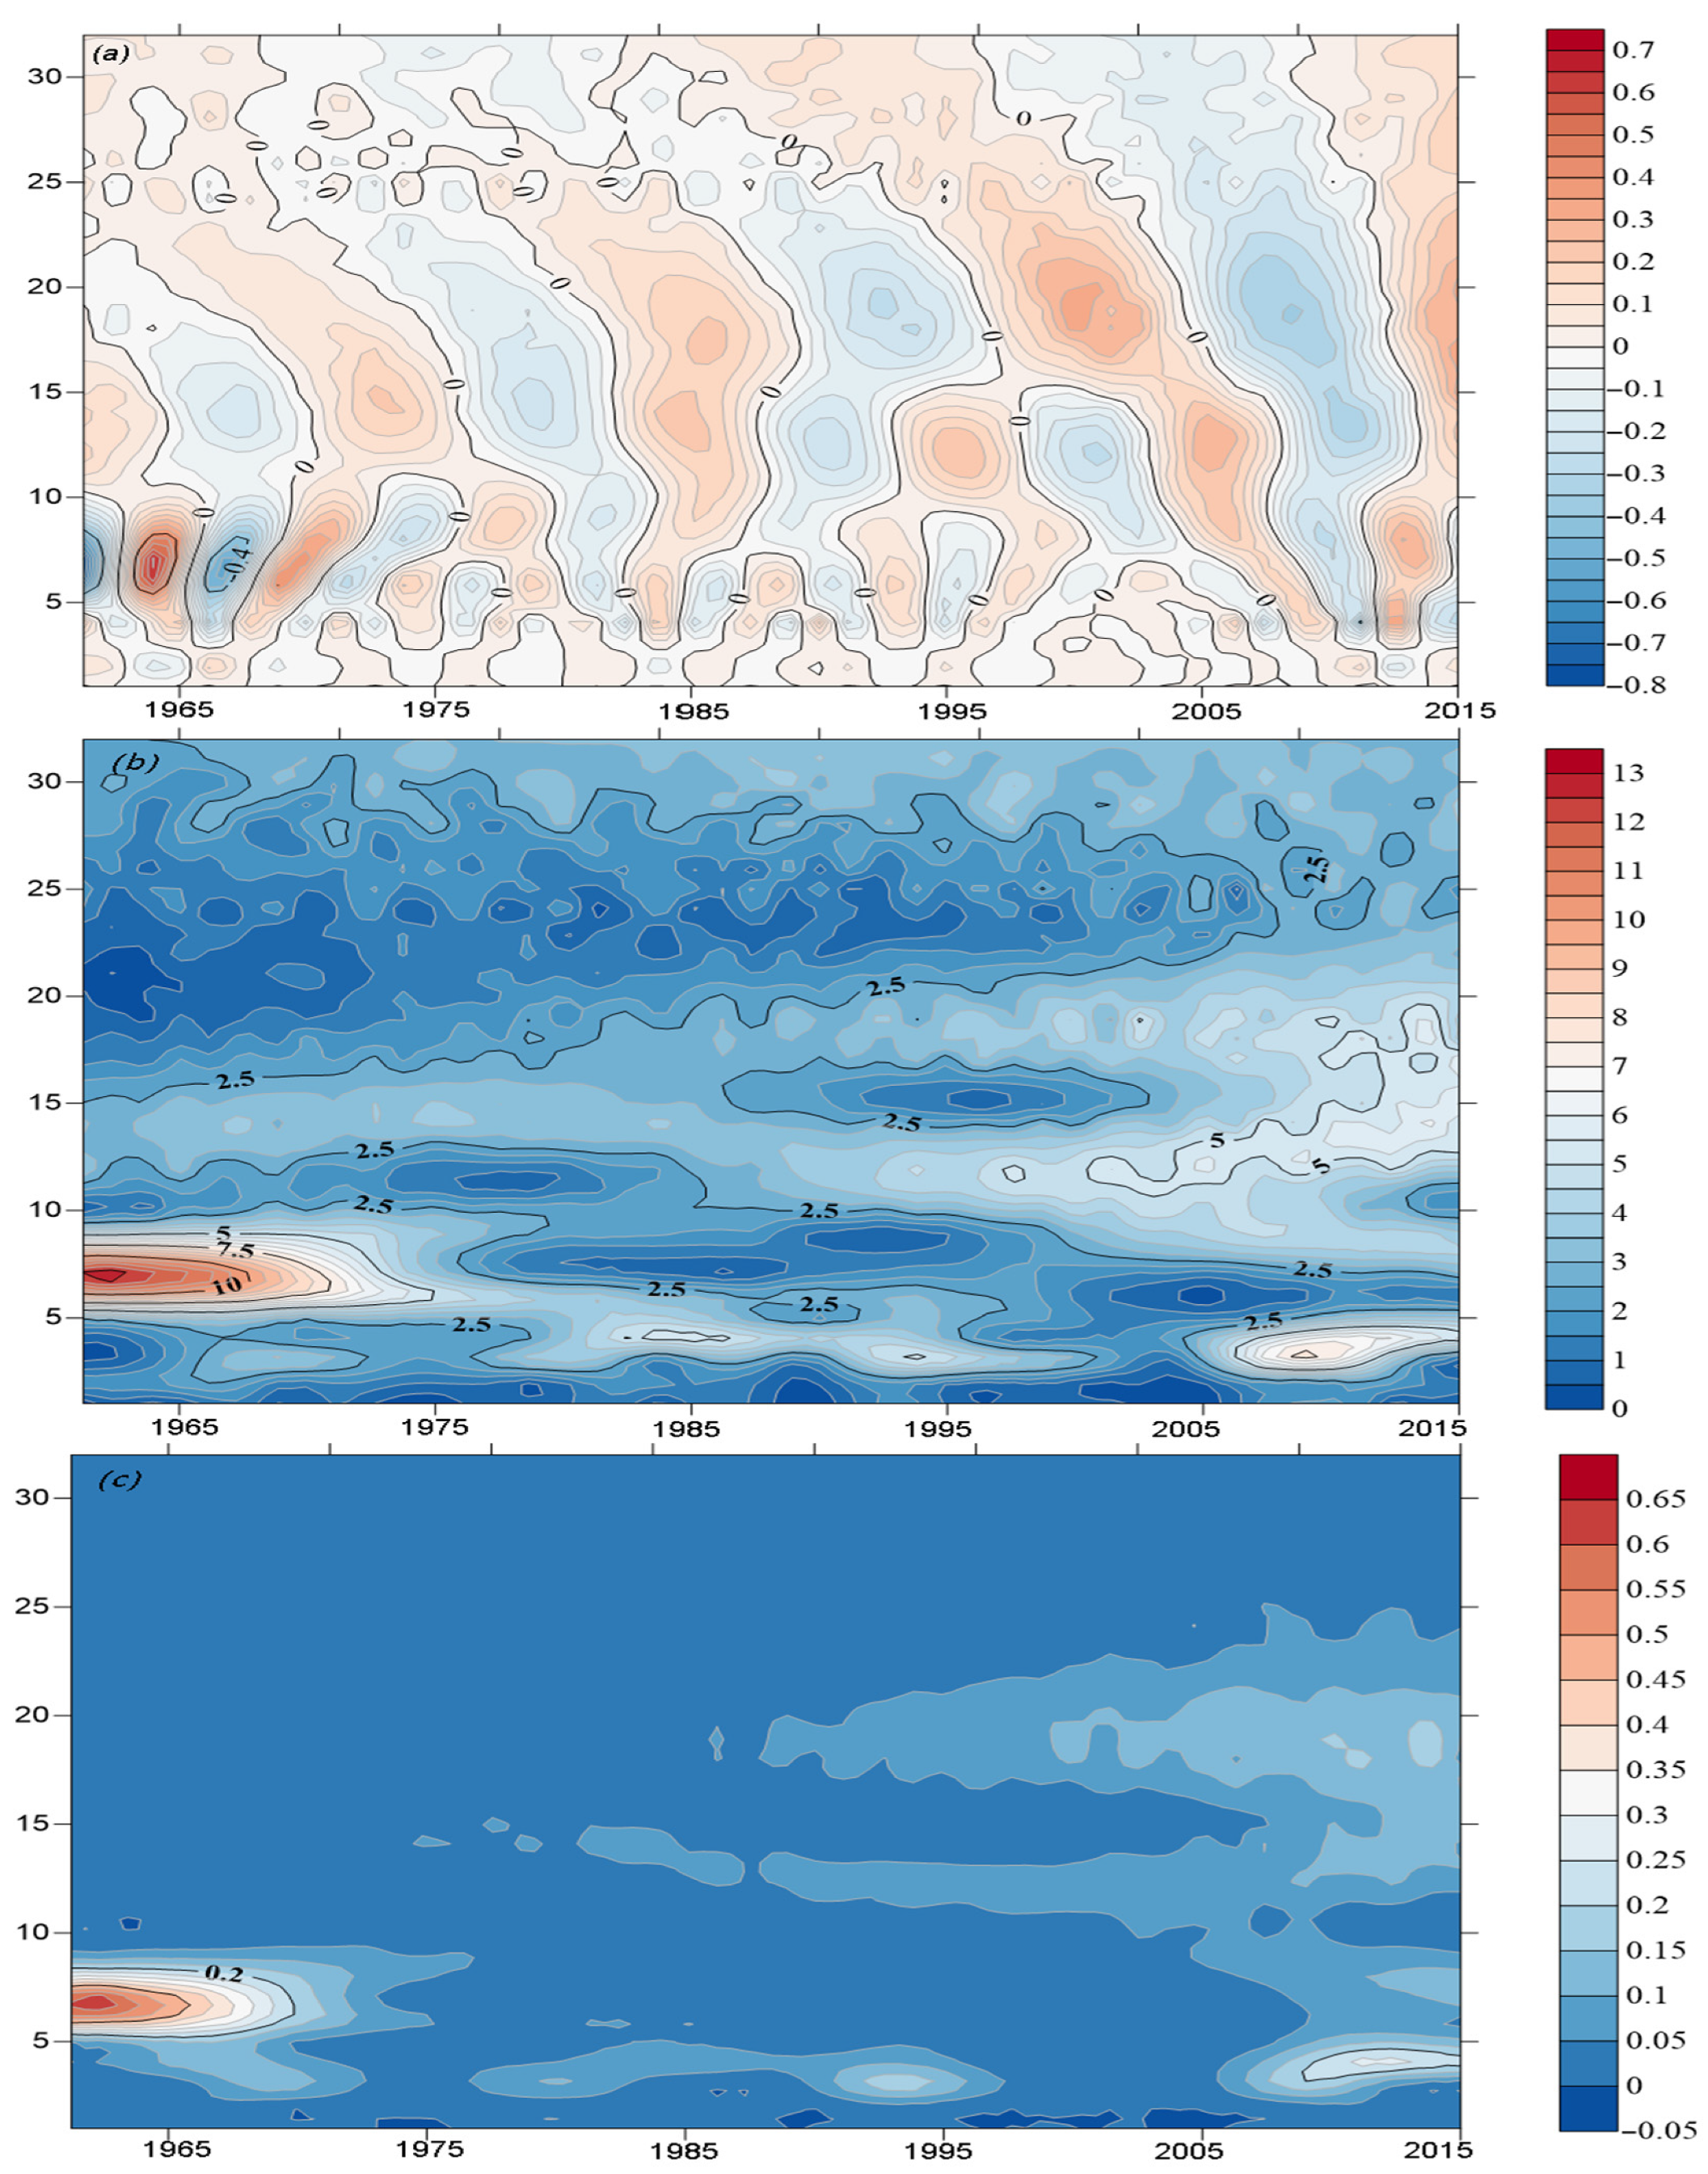
3.2.3. SPI9 Cycle Variation

Figure 7 shows the characteristics of the time-series distribution of the SPI9. The 18–27-year time-scale modulus was lower during 1970–1980 and 2000–2015, and the significance of the time-scale periodicity showed alternating changes. For the 14–18-year time scale, the periods 1975–1985 and 2000–2015 exhibited smaller energy densities, while the remaining time periods had higher energy densities. This observation indicates that the periodicity of the 14–18-year time scale showed alternating significant–non-significant variation, with periodic variations in its periodicity. The 8–13-year time scale had a higher energy density of periodic variation and a more significant periodicity. The 1998–2015 period had weaker time-scale energy, and the periodicity started to decrease.

3.2.4. Discussion

In the course of precipitation evolution in Xinyang, the SPI3 and SPI6 on a 3–7-year time scale showed local variations in periodicity, with periodic changes in the strength of the periodicity. The SPI9 only showed this in a small local area (1977–1982) with less energy and a slightly reduced periodicity, but the overall periodicity did not change much [35]. The time-scale cycle variation was the most pronounced. In general, a quasi-four oscillation in the alternating dry abundance occurred on the 14–18-year scale; a quasi-five oscillation existed on the 8–13-year time scale. It can also be seen that the cyclical variability of both the 14–18-year and 8–13-year scales was very stable throughout the analyzed time period and was global in nature. In contrast, the cyclical variability of the 3–7-year time scale became less cyclical in the mid-1990–2000 period and became more pronounced from 2000 to 2015 and onwards.
The precipitation indices at different scales are specified as follows: For medium- and long-term hydrological measurements, such as reservoir and groundwater levels, the periodicity of the two drought and flood cycles at 18–27 and 14–18 years fluctuated up and down, while the periodicity of the 8–13-year scale was more stable. On the other hand, for short-term hydrological measurements, such as for agriculture, the periodicity was more stable at the 18–27-year scale, and the periodicity at the 14–18- and 8–13-year time scales fluctuated up and down [34].

3.3. Characteristics of the Variability of Droughts and Floods in Xinyang

The 30a Morlet variance was calculated for the multi-time-scale SPI to identify the main cycles present in the evolution of droughts and floods. As can be seen from Figure 8, there were four more distinct peaks in the wavelet variance plot, which corresponded to the time scales of 4a, 7a, 13a, and 18a in order from small to large. The peaks of the wavelet variance in the SPI3 were 4a, 7a, 13a, and 19a, respectively. Similarly, in the SPI6, the peaks occurred at 4a, 7a, 13a, and 18a, respectively. Likewise, in the SPI9, the peaks were observed at 4a, 7a, 13a, and 18a, respectively. In addition, there were small peaks of 30a in the three time scales, which were not credible and are not discussed in this paper due to the small time scale of the study and the low confidence level.
The second and third peaks corresponded to time-scale values of 4a and 13a, which are the second and third main cycles, respectively. The fourth peak corresponded to a time scale of 18a, which is the fourth main cycle of drought and flooding. The fluctuations in the above four cycles reflected the evolution of droughts and floods in the Xinyang region throughout the time domain. This indicates that the 7a cycle is dominant in the Xinyang region, followed by the 4a and 13a cycles, and the 18a cycle is the least dominant.

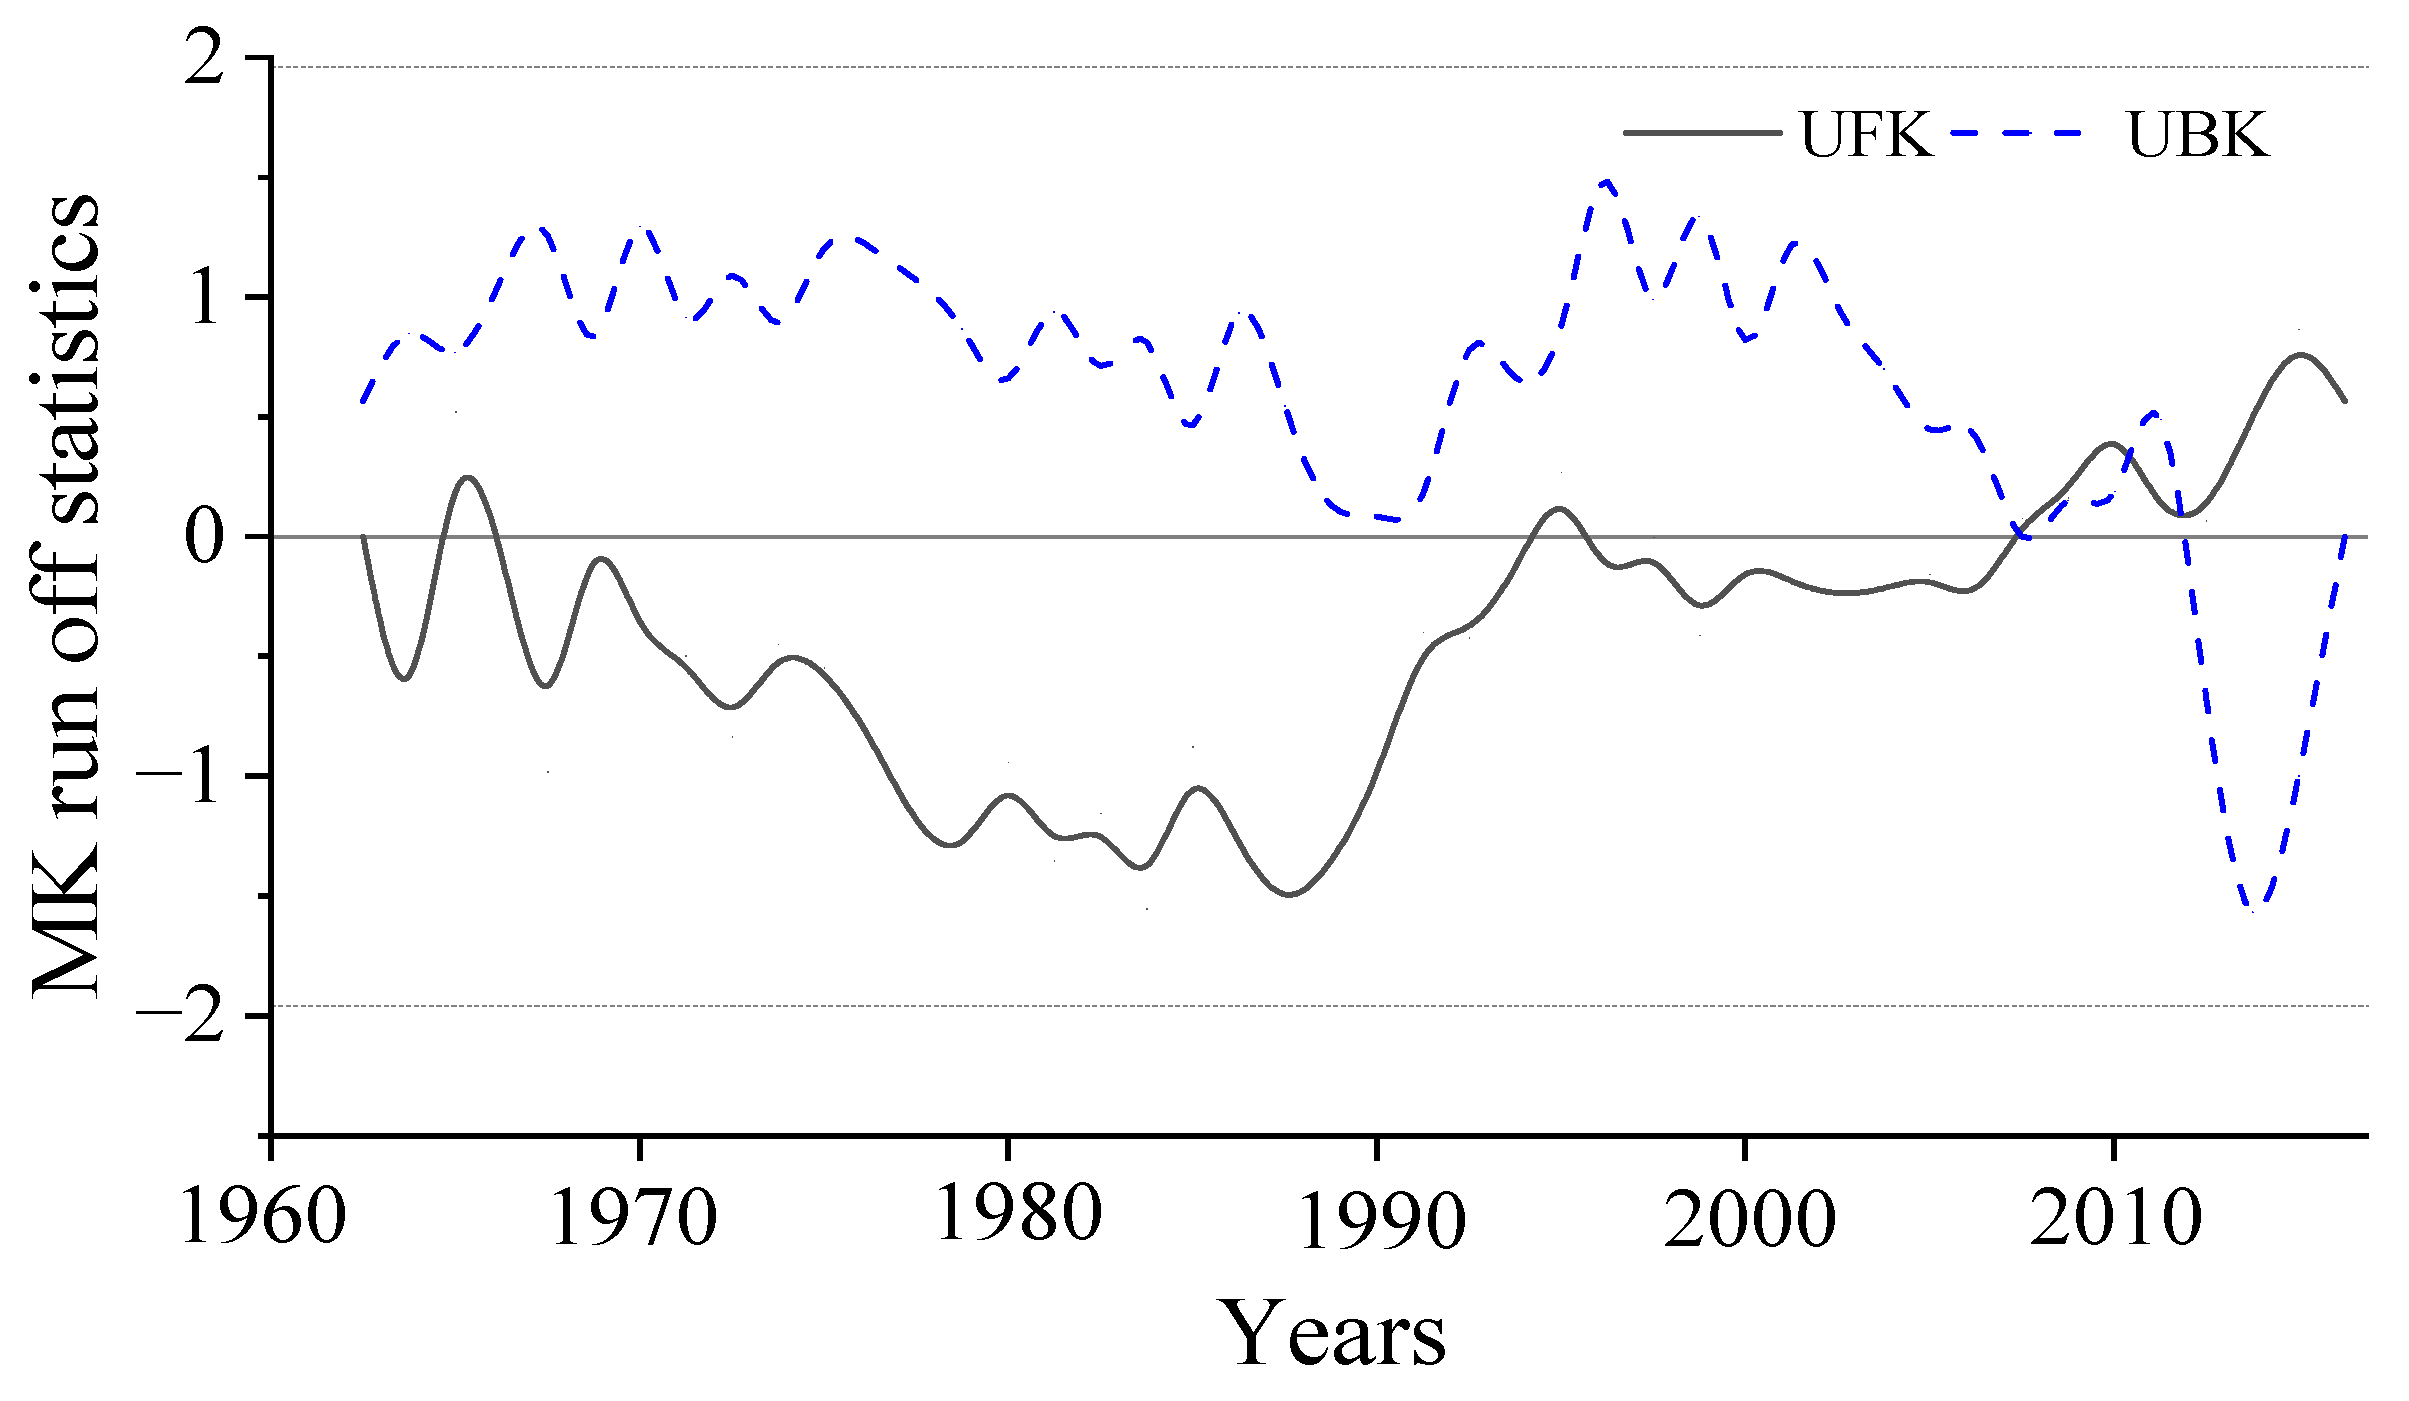
3.4. Sudden Climatic Changes in Droughts and Floods in Xinyang

The Mann–Kendall test for precipitation over the years in Xinyang City showed that precipitation declined from the 1970s to the 21st century. This trend greatly exceeded the confidence interval of 0.95 for the significance level, with a clear trend towards a decrease in the surface. The point of abrupt change in precipitation can be seen in the UF and UB curves (Figure 9), with a sudden climatic change beginning in 1996. This subsequent increase became progressively more pronounced, with the significance level test exceeding the 0.05 threshold from 2005 to 2015.
According to Figure 8, the trend suggests that there may be a crossover between the UF and UB curves after 2015. This indicates that there will be a sudden change in precipitation in the future. The rapid increase in precipitation in Xinyang may be a response to the greenhouse effect, which is not unrelated to the development of society and human activity. The city’s managers should have taken early steps to deal with this very likely change.

4. Conclusions

This paper accurately presents the trends and patterns in regional climate change in Xinyang City through a long time-series analysis. The evolutionary characteristics of droughts and floods in the Xinyang region were derived from an analysis of the SPI indices from 1961–2015. The period of change for the drought and flood patterns in the Xinyang region analyzed by the first half of the SPI time-series plot was about 17a, which is different from the 7a, 4a, and 13a periods of droughts and floods reflected by the wavelet variance in the latter part of the paper. The authors believe this is due to the obvious delayed effect of drought and flood changes and the accumulation of different cycles—for example, the accumulation of one cycle of 13a and one cycle of 4a or the accumulation of two cycles of 7a and one cycle of 4a. The results of the analysis are as follows.

4.1. Research Conclusions

(1)
The Morlet wavelet analysis based on the standardized precipitation index is able to analyze the drought and flood cycles of a particular region very well.
(2)
The standardized precipitation indices of precipitation in the Xinyang region can reflect the changes in droughts and floods in the Xinyang region in a more ambiguous way. On long time scales, the drought and flood cycles in Xinyang fluctuated up and down, and the standardized precipitation indices fluctuated differently on different scales.
(3)
The evolution of droughts and floods in Xinyang has obvious cyclical characteristics. It fluctuates up and down on the four time scales of 7a, 4a, 13a, and 18a.
(4)
The SPI time-series diagram reflects that the drought and flood patterns in the Xinyang area have a clear 17a cycle and fluctuate over a time period of about 5a.
(5)
Floods occur more frequently in Xinyang than droughts, and they are more likely to occur in the future. The prevention and control of droughts and floods should be based on combining the drought and flood cycles in the Xinyang region, focusing on floods.
(6)
According to the analysis results in the paper, there is a greater possibility of drought and flood disasters occurring during 2017–2021.

4.2. Policy Recommendations

According to the analysis results of this paper, Xinyang City had high precipitation in 2018–2019, and flooding may occur, which will later turn into a drought. Relevant government departments should pay attention to this and implement effective flood prevention and mitigation in advance.

4.3. Research Shortcomings and Outlook

The availability of meteorological data limited the study in this paper, as the latest data are not publicly available, resulting in a study that did not track the time frame to the latest year. Using remote sensing data allows for the acquisition of up-to-date monitoring data for the entire study area. However, using remote sensing data to accurately estimate drought conditions in the area will be a major challenge. The use of classical methods (e.g., the SPI in this paper) combined with new technologies (remote sensing) for regional drought monitoring will be our future research direction.

Author Contributions

Conceptualization, X.G.; methodology, X.G.; software, X.G. and W.Z.; validation, P.Z. and X.G.; formal analysis, Y.L.; investigation, P.J.; resources, S.W.; data curation, P.Z. and X.G.; writing—original draft preparation, X.G.; writing—review and editing, X.L.; visualization, X.G. and W.Z.; supervision, A.L.; project administration, A.L.; funding, A.L. and X.L. All authors have read and agreed to the published version of the manuscript.

Funding

This research was supported by the National Natural Science Foundation of China (grant number: 42071286) and the Third Xinjiang Scientific Expedition Program (grant number: 2021XJKK0406).

Institutional Review Board Statement

Not applicable.

Informed Consent Statement

Not applicable.

Data Availability Statement

Not applicable.

Acknowledgments

This work was supervised by Haibin Tong of Henan University. The work was supported by the “Ten Thousand People Plan” of China for Science and Technology Innovation Leaders. At the same time, the reviewers made a lot of constructive comments. The editors were very efficient in handling the manuscript throughout the process. We would like to express our gratitude here.

Conflicts of Interest

The authors declare no conflict of interest.

References

  1. Elahi, E.; Khalid, Z.; Tauni, M.; Zhang, H.; Lirong, X. Extreme weather events risk to crop-production and the adaptation of innovative management strategies to mitigate the risk: A retrospective survey of rural Punjab, Pakistan. Technovation 2021, 117, 102255. [Google Scholar] [CrossRef]
  2. Mokhov, I.; Semenov, V. Weather and Climate Anomalies in Russian Regions Related to Global Climate Change. Russ. Meteorol. Hydrol. 2016, 41, 84–92. [Google Scholar] [CrossRef]
  3. Liu, Y.; Zhu, Y.; Ren, L.; Singh, V.P.; Yong, B.; Jiang, S.; Yuan, F.; Yang, X. Understanding the Spatiotemporal Links Between Meteorological and Hydrological Droughts From a Three-Dimensional Perspective. J. Geophys. Res.-Atmos. 2019, 124, 3090–3109. [Google Scholar] [CrossRef]
  4. Park, S.-Y.; Sur, C.; Lee, J.-H.; Kim, J.-S. Ecological drought monitoring through fish habitat-based flow assessment in the Gam river basin of Korea. Ecol. Indic. 2020, 109, 105830. [Google Scholar] [CrossRef]
  5. Raheem, N.; Cravens, A.E.; Cross, M.S.; Crausbay, S.; Ramirez, A.; McEvoy, J.; Zoanni, D.; Bathke, D.J.; Hayes, M.; Carter, S.; et al. Planning for ecological drought: Integrating ecosystem services and vulnerability assessment. Wiley Interdiscip. Rev.-Water 2019, 6, e1352. [Google Scholar] [CrossRef]
  6. Goulden, M.L.; Bales, R.C. California forest die-off linked to multi-year deep soil drying in 2012–2015 drought. Nat. Geosci. 2019, 12, 632–637. [Google Scholar] [CrossRef]
  7. Millar, C.I.; Stephenson, N.L. Temperate forest health in an era of emerging megadisturbance. Science 2015, 349, 823–826. [Google Scholar] [CrossRef]
  8. Jongman, B.; Hendriks, D.; Trambauer, P.; Tijssen, A.; Werner, M.; Maskey, S.; Svoboda, M.; Tadesse, T.; Veldkamp, T.I.E.; Funk, C.; et al. Assessing Drought Hazard and Risk: Principles and Implementation Guidance. 2019. Available online: https://elibrary.worldbank.org/doi/abs/10.1596/33805 (accessed on 1 July 2019).
  9. Jinsong, W.; Jiangyong, G.U.O.; Yuewu, Z.; Lanfang, Y. Progress and prospect on drought indices research. Arid Land Geogr. 2007, 30, 60–65. [Google Scholar]
  10. Hao, Z.; Yuan, X.; Xia, Y.; Hao, F.; Singh, V.P. An overview of drought monitoring and prediction systems at regional and global scales. Bull. Am. Meteorol. Soc. 2017, 98, 1879–1896. [Google Scholar] [CrossRef]
  11. Wei, W.; Zhang, J.; Zhou, L.; Xie, B.; Zhou, J.; Li, C. Comparative evaluation of drought indices for monitoring drought based on remote sensing data. Environ. Sci. Pollut. Res. 2021, 28, 20408–20425. [Google Scholar] [CrossRef]
  12. Zhang, L.; Jiao, W.; Zhang, H.; Huang, C.; Tong, Q. Studying drought phenomena in the Continental United States in 2011 and 2012 using various drought indices. Remote Sens. Environ. 2017, 190, 96–106. [Google Scholar] [CrossRef]
  13. Guttman, N.B. Accepting the standardized precipitation index: A calculation algorithm. J. Am. Water Resour. Assoc. 1999, 35, 311–322. [Google Scholar] [CrossRef]
  14. Vicente-Serrano, S.; Beguería, S.; López-Moreno, J.I. A Multiscalar Drought Index Sensitive to Global Warming: The Standardized Precipitation Evapotranspiration Index. J. Clim. 2010, 23, 1696–1718. [Google Scholar] [CrossRef] [Green Version]
  15. McKee, T.; Doesken, N.; Kleist, J. The Relationship of Drought Frequency and Duration to Time Scales. In Proceedings of the 8th Conference on Applied Climatology, Anaheim, CA, USA, 17–22 January 1993; Volume 17. [Google Scholar]
  16. Zhao, Q.; Chen, Q.; Jiao, M.; Wu, P.; Gao, X.; Ma, M.; Hong, Y. The Temporal-Spatial Characteristics of Drought in the Loess Plateau Using the Remote-Sensed TRMM Precipitation Data from 1998 to 2014. Remote Sens. 2018, 10, 838. [Google Scholar] [CrossRef] [Green Version]
  17. Huang, W.-H.; Sui, Y.; Yang, X.-G.; Dai, S.-W.; Li, M.-S. Characteristics and adaptation of seasonal drought in southern China under the background of climate change. III. Spatiotemporal characteristics of seasonal drought in southern China based on the percentage of precipitation anomalies. Ying Yong Sheng Tai Xue Bao = J. Appl. Ecol. 2013, 24, 397–406. [Google Scholar]
  18. Jianyong, M.; Yinlong, X.; Jie, P. Drought tendency based on standardized precipitation index(SPI) and relative moisture index o- ver Northeast China from May to September during 1961–2009. J. Meteorol. Environ. 2012, 28, 90–95. [Google Scholar]
  19. Li, Q.; Zhihong, J.; Qing, L. Comparative application of Palmer drought index and precipitation spacing in Shaanxi. J. Shaanxi Meteorol. 2008, 2, 9–12. [Google Scholar] [CrossRef]
  20. Yubi, Y.A.O.; Anxiang, D.; Yirong, W.; Xiuyun, Z.; Jinhu, Y. Compare research of the regional arid characteristic base on Palmer drought severity index in spring over China. Arid Land Geogr. 2007, 30, 22–29. [Google Scholar]
  21. Weidong, Y.; Jungao, L.; Jun, C.; Jijun, W. Changes in Extreme Temperature and Precipitation in Henan Province During 1957–2005. Adv. Clim. Change Res. 2008, 2, 1673–1719. [Google Scholar]
  22. Guoyong, Z.; Yan, H.; Minghua, L.; Chang, X.; Feng, X.; Junli, H. Spatial-temporal Variations of Extreme Temperature Events in Henan Province from 1961 to 2016. J. Xinyang Norm. Univ. 2019, 32, 95–101. [Google Scholar]
  23. Wenhua, G.; Kaifeng, L.; Yu, C. Temporal and Spatial Variation of Extreme Temperature Events in Henan Province During 1960–2014. Sci. Geogr. Sin. 2017, 37, 1259–1269. [Google Scholar]
  24. Delin, L. Risk Evaluation of Flood Disasters in Henan Province Based on GIS. Bull. Soil Water Conserv. 2014, 34, 126–129. [Google Scholar]
  25. Junling, L.I.; Zhongyang, L.I.U.; Chunhui, Z.O.U. Assessment and Zonation of Flood Disaster Risk in Henan Province Based on GIS. Meteorol. Mon. 2010, 36, 87–92. [Google Scholar]
  26. Mengjie, L.; Delin, L. Resilience of Henan Province After Flood Disasters. Bull. Soil Water Conserv. 2020, 40, 200–204. [Google Scholar]
  27. Wentian, L. Basic Characteristics and Countermeasures of Flood Disaster in Xinyang City of Henan, China. Mt. Res. 2014, 32, 105–110. [Google Scholar]
  28. Fuqiang, W.; Lei, W. An Analysis of Characteristics of Droughts in Henan Province Based on Precipitation Anomaly Percentage. China Rural. Water Hydropower 2014, 12, 84–88. [Google Scholar]
  29. Zhengwei, Y. Flood and Drought Change Based SPI Analysis in the Developing Coastal Region of Jiangsu Province: A Case Study in Yancheng City. Sci. Geogr. Sin. 2014, 34, 479–487. [Google Scholar]
  30. Abdourahamane, Z.S.; Acar, R. Analysis of meteorological drought variability in Niger and its connection with climate indices. Hydrol. Sci. J. 2018, 63, 1203–1218. [Google Scholar] [CrossRef]
  31. Hinge, G.; Piplodiya, J.; Sharma, A.; Hamouda, M.A.; Mohamed, M.M. Evaluation of Hybrid Wavelet Models for Regional Drought Forecasting. Remote Sens. 2022, 14, 6381. [Google Scholar] [CrossRef]
  32. Ruwangika, A.M.; Perera, A.; Rathnayake, U.; Shahid, S. Comparison of Statistical, Graphical, and Wavelet Transform Analyses for Rainfall Trends and Patterns in Badulu Oya Catchment, Sri Lanka. Complexity 2020, 2020, 7146593. [Google Scholar] [CrossRef]
  33. Ghasempour, R.; Roushangar, K.; Ozgur Kirca, V.S.; Demirel, M.C. Analysis of spatiotemporal variations of drought and its correlations with remote sensing-based indices via wavelet analysis and clustering methods. Hydrol. Res. 2021, 53, 175–192. [Google Scholar] [CrossRef]
  34. Da, M.; Shimin, L.; Jiangjiang, K.; Zhiwei, D. Study on Spatial-temporal Differentiation of FamersIncome in Xinyang at Town Scale. J. Henan Agric. Sci. 2015, 44, 165–172. [Google Scholar]
  35. Yisheng, B.; Tao, C.; Jing, L.; Yixin, L.; Guohong, Z. Evaluation of water environmental bearing capacity and suggestions for its optimization in Xinyang. Environ. Eng. 2019, 37, 78–82. [Google Scholar]
  36. Svoboda, M.D.; Fuchs, B.A.; Poulsen, C.C.; Nothwehr, J.R. The drought risk atlas: Enhancing decision support for drought risk management in the United States. J. Hydrol. 2015, 526, 274–286. [Google Scholar] [CrossRef] [Green Version]
  37. Bonacci, O.; Bonacci, D.; Roje-Bonacci, T.; Vrsalović, A. Proposal of a new method for drought analysis. J. Hydrol. Hydromech. 2023, 71, 100–110. [Google Scholar] [CrossRef]
  38. Wenping, Y.; Guangsheng, Z. Comparison between standardized precipitation index and Z-index in China. Acta Phytoecol. Sin. 2004, 28, 523–529. [Google Scholar]
  39. Wu, H.; Hayes, M.J.; Weiss, A.; Hu, Q. An evaluation of the Standardized Precipitation Index, the China-Z Index and the statistical Z-Score. Int. J. Climatol. 2001, 21, 745–758. [Google Scholar] [CrossRef]
  40. Yanping, L.; Huanjie, C. Suitability analysis of three drought indices in Jinghuiqu irrigation district. Agric. Res. Arid Areas 2014, 32, 236–241. [Google Scholar]
  41. Hua, Y.; Hong, S.; Tao, Z.; Qibin, F. Applications of Morlet Wavelets in Time-frequency Localization of Signals. Math. Appl. 2010, 23, 395–400. [Google Scholar]
  42. Yue, S.; Pilon, P.; Cavadias, G. Power of the Mann-Kendall and Spearman's rho tests for detecting monotonic trends in hydrological series. J. Hydrol. 2002, 259, 254–271. [Google Scholar] [CrossRef]
  43. Hamed, K.H. Trend detection in hydrologic data: The Mann-Kendall trend test under the scaling hypothesis. J. Hydrol. 2008, 349, 350–363. [Google Scholar] [CrossRef]
  44. Wenxiu, L.; Bingjun, L.; Junfan, C.; Xiaohong, C. Variation Trend of Precipitation in the Pearl River Basin in Recent 50 Years. J. Nat. Resour. 2014, 29, 80–90. [Google Scholar]
Figure 1. Research framework.
Atmosphere 14 01196 g001
Figure 2. Geographical location and basic overview of the Xinyang region.
Atmosphere 14 01196 g002
Figure 3. Trends in temperature and precipitation in the Xinyang, 1961–2015.
Atmosphere 14 01196 g003
Figure 4. (a) SPI3, (b) SPI6, and (c) SPI9 sequences and 9-, 18-, and 36-month slide average charts for Xinyang in 1961–2015.
Atmosphere 14 01196 g004aAtmosphere 14 01196 g004b
Figure 5. Morlet wavelet real part contour map (a), modal contour map (b), and modulus squared contour map (c) of the SPI3 time series.
Atmosphere 14 01196 g005
Figure 6. Morlet wavelet real part contour map (a), modal contour map (b), and modulus squared contour map (c) of the SPI6 time series.
Atmosphere 14 01196 g006
Figure 7. Morlet wavelet real part contour map (a), modal contour map (b), and modulus squared contour map (c) of the SPI9 time series.
Atmosphere 14 01196 g007
Figure 8. Morlet wavelet coefficient variance figure of the (a) SPI3, (b) SPI6, and (c) SPI9 sequences.
Atmosphere 14 01196 g008
Figure 9. Mann–Kendall test of Xinyang precipitation in 1950–2010.
Atmosphere 14 01196 g009
Table 1. Basis for the treatment of precipitation characteristic values.
Numerical ValueDescriptionProcessing Result (0.1 mm)
32,766No dataLinear interpolation
32,700Slight or icy0
32XXXFog, dew, and frost0
31XXXSnow (sleet and snow storms)Value minus 31,000
30XXXRain and snowValue minus 30,000
Table 2. Results of one-sample t-test analysis of precipitation in Xinyang.
Sample SizeMinimum ValueMaximum ValueMeanStandard Deviationtp
55494.301561.701115.42261.7729.21 *0.00 **
Note: * p < 0.05; ** p < 0.01.
Table 3. Drought classification based on SPI values.
Numerical ValueDrought and Flood Rating
2.0 and aboveHeavy flooding
1.5~1.99Moderate flooding
1.0~1.49Light flooding
−0.99~0.99Normal
−1.0~−1.49Light drought
−1.5~−1.99Moderate drought
−2.0 and belowSevere drought
Disclaimer/Publisher’s Note: The statements, opinions and data contained in all publications are solely those of the individual author(s) and contributor(s) and not of MDPI and/or the editor(s). MDPI and/or the editor(s) disclaim responsibility for any injury to people or property resulting from any ideas, methods, instructions or products referred to in the content.

