Abstract
Floods are a recurring natural phenomenon during the rainy season in many Brazilian municipalities. Nevertheless, shifts in weather patterns have contributed to an increased incidence of these events in urban areas, where their impact can be amplified by the way the surrounding catchment is occupied. Hence, the present study sought to evaluate the susceptibility of the urban drainage infrastructure in João Monlevade, Brazil, to the effects of climate change by undertaking a comprehensive assessment of the Carneirinhos catchment, including its morphometric characteristics. For this purpose, we employed a hydrological model driven by regional rainfall projections from a high-resolution climate model (HadGEM2-ES downscaled to 5 km resolution) under the Representative Concentration Pathways (RCP8.5) scenario. Several combinations of rainfall occurrence were simulated, incorporating temporal aspects (different durations and return times), as well as spatial aspects (concentrated and distributed rainfall within the catchment). The results showed that the area of exposed soil in the Carneirinhos catchment experienced an increase of more than 140% from 2016 to 2019, favoring runoff surface and evaporation, which contributed to the increase in the number of flood events in the region. In addition, only 1 of the 56 heavy rainfall event simulations performed did not exceed the capacity of the macro drainage gallery.
1. Introduction
Floods are one of the main concerns of public management. Such events cause severe material damage as well as human losses around the world [1]. In low-income countries, flash floods pose restrictions on economic growth and development [2] The characteristics of urban flooding events, such as the short response time and high level of imperviousness, present a challenge for the hydrological modeling and application in early warning systems [3]
The effects of floods in developing countries are more severe due to the lack of financial resources and technological means to predict damages [4]. One of the main characteristics to be evaluated during flood events is the spatiotemporal variability of rainfall. In this context, some studies have revealed that it can be a controlling factor in hydrological response [5,6,7].
The knowledge of extreme precipitation behavior, in regional terms, both under natural climatic conditions and considering the influence of future climate changes, is a key factor from a flood risk management point of view. Hence, tools such as hydrological modeling and regional climate model outputs are extremely necessary for flood risk assessment.
Since the last century, with the computational processing resources evolution, scientists’ ability to simulate future climate conditions using mathematical models has grown dramatically. This ability was achieved after several advances in understanding the fundamentals of fluid dynamics and thermodynamics, and the physical process that defines the evolution of the atmosphere state.
The mathematical models, used to project global future climate conditions, can realistically simulate the largest-scale features of atmospheric circulation. These models include Global Climate Models (GCMs), which represent the physical atmospheric processes; Atmosphere-Ocean Global Climate Models (AOGCMs), which consider the interaction between the processes that occur in the atmosphere and ocean; and more recently, Earth System Models (ESM), which include physical, chemical, and biological processes, reaching far beyond their predecessors.
Despite the evolution of these models, due to the computational power currently available, the GCMs projections still present a coarse horizontal resolution (100–200 km), i.e., not sufficient for conducting regional- and local-scale studies. Thus, between 1989 and 1990, a methodology of high-resolution limited-area meteorological models nesting in the outputs of GCMs was first applied, giving rise to the so-called regional climate models (RCMs) or limited-area models [8].
Regional modeling is also commonly referred to as dynamical downscaling, which is a technique where the GCM can describe the response of the global circulation to large-scale forcings, such as due to greenhouse gases (GHGs), while the RCM can spatially and temporally refine this large-scale information [9], which means that the former provides the boundary conditions for the latter. However, if the initial and lateral boundary conditions provided by the GCMs (nesting process) do not realistically represent the main pattern of the atmospheric circulation, the same is expected of the RCM—a problem referred to as “garbage in, garbage out” [8].
The RCMs have evolved into general and multipurpose modeling tools for application to vulnerability, impacts, and adaptation assessments, as they account for the effects of sub-GCM grid scale forcings and processes, such as due to complex topography, coastlines, inland water bodies, and land cover distribution, or dynamical processes occurring at the mesoscale [9].
Studies integrating climate model outputs into hydrological modeling have grown substantially to investigate the impact of climate change on the hydrological regime [10,11,12,13]. For this purpose, in South America, one of the most applied RCMs to yield precipitation projections is the Eta-CPTEC [14], which has been used even in relatively small drainage basins (<5000 km2) [11,15,16]. The National Institute for Space Research (INPE) coordinated sets of downscaled products based on the Eta RCM for climate research in South America nested in four different GCMs with a horizontal resolution of 20 km [14,17] and one of 5 km for Southeast Brazil, which was utilized with HadGEM2-ES [18].
Almagro et al. [19] evaluated the performance of Eta/HadGEM2- ES and Eta/MIROC5 precipitation simulations over Brazil and recommended obtaining long-term mean monthly precipitation from the Eta/HadGEM2-ES for the Atlantic Forest, Cerrado, and Pampa, and from the Eta/MIROC5 for the Caatinga and Pantanal biomes. Michelan et al. [12] used combinations of the Eta-CPTEC nested with the CanESM2, HadGEM2-ES, and MIROC5 GCM, with the SMAP hydrological model to investigate the impact of climate change on water levels of a data-poor river basin in southeastern Brazil. The authors found that the Eta/HadGEM2-ES-5 km was the most precise among those used. Moreover, according to Alvarenga et al. [20], the Eta/HadGEM2-ES-5 km may capture topographic features and extreme values better when compared with low-resolution simulations (20 km)
Other GCMs have been employed for the examination of flood phenomena. An integrated framework, encompassing the incorporation of the Hydrologic Modeling System (HEC-HMS) alongside the GCMs of the Coupled Model Intercomparison Project Phase (CMIP5), has been applied to investigate floods by varying return periods in Illinois, USA [21]. The authors concluded that the combination of HMS and CMIP5 GCMs was efficient for assessing climate change impacts on floods events, especially when a distributed hydrologic modeling was not an option due time or monetary constraints.
The selection of a singular hydrological model and a single General Circulation Model (GCM) is a matter that may elicit debate, considering the multitude of models accessible for impact assessments.
However, it is important to highlight that the model resolution has potentially significant impact on results. For example, 1 km of hydrological model could have a similar resolution of a 3D ocean circular model applied to the northern Gulf of Alaska [22]. In addition, as the dynamical downscaling is a computationally expensive method, some studies have relied on only one downscaled GCM dataset e.g., Refs. [23,24] with adequate spatial resolution, which makes it possible to reproduce topographic variations that can drive the precipitation variability over small regions of complex terrain.
In this context, the objective of this manuscript was to evaluate the efficacy of the drainage system at an urban catchment under various rainfall and climatic conditions. The paper is structured as follows: Section 1 provides a concise overview of flood risk management and the application of climate models. Section 2 outlines the methodology implemented in this case study, which involves the use of the HEC-HMS driven by Eta/HadGEM2-ES rainfall outputs. The findings are presented in Section 3, followed by a discussion of the results in Section 4. Finally, Section 5 offers the conclusions drawn from this study.
2. Methodology
2.1. Study Area
The Carneirinhos creek catchment is in João Monlevade, Minas Gerais, Brazil, covering an area of 26.5 km2 (Figure 1). Despite its small-scale size, Carneirinhos is an urban catchment with a history of flooding and an unplanned drainage system from the early 1970s, as shown in Figure 2.
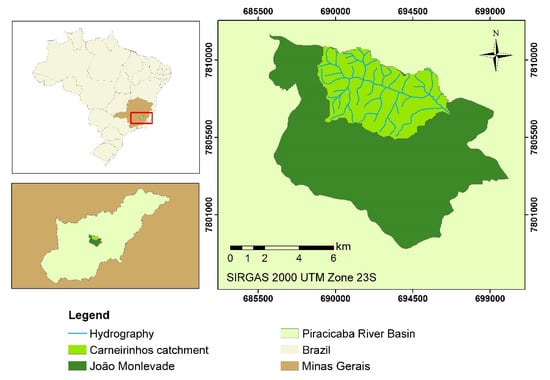
Figure 1.
Carneirinhos catchment location (right panel) relative to Brazil (top left) and Piracicaba River Basin (bottom left).
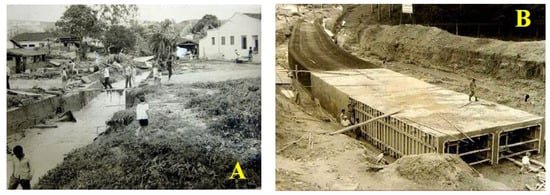
Figure 2.
Carneirinhos creek before canalization (A) and channel beginning efforts in the early 1970s (B). Source: Water distribution department of João Monlevade dataset.
Figure 3 shows the subdivision proposed in this study (spring, medium, and low Carneirinhos). This subdivision guided in the spatial analysis of extreme events along the catchment. The spring Carneirinhos region comprises the basin area upstream of the beginning of the stream channeling. The medium Carneirinhos comprises the first half of the path between the beginning of the channeling and the outlet of the basin on the Piracicaba River. This region is the only one where the watercourse is completely channeled and where is most of the commercial center. The final stretch comprises the lower Carneirinhos.
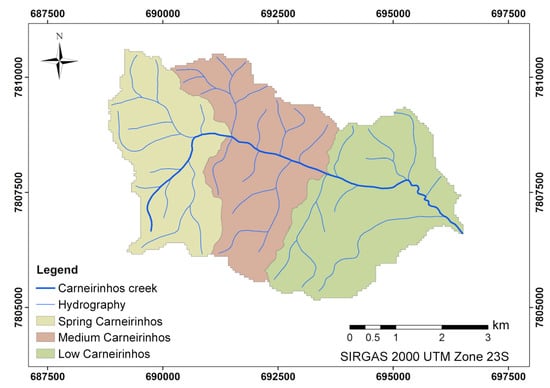
Figure 3.
Catchment subdivision proposed.
2.2. Rainfall Data and Climate Simulation Model
The daily rainfall dataset for the Carneirinhos river basin at the period of 1989–2018 was obtained from the National Institute of Meteorology (INMET, rain gauge station number 313662070A). The hydrological years were considered in the analysis, and the consistency and representativeness of this dataset were assessed. After this, the maximum annual precipitation values for each one of the 28 hydrological years considered were obtained.
Projections of climate change for South America, generated by the Center for Weather Forecasting and Climate Studies/National Institute for Space Research (CPTEC/INPE) and regionalized by the Eta Model, are currently available on Plataforma Projeta [14,17]. During the period this article was developed, the only regionalized simulation available with 5 km of resolution for Southeast Brazil was the one forced with the HadGEM2-ES model [19]. This higher-resolution set of simulations was chosen, as the Carneirinhos river basin has an area of 26.54 km2. Therefore, daily rainfall data for the period of 1979–2018 were considered for the historical scenario and from 2019 to 2048 for the RCP (Representative Concentration Pathway) 8.5 scenario. This scenario was chosen since it is the closest to the trends observed in current measurements of greenhouse gas concentrations in the atmosphere [12]. In addition, as this is a worst-case scenario, the changes found in this study might be less than presented if lower emission scenarios are adopted, highlighting the risks that might arise from extreme conditions.
In this study, Linear Scaling (LS) was applied to perform bias correction of the simulated rainfall data using the Climate Model for Hydrologic Modeling (CMhyd) software [20]. This software is widely used to perform bias correction of precipitation and temperature data from various climate models to prepare the data for hydrological impact studies. Andrade et al. [16] used the LS method for precipitation bias correction of Eta/HadGEM2-ES simulations for the assessment of climate change impact in the Mundaú river basin, northeastern Brazil. In addition, Santos et al. [13] applied two bias correction methods (LS and Distribution Mapping—DM) for Eta/HadGEM2-ES simulations in order to assess the impact of climate change on the hydrological regime of the Paraguaçu river basin, northeastern Brazil. The authors found that both methods were able to correct the climate projection bias, but the DM method showed a larger distortion when applied to future scenarios.
Figure 4 shows a flowchart that represents the step-by-step methodology applied in this study case. The first step was a catchment characterization, which made it possible to propose a basin subdivision (springhead, medium, and low Carneirinhos). After, the bias correction was applied to the Eta/HadGEM2-ES rainfall outputs based on the observed daily rainfall. Next, the yearly maximum daily rainfall was selected and statistically adjusted to a probability distribution. Then, the daily rainfall was disaggregated in rainfall of shorter durations to apply the intensity-duration-frequency (IDF) equation. With this information, different combinations (56 in total) of rainfall occurrence were simulated by the Hydrologic Modeling System (HEC-HMS), incorporating temporal aspects (different return times and duration), as well as spatial (concentrated and distributed rainfall within the catchment).
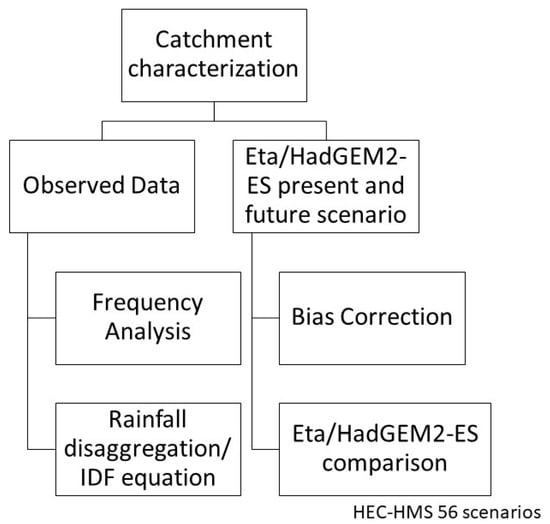
Figure 4.
Methodology flowchart.
3. Results
3.1. Catchment Land Use and Occupation
Figure 5 and Table 1 present the catchment land use and occupation varying between 2005, 2016, and 2019. It was possible to verify that the Industrial Area class experienced an increase of 17% from 2005 to 2016 and remained unchanged from 2016 to 2019. The buildings class presented a similar behavior, as it grew 1% from 2005 to 2016 and did not change between 2016 and 2019. The Pasture class had a growth of approximately 1% between 2005 and 2016 and a reduction of approximately 8% from 2016 to 2019. The area of the Exposed Soil class presented a reduction of 6% in the first period and an increase of more than 140% from 2016 to 2019 (Table 1).
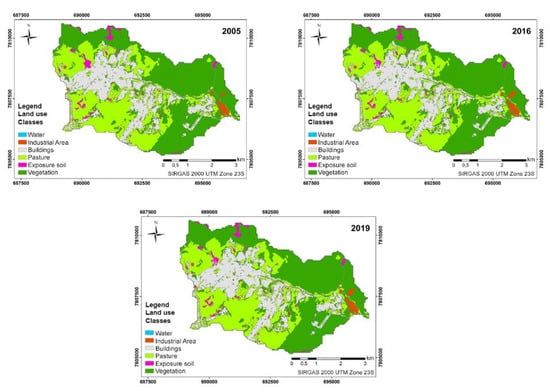
Figure 5.
Catchment land use and occupation comparison.

Table 1.
Land use classification.
The vegetation class was the one that lost the most useful area, since it suffered a reduction of 1.3% from 2005 to 2016; however, in the following period, it remained constant. Thus, the anthropized areas (Industrial, Buildings, and Pasture classes) showed growth on the edges of the occupied areas, with no opening of clearings or vegetation suppression in forest areas. In 2005, the sum of classes equivalent to anthropic uses was 57.6%, whereas in 2016 and 2019, it was close to 58.1%. One of the main factors that contributed to this was the expansion of these areas within the urban perimeter, contributing to the increase of the exposed soil area, which reduced the water permeability in the soil, favoring runoff and evaporation. This situation contributed to the increase in the number of flood events in the region.
3.2. Frequency Analysis
The frequency analysis is a crucial step for spatiotemporal rainfall analysis. Here, a probability distribution was adjusted to then disaggregate the rainfall and apply the IDF equation to obtain the 56 simulations of rainfall occurrence.
A common approach is to fit a probability distribution, such as the normal or log-normal distribution, to the historical data and use the parameters of the fitted distribution to estimate the probability of different outcomes in the future. This method can be used to estimate the likelihood of extreme events, such as floods. Hence, we selected the maximum annual rainfall in the historical rain gauge closest to the study area (INMET 31362070A) between 1989 and 2018.
As can be seen in Figure 6, the Gamma distribution was the distribution that best fitted the observed rainfall by the quantile plot adjust analysis with 95% confidence. Then, a disaggregation and rearrangement for each return period considered was developed (see Figure 7 for 5-year return period).
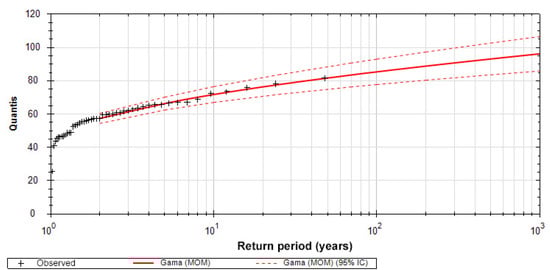
Figure 6.
Quantile plot of observed annual maximum daily precipitation with Gamma distribution fit.

Figure 7.
Disaggregation and rearrangement for 5-year return period.
3.3. HEC-HMS Simulation
Aiming to obtain the most extreme conditions, that is, the highest and lowest flow demand request by the galleries of the Carneirinhos stream, simulations were carried out varying the rainfall spatiality in time and in the study area. Table 2 shows the studied combinations of return period and spatial distribution of rainfall (e.g., TR05 SML considers a rainfall with 5 years of recurrence and distributed at spring—S, medium—M, and low—L portion of catchment). The present climate is the historical period from 1979 to 2018, and the future climate represents the rainfall projections for the RCP8.5 scenario from 2019 to 2048. The metric of bias percentage was used to assess the differences between the observed and simulated rainfall and between the simulated present and future climate rainfall.
Table 2.
Peak flow and rainfall statistics for 5-year return period.
It is possible to note in Table 2 that rainfalls with a return time of 5 years (TR05) were sufficient to result in channel overflow. The channel capacity was about 62 m3/s, even in conditions of minimum request of the flow and with precipitations that can be considered recurrent.
The most extreme condition, that is, less favorable for the current drainage system, was the one in which the precipitation had the longest return time, that is, 100 years (TR 100), uniformly distributed all over the catchment. The highest peak flow, in this condition, from the simulations of the observed data, was 278.10 m3/s, and the precipitation related to this flow was 132.63 mm. In the case of simulated data for the present climate, the peak flow was 152.60 m3/s, and the precipitation was 90.63 mm. In terms of future projections, the peak flow value was 189.30 m3/s, and the precipitation was 103.60 mm. The peak flow in these three cases occurred after 03 h and 50 min from the beginning of the rainfall.
It is also possible to note in Table 1 that the most favorable condition, that is, where the fastest water removal from the basin occurred, was the one where the rainfall concentration was only in the lower portion of Carneirinhos catchment (TR05 L). In this context, considering the observed data, the peak flow was 55.60 m3/s, and the rainfall was 84.07 mm. For the present climate, the peak flow was 39.50 m3/s, and the rainfall was 71.87 mm. In the case of future projections, the peak flow value was 25.90 m3/s, and the rainfall was 59.67 mm.
Considering the 56 combinations simulated for the observed data in the lower portion of Carneirinhos, only 1 simulation of the total did not exceed the maximum limit supported by the gallery.
When the combinations were evaluated for the simulated present climate, there was a reduction in the probability of occurrences of channel overflows, since 8 of the 56 possible combinations for this condition (14.30%) did not reach the maximum channel capacity.
Considering the present climate, it is worth highlighting that the Eta/HadGEM2-ES model underestimated the rainfall in relation to the observed data for all return periods (Table 3), even after the bias correction. Figure 8 shows the comparison between streamflow hydrographs generated for the observed data and for the Eta/HadGEM2-ES model in the RCP8.5 scenario, clearly demonstrating the underestimation. It was also verified that the differences between the observed and simulated data were significant in the rainy months, with the Eta/HadGEM2-ES model tending to present a greater probability of rainy days (not shown).
Table 3.
Accumulated rainfall for each combination and return period.
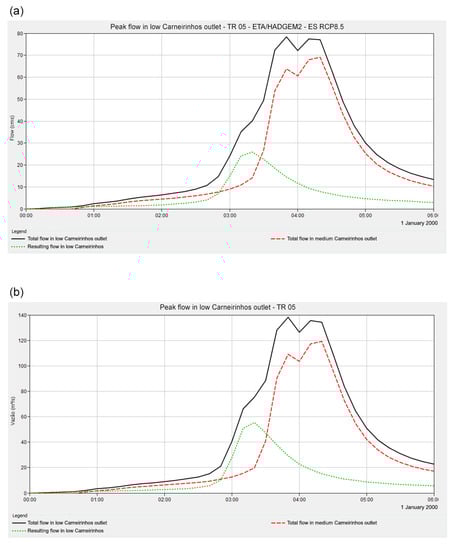
Figure 8.
Comparison between hydrographs generated considering: (a) rainfall located at all catchments with simulated rainfall from the Eta/HADGEM2-ES model in the RCP8.5 scenario; (b) rainfall located at all catchments with the observed rainfall data.
One of the results obtained during the simulations, carried out in the HEC-HMS model, was the accumulated rainfall volume after 6 h for each scenario and return times. Table 3 reveals a decrease of the return values of 6 h precipitation from the present climate simulation to the future climate simulation for return periods up to 30 years, but an increase for the 50-year (5.43%) and 100-year (12.52%) return periods (Table 3). It is assumed that this behavior is linked to the effects of climate change that were considered in the model, that is, the increase up to 8.5 W/m2 of energy from solar radiation and the emission of greenhouse gases in the atmosphere, which would be enough to change the distribution of precipitation in the region.
Moreover, the climate model simulations generally indicate that the distribution of precipitation intensities will shift toward higher values in a warming climate, meaning a decrease in the frequency of precipitation in most areas but an increase in the highest intensities nearly everywhere (e.g., Ref. [25]). Usually, the shift from decrease to increase typically occurs on much smaller intensities than that corresponding to the 50-year return value. However, this could be associated with regional variability, the model used, or even because of internal variability in the simulations.
In this context, a caveat of the analysis is that these results are subject to uncertainties, since just one GCM and hydrologic model were used and the fact that the analysis focused on changes in the extreme upper tail of the precipitation (and peak flow) distribution, where the statistics had a very low signal-to-noise ratio.
4. Discussion
The climate model simulated precipitation extremes that were lower than those observed in the present climate, which was probably due to the uncertainties related to the inaccurate representation of the climate system in the models and the parameterization of physical processes that occur on a scale smaller than that of the model grid. Other studies showed differences between the simulated and observed data due to uncertainties of sparse data; the representation of extreme summer precipitation; sub-daily and full rainfall fields on fine scales; capturing changes in small-scale processes and their feedback on large scales; and errors inherited from the driving global climate model [26,27].
Based on the data presented in Table 2, it is apparent that there was a downward trend in the cumulative volumes of precipitation occurring over a six-hour interval when comparing the simulated future climate with historical period (for observed and simulated data) for rainfall events with a return period of less than 50 years.
Other studies support the idea that there may be a trend of decreasing cumulative volumes of precipitation occurring over a short-duration time interval, which could be associated with climate change [28,29,30].
On the other hand, a demand for robust projections for extreme short-duration rainfall is challenging due to our poor understanding of past and future rainfall behavior [31,32].
In this study, the Eta/HadGEM2-ES model underestimated the intensity of precipitation extremes despite the application of a bias correction. Nevertheless, the total volume of precipitation accumulated throughout a given hydrological year appeared consistent between the observed and simulated series (the percent bias—PBIAS for the total annual precipitation before the bias correction was 13.72%, indicating good model performance, and after the bias correction was 3.92%, indicating very good model performance), both for present and future climate. It should be noted, however, that the observed series exhibited maximum daily rainfall values that exceeded those projected by the model.
Some other studies have suggested that the Eta/HadGEM2-ES model has a good agreement of downscaled annual simulations for the Amazon and Cerrado biomes [19] and can be used for a temperature and rainfall trend analysis [33,34].
5. Conclusions
Analysis of the results revealed that the Carneirinhos catchment area is naturally prone to flooding, a susceptibility which is further compounded by patterns of land use and occupation. In particular, the presence of extensive impermeable surfaces obstructs the infiltration of water, thus exacerbating the risk of flooding.
In recent decades, the Carneirinhos stream has experienced numerous events of flooding. The recurrence and magnitude of these flood events can be attributed to a combination of factors, including climate change and its associated impact on hydrological patterns, the morphometric properties of the catchment area, land use and occupation, channelization of the stream, and potential inadequacies in the design of the drainage system. These factors are interrelated and may act synergistically to exacerbate flood risk in the region.
The canalization of the Carneirinhos creek, which was implemented in the 1970s, has not been subject to expansion or revitalization in subsequent decades. As a result, the system has become outdated and is no longer capable of effectively managing the drainage demands generated by heavy rainfall events. One possible contributing factor to this phenomenon is the marked population growth that the region has experienced, with the population doubling between 1970 and 2020. In addition, the geology of the study area may also play a role, with a preponderance of Cambisols—young soils that favor the formation of surface runoff.
Despite the Eta/HadGEM2-ES model’s inherent limitations, the simulations performed were useful to conduct the frequency analyses on various segments of the catchment. This methodology can be applied to other case studies, with due considerations given to the unique characteristics of each study area.
Author Contributions
Conceptualization, F.N.L. and A.C.V.F.; Methodology, A.C.V.F. and J.S.; Validation, F.N.L., A.C.V.F. and J.S.; Writing—review and editing, F.N.L. and A.C.V.F. All authors have read and agreed to the published version of the manuscript.
Funding
This work was supported by the Coordination for the Improvement of Higher Education Personnel (CAPES) Brazil—Financing Code 001 and the Professional Master’s Program in National Network in Management and Regulation of Water Resources—ProfÁgua, Project CAPES/ Brazil Water and Sanitation Agency (ANA) AUXPE No. 2717/2015.
Institutional Review Board Statement
Not applicable.
Informed Consent Statement
Not applicable.
Data Availability Statement
Not applicable.
Conflicts of Interest
The authors declare no conflict of interest.
References
- Merz, B.; Blöschl, G.; Vorogushyn, S.; Dottori, F.; Aerts, J.C.J.H.; Bates, P.; Bertola, M.; Kemter, M.; Kreibich, H.; Lall, U.; et al. Causes, Impacts and Patterns of Disastrous River Floods. Nat. Rev. Earth Environ. 2021, 2, 592–609. [Google Scholar] [CrossRef]
- Billi, P.; Alemu, Y.T.; Ciampalini, R. Increased Frequency of Flash Floods in Dire Dawa, Ethiopia: Change in Rainfall Intensity or Human Impact? Nat. Hazards 2015. [Google Scholar] [CrossRef]
- Acosta-Coll, M.; Ballester-Merelo, F.; Martinez-Peiró, M.; De la Hoz-Franco, E. Real-Time Early Warning System Design for Pluvial Flash Floods—A Review. Sensors 2018, 18, 2255. [Google Scholar] [CrossRef]
- Tien Bui, D.; Hoang, N.D.; Martínez-Álvarez, F.; Ngo, P.T.T.; Hoa, P.V.; Pham, T.D.; Samui, P.; Costache, R. A Novel Deep Learning Neural Network Approach for Predicting Flash Flood Susceptibility: A Case Study at a High Frequency Tropical Storm Area. Sci. Total Environ. 2020, 701, 134413. [Google Scholar] [CrossRef] [PubMed]
- Le Lay, M.; Saulnier, G.M. Exploring the Signature of Climate and Landscape Spatial Variabilities in Flash Flood Events: Case of the 8–9 September 2002 Cévennes-Vivarais Catastrophic Event. Geophys. Res. Lett. 2007, 34, 1–5. [Google Scholar] [CrossRef]
- Chancibault, K.; Anquetin, S.; Ducrocq, V.; Saulnier, G.M. Hydrological Evaluation of High-Resolution Precipitation Forecasts of the Gard Flash-Flood Events (8–9 September 2002). Q. J. R. Meteorol. Soc. 2006, 132, 1091–1117. [Google Scholar] [CrossRef]
- Berne, A.; Delrieu, G.; Boudevillain, B. Variability of the Spatial Structure of Intense Mediterranean Precipitation. Adv. Water Resour. 2009, 32, 1031–1042. [Google Scholar] [CrossRef]
- Ambrizzi, T.; Reboita, M.S.; da Rocha, R.P.; Llopart, M. The State of the Art and Fundamental Aspects of Regional Climate Modeling in South America. Ann. N. Y. Acad. Sci. 2019, 1436, 98–120. [Google Scholar] [CrossRef]
- Giorgi, F. Thirty Years of Regional Climate Modeling: Where Are We and Where Are We Going Next? J. Geophys. Res. Atmos. 2019, 124, 5696–5723. [Google Scholar] [CrossRef]
- Althoff, D.; Rodrigues, L.N.; da Silva, D.D. Impacts of Climate Change on the Evaporation and Availability of Water in Small Reservoirs in the Brazilian Savannah. Clim. Chang. 2020, 159, 215–232. [Google Scholar] [CrossRef]
- Brêda, J.P.L.F.; de Paiva, R.C.D.; Chou, S.C.; Collischonn, W. Assessing Extreme Precipitation from a Regional Climate Model in Different Spatial–Temporal Scales: A Hydrological Perspective in South America. Int. J. Climatol. 2022, 2021, 1–24. [Google Scholar] [CrossRef]
- Michelan, M.G.; Menegaz, M.N.; Gonçalves, F.A.; Henrique, P.; Menezes, B.J.; de Oliveira Tiezzi, R. Estimating the Impact of Climate Change on Water Levels in a Data-Poor River Basin in Southeastern Brazil. Water Policy 2021, 23, 1284–1302. [Google Scholar] [CrossRef]
- Santos, C.A.S.; Rocha, F.A.; Ramos, T.B.; Alves, L.M.; Mateus, M.; de Oliveira, R.P.; Neves, R. Using a Hydrologic Model to Assess the Performance of Regional Climate Models in a Semi-Arid Watershed in Brazil. Water 2019, 11, 170. [Google Scholar] [CrossRef]
- Chou, S.C.; Lyra, A.; Mourão, C.; Dereczynski, C.; Pilotto, I.; Gomes, J.; Bustamante, J.; Tavares, P.; Silva, A.; Rodrigues, D.; et al. Assessment of Climate Change over South America under RCP 4.5 and 8.5 Downscaling Scenarios. Am. J. Clim. Chang. 2014, 3, 512–527. [Google Scholar] [CrossRef]
- de Oliveira, V.A.; de Mello, C.R.; Beskow, S.; Viola, M.R.; Srinivasan, R. Modeling the Effects of Climate Change on Hydrology and Sediment Load in a Headwater Basin in the Brazilian Cerrado Biome. Ecol. Eng. 2019, 133, 20–31. [Google Scholar] [CrossRef]
- Andrade, C.W.L.; Montenegro, S.M.G.L.; Montenegro, A.A.A.; Lima, J.R.d.S.; Srinivasan, R.; Jones, C.A. Climate Change Impact Assessment on Water Resources under RCP Scenarios: A Case Study in Mundaú River Basin, Northeastern Brazil. Int. J. Climatol. 2021, 41, E1045–E1061. [Google Scholar] [CrossRef]
- Chou, S.C.; Lyra, A.; Mourão, C.; Dereczynski, C.; Pilotto, I.; Gomes, J.; Bustamante, J.; Tavares, P.; Silva, A.; Rodrigues, D.; et al. Evaluation of the Eta Simulations Nested in Three Global Climate Models. Am. J. Clim. Chang. 2014, 3, 438–454. [Google Scholar] [CrossRef]
- Lyra, A.; Tavares, P.; Chou, S.C.; Sueiro, G.; Dereczynski, C.; Sondermann, M.; Silva, A.; Marengo, J.; Giarolla, A. Climate Change Projections over Three Metropolitan Regions in Southeast Brazil Using the Non-Hydrostatic Eta Regional Climate Model at 5-Km Resolution. Theor. Appl. Climatol. 2018, 132, 663–682. [Google Scholar] [CrossRef]
- Almagro, A.; Oliveira, P.T.S.; Rosolem, R.; Hagemann, S.; Nobre, C.A. Performance Evaluation of Eta/HadGEM2-ES and Eta/MIROC5 Precipitation Simulations over Brazil. Atmos. Res. 2020, 244, 105053. [Google Scholar] [CrossRef]
- Alvarenga, L.A.; de Mello, C.R.; Colombo, A.; Chou, S.C.; Cuartas, L.A.; Viola, M.R. Impacts of Climate Change on the Hydrology of a Small Brazilian Headwater Catchment Using the Distributed Hydrology-Soil-Vegetation Model. Am. J. Clim. Chang. 2018, 7, 355–366. [Google Scholar] [CrossRef]
- Bai, Y.; Zhang, Z.; Zhao, W. Assessing the Impact of Climate Change on Flood Events Using HEC-HMS and CMIP5. Water Air Soil Pollut. 2019, 230, 1–13. [Google Scholar] [CrossRef]
- Danielson, S.L.; Hill, D.F.; Hedstrom, K.S.; Beamer, J.; Curchitser, E. Demonstrating a High-Resolution Gulf of Alaska Ocean Circulation Model Forced Across the Coastal Interface by High-Resolution Terrestrial Hydrological Models. J. Geophys. Res. Oceans 2020, 125, 1–20. [Google Scholar] [CrossRef]
- Vezzoli, R.; Mercogliano, P.; Pecora, S.; Zollo, A.L.; Cacciamani, C. Hydrological Simulation of Po River (North Italy) Discharge under Climate Change Scenarios Using the RCM COSMO-CLM. Sci. Total Environ. 2015, 521–522, 346–358. [Google Scholar] [CrossRef]
- Peres, D.J.; Modica, R.; Cancelliere, A. Assessing Future Impacts of Climate Change on Water Supply System Performance: Application to the Pozzillo Reservoir in Sicily, Italy. Water 2019, 11, 2531. [Google Scholar] [CrossRef]
- Seneviratne, S.I.; Zhang, X.; Adnan, M.; Badi, W.; Dereczynski, C.; Di Luca, A.; Ghosh, S.; Iskandar, I.; Kossin, J.; Lewis, S.; et al. Weather and Climate Extreme Events in a Changing Climate. In Climate Change 2021: The Physical Science Basis. Contribution of Working Group I to the Sixth Assessment Report of the Intergovernmental Panel on Climate Change; Cambridge University Press: Cambridge, UK, 2021. [Google Scholar] [CrossRef]
- Maraun, D.; Wetterhall, F.; Ireson, A.M.; Chandler, R.E.; Kendon, E.J.; Widmann, M.; Brienen, S.; Rust, H.W.; Sauter, T.; Themel, M.; et al. Precipitation Downscaling under Climate Change: Recent Developments to Bridge the Gap between Dynamical Models and the End User. Rev. Geophys. 2010, 48, 1–34. [Google Scholar] [CrossRef]
- Brighenti, T.M.; Gassman, P.W.; Gutowski, W.J.; Thompson, J.R. Assessing the Influence of a Bias Correction Method on Future Climate Scenarios Using SWAT as an Impact Model Indicator. Water 2023, 15, 750. [Google Scholar] [CrossRef]
- Cardell, M.F.; Amengual, A.; Romero, R.; Ramis, C. Future Extremes of Temperature and Precipitation in Europe Derived from a Combination of Dynamical and Statistical Approaches. Int. J. Climatol. 2020, 40, 4800–4827. [Google Scholar] [CrossRef]
- Li, J.; Yu, R.; Yuan, W.; Chen, H. Changes in Duration-Related Characteristics of Late-Summer Precipitation over Eastern China in the Past 40 Years. J. Clim. 2011, 24, 5683–5690. [Google Scholar] [CrossRef]
- Lupikasza, E. Spatial and Temporal Variability of Extreme Precipitation in Poland in the Period 1951-2006. Int. J. Climatol. 2010, 30, 991–1007. [Google Scholar] [CrossRef]
- Zhang, X.; Zwiers, F.W.; Li, G.; Wan, H.; Cannon, A.J. Complexity in Estimating Past and Future Extreme Short-Duration Rainfall. Nat. Geosci. 2017, 10, 255–259. [Google Scholar] [CrossRef]
- Pierce, D.W.; Barnett, T.P.; Santer, B.D.; Gleckler, P.J.; Designed, P.J.G.; Performed, T.P.B. Selecting Global Climate Models for Regional Climate Change Studies. Proc. Natl. Acad. Sci. USA 2009, 106, 8441–8446. [Google Scholar] [CrossRef] [PubMed]
- Jahangir, M.H.; Haghighi, P.; Danehkar, S. Downscaling Climate Parameters in Fars Province, Using Models of the Fifth Report and RCP Scenarios. Ecol. Inform. 2022, 68, 101558. [Google Scholar] [CrossRef]
- Dereczynski, C.; Chan Chou, S.; Lyra, A.; Sondermann, M.; Regoto, P.; Tavares, P.; Chagas, D.; Gomes, J.L.; Rodrigues, D.C.; de los Milagros Skansi, M. Downscaling of Climate Extremes over South America—Part I: Model Evaluation in the Reference Climate. Weather Clim. Extremes 2020, 29, 100273. [Google Scholar] [CrossRef]
Disclaimer/Publisher’s Note: The statements, opinions and data contained in all publications are solely those of the individual author(s) and contributor(s) and not of MDPI and/or the editor(s). MDPI and/or the editor(s) disclaim responsibility for any injury to people or property resulting from any ideas, methods, instructions or products referred to in the content. |
© 2023 by the authors. Licensee MDPI, Basel, Switzerland. This article is an open access article distributed under the terms and conditions of the Creative Commons Attribution (CC BY) license (https://creativecommons.org/licenses/by/4.0/).