Communication

Interannual Variation in Earth’s Rotation Rate and Its Role as a Climate Change Indicator

1
Shanghai Astronomical Observatory, Chinese Academy of Sciences, Shanghai 200030, China
2
Key Laboratory of Planetary Sciences, Chinese Academy of Sciences, Shanghai 200030, China
3
School of Astronomy and Space Science, University of Chinese Academy of Sciences, Beijing 100049, China
*
Author to whom correspondence should be addressed.
Atmosphere 2023, 14(6), 982; https://doi.org/10.3390/atmos14060982
Submission received: 23 May 2023 / Accepted: 1 June 2023 / Published: 5 June 2023
(This article belongs to the Section Climatology)

Abstract

:
Exploring the relationship between climate phenomena and anomalies in Earth’s rotation during a corresponding period is helpful for constraining the assessment of global change, even for the early warning of climate events. This study selected the latest length of day changes (ΔLOD) observations, and extracted the interannual terms solely related to climatic variations, employing a difference plus frequency domain stepwise regression (Difference+FDSR) method. Afterward, we calculated the correlations of different data compositions between surface fluid contributions (AAM, OAM and HAM) and the climate-related ΔLOD. Finally, the anomalies during the period of 1993–2023 were focused on, by comparing the high-precision fluid forcing and the climate-related ΔLOD with El Niño–Southern Oscillation (ENSO) indices. Our results show that superimposing the HAM can improve fluid correlations ~5% with climate-related ΔLOD, but the OAM contribution is not obvious. Additionally, we detected a triple-dip La Niña in the last 3 years, and the corresponding minimum values of climate-related ΔLOD were between −0.11 and −0.23 ms. Furthermore, we investigated the short-term forecast of a climate event with ΔLOD predictions based on the climate change information on Earth‘s rotation rate, wherein a follow-up El Niño is indicated.

1. Introduction

Because of the development in modern geodesy technologies since the 1980s, high-accuracy observations of Earth’s rotation and reliable geophysical datasets have become available [1,2,3]. Among the multiple geophysical sources of Earth’s rotation, excitations from surface fluid such as atmospheric, oceanic and hydrological angular momentum (AAM, OAM and HAM) have been majorly considered and suggested to be the most dominant potential contributors [4,5].
El Niño–Southern Oscillation (ENSO) is commonly used as an indicator of climate variabilities on a global scale. In the ocean, ENSO appears as a warm or cold anomaly in the surface water of the equatorial mid-eastern Pacific every few years, with El Niño and La Niña corresponding to warm and cold anomalies, respectively [6,7]. As an indicator of coupled ocean–atmosphere on interannual scales, ENSO has been confirmed to be closely related to Earth’s rotation rate (length-of-day changes, ΔLOD) [8,9,10]. To be specific, the El Niño (warm) events denote the speed decelerations in Earth’s rotation, while La Niña (cold) events indicate accelerations.
In this paper, we focus on contributions from various forms of fluid forcing to Earth’s rotation rate, with the detection of ENSO events in ΔLOD series on interannual timescales. Numerous work studying the relationship between these three datasets (fluid forcing, ΔLOD and ENSO) has been conducted and some primary results have been obtained. For instance, AAM has been identified as the most significant contributor to ΔLOD [5,11]. To further explore the regional AAM excitations, the continental and oceanic AAM were estimated separately, and the AAM motion term over the ocean has been suggested as the dominant excitation source [5,12]. There are three internally caused fluctuations (at ~6, ~7 and ~8 years) that have been detected and subtracted, allowing us to remove impacts from ΔLOD caused by non-climatic-related origins [13,14,15]. Afterward, the climate-related ΔLOD was achieved using the difference plus frequency domain stepwise regression method (Difference+FDSR), wherein the ΔLOD anomalies corresponding to the three extreme El Niño events were about half of the magnitude of the estimates obtained via the traditional method [12,16]. This climate-related ΔLOD has been manifested to reflect the climate information more accurately. Based on the climate-related terms isolated from ΔLOD observations, the latest 2020–2021 and 2021–2022 La Niña events were detected explicitly. Moreover, the third trough of this continuous cold phenomenon was forecasted using ΔLOD predictions successfully [17].
Regarding the geophysical fluid forcing, extensive studies have been carried out considering AAM excitation because of the prominent contribution to ΔLOD [4,5,12]. In contrast, the impacts from OAM and HAM have been rarely examined due to a smaller magnitude. Regarding the data precision improvements in geophysical fluid, these tiny sources could be taken into account. Additionally, there are phase deviations in ENSO event detections at both ends of the ΔLOD series, due to the edge effect that cannot be eliminated completely [17]. Further investigations of ENSO event forecast using ΔLOD predictions are necessary. In this paper, we re-analyzed the geophysical fluid contributions to interannual ΔLOD, by calculating the correlations between ΔLOD with different AM data combinations. Then, the complete 2020–2022 triple-dip La Niña was re-detected and compared with the 1998–2001 cold event. Finally, after the phase correction, it was found that a follow-up El Niño is forecasted to occur over the remaining three seasons of 2023.

2. Data and Methods

2.1. Datasets

In this work, the employed ΔLOD series were from the International Earth Rotation and Reference Systems Service (IERS). The fluid AM data were obtained from the Earth System Modeling GeoForschungsZentrum in Potsdam (ESMGFZ) [18,19]. The ENSO indices were from the National Oceanic and Atmospheric Administration (NOAA); here, we selected the Niño 3.4 of the ocean Niño index (ONI) to represent the ENSO variations. As the first date of fluid AM from ESMGFZ is January 1976, we truncated all of the base data series for the time span of January 1976 to February 2023.

2.2. Data Processing

To be consistent with the ENSO indices, the ΔLOD and fluid AM data were firstly reduced to monthly mean series. Afterward, the LOD changes solely related to climatic origins were obtained by employing the Difference+FDSR method [12,13]. Here, we summarize the Difference+FDSR processing chain in four steps: (1) the three internally driven oscillations (at ~6, ~7 and ~8 years) were detected and removed from the ΔLOD series via the regression method; (2) after tidal terms and the three internally caused signals had been deducted, the residual ΔLOD series were differential to eliminate the effects from long-term variations; (3) the derivative ΔLOD residuals were extrapolated forward and backward using an auto-regressive (AR) model to reduce the edge effect; (4) the extended series were passed through 1.5–10 year band-filtering, and the sought-after ΔLOD could be achieved by integrating the filtered series (more details are referred to in the cited work of 12 and 13).
For comparison, the fluid AM series were transferred to excitation functions using the unit of ms. In Figure 1, the climate-related ΔLOD (black curve) data are shown in panel (b); meanwhile, the initial ΔLOD observations (orange curve) and the interannual AAM series (light blue curve) are also displayed. Here, the interannual terms of AAM and of the other AM series were both obtained similarly to the climate-related ΔLOD. Additionally, the ONI indices are presented in panel (d), where the peak and trough regions are colored in red and blue, corresponding to El Niño and La Niña events, respectively. Moreover, to further highlight the advantages of the Difference+FDSR method, correlations between initial ΔLOD and climate-related ΔLOD with the interannual AAM as well as the ENSO indices are compared in Table 1. It should be noted that all of the datasets used to calculate correlations were reduced to monthly mean series and normalized data.
As shown by the long-term trends exhibited in the original ΔLOD observations in Figure 1, the length of a day changes with a period of about 20 years. Over the past decade, Earth’s rotation has been speeding up after the extreme 2015–2016 El Niño event [20], resulting in the shortest day over the past half-century being on 29 June 2022 (1.59 ms less than 24 h). The climate-related ΔLOD, the interannual AAM and the ENSO indices had good spatial–temporal correlations, with the explicit visibility of all of the climate events. In contrast, it was difficult to find the corresponding phenomena from the original ΔLOD observations, except for fluctuations in several extreme events marked with red square frames. The same results are presented in Table 1; after removing other effects, the climate-related ΔLOD showed overwhelmingly higher correlations with the interannual AAM and ENSO indices (0.76 and 0.61) than the initial ΔLOD observations (0.13 and 0.12). Specifically, the correlation between interannual ΔLOD with the ENSO indices calculated here (0.61) was about 2 times that of the result in the previous estimate (0.36) [8]. Both of these findings denote that the Difference+FDSR is an effective method to extract climate information from ΔLOD series. Additionally, it should be noted that the La Niña events were not as well captured as the El Niño events due to weaker amplitudes; here, we will mainly focus on the three extreme El Niño and the two triple-dip La Niña events in the last 4 decades to illustrate the climate information indicated in ΔLOD.
Regarding the three extreme El Niño events in 1982–1983, 1997–1998 and 2015–2016, the event intensity variations behaved differently. For example, the ONI demonstrates increasing amplitudes while AAM moves in the opposite direction, and ΔLOD exhibits the weakest 1997–1998 event and stronger 1982–1983 and 2015–2016 events. The similar findings also interpreted by previous studies and authors have discerned the different performances of climate events in different indices [12,16]. In summary, these above results denote that the interannual ΔLOD without non-climatic effects could be a sensitive mechanical indicator for constraining the assessment of global climate events.

3. Results

3.1. Surface Fluid Contributions to ΔLOD

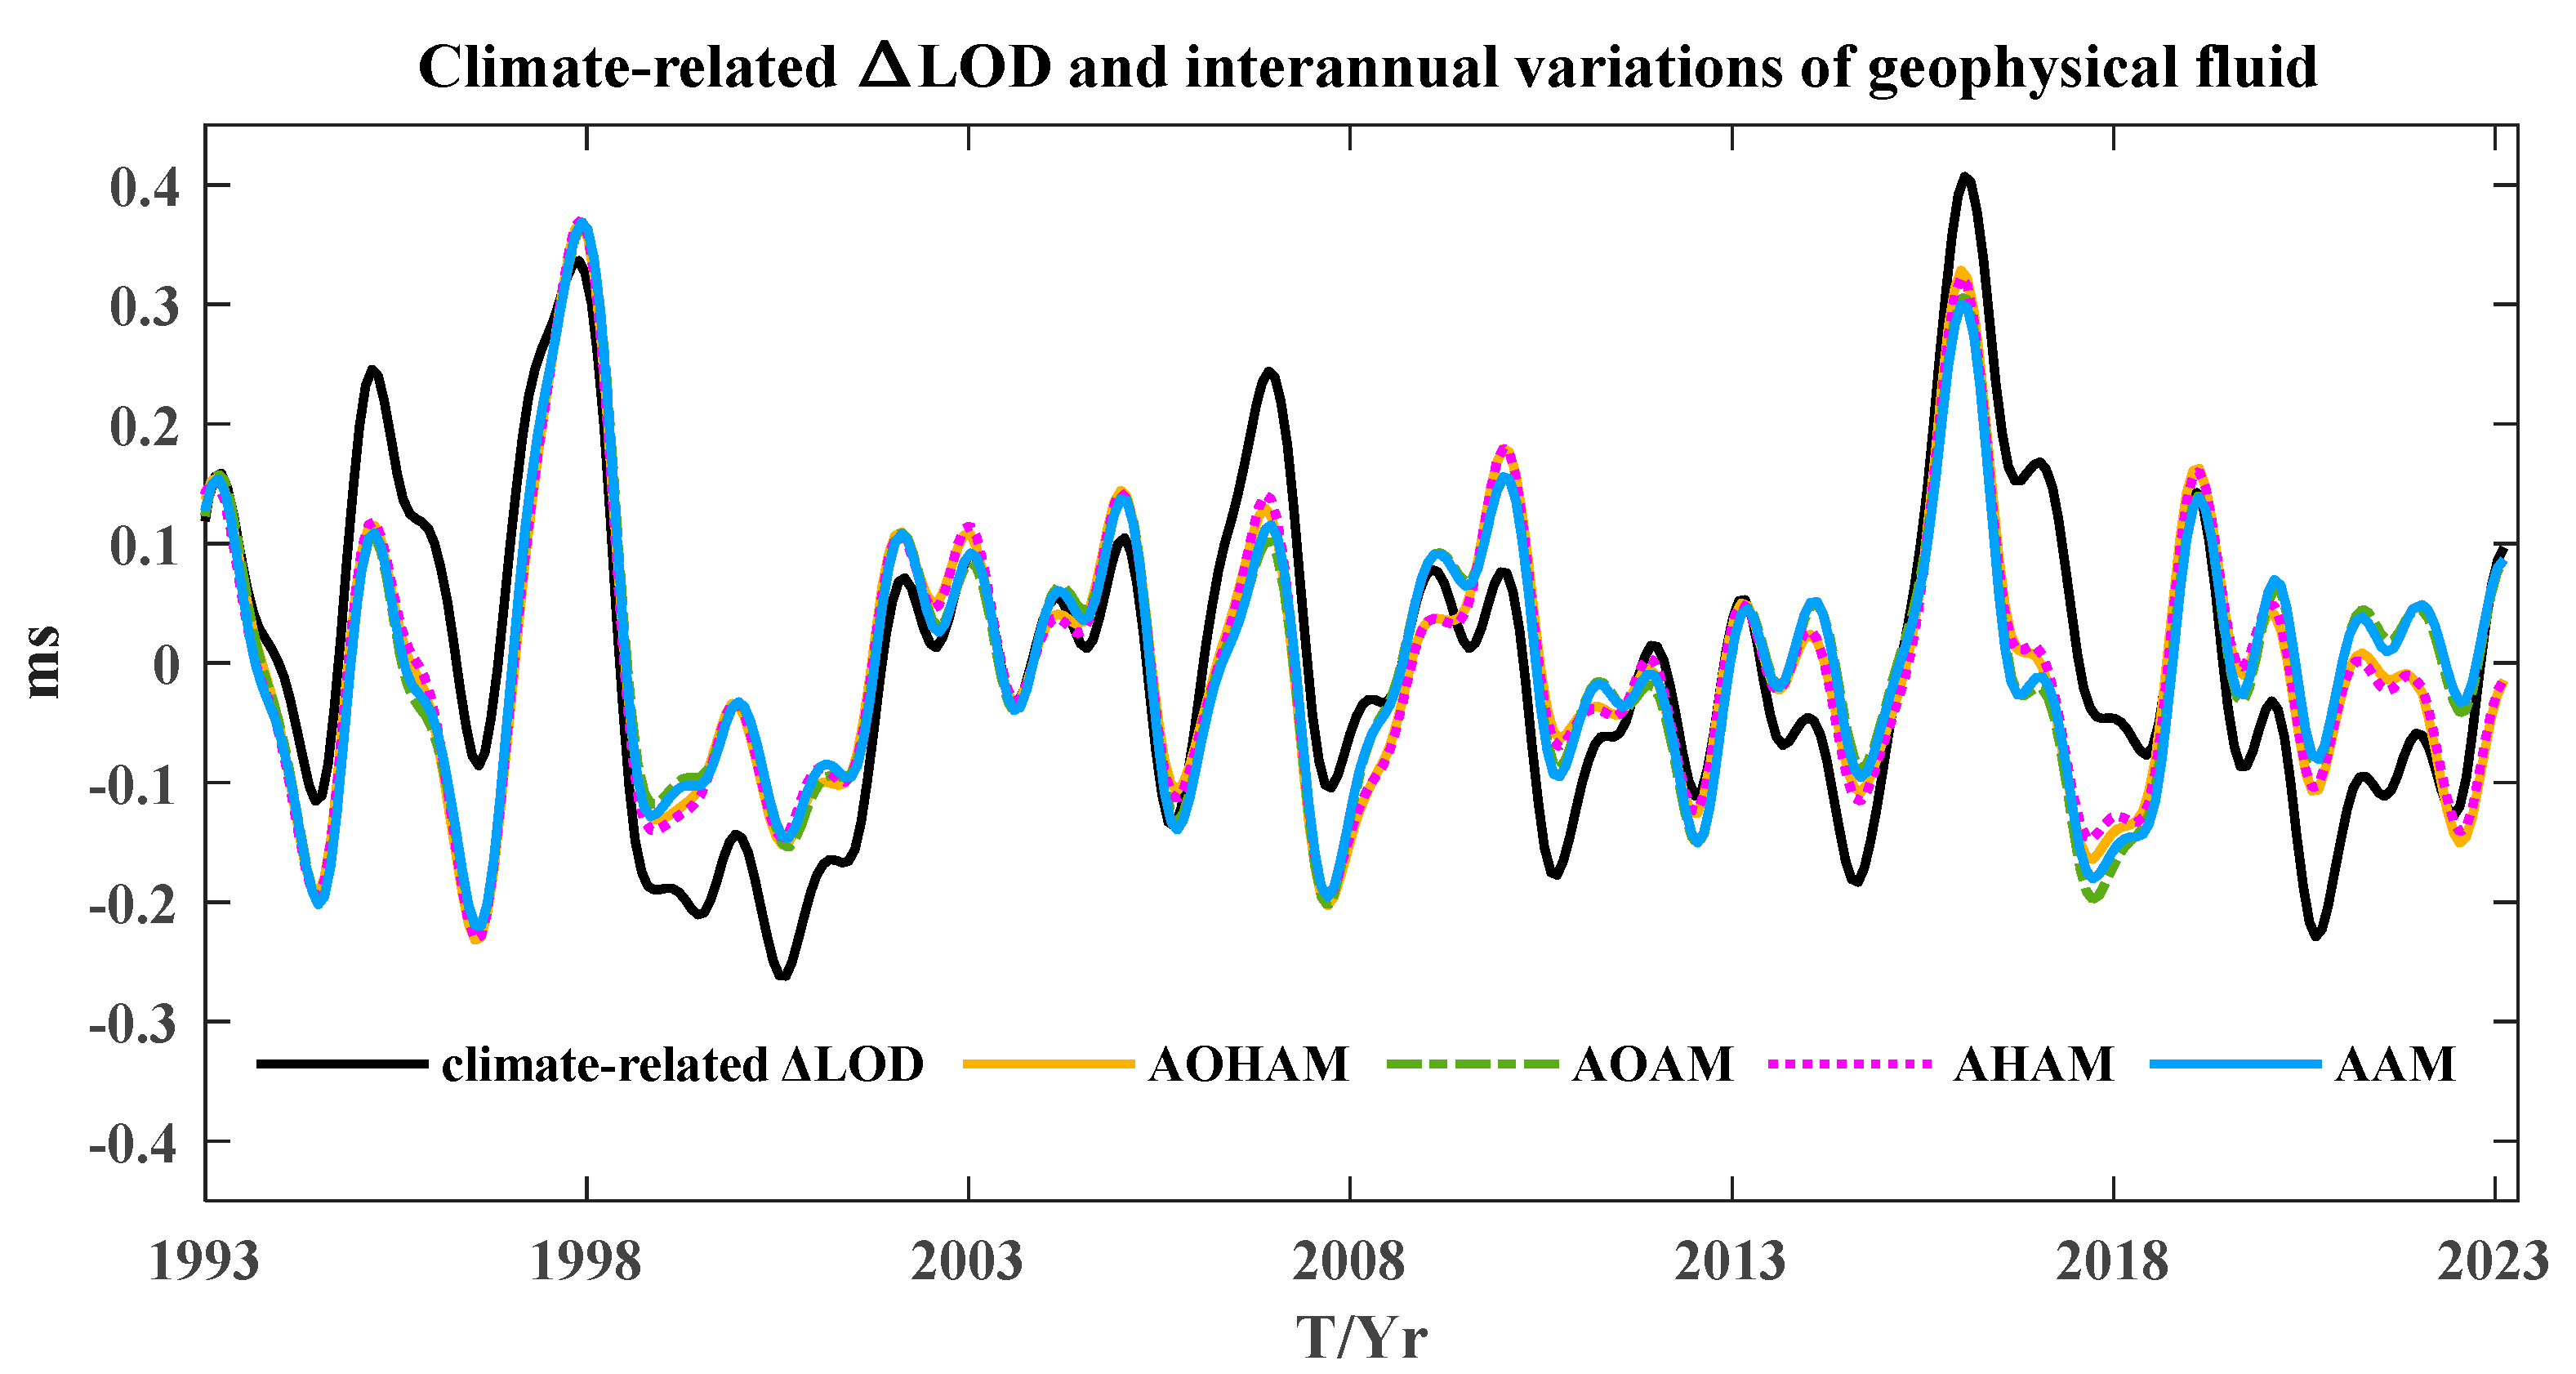
Based on the fact that the surface fluids are excitation sources to Earth’s rotation rate, here, we calculated the correlations between these two datasets to quantify contributions from different fluid causes to ΔLOD on interannual timescales. Since the magnitudes of OAM and HAM are insufficient compared to those of AAM, here, we investigated four different combinations of geophysical fluid forcing: AAM, AAM+OAM (AOAM), AAM+HAM (AHAM) and AAM+OAM+HAM (AOHAM). Considering the availability of reliable oceanographic satellite altimetry data, we truncated the first AM data points for 1993 in the AM datasets. The climate-related ΔLOD and the interannual variations in these four geophysical fluid combinations are displayed in Figure 2. The correlations between the climate-related ΔLOD and different fluid forcing as well as combinations are estimated and compared in Table 2.
As shown in this part and depicted in previous studies, a definite conclusion can be achieved that the surface fluids are closely related to ΔLOD on interannual scales. In other words, the ocean–atmosphere activities interact with the solid Earth, changing Earth’s rotation rate. It can be seen from comparisons between the five interannual variations, displayed in Figure 2, that the single AAM series (light blue curve) show good consistency with the climate-related ΔLOD (black curve) on average, and the tiny improvements can be identified after superimposing the HAM (purple and orange curves). Similarly, from the different correlations estimated in Table 2, after superimposing OAM, the coefficient did not exhibit any improvement, while the promotions in the case of superimposing HAM were about 5% (the coefficient increased from 0.76 to 0.8). In summary, among the geophysical fluid excitations, AAM is the most prominent contributor to climate-related ΔLOD, and HAM is the second one, while the contribution from OAM is not obvious.

3.2. The Latest Triple-Dip La Niña Event Detected during 2020–2022

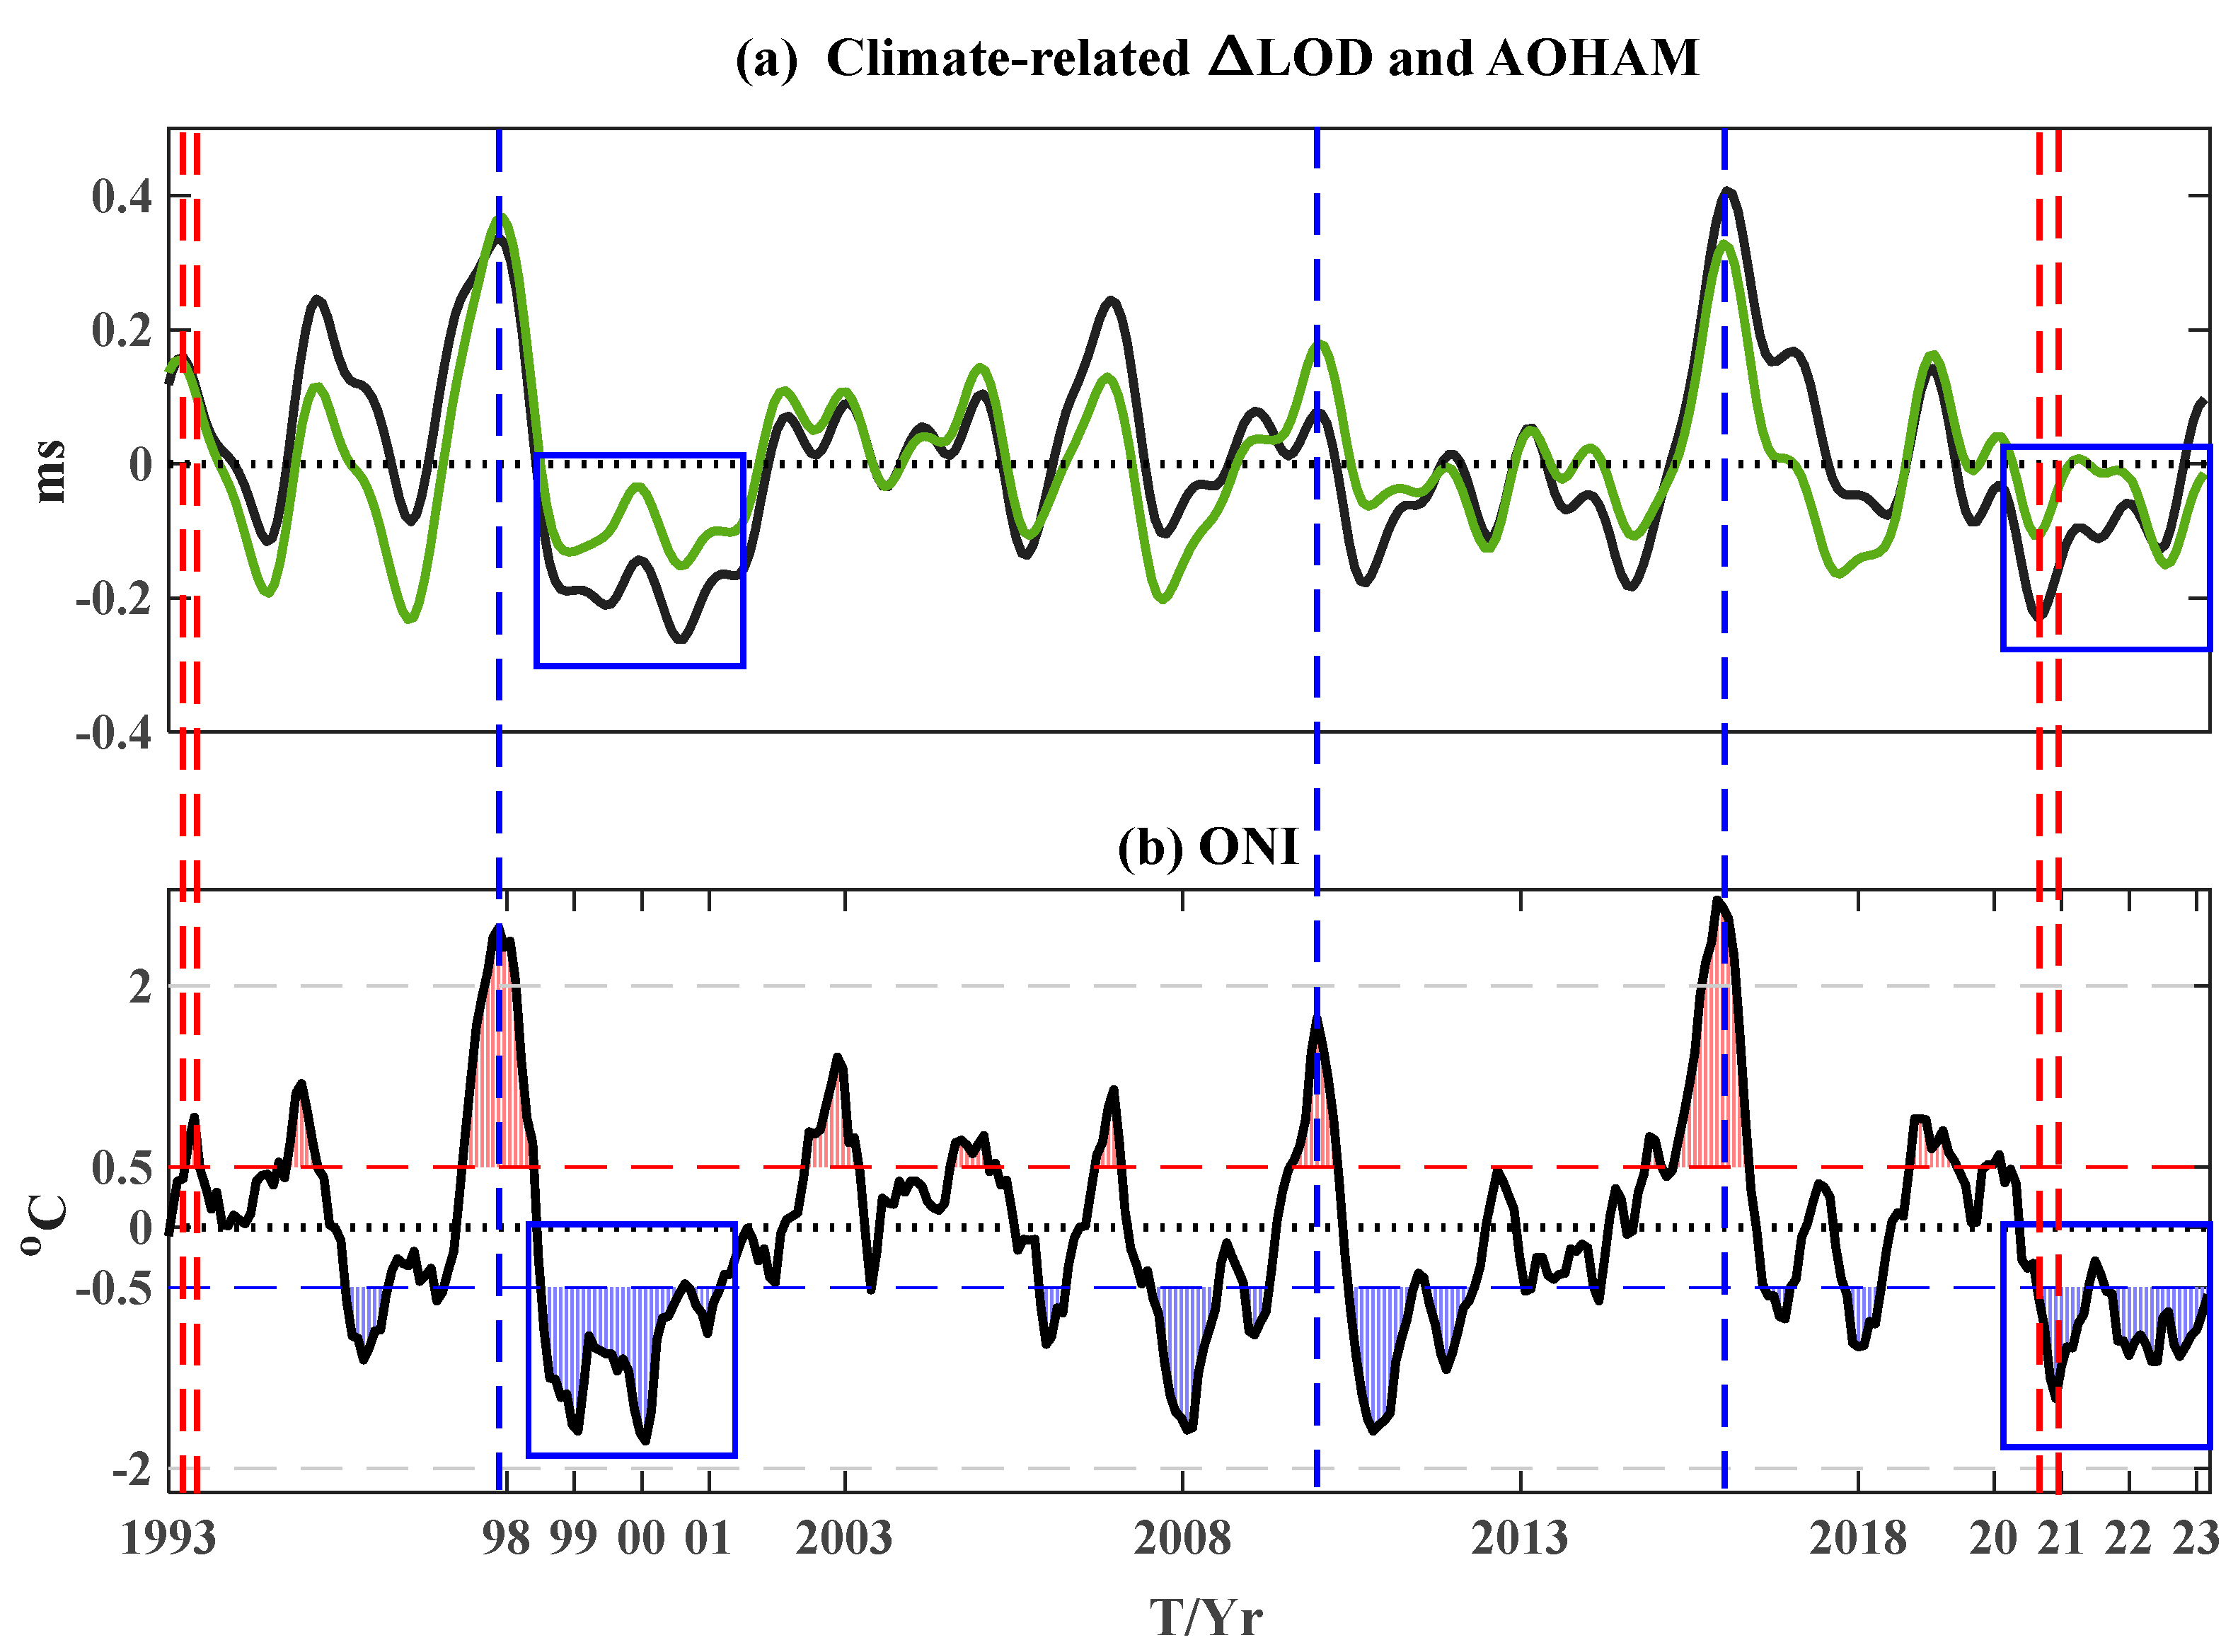
To be consistent with the time span of high-precision geophysical fluid excitation sequences, here, we truncated both the first data points of the ΔLOD series and ONI indices for 1993. As depicted in Figure 3, there have been two triple-dip La Niña (1998–2001 and 2020–2022) events detected via ΔLOD observations and ENSO indices during the last 3 decades. The corresponding minimum values of climate-related LOD related to these two triple-dip La Niña events are −0.19, −0.21 and −0.26 ms and −0.23, −0.11 and −0.13 ms, respectively. Both as medium-strength phenomena, the 2020–2022 cold event lasted 28 months, 4 months less than the 1998–2001 event.
Seen across the two continuous cold events marked with blue square frames in Figure 3, some findings can be recognized. First, due to the insufficient strength of amplitudes, although the ΔLOD series were extrapolated in both directions to reduce the edge effects, there is still a phase lead of ~3 months in the event detected from the interannual ΔLOD series, compared with the latest La Niña events illustrated in the ENSO indices. A similar discrepancy (red dashed lines) is also presented in the weak 1994 El Niño event in the left direction, while the deviations are not shown in the strong El Niño signals in the middle part (blue dashed lines). Second, the 1998–2001 La Niña was a follow-up event after the extreme 1997–1998 El Niño, which shows the reasonable decay speed symmetry exhibited in the warm and cold phases of ENSO; however, the 2020–2022 La Niña occurred 4 years later than the extreme 2015–2016 El Niño [21,22]. Third, a nearly 20-year period similar to that in the ΔLOD long-term trend emerges in the triple-dip La Niña and extreme El Niño events. In summary, there are some phase discrepancies in the ENSO events detected from both ends of the ΔLOD series; the different performances denoted by the two triple-dip cold events, and the nearly 20-year cycles exhibited in continues La Niña as well as in extreme El Niño events, need more investigation.

3.3. The Follow-Up El Niño Event Indicated over 2023

Regarding the phase lead exhibited in the latest triple-dip La Niña detected in Earth’s rotation rate series, here, we calibrated this discrepancy by moving the climate-related ΔLOD series 3 months forward. Afterward, the climate event forecast could be investigated by extracting information from ΔLOD predictions [17]. Considering the results of the first Earth orientation parameter prediction comparison campaign (EOP PCC), the least square plus auto-regressive (LS+AR) model has been suggested to be the suitable method on average for EOP prediction [23]. In this study, the ΔLOD predictions were calculated using the LS+AR method and can be decomposed into two parts: (1) the ΔLOD regular terms (mainly containing the trend and the annual and semiannual variations) are fitted and extrapolated using the LS model; (2) the ΔLOD residuals are predicted using the AR method (more details about the LS+AR model are referred to in the cited work of 17 and 23).
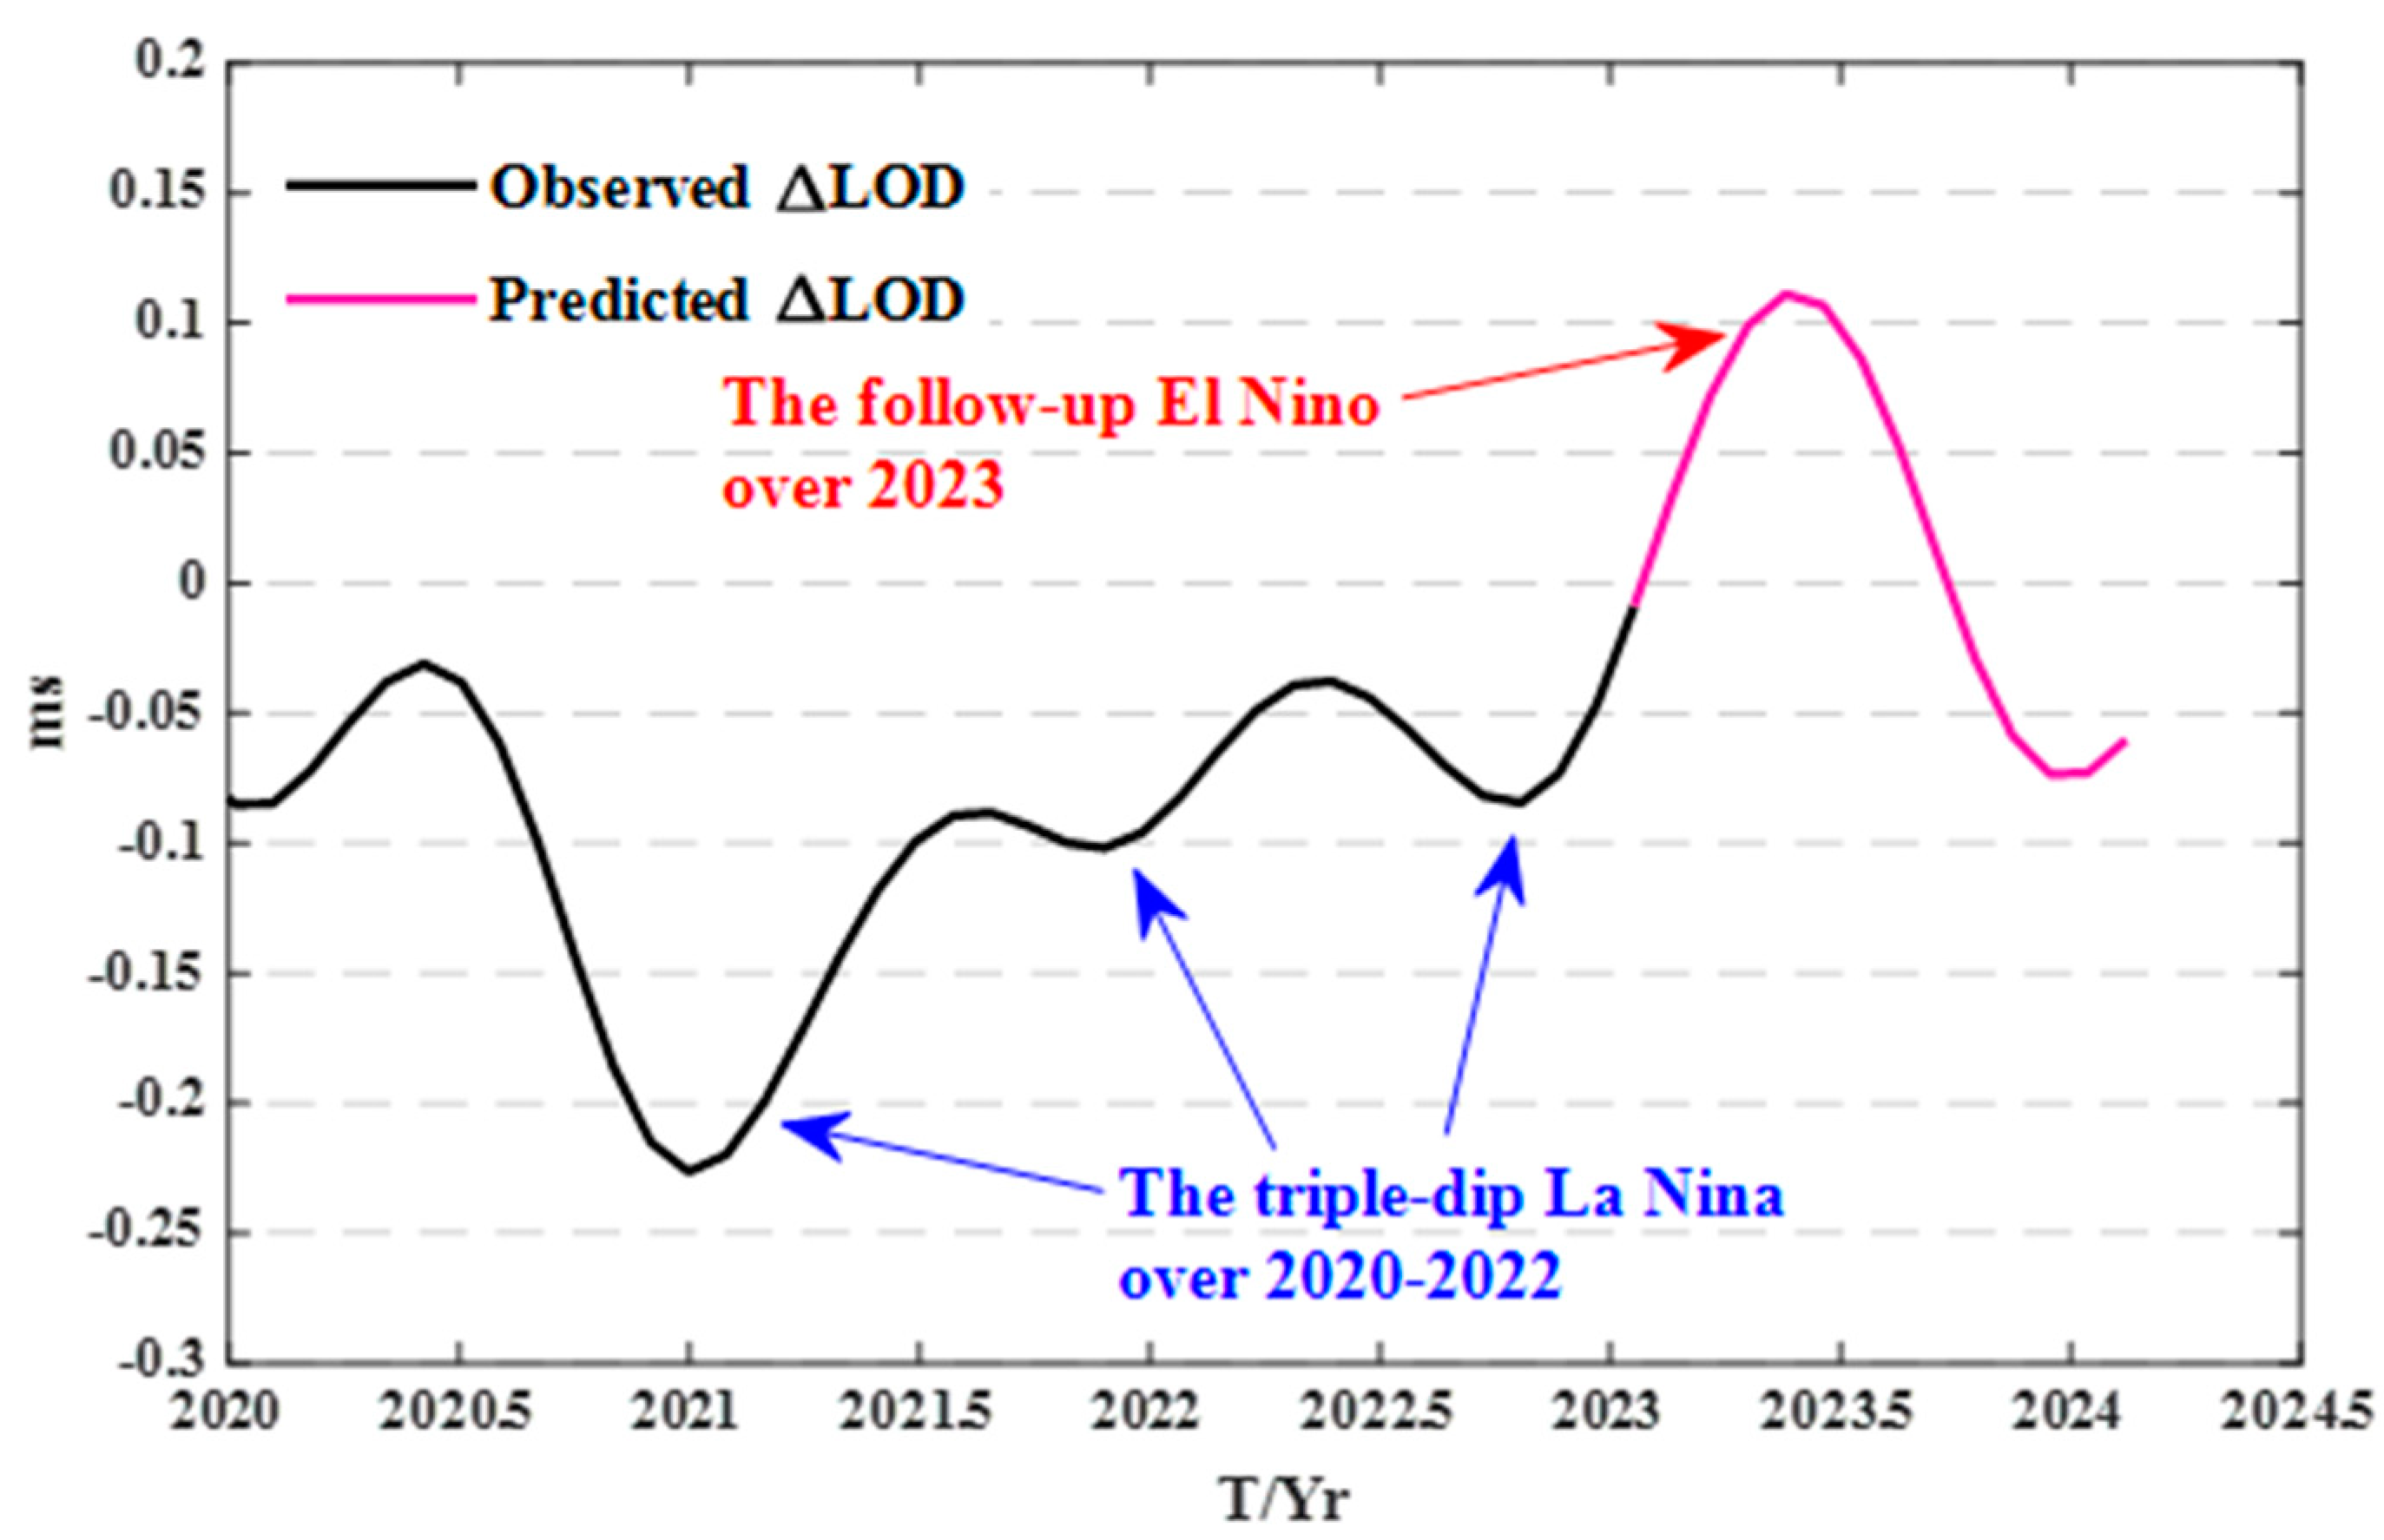
In Figure 4, the interannual ΔLOD changes isolated from the observed and predicted ΔLOD (black and pink curves) changes from January 2020 to February 2024 are displayed, where the black curve denotes the observed ΔLOD from January 2020 to February 2023, and the pink curve indicates the predicted series.
As seen by the combined climate-related ΔLOD shown in Figure 4, the blue and red arrows point to the latest triple-dip La Niña and the forecasted El Niño, respectively. To be specific, the latest cold event will end in the first season of 2023, and then, a follow-up El Niño is indicated to occur over the remaining time of 2023. This El Niño is predicted as a phenomenon of medium strength, and the duration will be about half a year. In addition, the triple-dip La Niña and the forecasted El Niño events in recent years further indicate the stronger ocean–atmosphere activities and their interactions with the solid Earth. Considering the serious weather phenomena associated with the triple-dip La Niña and strong El Niño over the past few years, more attention should be paid to the possible upcoming warm event.

4. Discussion and Conclusions

We applied a Difference+FDSR scheme to extract the variations solely related to climatic excitations from Earth’s rotation rate series. Compared to the original ΔLOD observations, the climate-related ΔLOD changes are closely consistent with the climate change indices, with almost all of the ENSO events indicated in detail (Figure 1). Afterward, contributions to interannual ΔLOD from the geophysical fluids were re-estimated with different data combinations (Figure 2). Aside from the most prominent excitation of AAM, the HAM has proven to be another contributor; however, the contribution from OAM is suggested to not be significant.
A triple-dip cold event in the last 3 years was identified both in the ΔLOD observations and ENSO indices, and the corresponding minimum values of climate-related ΔLOD were −0.23, −0.11 and −0.13 ms, respectively (Figure 3). As two continuous cold events in the last 3 decades, the different performances exhibited between the 2020–2022 and 1998–2001 La Niña events need further investigation.
In addition, due to the edge effect in data processing and the insufficient strength of amplitude, a phase lead is shown in the 2020–2022 La Niña detected in the climate-related ΔLOD. After correcting this phase discrepancy, the climate-related ΔLOD series over 2020–2024 were displayed (Figure 4), with the data sequence during 2023–2024 predicted using the LS+AR model. From the ΔLOD predictions, a follow-up El Niño is indicated explicitly over a period of the remaining three seasons of 2023, and this El Niño is forecasted as a phenomenon of medium strength and short duration.
In summary, the interannual ΔLOD has been proven to be an effective climate indicator, after removing the impacts from internal and external sources. In spite of the successful cases in previous studies, ENSO events extracted from ΔLOD predictions need more validation and further investigation.

Author Contributions

X.-Q.X. and Y.-H.Z. were the primary proposers of this manuscript, C.-C.X. provided valuable suggestions for data processing and X.-Q.X. formed the draft of the manuscript. All authors have read and agreed to the published version of the manuscript.

Funding

This work is supported by the National Natural Science Foundation of China (12233010, 12173070), and the Youth Innovation Promotion Association of the Chinese Academy of Sciences (2019265).

Institutional Review Board Statement

Not applicable.

Informed Consent Statement

Not applicable.

Data Availability Statement

The ΔLOD time series are from the IERS 14 C04 file at https://www.iers.org/IERS/EN/DataProducts/EarthOrientationData/eop.html (accessed on 31 March 2023). The ENSO indices are from NOAA at https://origin.cpc.ncep.noaa.gov/products/precip/CWlink/MJO/climwx.shtml (accessed on 31 March 2023). The AM datasets are from the ESMGFZ at http://esmdata.gfz-potsdam.de:8080/ (accessed on 31 March 2023).

Acknowledgments

The base data were provided by the International Earth Rotation and Reference Systems Service (IERS), the National Oceanic and Atmospheric Administration (NOAA) and the Earth System Modeling GeoForschungsZentrum in Potsdam (ESMGFZ).

Conflicts of Interest

The authors declare no conflict of interest.

References

  1. Eubanks, T.M.; Smith, D.E.; Turcotte, D.L. Variations in the orientation of the Earth. Geodyn. Ser. 1993, 24, 1–54. [Google Scholar] [CrossRef]
  2. Gambis, D. Monitoring Earth Orientation using space-geodetic techniques: State-of-the-art and prospective. J. Geod. 2004, 78, 295–303. [Google Scholar] [CrossRef]
  3. Ratcliff, J.; Gross, R. Combinations of Earth Orientation Measurements: SPACE2018, COMB2018, and POLE2018; Jet Propulsion Laboratory, National Aeronautics and Space Administration: Pasadena, CA, USA, 2019. [Google Scholar]
  4. Zotov, L.; Bizouard, C.; Sidorenkov, N.; Ustinov, A.; Ershova, T. Multidecadal and 6-year variations of LOD. J. Phys. Conf. Ser. 2020, 1705, 012002. [Google Scholar] [CrossRef]
  5. Chen, J.L.; Wilson, C.R.; Kuang, W.J.; Chao, B.F. Interannual oscillations in Earth rotation. J. Geophys. Res. Solid Earth 2019, 124, 13404–13414. [Google Scholar] [CrossRef]
  6. Fang, S.W.; Yu, J.Y. A Control of ENSO Transition Complexity by Tropical Pacific Mean SSTs through Tropical Interaction. Geophys. Res. Lett. 2020, 47, e2020GL087933. [Google Scholar] [CrossRef]
  7. Timmermann, A.; An, S.I.; Kug, J.S.; Jin, F.F.; Cai, W.; Capotondi, A.; Cobb, K.M.; Lengaigne, M.; McPhaden, M.J.; Stuecker, M.F.; et al. El Niño–Southern Oscillation complexity. Nature 2019, 567, E3. [Google Scholar] [CrossRef] [Green Version]
  8. Haddad, M.; Bonaduce, A. Interannual variations in length of day with respect to El Niño- Southern Oscillation’s impact (1962-2015). Arab. J. Geosci. 2017, 10, 255. [Google Scholar] [CrossRef]
  9. Viron, O.D.; Dickey, J.O. The two types of El-Niño and their impacts on the length of day. J. Oceanogr. 2014, 41, 3407–3412. [Google Scholar] [CrossRef] [Green Version]
  10. Dickey, J.O.; Marcus, S.L.; Chin, T.M. Thermal wind forcing and atmospheric angular momentum: Origin of the Earth’s delayed response to ENSO. Geophys. Res. Lett. 2007, 34, 17803. [Google Scholar] [CrossRef]
  11. David, A.S. Monitoring atmospheric winds and pressures for Earth orientation studies. Adv. Space Res. 1993, 13, 175–184. [Google Scholar]
  12. Xu, X.Q.; Zhou, Y.H.; Duan, P.S.; Fang, M.; Kong, Z.Y.; Xu, C.C.; An, X.R. Contributions of oceanic and continental AAM to interannual variation in ΔLOD with the detection of 2020-2021 La Niña event. J. Geod. 2022, 96, 43. [Google Scholar] [CrossRef]
  13. Hsu, C.C.; Duan, P.S.; Xu, X.Q.; Zhou, Y.H.; Huang, C.L. A new ~7 year periodic signal in length of day from a FDSR method. J. Geod. 2021, 95, 55. [Google Scholar] [CrossRef]
  14. Ding, H.; An, Y.; Shen, W. New evidence for the fluctuation characteristics of intradecadal periodic signals in length-of-day variation. J. Geophys. Res. Solid Earth 2021, 126, e2020JB020990. [Google Scholar] [CrossRef]
  15. Duan, P.S.; Liu, G.Y.; Hu, X.G.; Zhao, J.; Huang, C.L. Mechanism of the interannual oscillation in length of day and its constraint on the electromagnetic coupling at the core-mantle boundary. Earth Planet Sci. Lett. 2018, 482, 245–252. [Google Scholar] [CrossRef]
  16. Lambert, S.B.; Marcus, S.L.; Viron, O.D. Atmospheric torques and Earth’s rotation: What drove the millisecond-level length-of-day response to the 2015-2016 El Niño? Earth Syst. Dyn. Discuss. 2017, 8, 1–14. [Google Scholar] [CrossRef] [Green Version]
  17. Xu, X.Q.; Zhou, Y.H.; Xu, C.C. Earth rotation parameters prediction and climate change indicators in it. Artificial Satellites. J. Planet. Geod. 2023, 57, 262–273. [Google Scholar] [CrossRef]
  18. Dill, R.; Dobslaw, H.; Thomas, M. Improved 90-day earth orientation predictions from angular momentum forecasts of atmosphere, ocean, and terrestrial hydrosphere. J. Geod. 2019, 93, 287–295. [Google Scholar] [CrossRef] [Green Version]
  19. Dobslaw, H.; Dill, R. Predicting Earth Orientation Changes from Global Forecasts of Atmosphere-Hydrosphere Dynamics. Adv. Space Res. 2018, 61, 1047–1054. [Google Scholar] [CrossRef] [Green Version]
  20. Zotov, L.; Bizouard, C.; Shum, C.K.; Zhang, C.Y.; Sidorenkov, N.; Yushkin, V. Analysis of Earth’s polar motion and length of day trends in comparison with estimates using second degree stokes coefficients from satellite gravimetry. Adv. Space Res. 2022, 69, 308–318. [Google Scholar] [CrossRef]
  21. Feng, L.C.; Zhang, R.H.; Yu, B.; Han, X. Roles of wind stress and subsurface cold water in the second-year cooling of the 2017/18 La Niña event. Adv. Atmos. Sci. 2020, 37, 847–860. [Google Scholar] [CrossRef]
  22. Song, X.; Zhang, R.; Rong, X. Influence of Intraseasonal Oscillation on the Asymmetric Decays of El Niño and La Niña. Adv. Atmos. Sci. 2019, 36, 779–792. [Google Scholar] [CrossRef]
  23. Kalarus, M.; Schuh, H.; Kosek, W.; Akyilmaz, O.; Bizouard, C.; Gambis, D.; Gross, R.; Jovanović, B.; Kumakshev, S.; Kutterer, H.; et al. Achievements of the Earth orientation parameters prediction comparison campaign. J. Geod. 2010, 84, 587–596. [Google Scholar] [CrossRef]
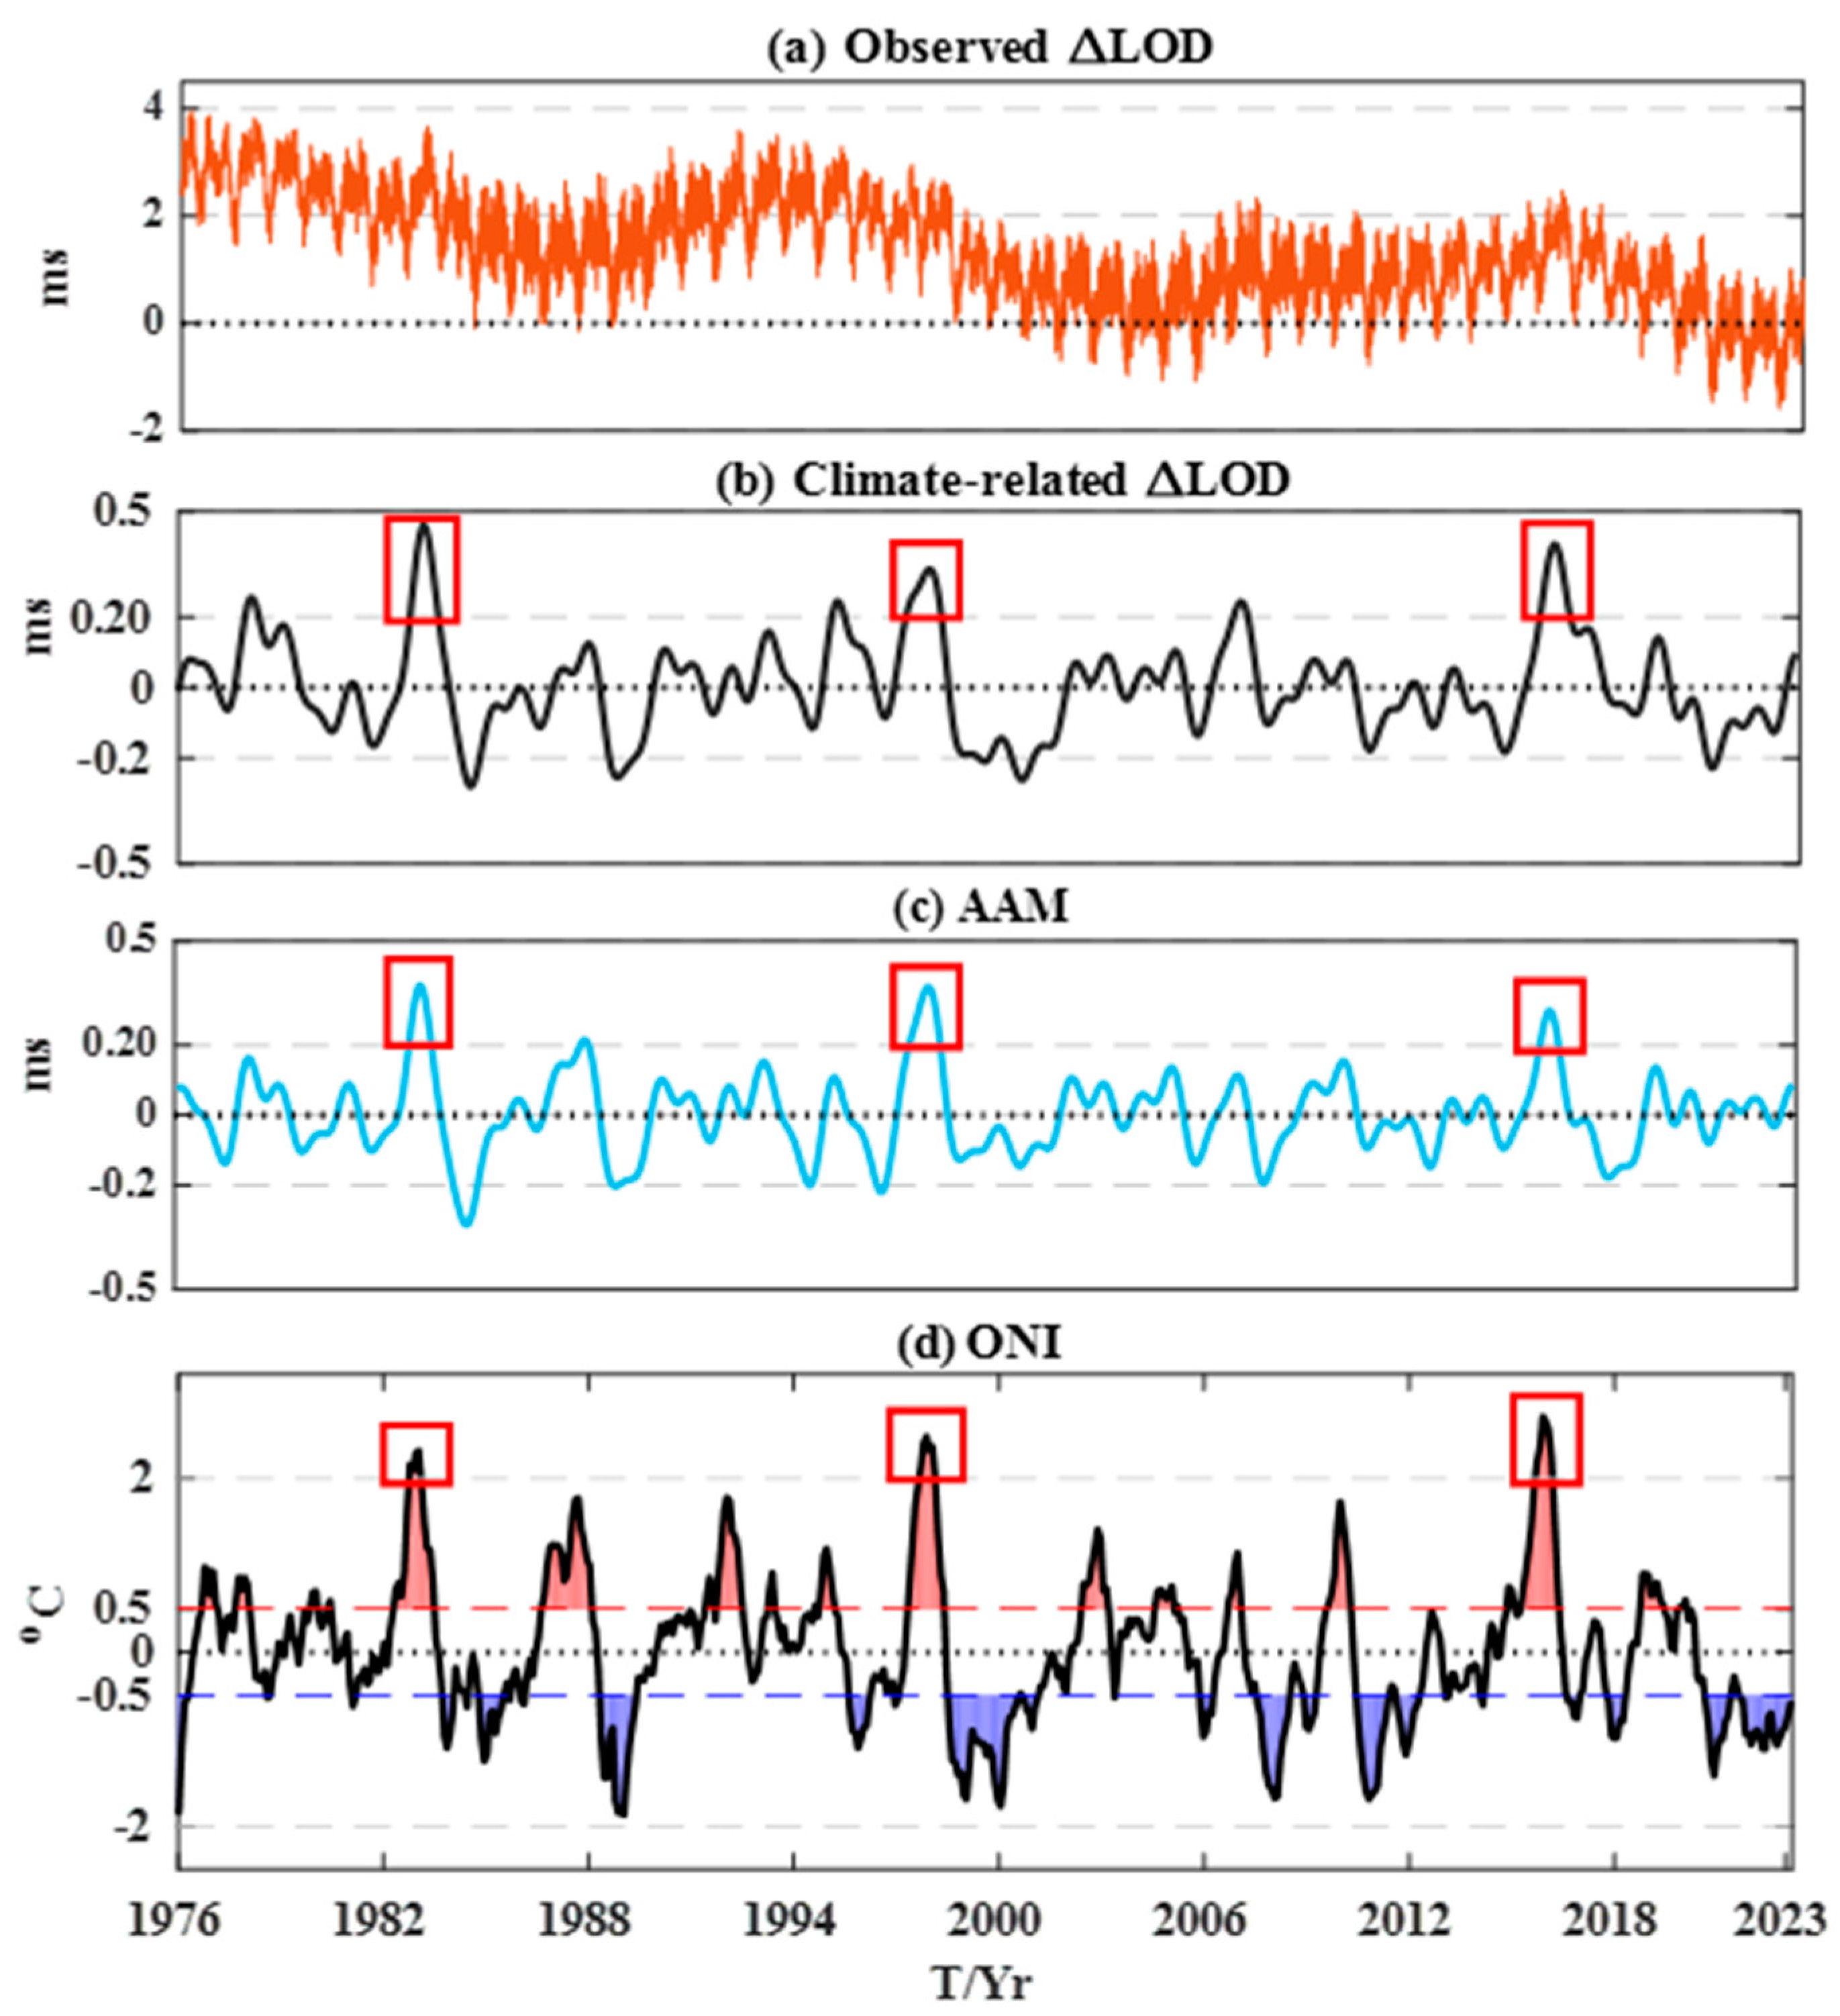
Figure 1. Time series from January 1976 to February 2023, whereby the red boxes mark the 3 extreme warm phenomena. (a) The observed ΔLOD (orange curve); (b) climate-related ΔLOD (black curve); (c) interannual AAM (light blue curve) and (d) ENSO indices of Niño 3.4.
Atmosphere 14 00982 g001
Figure 2. The climate-related ΔLOD and interannual variations in the different combinations of surface fluid angular momentum. Climate-related ΔLOD (black curve), the AOHAM (orange curve), the AOAM (green dot curve), the AHAM (purple dot curve) and the AAM (light blue curve).
Atmosphere 14 00982 g002
Figure 3. Time series from January 1993 to February 2023, the blue square frames mark the two triple-dip La Niña events, the red dashed lines indicate the phase discrepancy and the blue dashed lines display the phase consistency. (a) The climate-related ΔLOD (black curve) and interannual AOHAM (green curve); (b) ENSO indices of Niño 3.4.
Atmosphere 14 00982 g003
Figure 4. Interannual variations extracted from observed and predicted ΔLOD (black and pink curves) from January 2020 to February 2024; the blue arrows point to the latest triple-dip La Niña event, and the red arrow points to the follow-up El Niño phenomenon.
Atmosphere 14 00982 g004
Table 1. Correlations between initial ΔLOD observations and climate-related ΔLOD with interannual AAM and ENSO indices.
Initial ΔLODClimate-Related ΔLODInterannual AAMONI
Initial ΔLOD1.000.140.130.12
Climate-related ΔLOD0.141.000.760.61
Table 2. Correlations between the climate-related ΔLOD and the interannual terms of different AM series, as well as AM combinations.
AAMOAMHAMAOAMAHAMAOHAM
Climate-related ΔLOD0.760.120.320.760.800.80
Disclaimer/Publisher’s Note: The statements, opinions and data contained in all publications are solely those of the individual author(s) and contributor(s) and not of MDPI and/or the editor(s). MDPI and/or the editor(s) disclaim responsibility for any injury to people or property resulting from any ideas, methods, instructions or products referred to in the content.