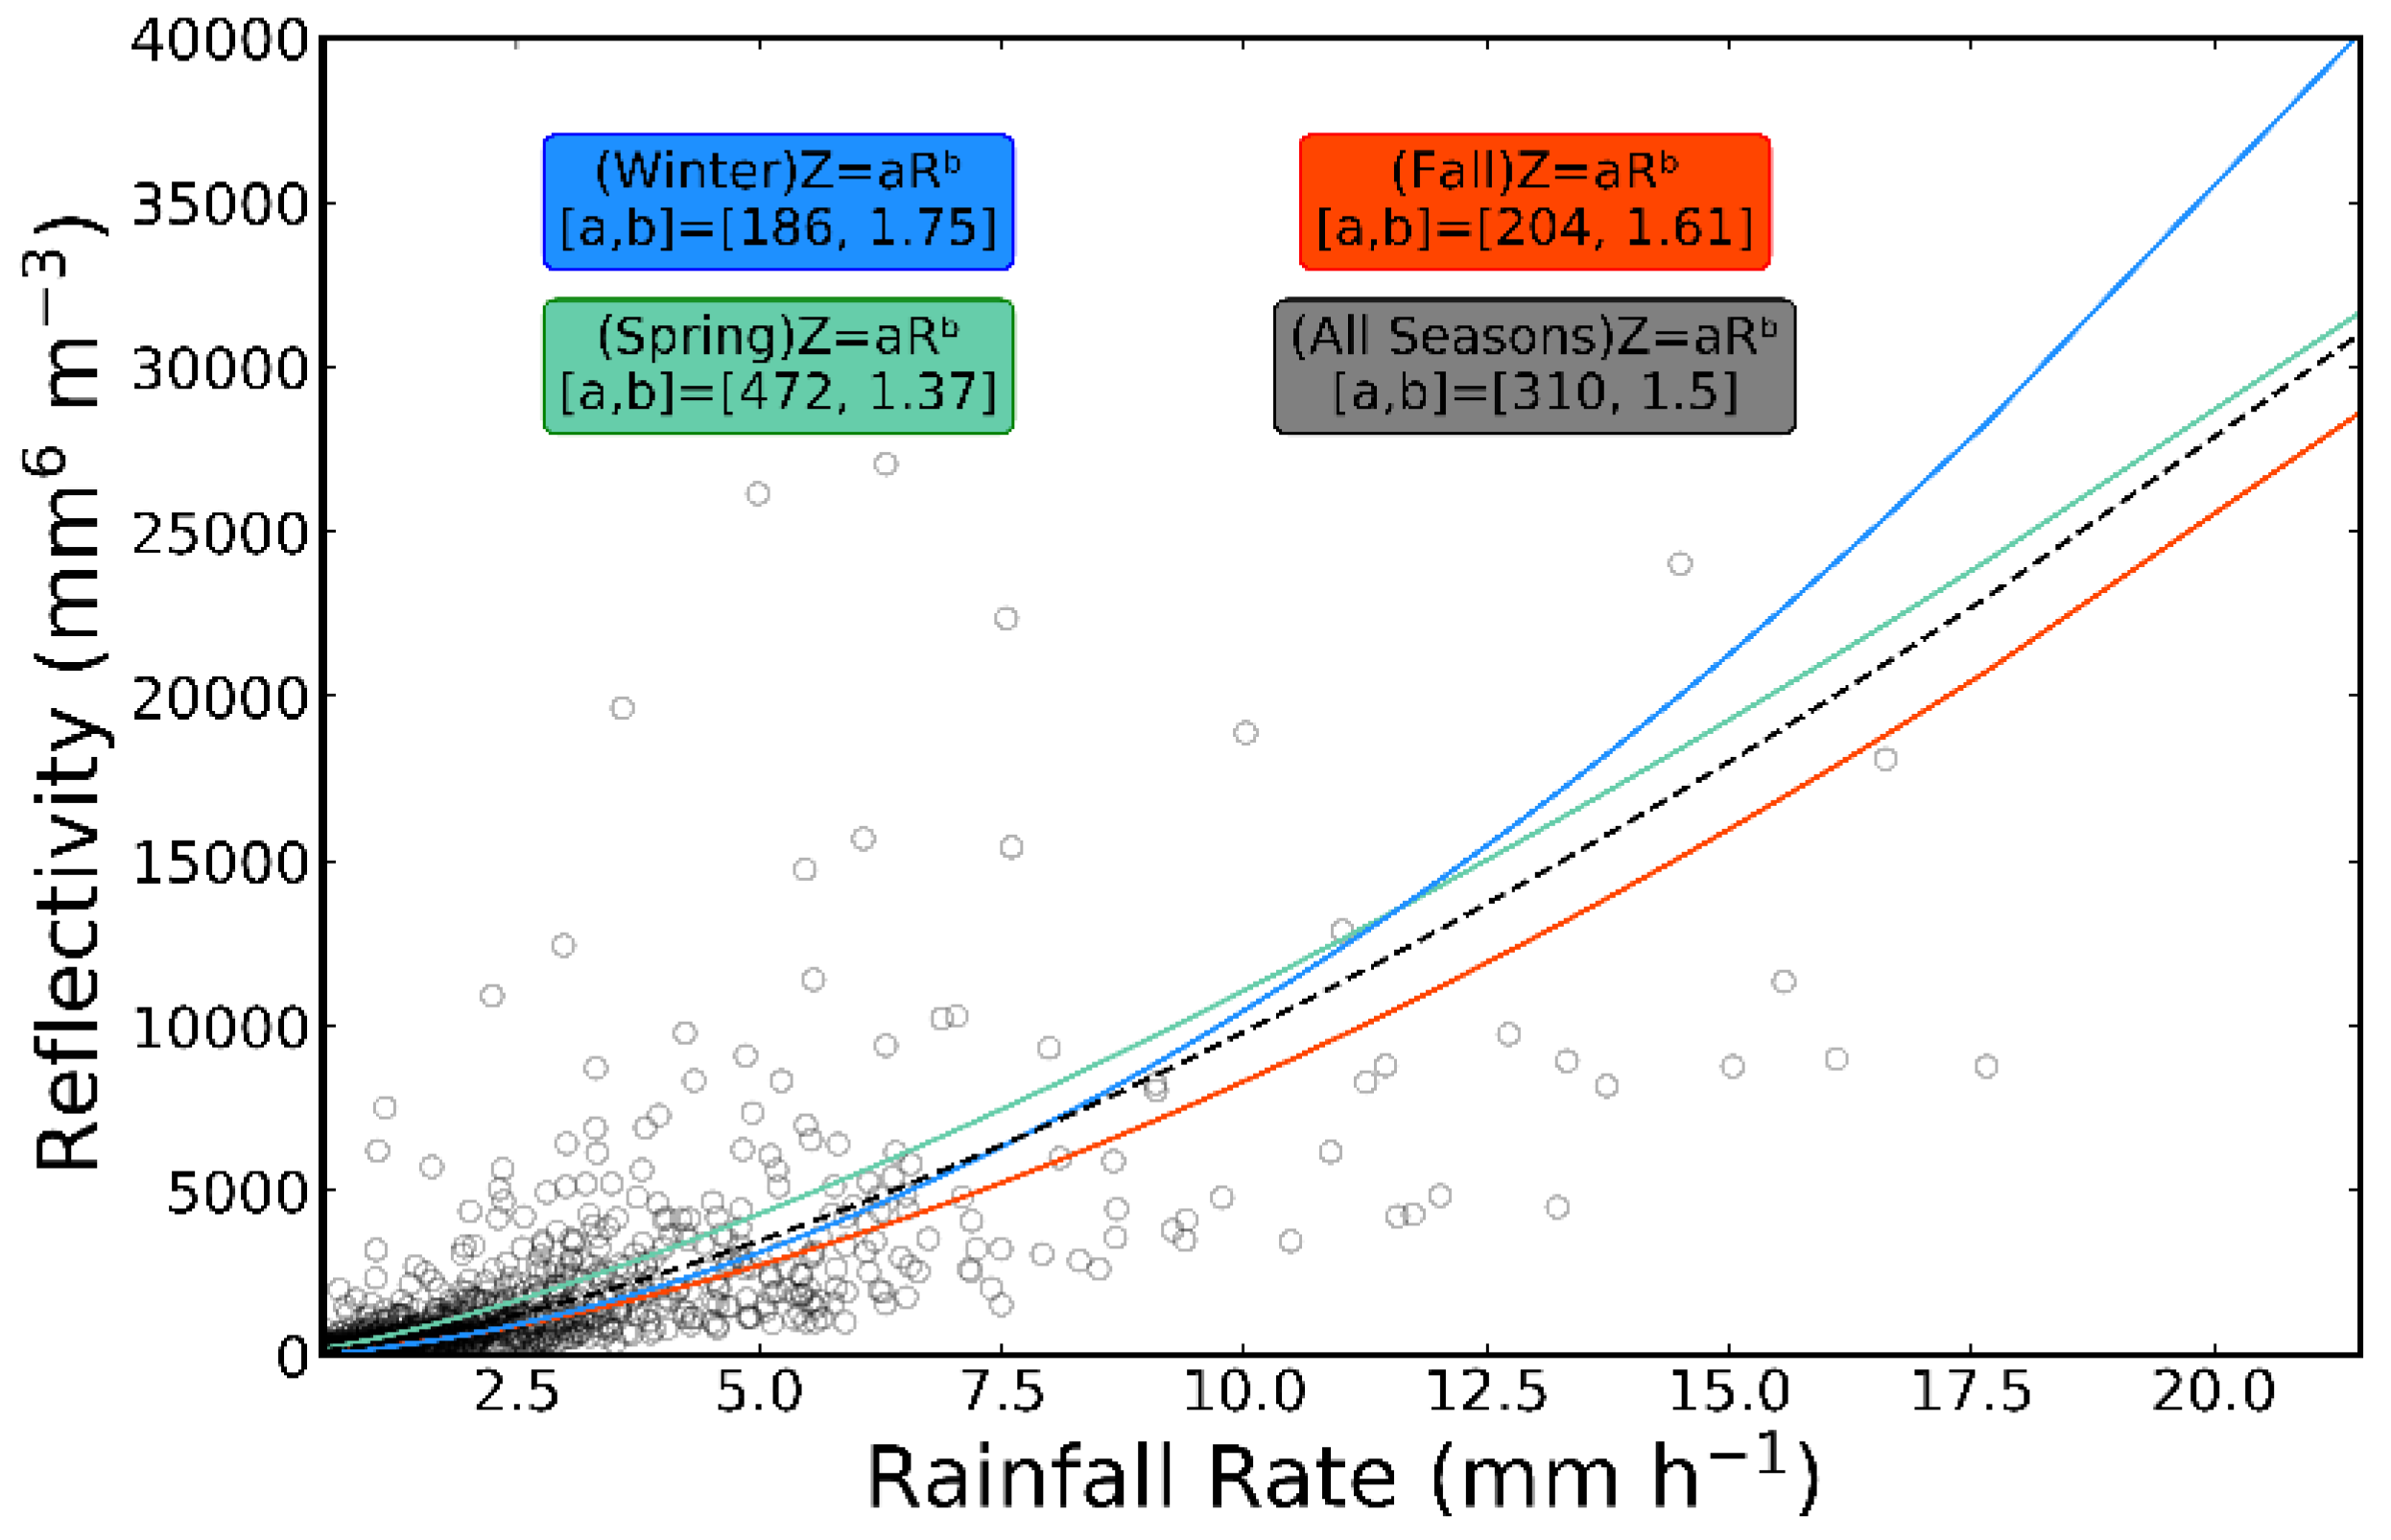
Figure 1.
Influence of seasons on the Z–R relationship. Winter includes January and February of 2019, fall includes November and December of 2019, and spring includes March and April of 2020.
Figure 1.
Influence of seasons on the Z–R relationship. Winter includes January and February of 2019, fall includes November and December of 2019, and spring includes March and April of 2020.
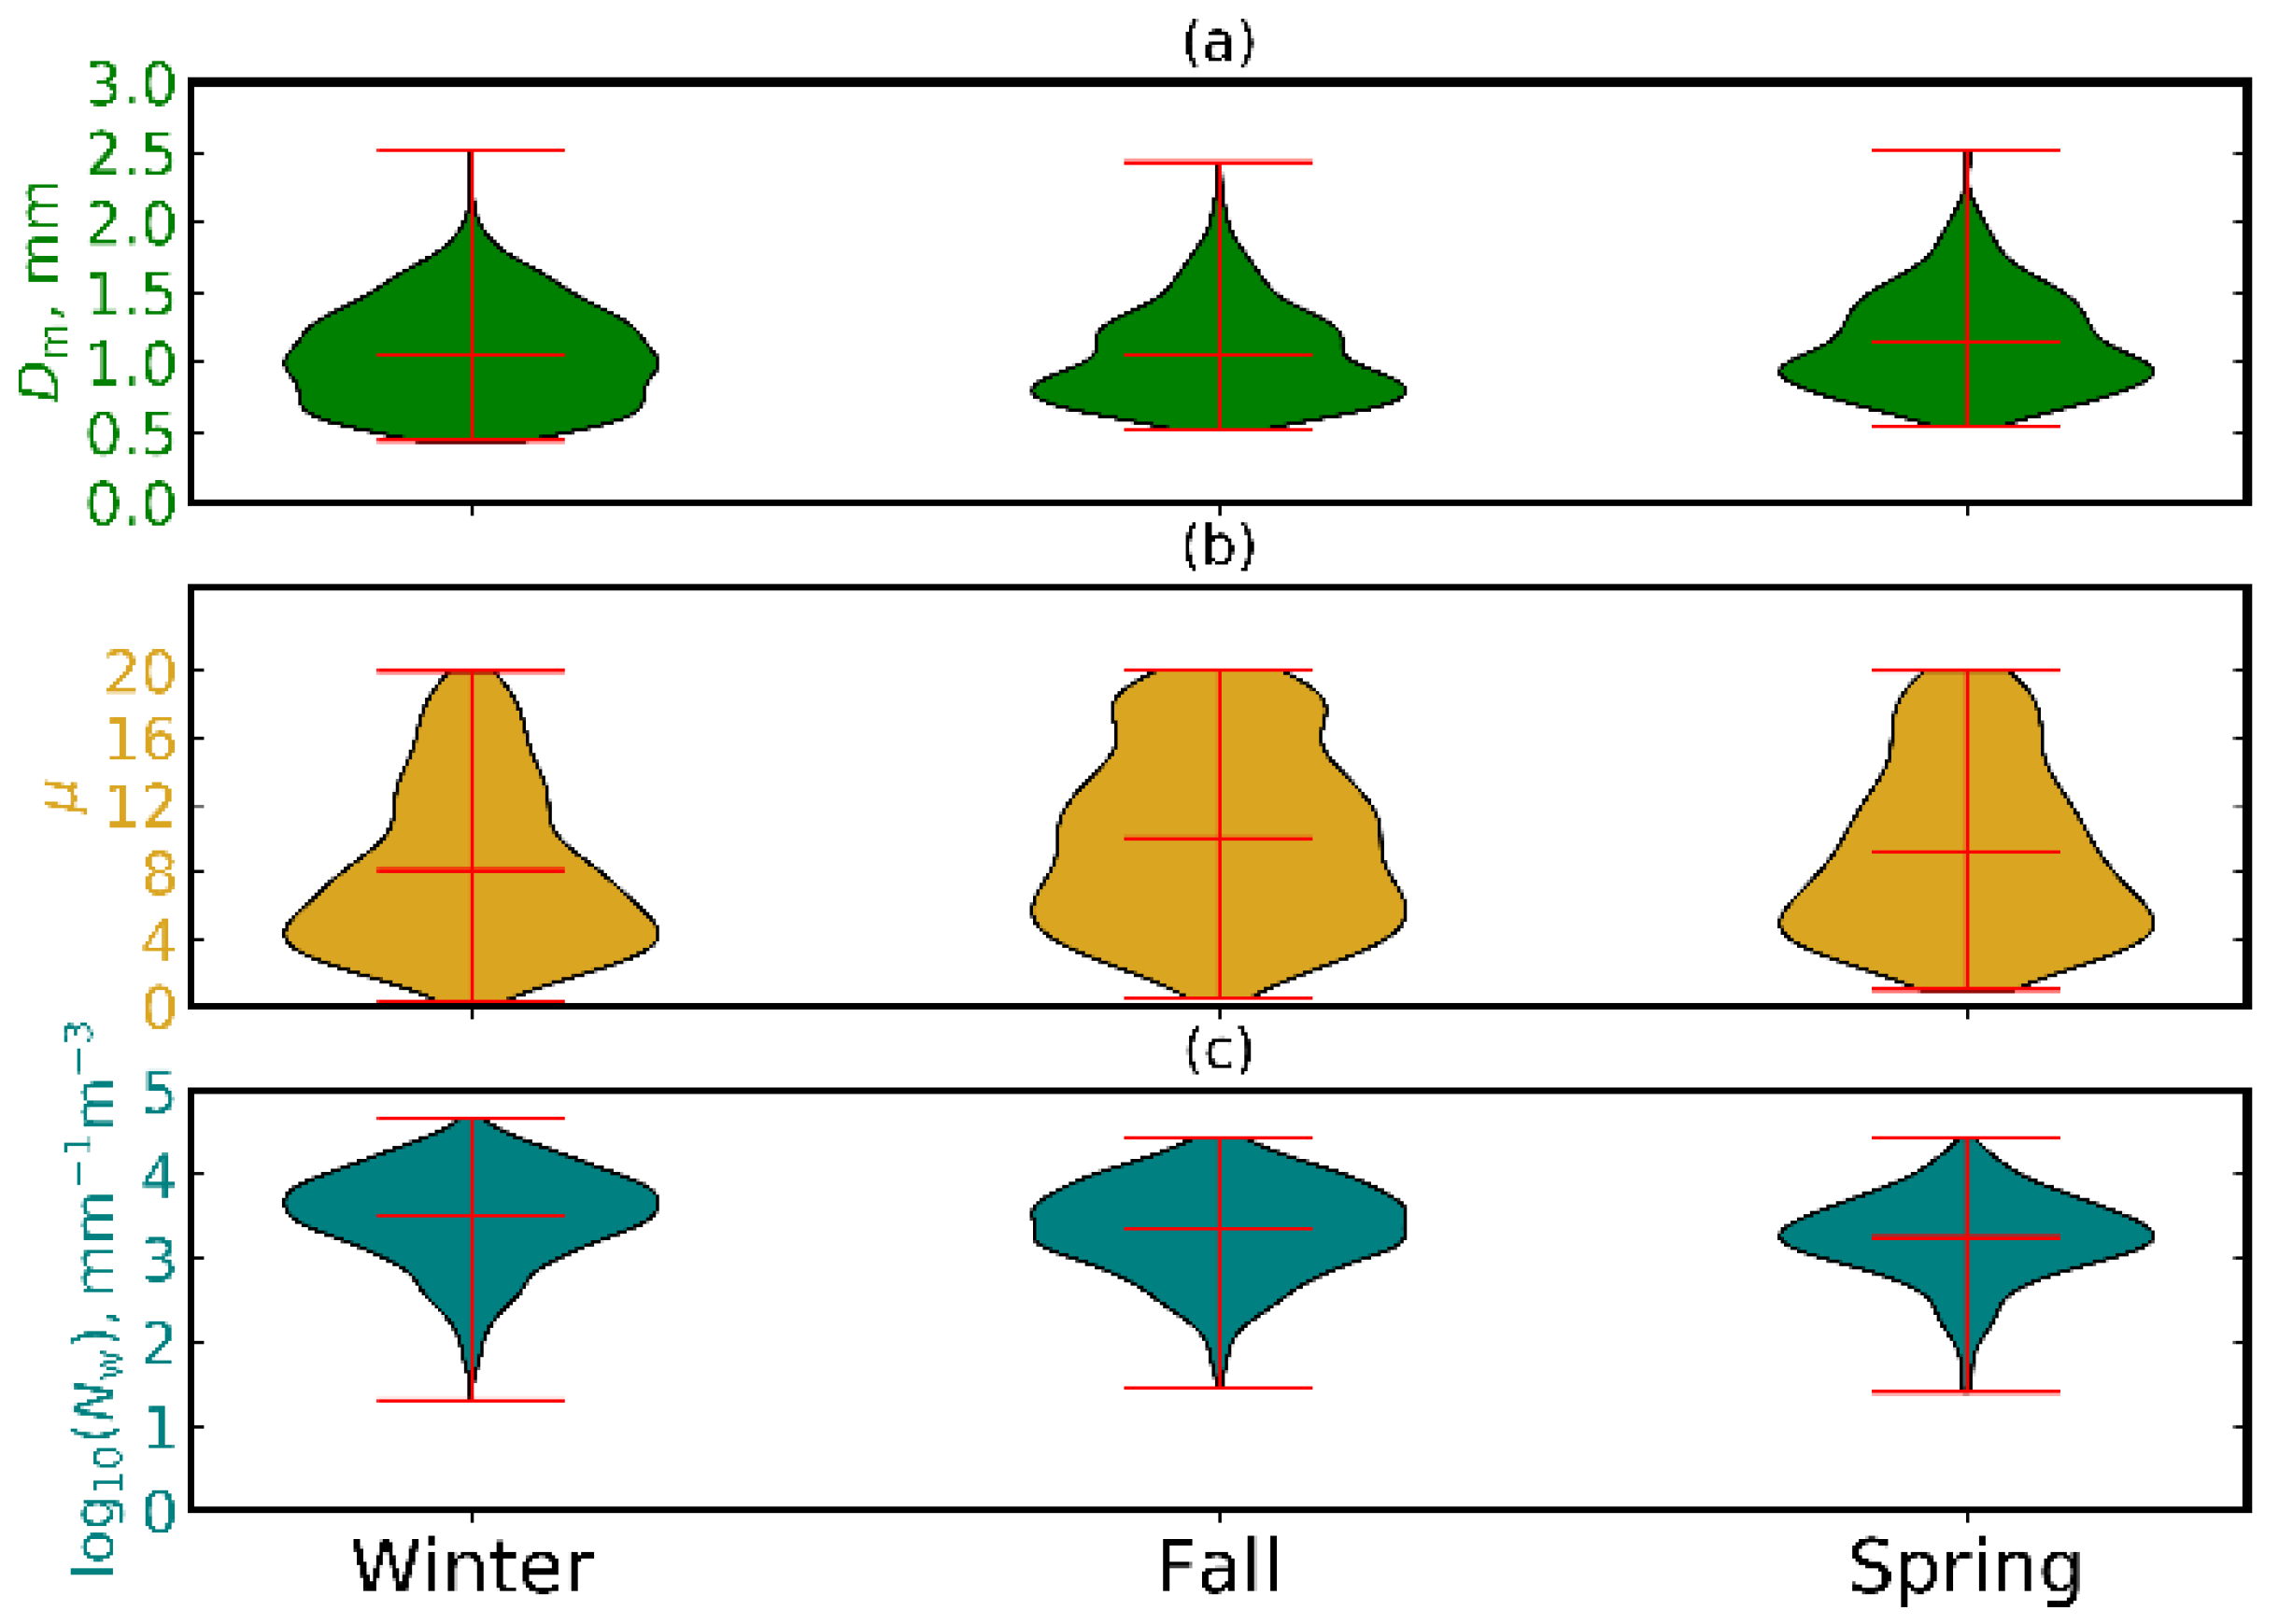
Figure 2.
Seasonal influence on distributions of the DSD scaling parameters allocated during the winter, fall, and spring: (a) mean volume diameter; (b) shape; (c) concentration. Maximum, minimum, and average values are included.
Figure 2.
Seasonal influence on distributions of the DSD scaling parameters allocated during the winter, fall, and spring: (a) mean volume diameter; (b) shape; (c) concentration. Maximum, minimum, and average values are included.
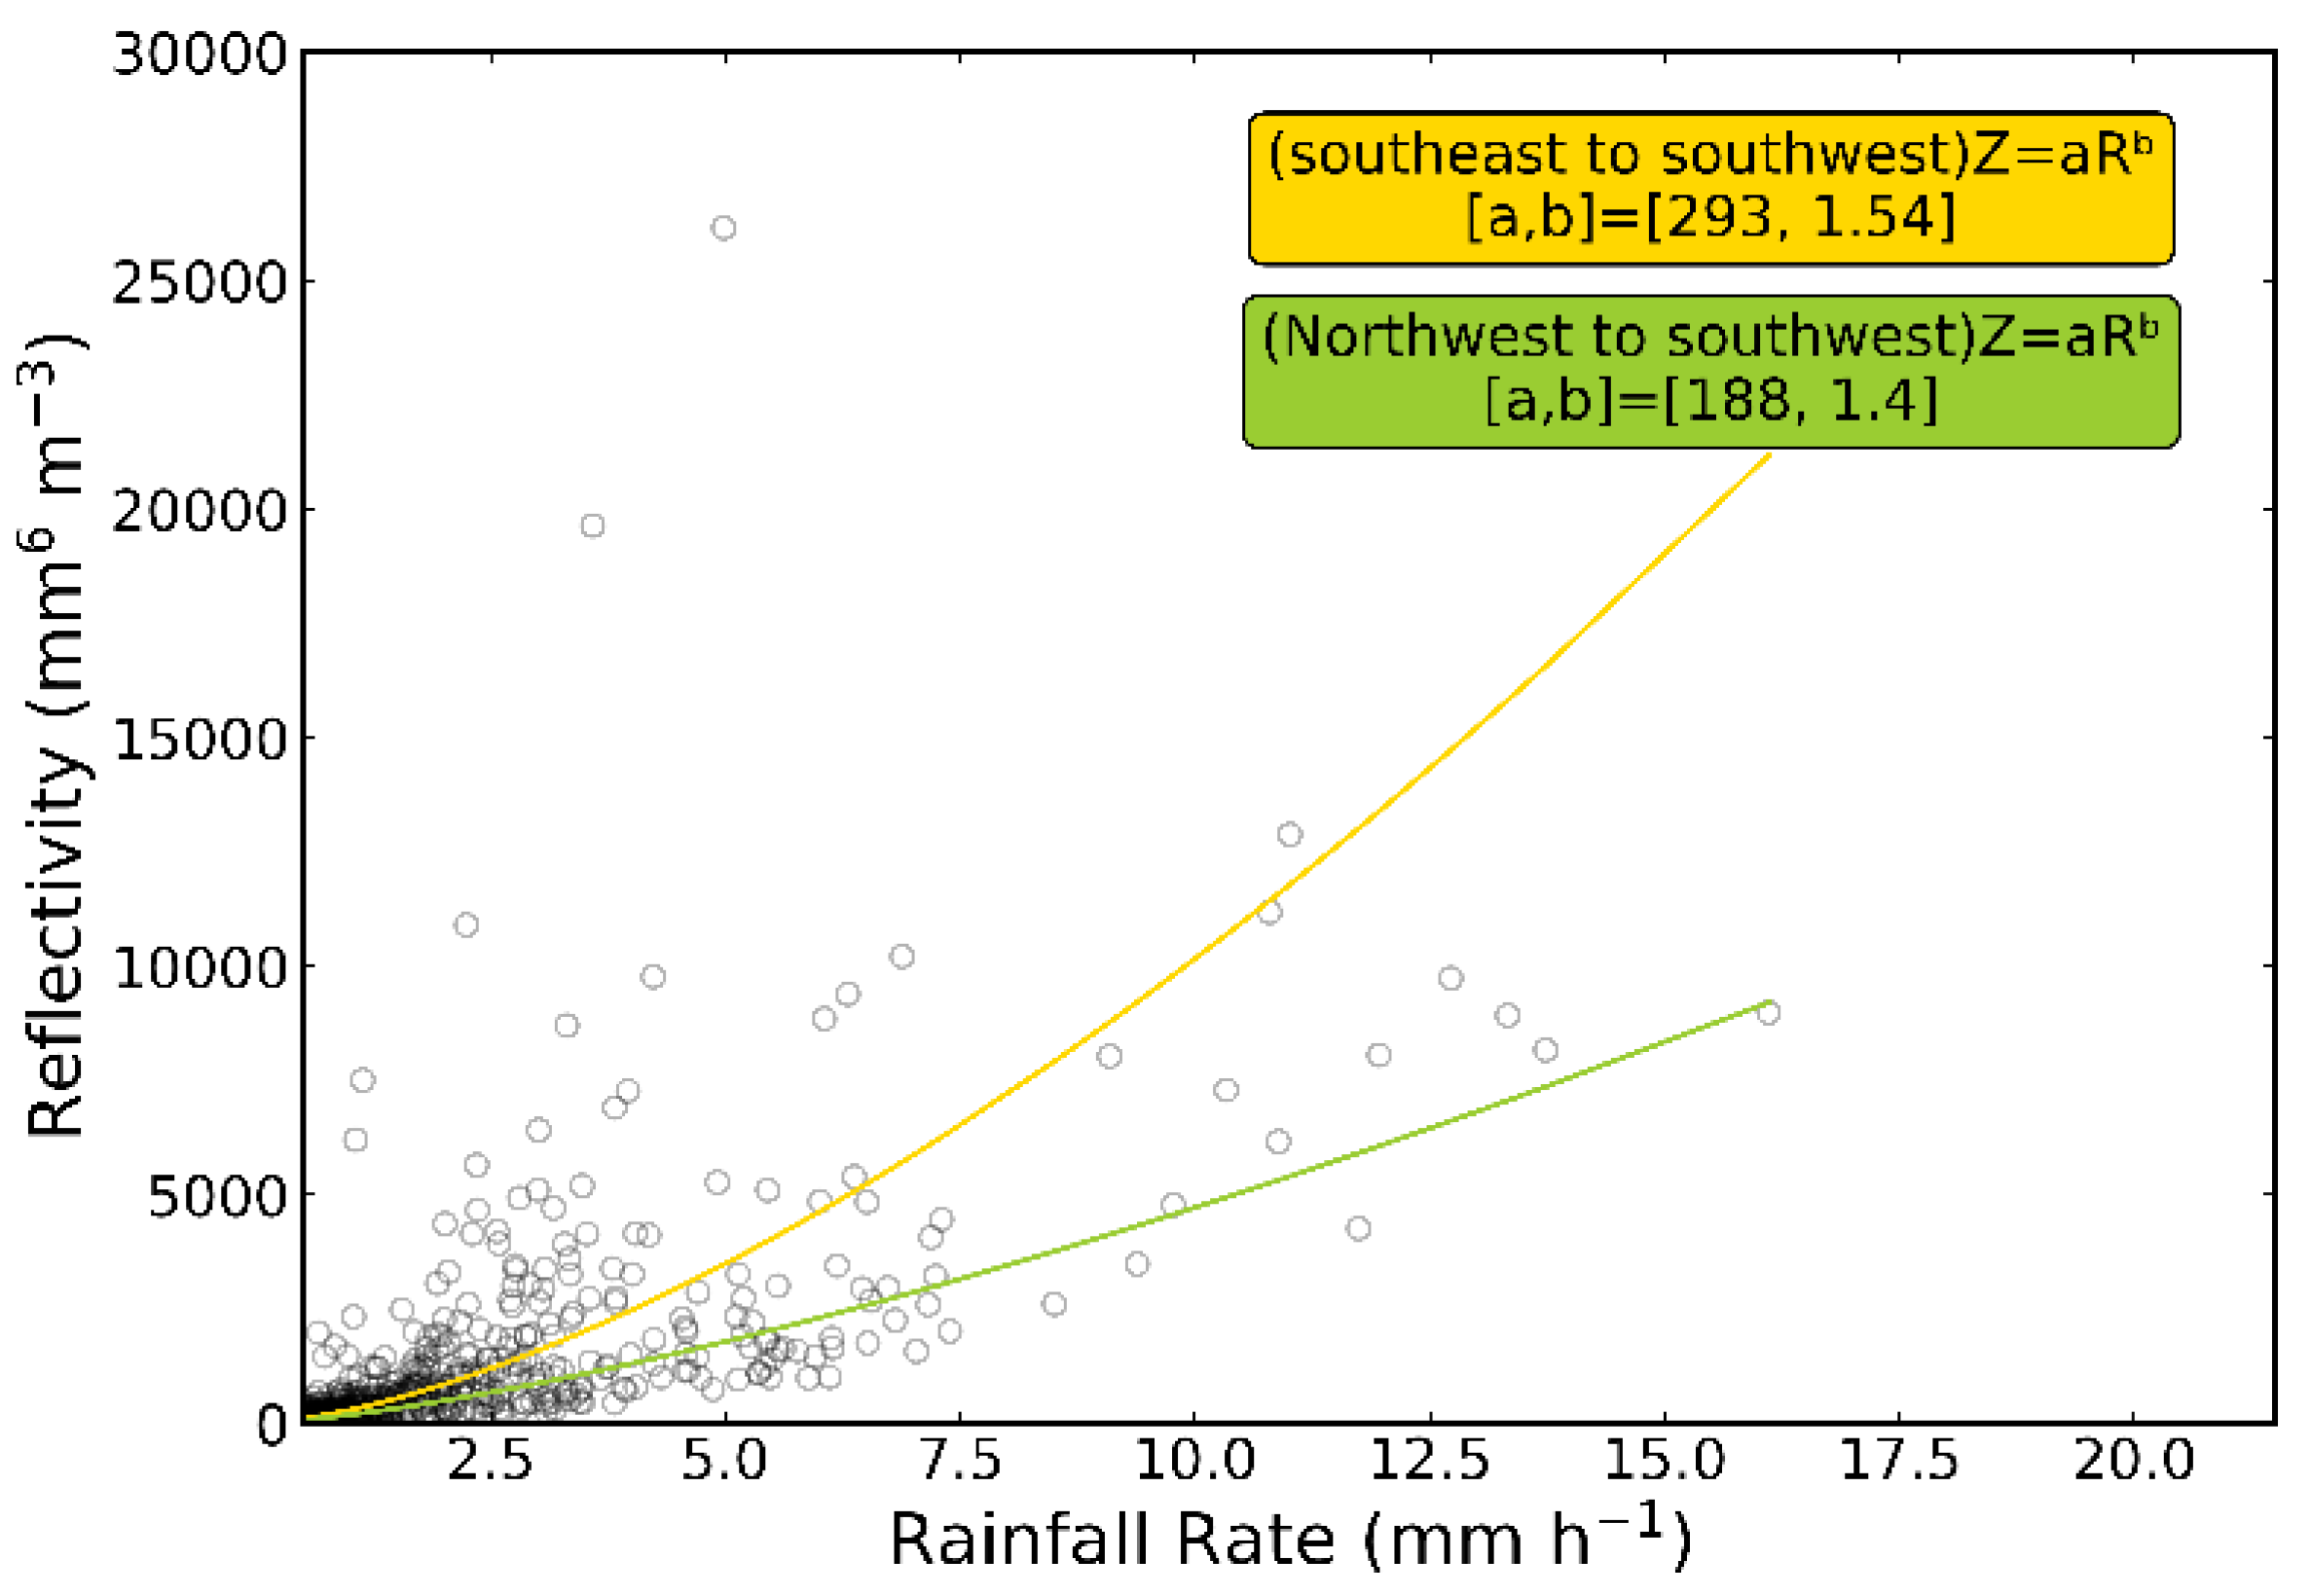
Figure 3.
The influence of wind direction on the Z–R relationship. The yellow and green lines indicate the best fit for southwest and northwest flow, respectively.
Figure 3.
The influence of wind direction on the Z–R relationship. The yellow and green lines indicate the best fit for southwest and northwest flow, respectively.
Figure 4.
Influence of wind direction on the distributions of the DSD scaling parameters in the form of a violin plot: (a) mean mass diameter; (b) shape; (c) concentration.
Figure 4.
Influence of wind direction on the distributions of the DSD scaling parameters in the form of a violin plot: (a) mean mass diameter; (b) shape; (c) concentration.
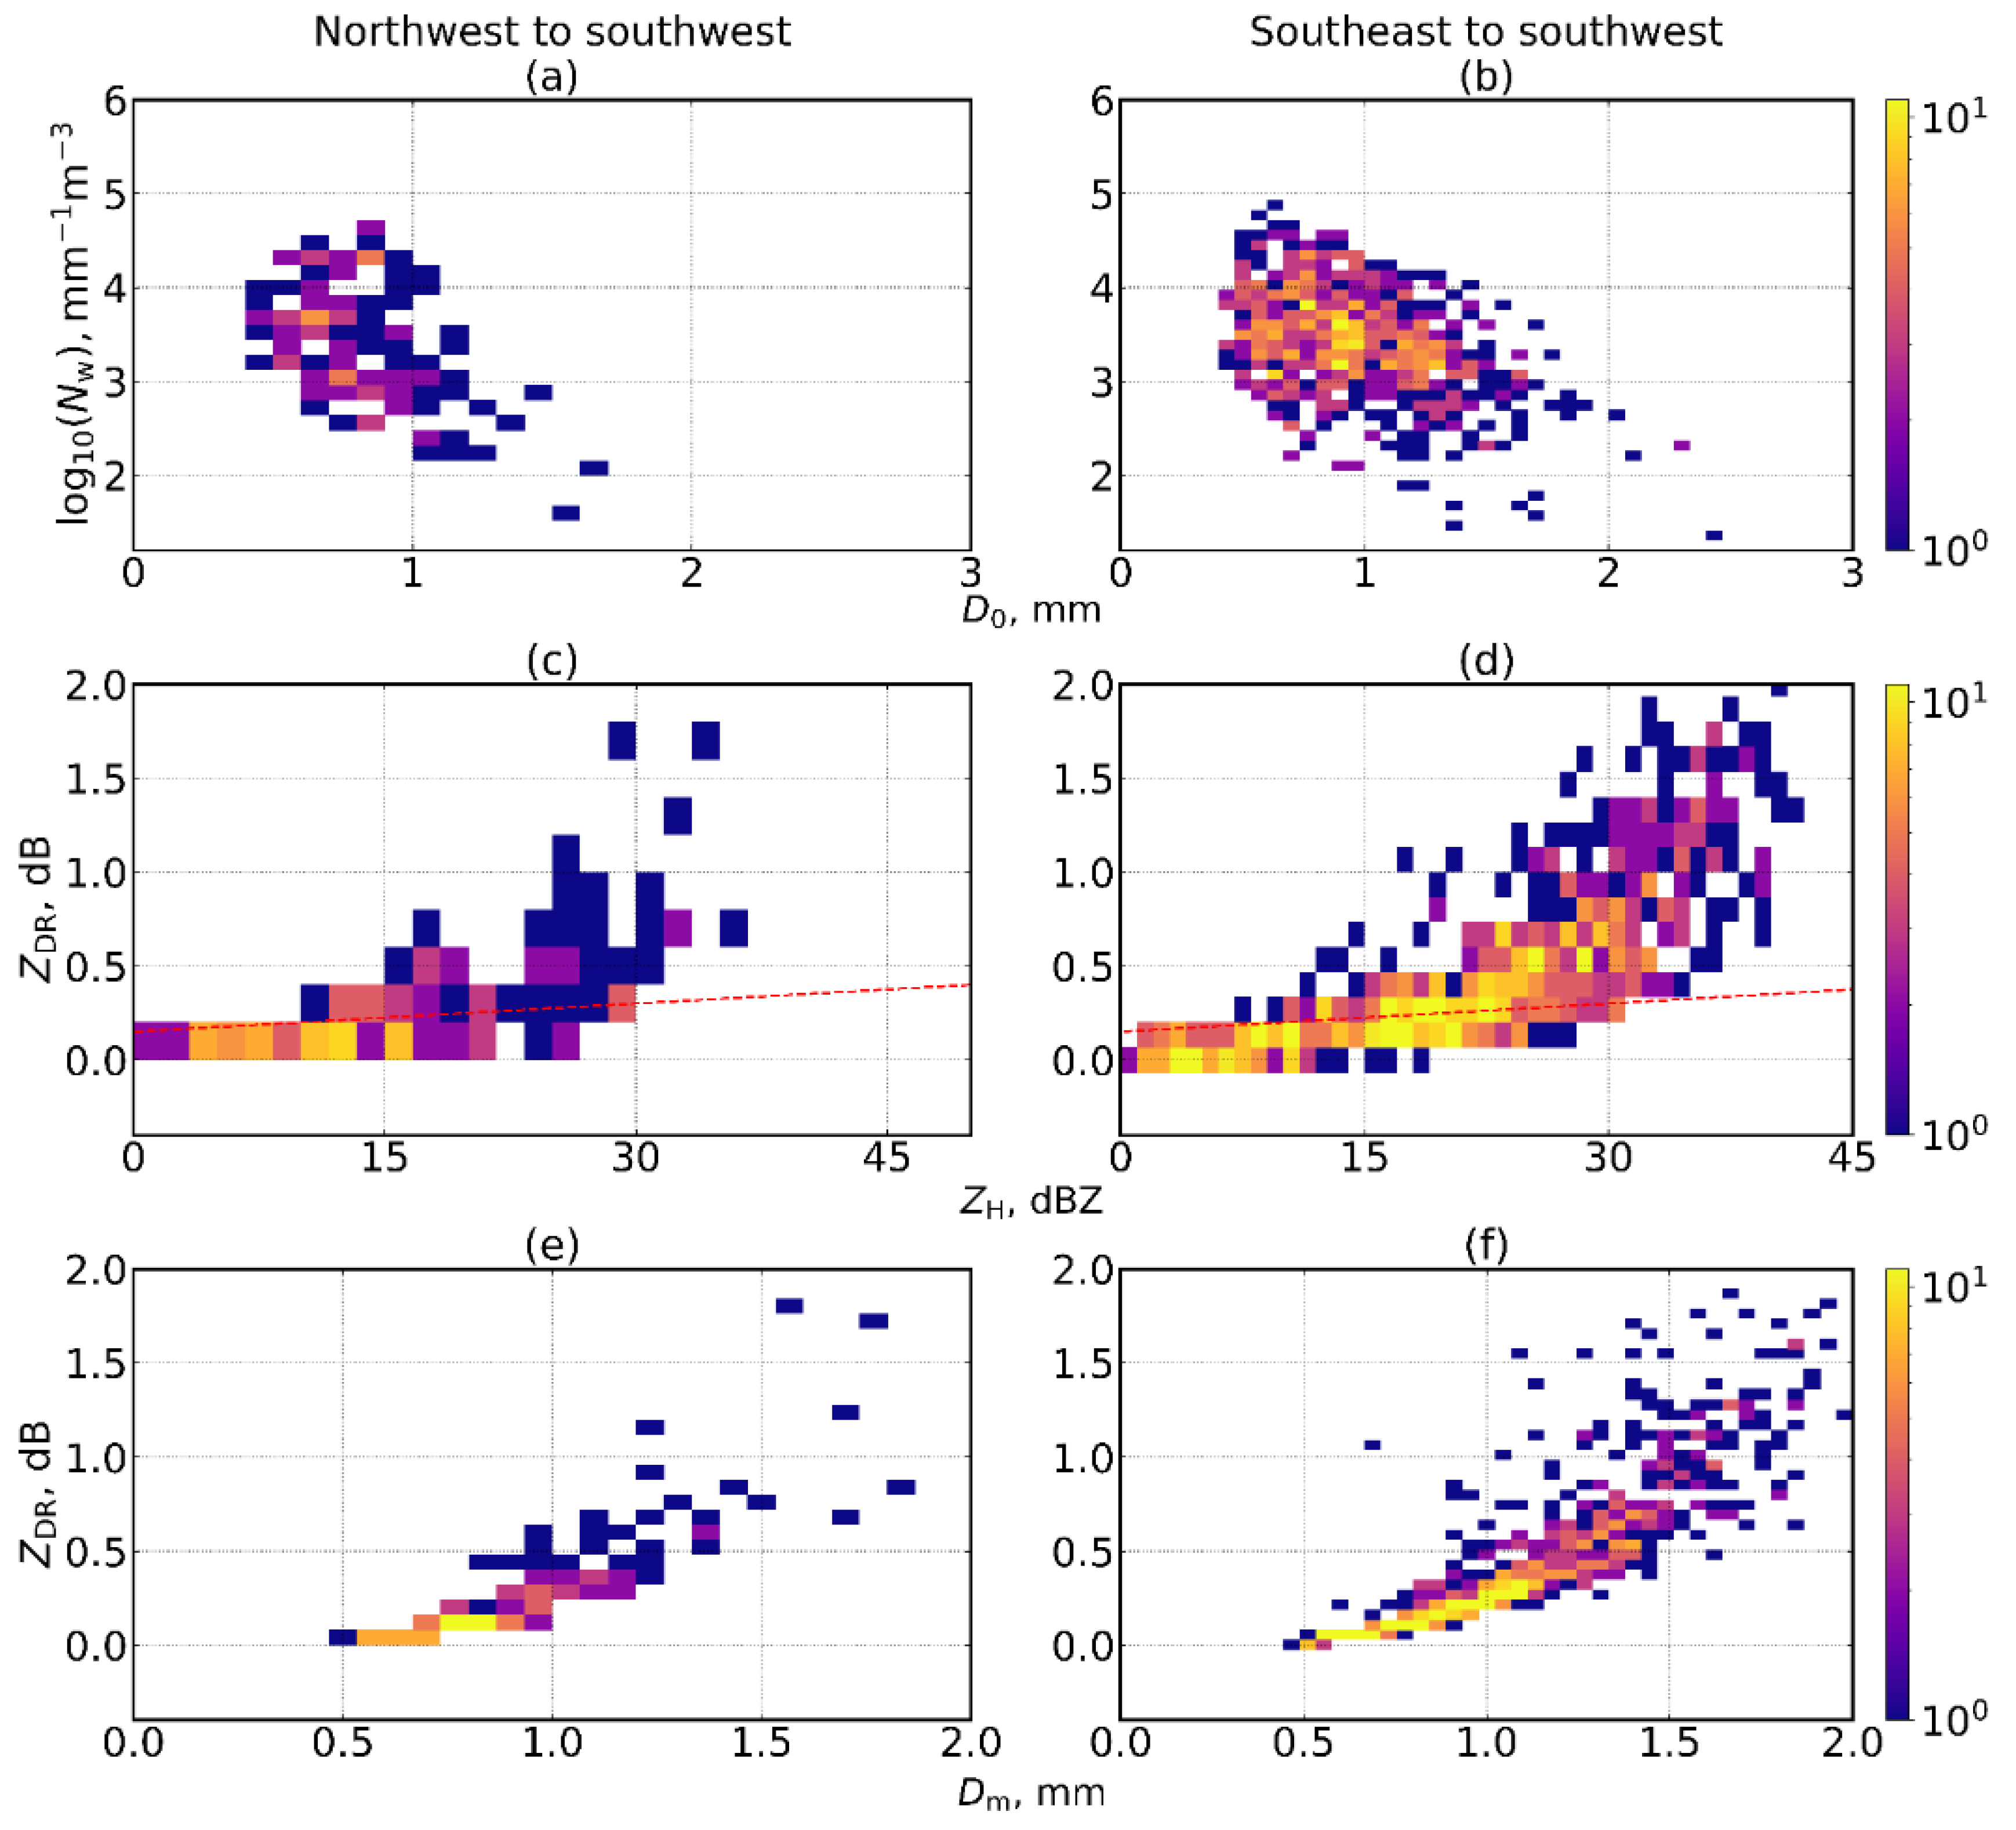
Figure 5.
Series of two-dimensional histograms representing the influence of northwest-to-southwest flow and southeast-to-southwest flow on specific radar and DSD parameters: (a,b) vs. for northwest and southwest flow; (c,d) for northwest and southwest flow; (e,f) vs. for northwest and southwest flow.
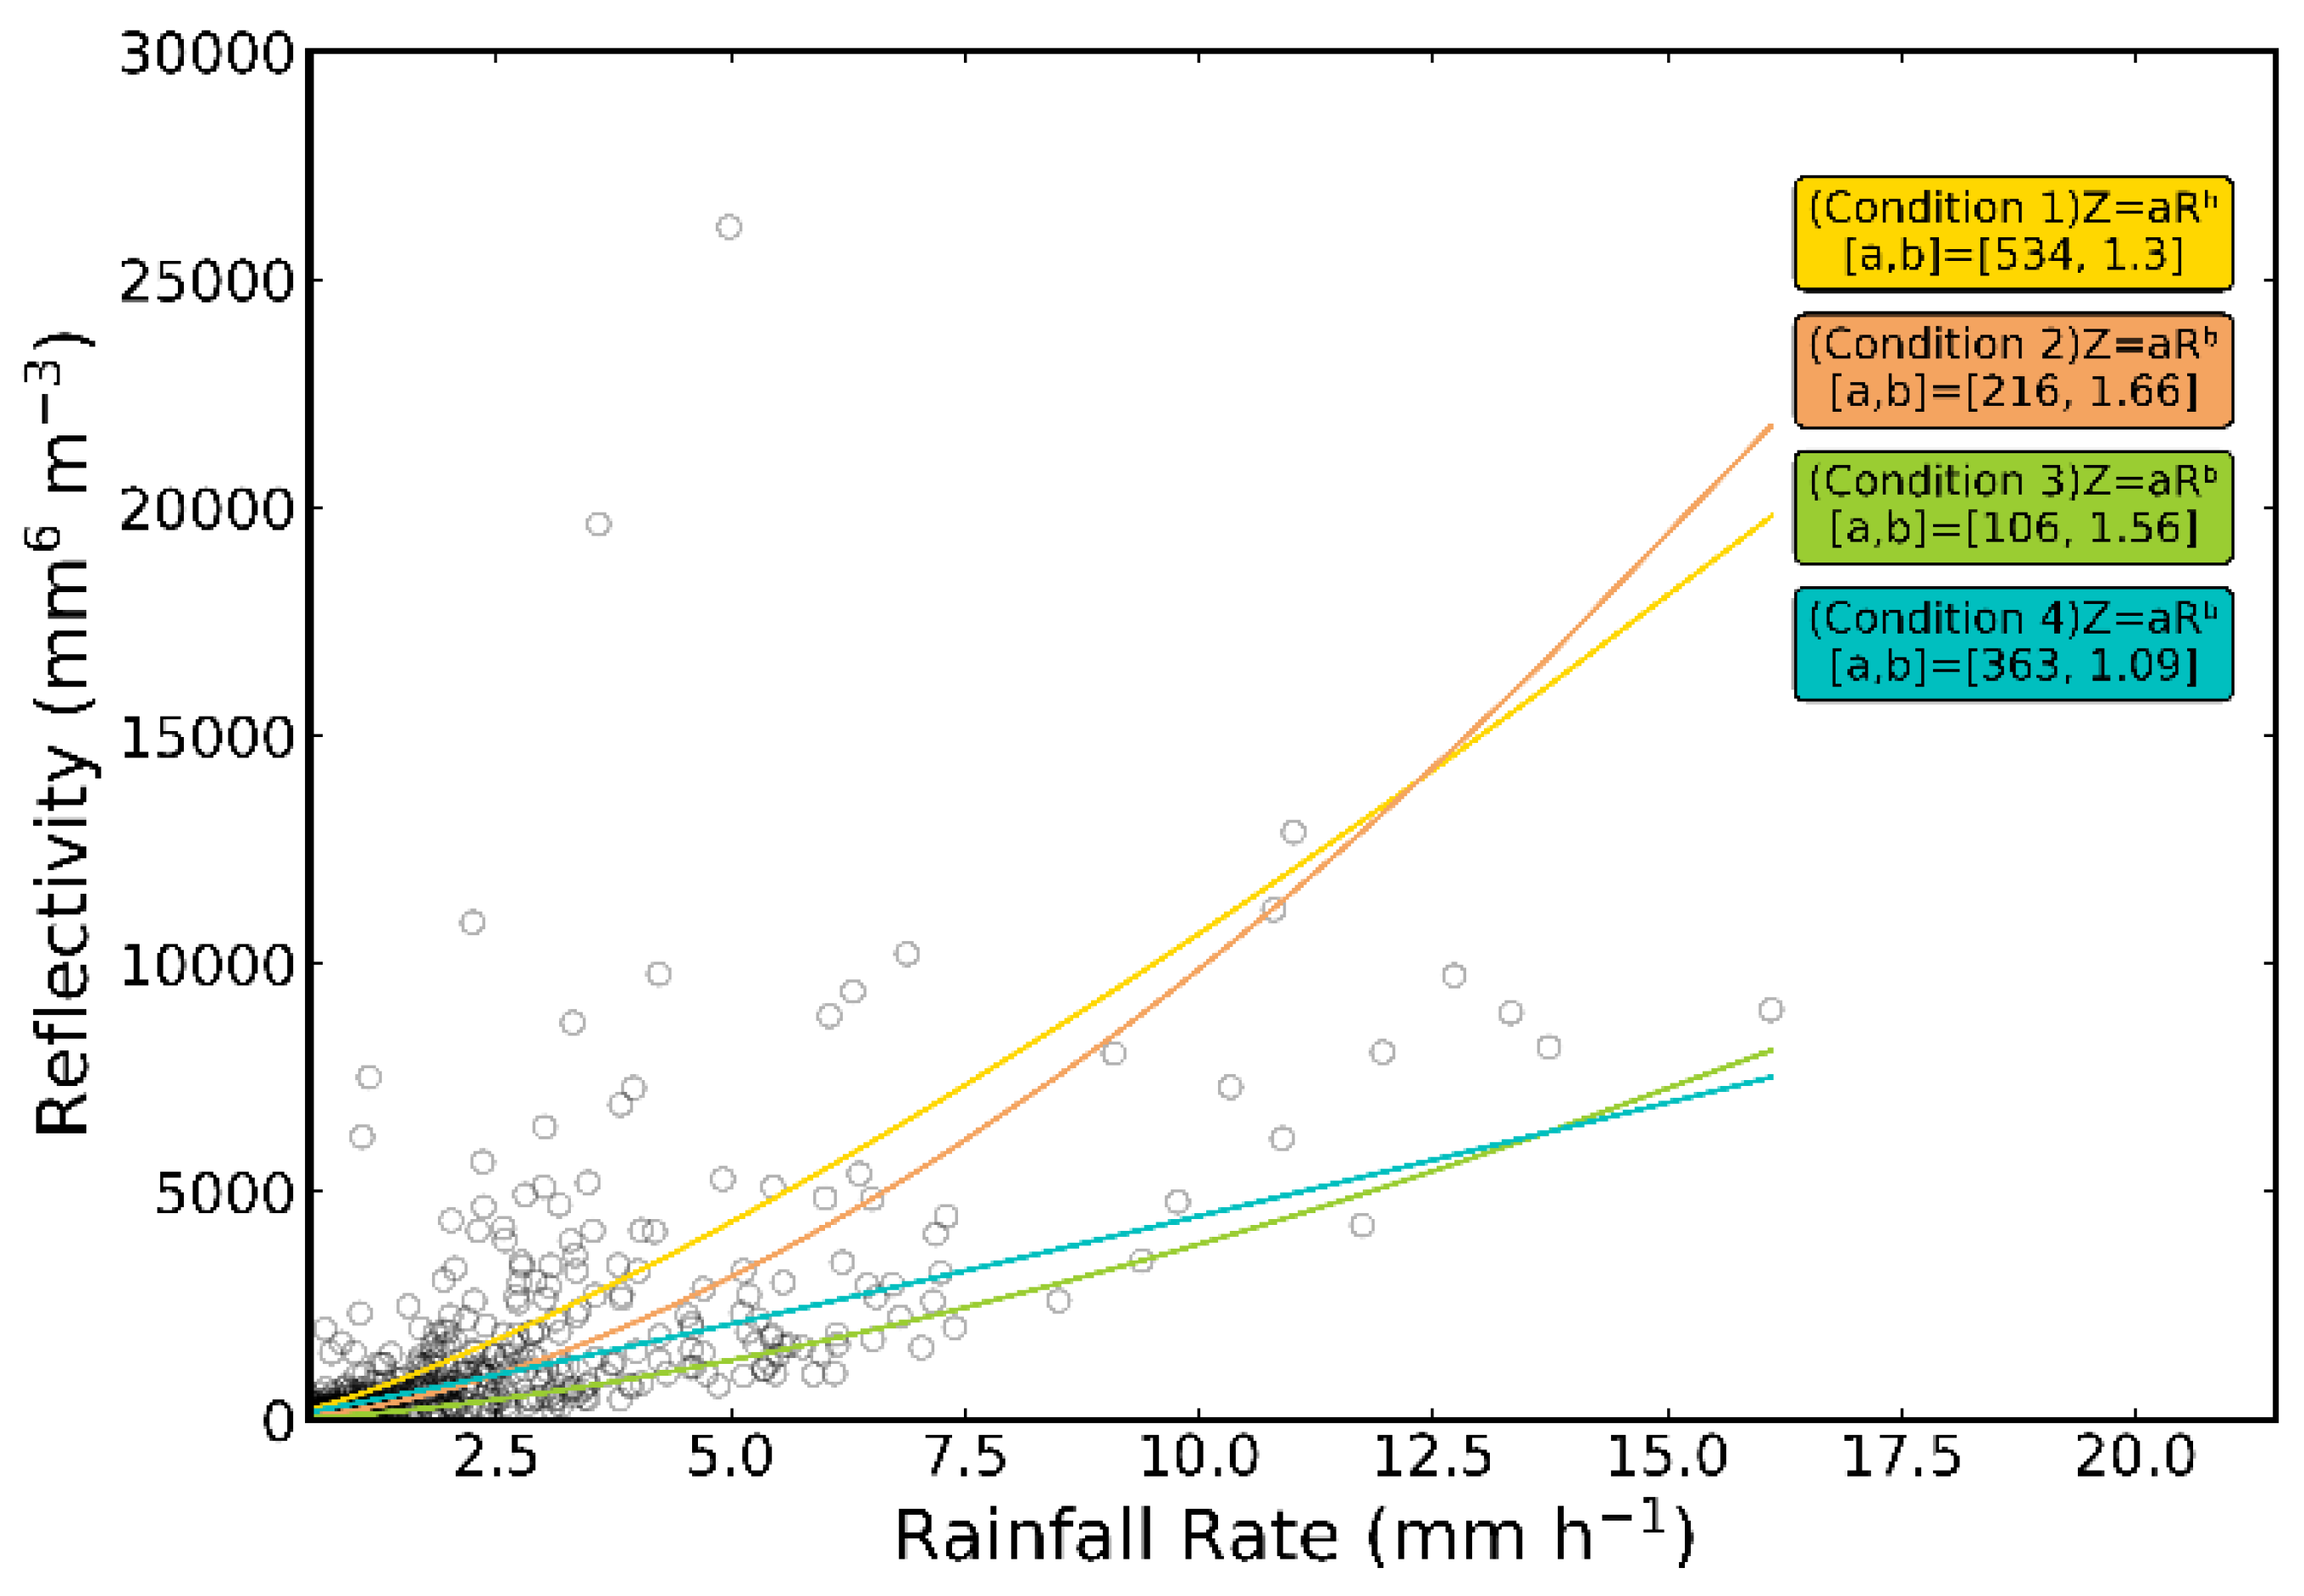
Figure 6.
The influence of low-level flow from the northwest and southwest at different magnitudes on the Z–R relationship. The yellow and orange lines represent southeast-to-southwest flow at different magnitudes, while the green and blue lines represent northwest-to-southwest flow at different magnitudes.
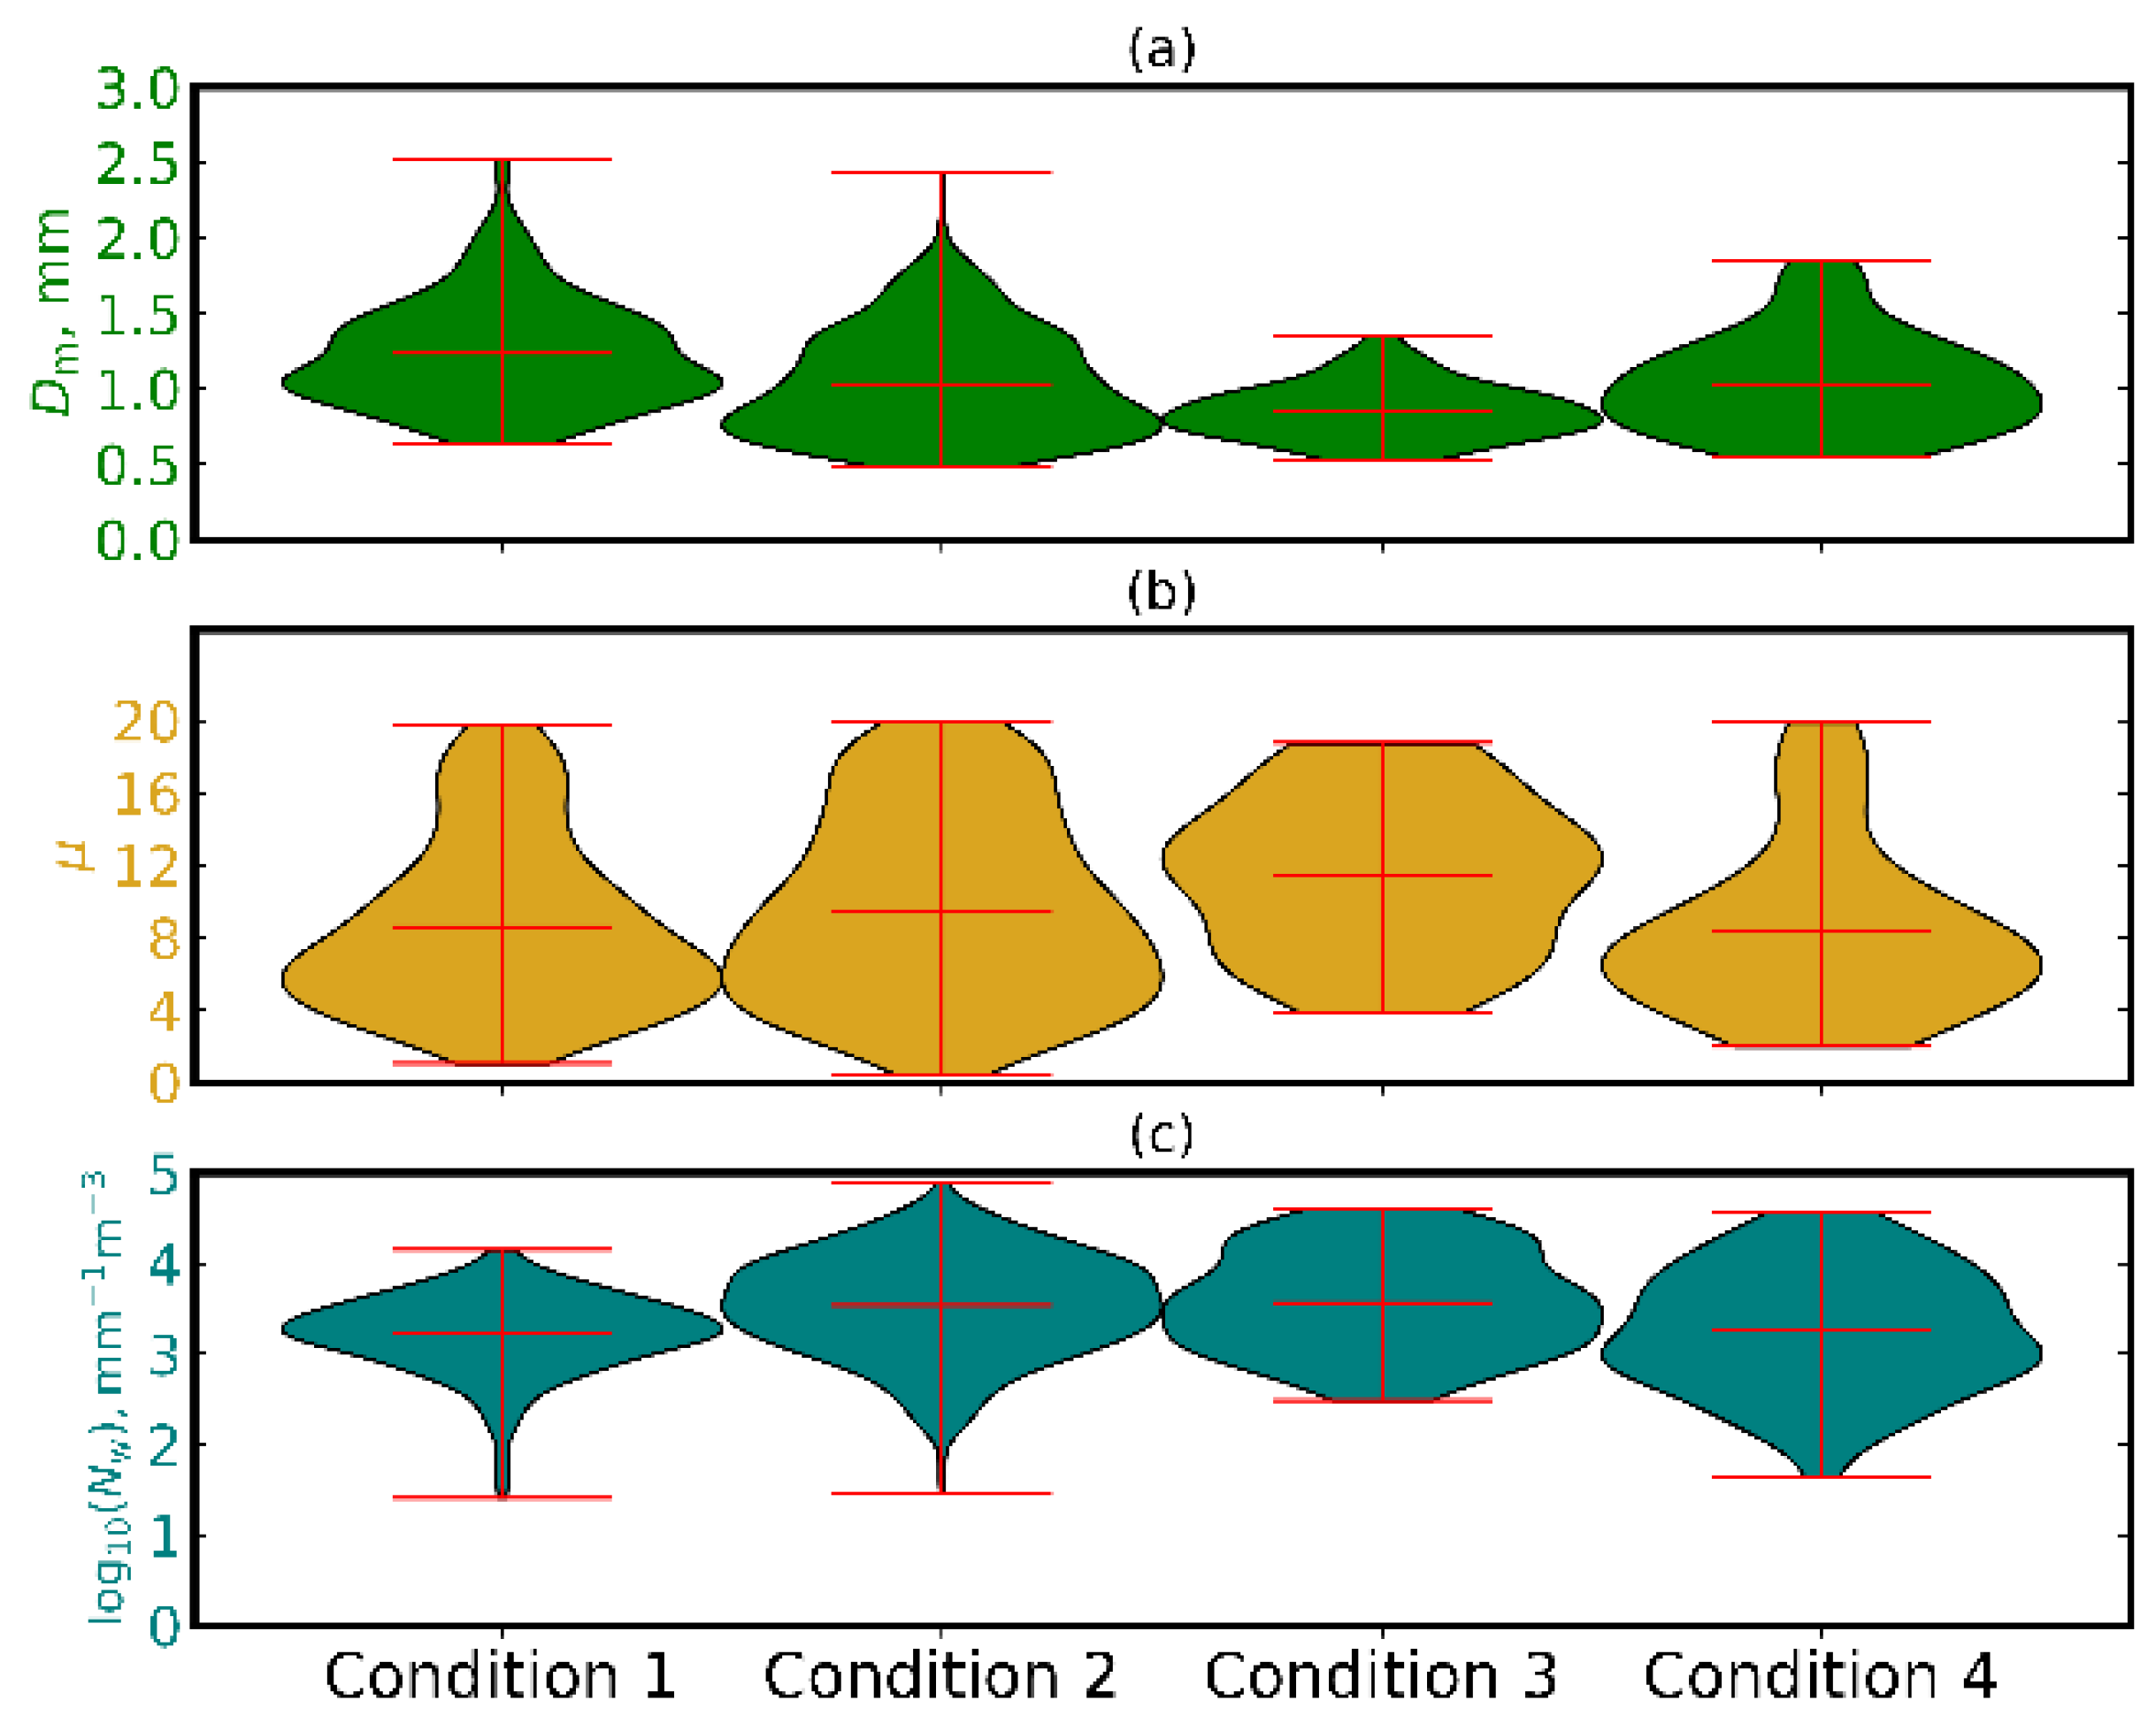
Figure 7.
The influence of wind direction and magnitude of low-level flow on the DSD scaling parameters: (a) mean mass diameter; (b) shape; (c) concentration.
Figure 7.
The influence of wind direction and magnitude of low-level flow on the DSD scaling parameters: (a) mean mass diameter; (b) shape; (c) concentration.
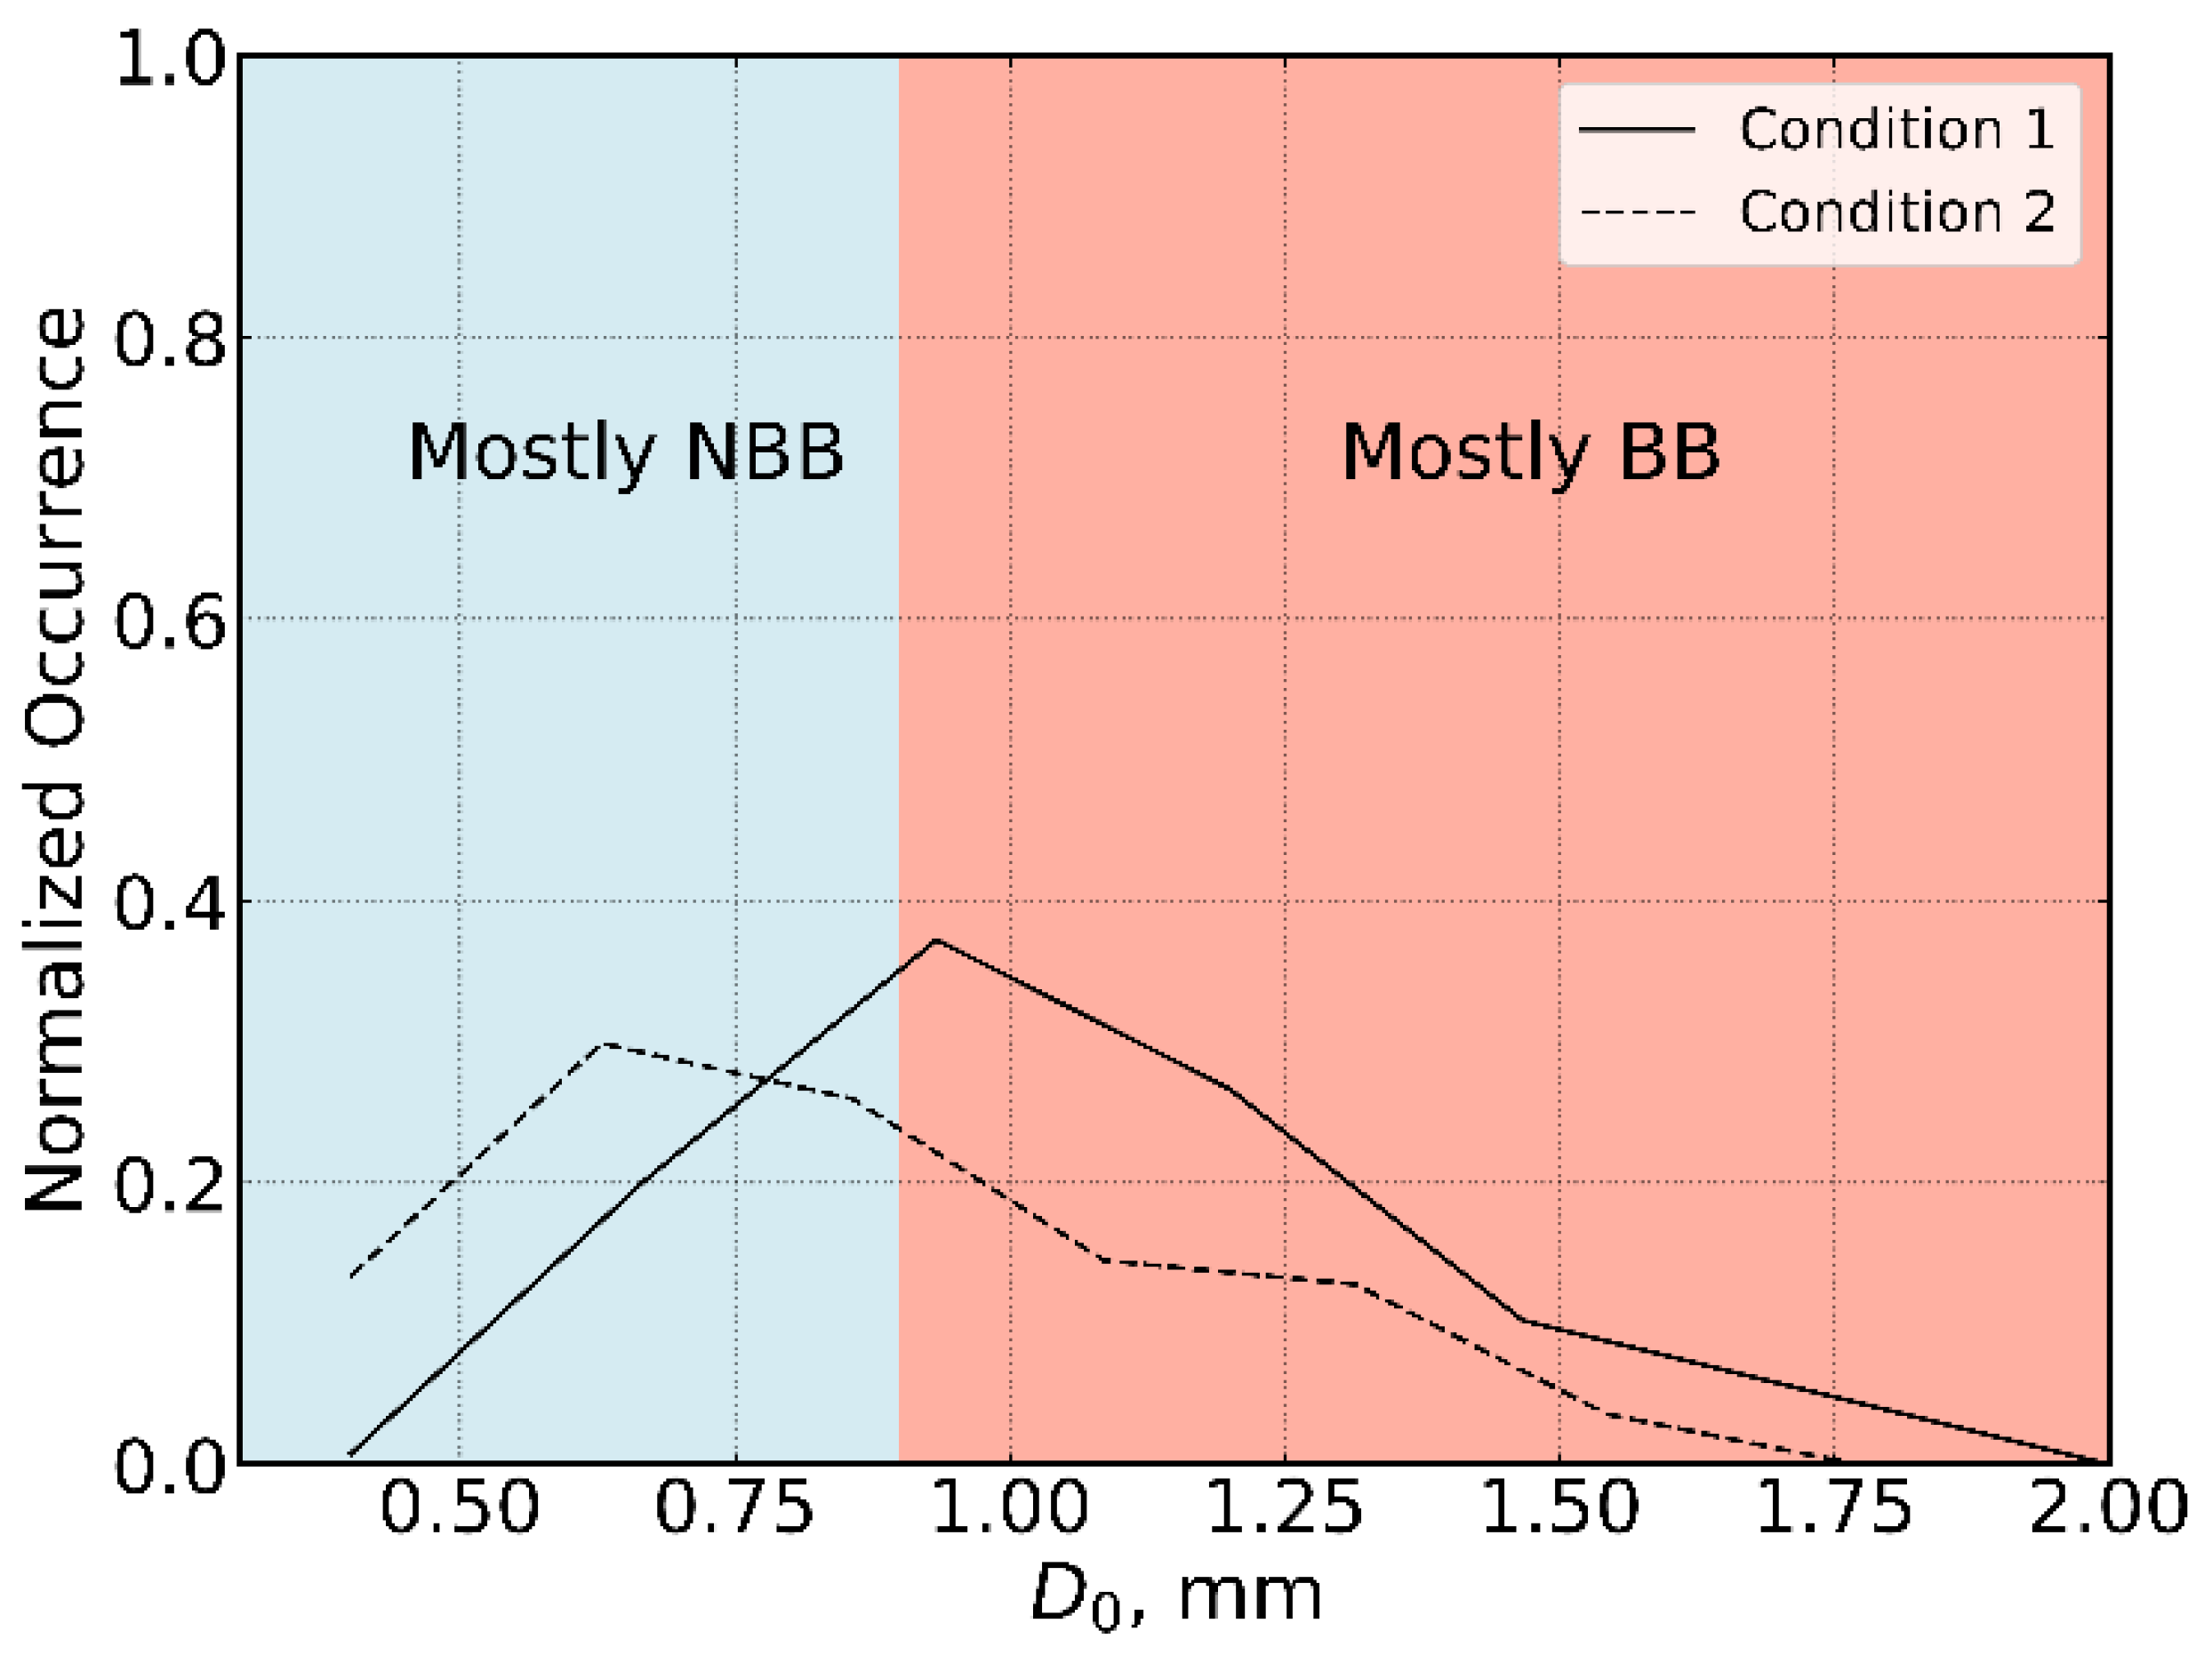
Figure 8.
Normalized distribution of for condition 1 (black solid line) and condition 2 (black dashed line). Note that smaller drop sizes ( < 0.90 mm) are associated with mostly NBB, and larger drop sizes ( > 0.90 mm) are associated with mostly BB rain.
Figure 8.
Normalized distribution of for condition 1 (black solid line) and condition 2 (black dashed line). Note that smaller drop sizes ( < 0.90 mm) are associated with mostly NBB, and larger drop sizes ( > 0.90 mm) are associated with mostly BB rain.
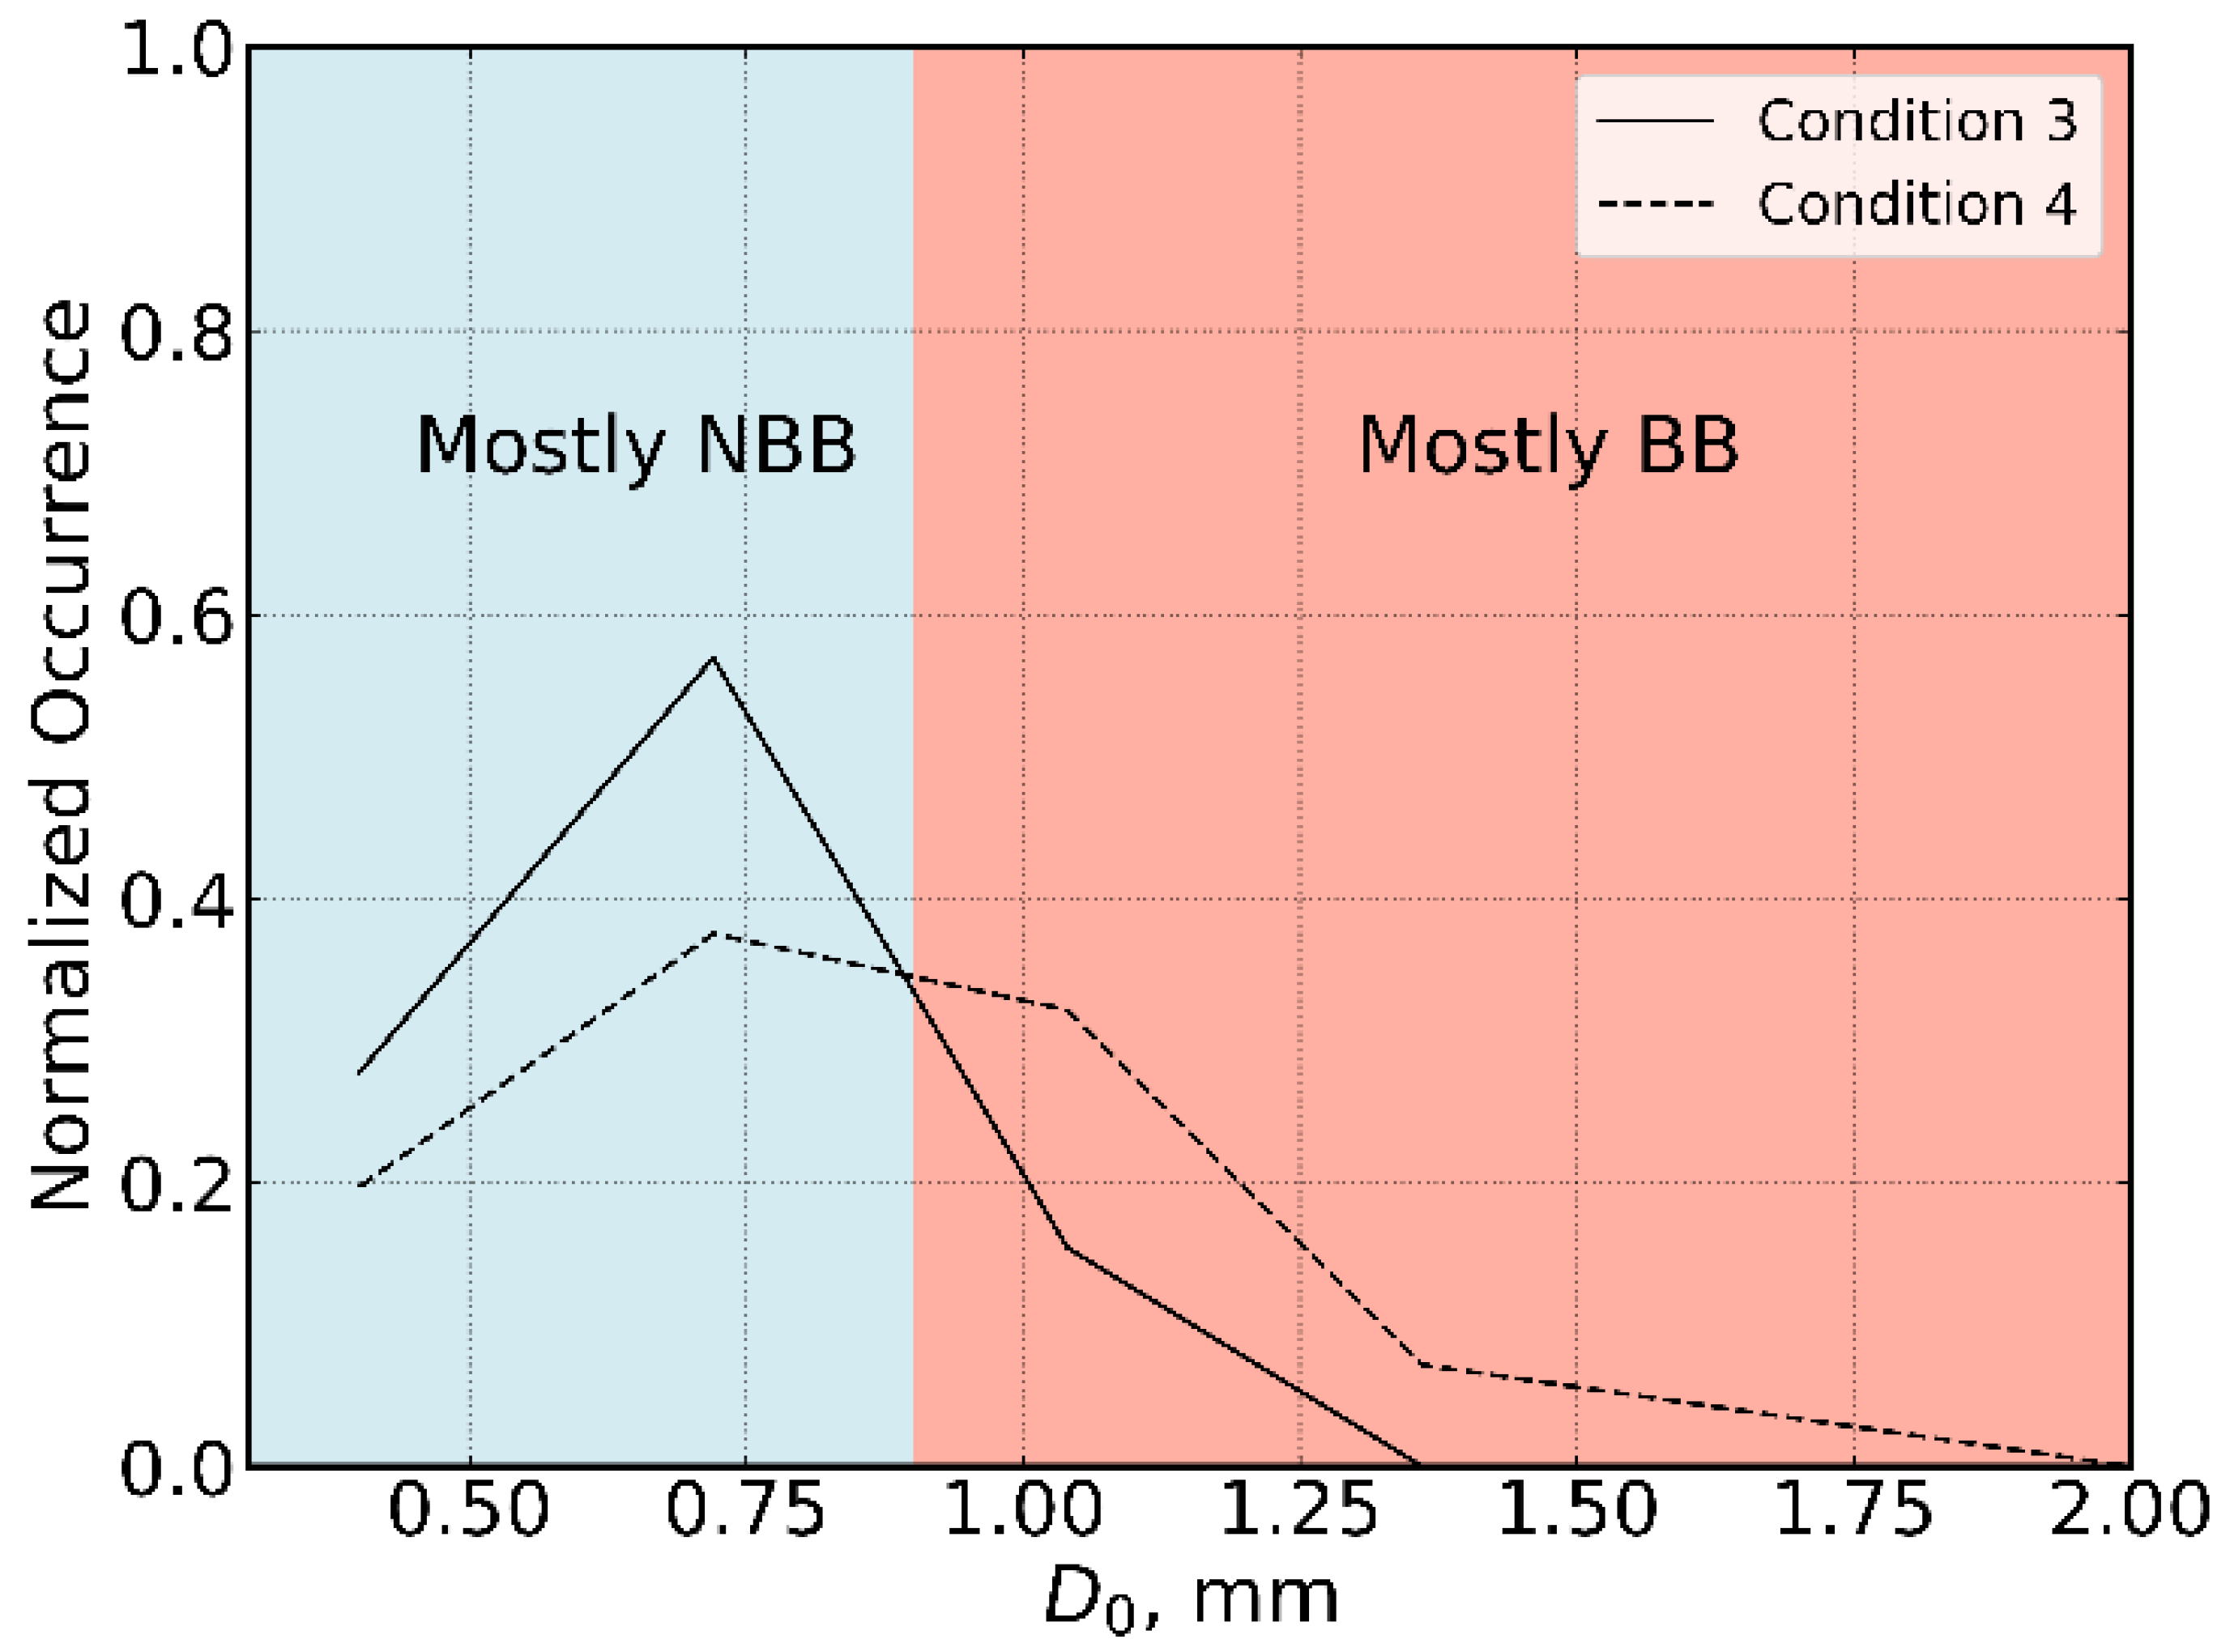
Figure 9.
Normalized distribution of for condition 3 (black solid line) and condition 4 (black dashed line).
Figure 9.
Normalized distribution of for condition 3 (black solid line) and condition 4 (black dashed line).
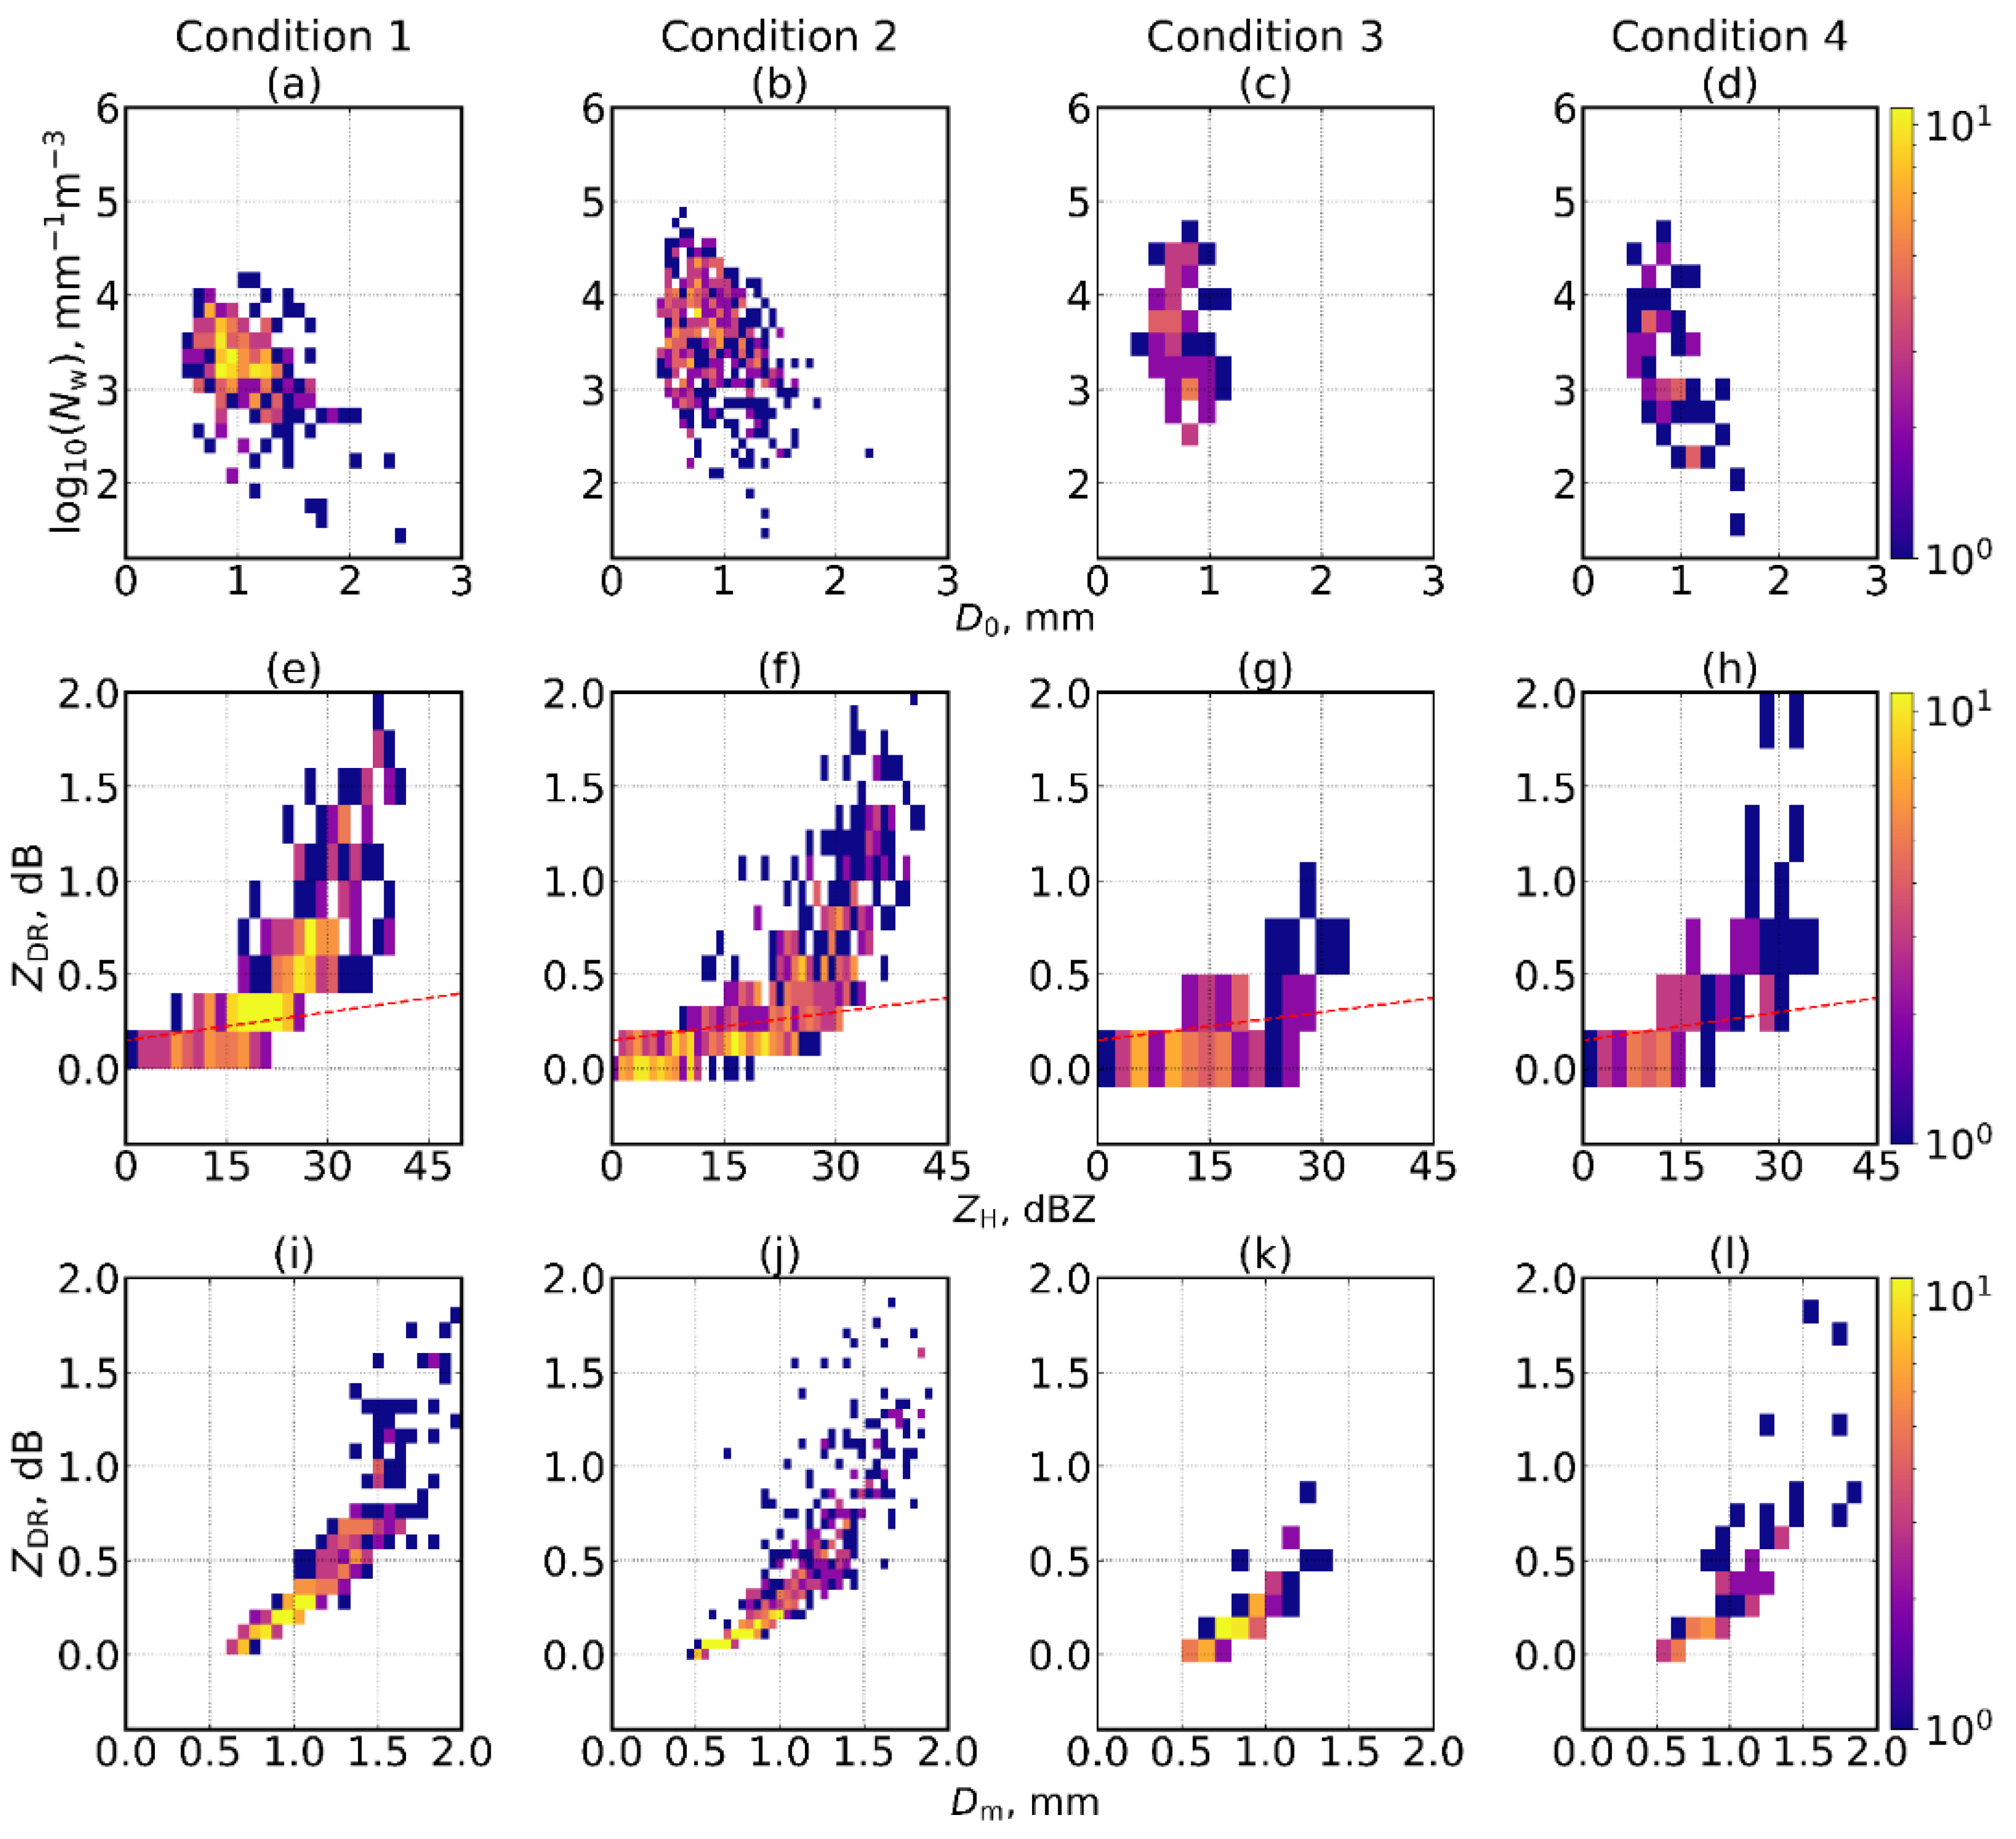
Figure 10.
Two-dimensional histograms indicating the influence of wind direction and magnitude on specific DSD and radar parameters: (a–d) vs. for condition 1 through condition 4; (e–h) for condition 1 through condition 4; (i–l) vs. Z for condition 1 through condition 4.
Figure 10.
Two-dimensional histograms indicating the influence of wind direction and magnitude on specific DSD and radar parameters: (a–d) vs. for condition 1 through condition 4; (e–h) for condition 1 through condition 4; (i–l) vs. Z for condition 1 through condition 4.
Figure 11.
Observed Z–R relationship. Non-tropical convective
(‘standard’ NEXRAD relation); stratiform/orographic
[
3]; cool season
.
Figure 11.
Observed Z–R relationship. Non-tropical convective
(‘standard’ NEXRAD relation); stratiform/orographic
[
3]; cool season
.
Table 1.
Categorization of the magnitude and direction of 850 hPa winds. The first two conditions represent low-level flow out of the southwest at different magnitudes, while the last two conditions represent low-level flow out of the northwest at different magnitudes.
Table 1.
Categorization of the magnitude and direction of 850 hPa winds. The first two conditions represent low-level flow out of the southwest at different magnitudes, while the last two conditions represent low-level flow out of the northwest at different magnitudes.
| Condition | Sustained Winds (Knots) @ 850 hPa | Direction |
|---|
| 1 | 5–20 | Southeast to southwest |
| 2 | 30–65 | Southeast to southwest |
| 3 | 5–15 | Northwest to southwest |
| 4 | 15–30 | Northwest to southwest |
Table 2.
The set of conditions that describe the rain type for the mid-latitudes. S, stratiform; Heavy S, heavy stratiform; C, convection; Shallow C, shallow convection.
Table 2.
The set of conditions that describe the rain type for the mid-latitudes. S, stratiform; Heavy S, heavy stratiform; C, convection; Shallow C, shallow convection.
| Classification | Condition |
|---|
| S | |
| Heavy S | |
| C | |
| Shallow C | |
Table 3.
These statistics reflect the influence of seasons upon the scaling parameters. For winter, fall, and spring, the average (M), minimum (Min), maximum (Max), and standard deviation (SD) are shown.
Table 3.
These statistics reflect the influence of seasons upon the scaling parameters. For winter, fall, and spring, the average (M), minimum (Min), maximum (Max), and standard deviation (SD) are shown.
| Winter | Fall | Spring |
|---|
| | M | Min | Max | SD | | M | Min | Max | SD | | M | Min | Max | SD |
|---|
| 1.06 | 0.44 | 2.51 | 0.36 | | 1.05 | 0.51 | 2.43 | 0.34 | | 1.15 | 0.54 | 2.52 | 0.35 |
| µ | 8.13 | 0.19 | 19.94 | 4.90 | µ | 10.0 | 1.24 | 19.98 | 5.11 | µ | 9.16 | 0.97 | 19.96 | 5.06 |
| 3.51 | 1.31 | 4.66 | 0.56 | | 3.36 | 1.46 | 4.43 | 0.54 | | 3.25 | 1.41 | 4.42 | 0.50 |
Table 4.
Percentage of rainfall type by season. Four main types: stratiform, heavy stratiform, convective, and shallow convective.
Table 4.
Percentage of rainfall type by season. Four main types: stratiform, heavy stratiform, convective, and shallow convective.
| Season | n | S (%) | Heavy S (%) | C (%) | Shallow C (%) |
|---|
| Winter | 785 | 97.20 | 0.39 | 0.66 | 1.78 |
| Fall | 627 | 96.90 | 0.47 | 1.44 | 1.12 |
| Spring | 533 | 97.70 | 0.00 | 0.56 | 1.69 |
Table 5.
Mean (M), minimum (Min), maximum (Max), and standard deviation (SD) for the DSD scaling and radar parameters for southeast-to-southwest and northwest-to-southwest flow.
Table 5.
Mean (M), minimum (Min), maximum (Max), and standard deviation (SD) for the DSD scaling and radar parameters for southeast-to-southwest and northwest-to-southwest flow.
| Southeast-to-Southwest Flow | Northwest-to-Southwest Flow |
|---|
| | M | Min | Max | SD | | M | Min | Max | SD |
|---|
| 3.43 | 1.52 | 4.85 | 0.53 | | 3.42 | 1.64 | 4.61 | 0.62 |
| 0.99 | 0.484 | 2.52 | 0.36 | | 0.93 | 0.52 | 1.84 | 0.27 |
| µ | 9.11 | 0.437 | 19.93 | 4.96 | µ | 9.33 | 1.96 | 19.85 | 4.63 |
Table 6.
Mean (M), minimum (Min), maximum (Max), and standard deviation (SD) for the DSD scaling parameters for southeast-to-southwest and northwest-to-southwest flow.
Table 6.
Mean (M), minimum (Min), maximum (Max), and standard deviation (SD) for the DSD scaling parameters for southeast-to-southwest and northwest-to-southwest flow.
| Southeast-to-Southwest Flow | Northwest-to-Southwest Flow |
|---|
| | M | Min | Max | SD | | M | Min | Max | SD |
|---|
| 0.95 | 0.41 | 2.41 | 0.31 | | 0.81 | 0.44 | 1.64 | 0.23 |
| 3.43 | 1.52 | 4.85 | 0.53 | | 3.42 | 1.64 | 4.61 | 0.62 |
| ZH | 21.28 | 0.59 | 44.17 | 9.77 | ZH | 16.39 | 0.71 | 35.08 | 8.45 |
| ZDR | 0.55 | 0.046 | 3.03 | 0.44 | ZDR | 0.29 | 0.026 | 1.78 | 0.31 |
Table 7.
Percentage of rainfall type based on 850 hPa wind direction. n, number of rainy time steps (5 min); S, stratiform; Heavy S, heavy stratiform; C rain, convective rain; shallow C, shallow convective.
Table 7.
Percentage of rainfall type based on 850 hPa wind direction. n, number of rainy time steps (5 min); S, stratiform; Heavy S, heavy stratiform; C rain, convective rain; shallow C, shallow convective.
| Condition | n | S (%) | Heavy S (%) | C Rain (%) | Shallow C (%) |
|---|
| Southwest | 858 | 97.3 | 0.342 | 0.932 | 1.52 |
| Northwest | 119 | 100 | 0.00 | 0.00 | 0.00 |
Table 8.
Statistics that reflect the influence of condition 1 and condition 2 on the DSD parameters. This table includes mean (M), minimum (Min), maximum (Max), and standard deviation (SD).
Table 8.
Statistics that reflect the influence of condition 1 and condition 2 on the DSD parameters. This table includes mean (M), minimum (Min), maximum (Max), and standard deviation (SD).
| Condition 1 | Condition 2 |
|---|
| | M | Min | Max | SD | | M | Min | Max | SD |
|---|
| 1.07 | 0.56 | 2.41 | 0.31 | | 0.89 | 0.41 | 2.32 | 0.30 |
| 3.22 | 1.41 | 4.15 | 0.43 | | 3.54 | 1.46 | 4.88 | 0.56 |
| 1.23 | 0.64 | 2.52 | 0.35 | | 1.03 | 0.48 | 2.43 | 0.35 |
| µ | 8.58 | 1.04 | 19.80 | 4.69 | µ | 9.48 | 0.44 | 19.93 | 5.12 |
Table 9.
Statistics that reflect the influence of condition 3 and condition 4 on the DSD parameters. This table includes mean (M), minimum (Min), maximum (Max), and standard deviation (SD).
Table 9.
Statistics that reflect the influence of condition 3 and condition 4 on the DSD parameters. This table includes mean (M), minimum (Min), maximum (Max), and standard deviation (SD).
| Condition 3 | Condition 4 |
|---|
| | M | Min | Max | SD | | M | Min | Max | SD |
|---|
| 0.75 | 0.44 | 1.19 | 0.16 | | 0.89 | 0.49 | 1.64 | 0.27 |
| 3.56 | 2.48 | 4.61 | 0.53 | | 3.26 | 1.64 | 4.57 | 0.66 |
| 0.85 | 0.52 | 1.35 | 0.18 | | 1.03 | 0.55 | 1.84 | 0.32 |
| µ | 11.45 | 3.82 | 18.74 | 4.19 | µ | 8.32 | 1.96 | 19.85 | 4.55 |
Table 10.
Statistics that reflect the influence of condition 1 and condition 2 on the radar parameters. This table includes mean (M), minimum (Min), maximum (Max), and standard deviation (SD).
Table 10.
Statistics that reflect the influence of condition 1 and condition 2 on the radar parameters. This table includes mean (M), minimum (Min), maximum (Max), and standard deviation (SD).
| Condition 1 | Condition 2 |
|---|
| | M | Min | Max | SD | | M | Min | Max | SD |
|---|
| ZH | 22.73 | 1.66 | 44.17 | 8.39 | ZH | 20.5 | 0.59 | 42.9 | 10.35 |
| ZDR | 0.54 | 0.046 | 2.59 | 0.43 | ZDR | 0.42 | 0.013 | 3.03 | 0.43 |
Table 11.
Statistics that reflect the influence of condition 3 and condition 4 on the radar parameters. This table includes mean (M), minimum (Min), maximum (Max), and standard deviation (SD).
Table 11.
Statistics that reflect the influence of condition 3 and condition 4 on the radar parameters. This table includes mean (M), minimum (Min), maximum (Max), and standard deviation (SD).
| Condition 3 | Condition 4 |
|---|
| | M | Min | Max | SD | | M | Min | Max | SD |
|---|
| ZH | 15.39 | 0.71 | 32.71 | 7.71 | ZH | 17.51 | 1.37 | 35.08 | 9.08 |
| ZDR | 0.20 | 0.026 | 0.917 | 0.17 | ZDR | 0.40 | 0.029 | 1.78 | 0.39 |
Table 12.
Percentage of rainfall type based on 850 hPa wind direction and magnitude. n, number of rainy time steps (5-min); S, stratiform; Heavy S, heavy stratiform; C rain is convective rain; Shallow C, shallow convective.
Table 12.
Percentage of rainfall type based on 850 hPa wind direction and magnitude. n, number of rainy time steps (5-min); S, stratiform; Heavy S, heavy stratiform; C rain is convective rain; Shallow C, shallow convective.
| Condition | n | S (%) | Heavy S (%) | C Rain (%) | Shallow C (%) |
|---|
| 1 | 333 | 97.3 | 0.00 | 0.901 | 1.801 |
| 2 | 525 | 97.3 | 0.381 | 0.952 | 1.33 |
| 3 | 63 | 100 | 0.00 | 0.00 | 0.00 |
| 4 | 56 | 100 | 0.00 | 0.00 | 0.00 |
