Article

Remote Polar Boundary Layer Wind Profiling Using an All-Fiber Pulsed Coherent Doppler Lidar at Zhongshan Station, Antarctica

1
Institute of Oceanographic Instrumentation, Qilu University of Technology (Shandong Academy of Sciences), Qingdao 266000, China
2
R & D Center for Marine Instruments and Apparatuses, Laoshan Laboratory, Qingdao 266235, China
3
Key Laboratory of Polar Science, Ministry of Natural Resources, Polar Research Institute of China, Shanghai 200136, China
4
College of Environment and Safety Engineering, Qingdao University of Science and Technology, Qingdao 266042, China
*
Author to whom correspondence should be addressed.
Atmosphere 2023, 14(5), 901; https://doi.org/10.3390/atmos14050901
Submission received: 19 April 2023 / Revised: 17 May 2023 / Accepted: 18 May 2023 / Published: 22 May 2023
(This article belongs to the Section Atmospheric Techniques, Instruments, and Modeling)

Abstract

:
A compact all-fiber pulsed coherent Doppler lidar (PCDL) for boundary layer wind measurement was developed by the Institute of Oceanographic Instrumentation, Qilu University of Technology (Shandong Academy of Sciences). It has been deployed at Zhongshan Station (69.4° S, 76.4° E) during the 2020 austral summer season by the 36th Chinese National Antarctic Research Expedition (CHINARE) and started routine observation in January 2020. This system, based on the 1550 nm all-fiber components, employs a 100 mm telescope with a long focal length of 632.6 mm to emit and collect laser pulses. It provides the ability to measure vertically resolved wind fields with a spatial resolution of 30 m and a temporal resolution of 1 min; the maximum detection range is up to 1.5 km in Antarctica. Wind speed and direction inversion methods were introduced subsequently. Preliminary measurement results of wind profiles indicate that this Doppler lidar can be operated successfully in Antarctica. The synchronous observations between the lidar, anemometer, and radiosondes at Zhongshan station are presented and have good consistency with each other. The comparison results between the lidar and anemometer indicate a root mean square deviation (RMSD) of 0.98 m s−1 and 10.55° for wind speed and direction, respectively. The lidar continuous observations of wind profiles provide an opportunity to study the spatiotemporal variation of Antarctic wind with high resolutions, which is useful for further understanding of the atmosphere in Antarctic regions.

1. Introduction

The atmospheric boundary layer (ABL) in the polar regions plays a significant role related to atmosphere–ocean–ice processes, atmospheric transport, and regional weather forecasts; it profoundly impacts global climate changes [1]. The vertical structure of wind vectors is one of the primary elements to describe the state of ABL. It is of high confidence that the wind field (speed and direction) is closely related to sea ice trends [2] and surface–atmosphere energy exchange [3]. The initial conditions for numerical weather forecasts can be improved by measuring wind profiles in data-sparse areas, particularly in polar regions [4]. The radiosondes are the contemporary and main means of profiling wind speed and direction in the polar regions, which have been used for the past 50 years at several research stations [5]. The pulsed coherent Doppler lidar (light detection and ranging), PCDL, is a kind of effective optical remote sensing instrument with the ability of profiling continuous wind with high spatial and temporal resolution in a clear atmosphere [6]. One key advantage of the PCDL observations, in contrast to traditional radiosondes, is the real-time wind measurements. Additionally, vertically resolved wind profiles obtained via lidar provide effective datasets for ABL studies.
The distinctive meteorological conditions of the Antarctic regions present considerable challenges to lidar installations and maintenance [7]. Despite these challenges, the first lidar in Antarctica was successfully installed in 1974 at the Amundsen–Scott South Pole station for the purpose of aerosol and cloud sensing [8]. Since 2000, a micro-pulse lidar (MPL) has been operated routinely as part of the micro-pulse lidar network (MPLNET) at the same station. Observations from the MPL at the South Pole indicate that clouds are present approximately 40% of the time on a multi-year timescale [9]. Furthermore, a more sophisticated Boltzmann temperature lidar system emitting two lasers at 374 nm and 372 nm simultaneously was deployed at the South Pole to observe the polar mesospheric atmosphere during the same time [10], and significant scientific findings have been achieved through these measurements [11].
The PCDL has been widely utilized to investigate wind fields in various campaigns around the world [12]; however, to our knowledge, there have been few attempts to perform PCDL for wind profiles in polar regions, especially in Antarctica. In October–November 2014 and May 2015, NASA conducted two airborne field campaigns, collectively called PolarWinds, to fly an airborne Doppler wind lidar named DAWN (Doppler Aerosol WiNd) to observe Arctic winds [13]. In 2014, a three-month measurement campaign was conducted using a Doppler lidar during the Arctic Cloud Summer Experiment on the icebreaker Oden in the summer and autumn of 2014. An active motion-stabilization platform was deployed to remove the effects of ship motion [14]. Conversely, a non-motion stabilized Doppler lidar was operated on board RV Polarstern in the Arctic and Antarctic (December 2015–January 2016). It is the first time that such a system was operated on an icebreaker in the Antarctic [15]. Considering the deficient aerosol levels in Antarctica, with median aerosol optical depths (500 nm) ranging from 0.06 on the coast to 0.015 on the plateau [16], the deployment of the PCDL for long-term continuous polar wind profiling is challenging but crucial to extend essential information about vertical structures of the Antarctic wind fields.
A compact all-fiber pulsed coherent Doppler lidar (PCDL) for polar boundary layer wind field measurement was developed and deployed at Zhongshan Station (69.37° S, 76.37° E) in Antarctica by the Institute of Oceanographic Instrumentation, Qilu University of Technology (Shandong Academy of Sciences) [17]. This PCDL is capable of generating continuous wind profiles in real time with high spatial and temporal resolution and has been operated steadily since January 2020. The resulting datasets will provide a valuable opportunity to better understand the evolution of the atmospheric boundary layer in Antarctic regions. In this paper, the details of this observation campaign, operation principle, and system specifications of the lidar are introduced firstly in Section 2. Section 3 presents the retrieval methods of wind speed and direction, and the adoption of the Doppler beam swinging (DBS) of four beams technique to determine the vector wind. Then, the first-year observation datasets measured via the PCLD are utilized to present the preliminary performance of the PCDL at Zhongshan in Section 4, including the intercomparison results between the lidar, anemometer, and radiosondes. Two cases of continuous observations are depicted as well. A conclusion is presented in Section 5.

2. Observation Campaign and Instrument

2.1. Observation Campaign at Zhongshan Station

The PCDL developed for long-term operation in the polar region was designed and manufactured successfully in a domestic laboratory by the Institute of Oceanographic Instrumentation, Shandong Academy of Sciences. It was then disassembled for easy long-distance sea transportation and shipped by the Chinese polar RV Xuelong supported by the Polar Research Institute of China in October 2019. The PCDL arrived at Zhongshan Station (69.37° S, 76.37° E) approximately one month later. Zhongshan Station, established on February 26, 1989, is the largest Chinese research station in Antarctica. It is located on the southeast coast of Pritzker Bay in the Lasman Hills of East Antarctica (Figure 1a). The station experiences a frigid climate characterized by low temperatures (with an annual average temperature of −19 °C), low humidity (with an annual mean humidity of 54%), and strong easterly winds. The polar night occurs from May to July, while the polar day lasts from November to February of the following year at Zhongshan Station [18].
Between 2018 and 2019, a group of customized containers (Figure 1b) were constructed in the southeastern region (35 m above the sea level) of Zhongshan Station, specifically in a flatter area between two hills. These containers were designed with optical windows and air conditioning systems to provide a suitable environment for stable lidar operation. On 31 December, the PCDL was reconstructed and installed inside a container, with the lidar positioned as closely as possible to the container’s internal roof using an electric lifting platform. The air conditioners were used to maintain the temperature in the container at approximately 20 ± 5 °C. Additionally, the lidar system was enclosed in an aluminum enclosure equipped with fans to ensure proper ventilation. The lidar operates by emitting and receiving laser beams through an optical window installed at the container’s top, which measures 300 mm in diameter and 30 mm in thickness. The window surface is coated with an anti-reflection coating, which has an average reflectance of less than 0.5% within the 1050–1700 nm wavelength range, to minimize signal loss. A metal cover is utilized to shield the optical window from extreme weather conditions outside, ensuring optimal performance of the lidar system. The first year-long observation campaign began in January 2020. At this station, four distinct types of lidar have been deployed, including sodium resonance fluorescence Doppler lidar [19], Rayleigh lidar [20], pure rotational Raman lidar [21], and coherent Doppler lidar. These are various types of lidar form a laser remote sensing system named POLAS (Polar Atmosphere Lidar Observation System) in the Antarctic, which can detect atmospheric conditions from the ground up to an altitude of 110 km.

2.2. Lidar System Setup

The PCDL utilizes the heterodyne technique and an all-fiber architecture with fiber communication components, making it ideally suitable for long-term wind observation without maintenance in the polar region. The system offers reliable operation under vibration and temperature variations. It emits laser beams and detects the Doppler shift in the frequency of each echo signal backscattered from aerosols suspending in the atmosphere; then, the line-of-sight (LOS) velocity component of wind speed can be retrieved based on the Doppler effect. The PCDL is composed of three units: a transmitter unit, an optical antenna, and a signal acquisition and processing unit. The laser pulses are transmitted along polarization-maintaining (PM) fibers among different components, which makes the whole system reliable and easy to maintain. The system’s structure is shown in Figure 2, and its configurations are listed in Table 1.
The laser transmitter unit is based on the master oscillator power amplifier (MOPA) architecture; it mainly consists of a seed laser module, an acoustic optical modulator (AOM), an erbium-doped fiber amplifier (EDFA), and a fiber circulator. The seed laser module emits a single-mode continuous-wave laser at 1550 nm with a narrow linewidth of 15 kHz, which is then divided into two beams. One beam is transmitted through PM fibers into a 2 × 2 fiber coupler directly as the local oscillator (LO) reference. The other part is frequency-shifted and pulsed via a radio-frequency-driven AOM to provide a pulsed laser at a width of 200 ns and an intermediate frequency of 120 MHz, which corresponds to a spatial resolution of 30 m and a maximum speed measurement range of ±90 m s−1. The modulated laser then goes through an EDFA to amplify the pulse energy up to 150 μJ at a pulse repetition frequency of 10 kHz.
A fiber circulator serves as the link between the transmitter unit and the optical antenna via ports 1 and 2. The optical antenna used in this study features a large aperture diameter of 100 mm and a long focal length of 632.6 nm, which allows for the collimation and expansion of the pulsed laser prior to its transmission into the atmosphere. The same optical antenna is also responsible for collecting backscattered light from aerosols in the air, which is then directed back to the transmitter unit via ports 2 and 3 of the fiber circulator. To alter the emission direction of the laser beam and scan different azimuth angles at an elevation angle of 70°, a rotating wedge prism driven by a servo motor is employed. The servo motor is also directly connected to an additional 12-bit resolution absolute encoder on the axis for precise azimuth angle determination. This setup reduces the number of moving parts and optical lenses in the scanning mechanism and allows the whole scanning parts to operate rotationally inside the container, thus lowering maintenance requirements.
The PCDL utilizes a field programmable gate array (FPGA)-based signal acquisition and processing card to perform real-time analysis, including analog-to-digital (A/D) conversion, fast Fourier transform (FFT) calculations for power spectrum estimates, signal pre-processing, and peak detection. An InGaAs heterodyne balanced detector (PDB435C, Thorlabs, US) is employed to receive mixing light from backscattered light and LO light via a 2 × 2 (50:50) single-mode polarization-maintaining fiber coupler. Subsequently, the light signals are transformed into voltage signals and digitized at a sampling rate of 1 GHz with a 14-bit resolution. The digitized signal, with a total length of 30 μs, is divided into 150 bins for power spectrum calculations through FFT. The sample time of each bin is 0.2 μs and corresponds to a 30 m range resolution. Finally, the computer synthesizes the vector wind field, and the real-time image of the wind profile is displayed on the monitor.

2.3. Other Wind Sensors at Zhongshan Station

A meteorological station operates regularly at Zhongshan Station, providing comprehensive data on meteorological parameters. Various sensors automatically observe the basic meteorological parameters in accordance with the ground meteorological monitoring standards of the China Meteorological Administration. The meteorological station is located approximately 150 m from the observation site of PCDL and is 15 m above sea level. The station utilizes an XFY3-1 anemometer for conventional wind measurement. This type of anemometer has the characteristics of strong wind resistance, a wide wind measuring range, and stable and reliable operational performance. The anemometer has a wind speed measuring range of 1 to 95 m s−1. When the speed range is between 0 and 10 m s−1, the wind speed uncertainty is less than 0.5 m s−1, while for the speed range between 10 and 95 m s−1, the wind speed uncertainty is less than 5% × measured value. The wind direction uncertainty is 5°.
For the purpose of calibrating lidar data, Vaisala radiosondes of the RS41-SG type were launched once a month to gather additional vertical meteorological parameters. The data were measured at a frequency of 1 Hz, with an average ascent speed of 5 m s−1, RS41-SG send observed data to an MW41 ground receiver unit every 1 s, resulting in a vertical resolution of approximately 5 m. The horizontal wind speed and direction were independently calculated using variations in the GPS satellite carrier frequency [22]. Table 2 shows the main specifications of the two in situ wind sensors.

3. Methodology

The pulsed coherent Doppler lidar emits laser beams in the frequency f 0 and detects the frequency shift Δ f of each echo signal in the frequency f backscattered from moving aerosols in the target volume of atmosphere. Then, the component of the wind speed along the transmission direction of the laser beam V l o s (LOS velocity) can be calculated due to its amount being directly proportional to the Doppler shift. This can be written as the following equation, where c is the speed of light.
Δ f = f f 0 = 2 f 0 V l o s / c
To reconstruct a wind vector from LOS velocity measured using PCDL, at least three independent different direction components at the same location are necessary. The PCDL at Zhongshan station employs the Doppler beam swinging (DBS) technique to retrieve wind vectors [23]. Assuming the wind in the probe volume is horizontally homogeneous, the lidar uses a compact scanning mechanism by rotating a wedge prism to project the laser beam into four different azimuth angles (0°, 90°, 180°, 270°) sequentially at a fixed elevation angle θ = 30 ° . Given that the total aerosol load in Antarctica is very low, each LOS velocity is measured by averaging 100,000 pulses at a frequency of 10 kHz over a period of 10 s. Additionally, it takes the rotating wedge prism approximately 5 s to shift between two successive beam points. Therefore, all of the individual measurements required to reconstruct a single wind profile thus occur within a time span of about 1 min. These LOS velocity components can be marked as VlosN, VlosE, VlosS, and VlosW, respectively.
As illustrated in Figure 3, the corresponding meridional component u, zonal component v, and vertical component w of the wind vector can be expressed as:
u = V l o s N V l o s S 2 cos θ
v = V l o s E V l o s W 2 cos θ
w = V l o s E + V l o s S + V l o s W + V l o s N 4 sin θ
where VlosN, VlosE, VlosS, and VlosW represent the LOS velocity measured by the PCDL in the respective directions of north, east, south, and west. The variable θ refers to the elevation angle at which these measurements are taken. When just calculating the horizontal wind, the vertical component w will be nullified.
V h = u + v
Therefore, the horizontal wind speed V h and wind direction (azimuth angle) α can be calculated using the following equation.
V h = u 2 + v 2
α = | tan 1 v u |
Figure 4 displays examples of the polar boundary layer wind profiles obtained via PCDL at Zhongshan Station. Figure 4b shows that the horizontal wind speed increases significantly with height. A maximum wind speed of 43 m s−1 was recorded via lidar at the height of approximately 1.4 km.

4. Results and Discussion

4.1. Vertical Comparison of PCDL with Radiosonde

Four cases of coincident PCDL and radiosonde measurements at Zhongshan station were compared and these are shown in Figure 5. With the limitation of resources and extreme weather conditions in the Antarctica winter, radiosondes exhibit sparse launch times, which occur evenly once a month for atmospheric sounding. Nevertheless, these radiosondes support valuable vertical-resolved data to validate the performance of the lidar. The 10 min averaged lidar profiles obtained after the launch of radiosondes were calculated for intercomparison. Due to the deficient aerosol levels in Antarctica and their distribution within the ABL, the detection range of the lidar evolves with time. Therefore, an empirical threshold of signal-to-noise ratio (SNR) was used to determine the effective detection range of lidar profiles. The intercomparison height of the two instruments was limited from 30 (first data of lidar profiles) to 1500 m in Figure 5a,b and from 30 to 1000 m in Figure 5c and 5d, respectively. The increasing horizontal distance between the lidar and the radiosonde, caused by the drift of the radiosonde, is also depicted in Figure 5 with a blue dotted line.
The bias, root mean square deviation (RMSD), and correlation (R) were calculated simultaneously to further statistically evaluate the differences in horizontal wind speed and direction measured using the PCDL and radiosonde, respectively. Considering that the radiosonde’s horizontal drifting is limited to less than 2.5 km under the maximum comparison height of approximately 1.5 km, and that the selective launch windows are mainly during mild wind conditions for safe operation outside, the coinciding vertical comparisons between the PCDL and radiosonde show good agreement in these four cases.
As an example of vertically resolved comparisons, wind profiles captured at 14:24 on 14 May 2020 using the radiosonde and lidar are depicted in Figure 5b. The two profiles show good agreement at each height, with wind speeds increasing from 5 m s−1 to approximately 20 m s−1, and wind direction changing from east near the ground to northeast simultaneously. The specific values for bias, RMSD, and correlation are 0.72 m s−1, 1.26 m s−1, and 0.94 for wind speed, and 0.94°, 6.57°, and 0.98 for wind direction, respectively.

4.2. Long-Term Comparison of PCDL with Anemometer

To evaluate the enduring performance and dependability of the PCDL at Zhongshan station, we utilized continuous wind data collected using an anemometer and averaged at 1 min intervals for additional comparative validation with the first point of the lidar profiles. The anemometer is installed at an altitude of 15 m above sea level, whereas the lidar observation site is located at an altitude of 35 m. The two instruments are separated by a spatial displacement of 150 m horizontally and 20 m vertically. Additionally, considering the vertical resolution of wind profiles, the two measurements obtained from the lidar and the anemometer have a practical vertical displacement of 50 m. Figure 6 presents the correlation and statistical results of wind speed and direction. The figure displays the linear fits for the wind observations between the two instruments and includes the 1:1 line (indicated by a dotted line). The y-axis of the figure represents the 1 min averaged wind speed and direction, which is measured using the anemometer. Meanwhile, the x-axis indicates the measurement taken from the PCDL. Each data point on the plot represents the values of two measurements taken from the lidar and anemometer.
Table 3 presents a summary of the comparison cases and statistics for the anemometer comparisons during the first year following the deployment of the PCDL. The number of comparison data is denoted by N. As shown in the table below, the detection performance of the PCDL was assessed using statistical values of RMSD, bias, and R. It was observed that the maximum value of RMSD was 1.25 m s−1 for wind speed during the period from 11 July to 12 July, and 13.61° for wind direction in the case of 23 June to 24 June, respectively. Furthermore, the mean statistical values were computed for the eight comparison cases. The average RMSD, bias, and R values for wind speed were calculated as 0.98 m s−1, 0.64 m s−1, and 0.95, respectively. Correspondingly, the mean values for wind direction were 10.55°, −10.13°, and 0.92, respectively.
Considering the practical vertical displacement of 50 m between the two measurements and assuming the general trend of increased wind speed with height, this could lead to a slight positive bias in the comparison results. Another possible reason for this bias is the location of the lidar containers adjacent to two hills, which could act as a barrier, forcing the wind to rush through the pass as if through a tunnel between them, potentially causing it to blow faster and affecting both the wind speed and direction during measurements. Overall, these validation results further indicate that the PCDL is capable of generating dependable wind profiles in Antarctica with high accuracy.

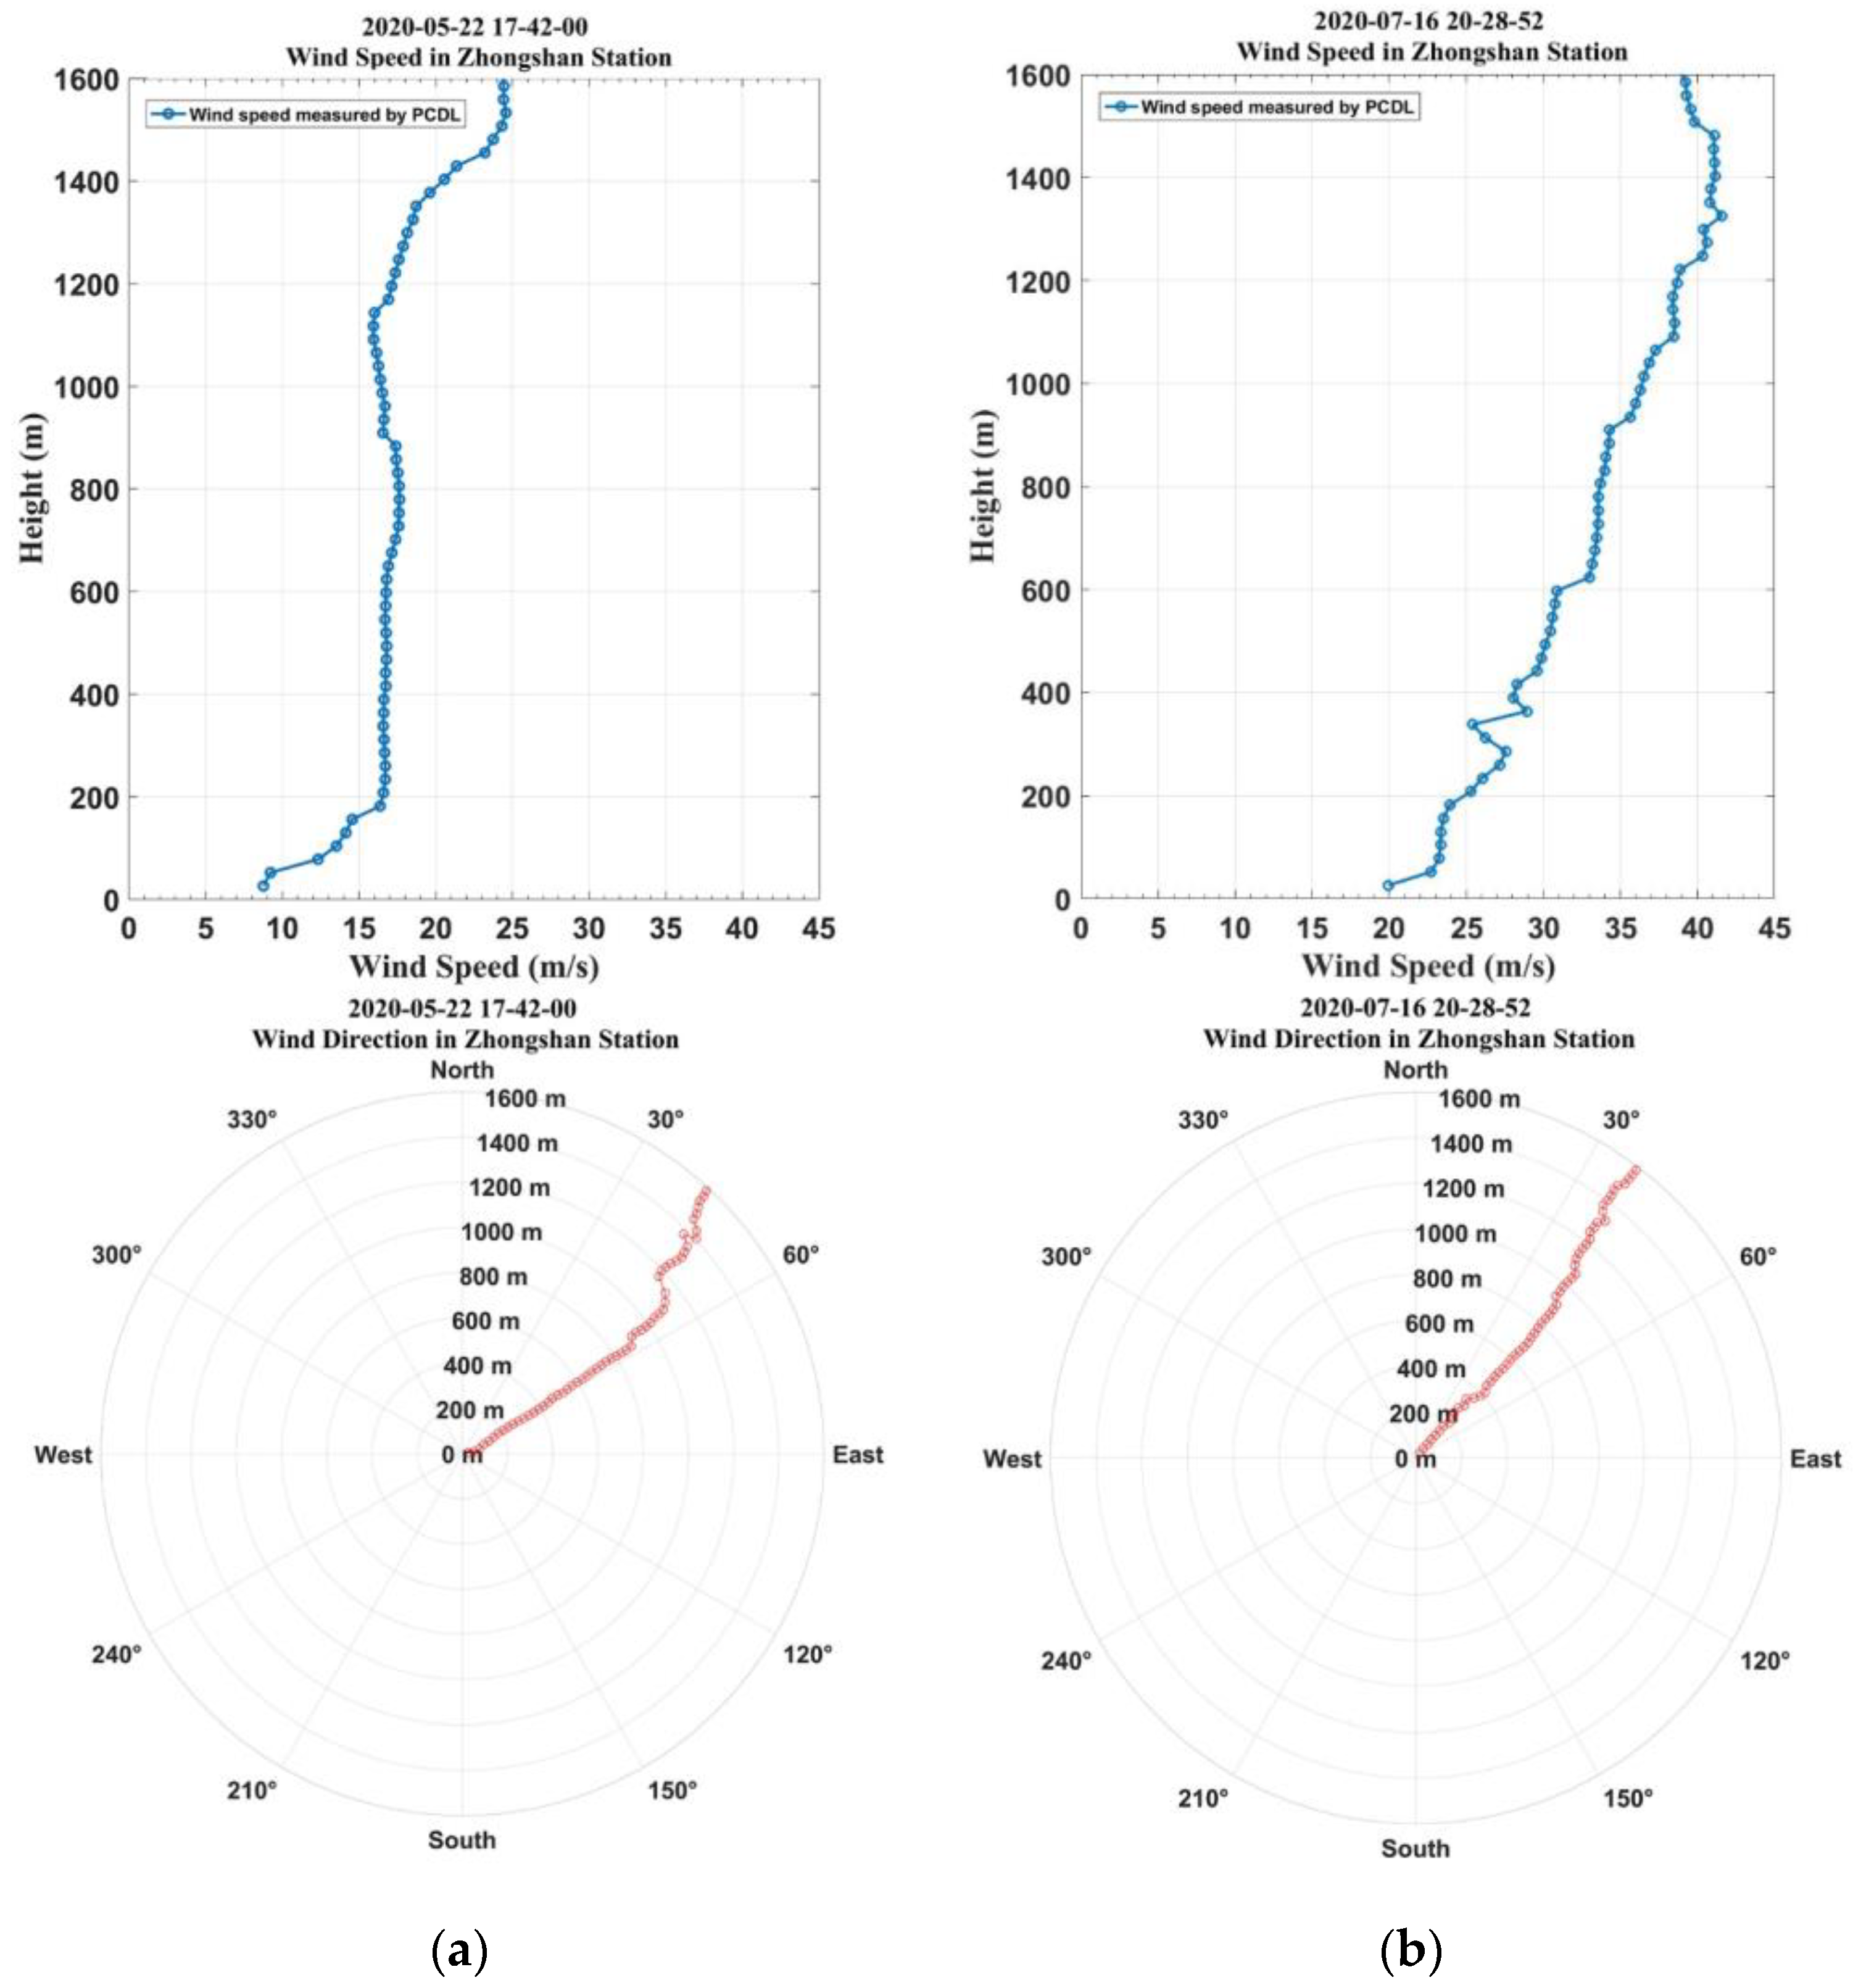
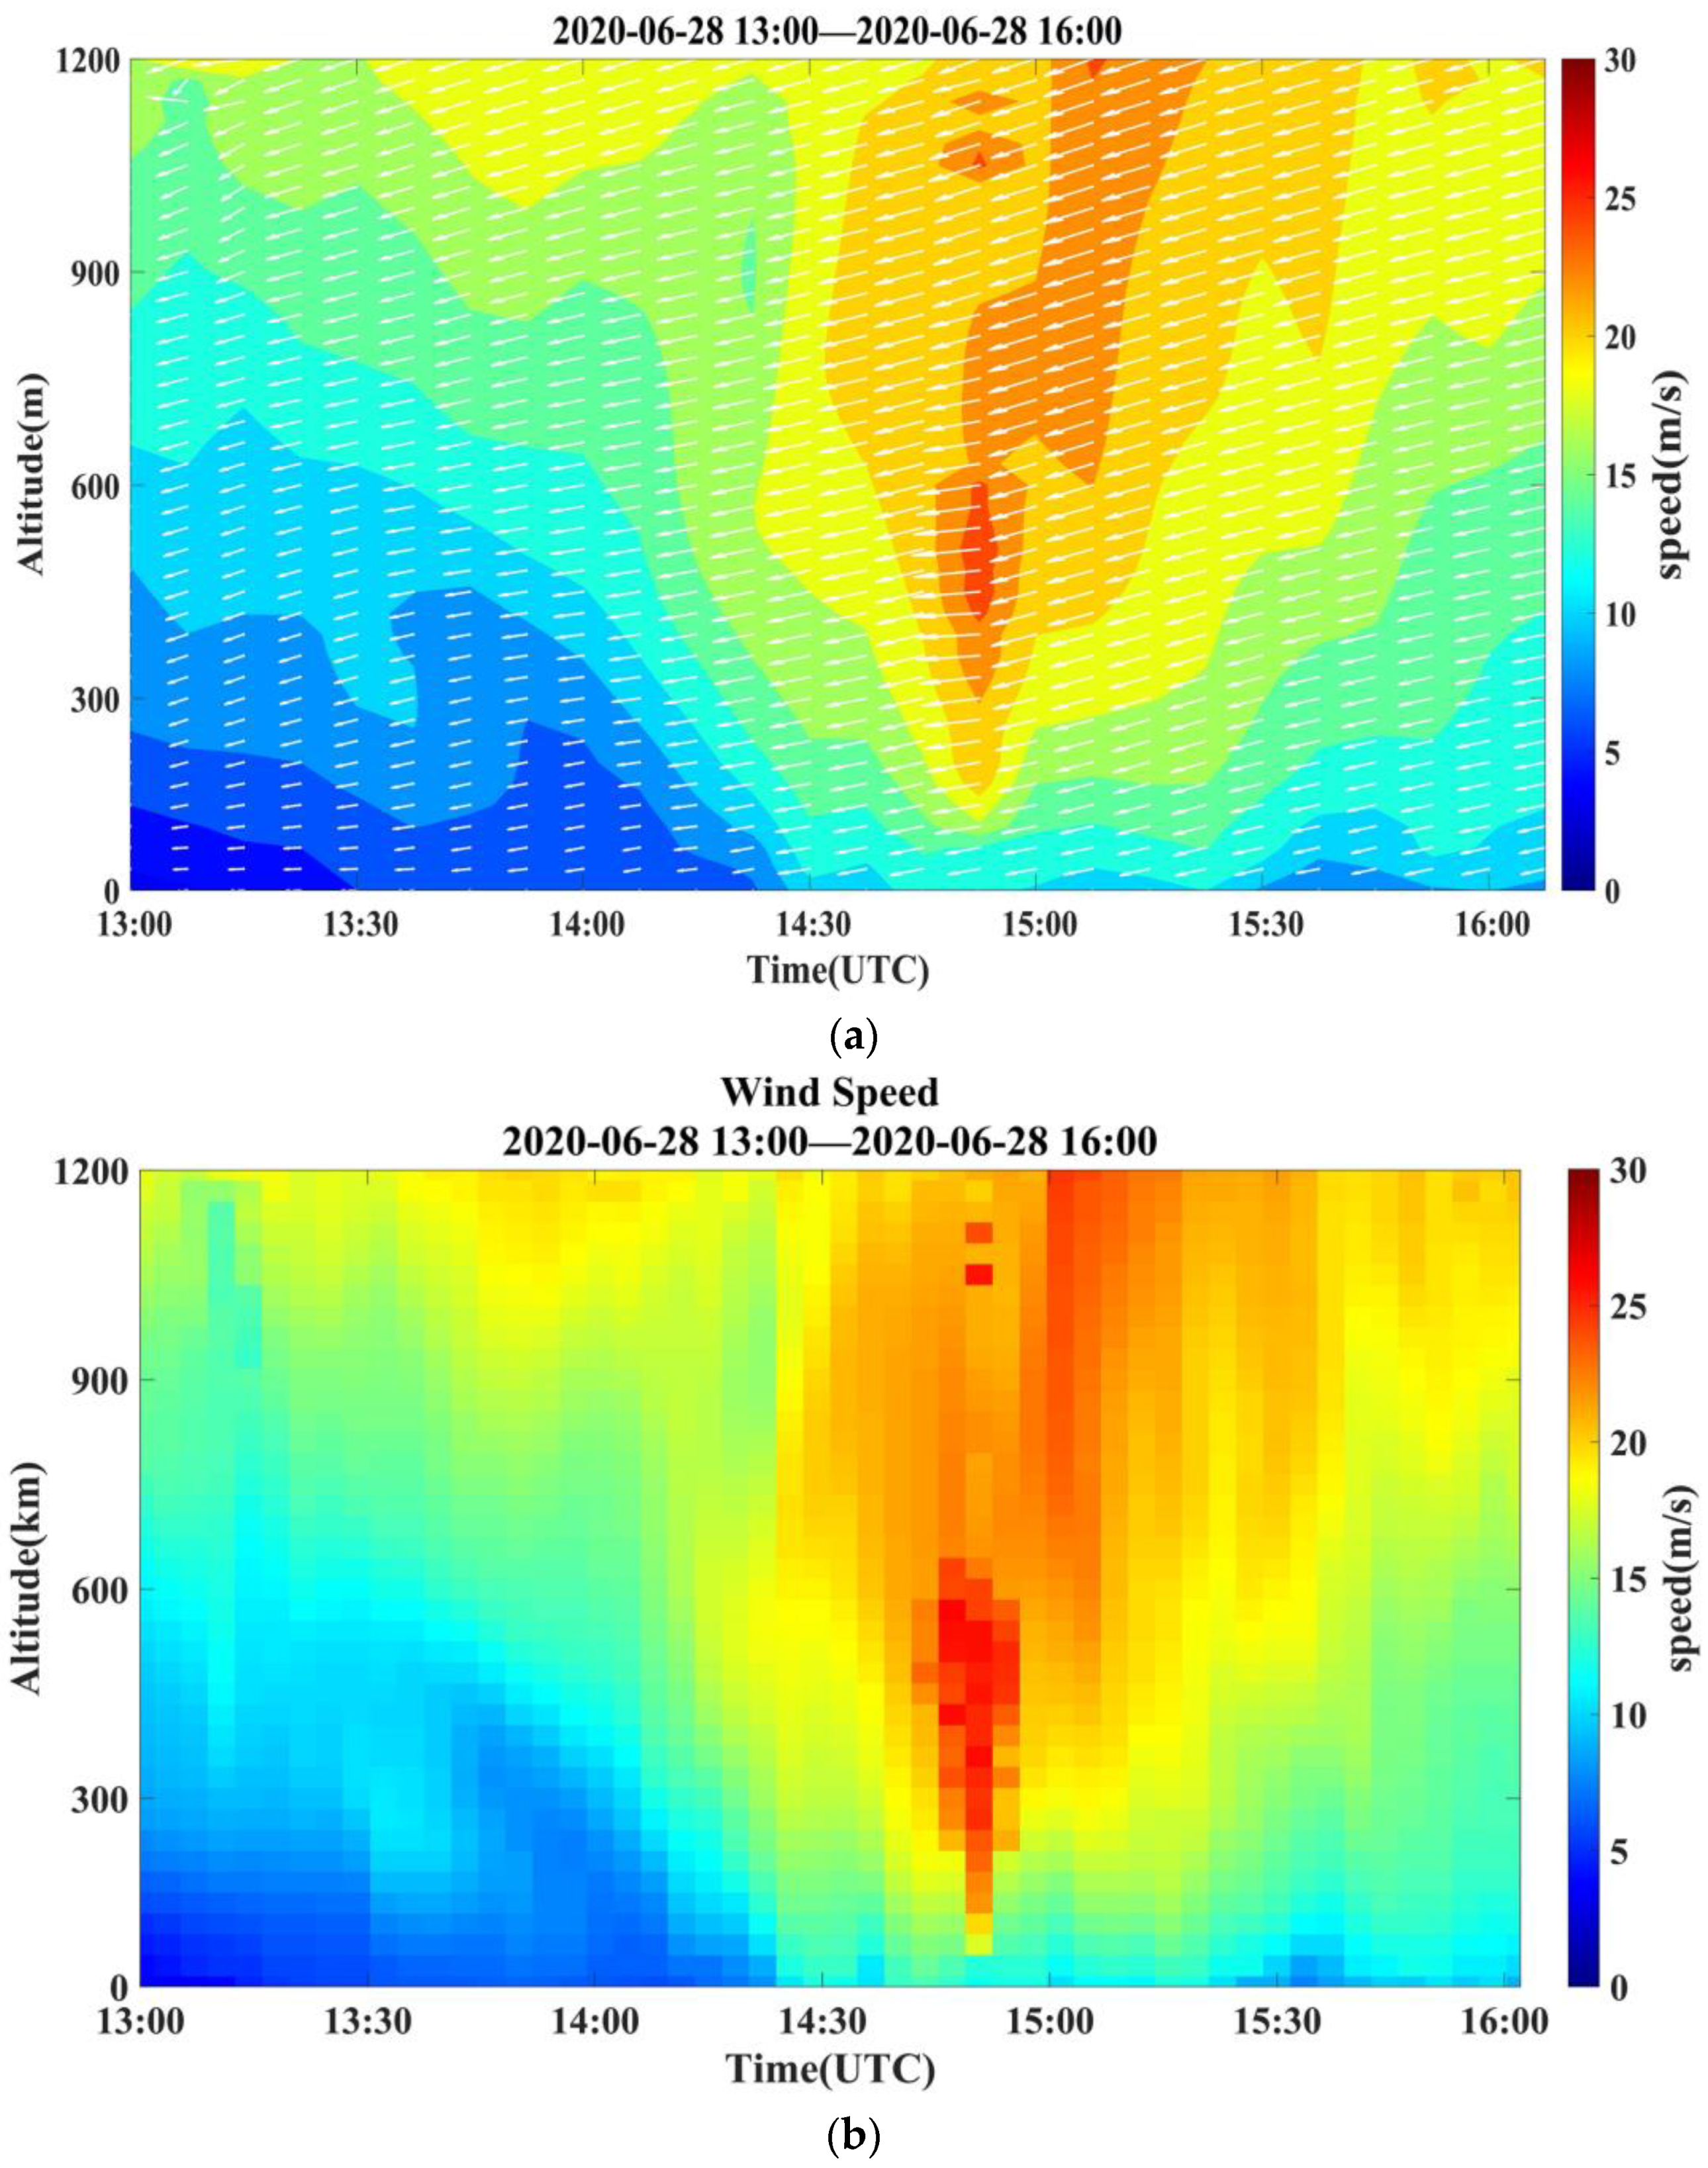
4.3. Sample of Continuous Wind Profile Measurements at Zhongshan Station

Two distinct cases of continuous wind profile observations, including horizontal wind speed and direction, are depicted in Figure 7 and Figure 8. Figure 7a illustrates the time serials of wind vectors obtained using the PCDL from 00:00 to 02:30 on 18 September 2020. It uses arrows to indicate the wind vectors; the length of the arrow denotes the wind’s intensity and the direction of the arrow denotes the wind’s direction. Additionally, a color bar is used to represent wind speed; the faster the wind, the redder the hue. The temporal variation of horizontal speed and direction can be displayed vividly in one image. As seen from Figure 7b, the wind speed decreases gradually with altitude, and the near-surface wind speed is higher during this period with a maximum speed of over 15 m s−1. Whereas the wind speed decreases to less than 7 m s−1 within the range of 600 to 1200 m. According to the range of wind speed, three layers can be discerned from the figure and the mean wind speeds in these layers are 14.3 m s−1, 7.6 m s−1, and 4.1 m s−1, respectively. The magnitude of value changes more dramatically in the upper layer (above 600 m). Wind speeds reached a maximum of approximately 6.7 m s−1 at a height of 1000 m at 01:00 UTC and gradually decreased to a minimum of 1.5 m s−1 at a height of 1100 m by 02:30 UTC.
From Figure 7c, there are mainly two wind directions in the observation period: the predominant direction of the wind is east below 300 m, and it turned to the northeast with the altitude increasing up. the wind direction below 300 m is relatively steady compared with the upper atmosphere in the observation period.
The temporal variation of vertically resolved wind speed and direction from 13:00 to 16:00 on 28 June 2020 is illustrated in Figure 8. Wind shear was observed in the polar atmospheric boundary layer at a minute scale during this period. As seen from Figure 8b, wind speed exhibits an increasing trend with height, in contrast to the vertical change in Figure 7. The period between 14:30 to 15:00 is noteworthy, as it depicts a sudden increase in wind speed, followed by a gradual decrease. The maximum wind speed recorded at 500 m altitude exceeds 25 m s−1. In terms of wind direction, the northeast is the prevailing direction throughout the entire period, exhibiting relative stability despite the dramatic fluctuations in wind speed.
Zhongshan Station is situated in the region between the southern portion of the circumpolar low-pressure belt and the northern surface cold high of the Antarctic continent, where easterly airflow dominates throughout the year. During the austral summer months (December–February), the Antarctic continental cold high-pressure system weakens, along with the circumpolar low-pressure zone, leading to a smaller pressure gradient and subsequently lower wind speeds. In contrast, during the austral winter months (June–August), the Antarctic continental high-pressure system strengthens, and the circumpolar low-pressure zone shifts southward, resulting in a larger pressure gradient and higher wind speeds [24]. The annual maximum wind direction is from northeast to southeast, with the highest frequency of easterly winds. Two measurement cases show that the wind direction is predominantly from the east and northeast with minimal variation observed over the entire observation period. The continuous measurement samples demonstrate that this PCDL has a distinct advantage in providing continuous wind profiling with high spatial and temporal resolution in real time.

5. Conclusions

A compact all-fiber pulsed coherent Doppler lidar for polar boundary wind profiling has been successfully developed and deployed at Zhongshan Station since the 2020 austral summer season by the 36th Chinese National Antarctic Research Expedition (CHINARE). The first-year observation datasets, including synchronous observations between the lidar, anemometer, and radiosondes, were utilized to present the preliminary performance of the PCDL at Zhongshan. The results indicate good consistency between them. Comparing the lidar and anemometer data reveals a mean RMSD of 0.98 m s−1 and 10.55° for wind speed and direction, respectively. The lidar’s ability to continuously profile wind in real time with high spatial and temporal resolution extends essential information about vertical structures of the Antarctic wind fields. It provides a valuable opportunity to further understand the evolution of the atmospheric boundary layer in Antarctic regions.

Author Contributions

Conceptualization, H.L. and Z.W.; methodology, Q.Z. and C.C.; software, X.L.; validation, X.P.; formal analysis, H.L., C.C. and Y.Y.; investigation, H.L., R.W., W.H.; data curation, X.P. and X.W.; writing—original draft preparation, H.L.; writing—review and editing, Z.W. and B.X.; project administration, X.W. and Z.W.; funding acquisition, Z.W. All authors have read and agreed to the published version of the manuscript.

Funding

This research was funded by the National key Research and Development Program of China (2022YFC2807202, 2021YFB3901304, 2018YFC1407301), Shandong key Research and Development Program (2020CXGC010104, 2022CXPT020), Natural Science Foundation of Shandong Province (ZR2021QF055).

Institutional Review Board Statement

Not applicable.

Informed Consent Statement

Not applicable.

Data Availability Statement

The dataset is provided by National Arctic and Antarctic Data Center (http://www.chinare.org.cn) (accessed on 1 December 2022).

Acknowledgments

We greatly appreciate the help from the Polar Research Institute of China and the Antarctic expeditioners at the Chinese Zhongshan Station. Special thanks to the 35th and 36th Chinese National Antarctic Research Expedition (CHINARE) for their contributions to the lidar observatory infrastructure constructions at Zhongshan Station.

Conflicts of Interest

The authors declare no conflict of interest.

References

  1. Genthon, C.; Six, D.; Gallée, H.; Grigioni, P.; Pellegrini, A. Two years of atmospheric boundary layer observations on a 45-m tower at Dome C on the Antarctic plateau. J. Geophys. Res. Atmos. 2013, 118, 3218–3232. [Google Scholar] [CrossRef]
  2. Alexander Haumann, F.; Gruber, N.; Münnich, M.; Frenger, I.; Kern, S. Sea-ice transport driving Southern Ocean salinity and its recent trends. Nature 2016, 537, 89–92. [Google Scholar] [CrossRef]
  3. Charalampidis, C.; Van As, D.; Box, J.E.; Van Den Broeke, M.R.; Colgan, W.T.; Doyle, S.H.; Hubbard, A.L.; MacFerrin, M.; Machguth, H.; Smeets, C.J.P.P. Changing surface-atmosphere energy exchange and refreezing capacity of the lower accumulation area, West Greenland. Cryosphere 2015, 9, 2163–2181. [Google Scholar] [CrossRef]
  4. Baker, W.E.; Atlas, R.; Cardinali, C.; Clement, A.; Emmitt, G.D.; Gentry, B.M.; Hardesty, R.M.; Källén, E.; Kavaya, M.J.; Langland, R.; et al. Lidar-measured wind profiles: The missing link in the global observing system. Bull. Am. Meteorol. Soc. 2014, 95, 543–564. [Google Scholar] [CrossRef]
  5. Lesins, G.; Duck, T.; Drummond, J. Climate trends at Eureka in the Canadian high arctic. Atmos.-Ocean 2010, 48, 59–80. [Google Scholar] [CrossRef]
  6. Wu, S.; Liu, B.; Liu, J.; Zhai, X.; Feng, C.; Wang, G.; Zhang, H.; Yin, J.; Wang, X.; Li, R.; et al. Wind turbine wake visualization and characteristics analysis by Doppler lidar. Opt. Express 2016, 24, A762. [Google Scholar] [CrossRef]
  7. Nott, G.J.; Duck, T.J. Lidar studies of the polar troposphere. Meteorol. Appl. 2011, 18, 383–405. [Google Scholar] [CrossRef]
  8. Smiley, V.N.; Warburton, J.A.; Morley, B.M. South Pole ice crystal precipitation studies using lidar sounding and replication. Antarct. J. U. S. 1975, 10, 230–231. [Google Scholar]
  9. Mahesh, A.; Campbell, J.R.; Spinhirne, J.D. Multi-year measurements of cloud base heights at South Pole by lidar. Geophys. Res. Lett. 2005, 32, 1–5. [Google Scholar] [CrossRef]
  10. Chu, X.; Pan, W.; Papen, G.C.; Gardner, C.S.; Gelbwachs, J.A. Fe Boltzmann temperature lidar: Design, error analysis, and initial results at the North and South Poles. Appl. Opt. 2002, 41, 4400. [Google Scholar] [CrossRef]
  11. Chu, Z.; Gardner, C.S.; Papen, G. Lidar observations of polar mesospheric clouds at South Pole: Diurnal variations. Geophys. Res. Lett. 2001, 28, 1937–1940. [Google Scholar] [CrossRef]
  12. Liu, Z.; Barlow, J.F.; Chan, P.W.; Fung, J.C.H.; Li, Y.; Ren, C.; Mak, H.W.L.; Ng, E. A review of progress and applications of pulsed DopplerWind LiDARs. Remote Sens. 2019, 11, 2522. [Google Scholar] [CrossRef]
  13. Greco, S.; Emmitt, G.D.; Duvivier, A.; Hines, K.; Kavaya, M. Polar winds: Airborne doppler wind lidar missions in the arctic for atmospheric observations and numerical model comparisons. Atmosphere 2020, 11, 1141. [Google Scholar] [CrossRef]
  14. Achtert, P.; Brooks, I.M.; Brooks, B.J.; Moat, B.I.; Prytherch, J.; Persson, P.O.G.; Tjernström, M. Measurement of wind profiles by motion-stabilised ship-borne Doppler lidar. Atmos. Meas. Tech. 2015, 8, 4993–5007. [Google Scholar] [CrossRef]
  15. Zentek, R.; Kohnemann, S.H.E.; Heinemann, G. Analysis of the performance of a ship-borne scanning wind lidar in the Arctic and Antarctic. Atmos. Meas. Tech. 2018, 11, 5781–5795. [Google Scholar] [CrossRef]
  16. Tomasi, C.; Vitale, V.; Lupi, A.; Di Carmine, C.; Campanelli, M.; Herber, A.; Treffeisen, R.; Stone, R.S.; Andrews, E.; Sharma, S.; et al. Aerosols in polar regions: A historical overview based on optical depth and in situ observations. J. Geophys. Res. Atmos. 2007, 112, D16205. [Google Scholar] [CrossRef]
  17. Wang, Z.; Wang, R.; Li, H.; Zhuang, Q.; Huang, W.; Wang, W.; Liu, F.; Ban, C.; Chen, C. Applied research on low-altitude wind field using coherent Doppler wind lidar at Zhongshan Station, Antarctic. Chin. J. Polar Res. 2022, 34, 11–19. [Google Scholar] [CrossRef]
  18. Dou, Y.; Zuo, G.; Chang, X.; Chen, Y. A study of a standalone renewable energy system of the Chinese Zhongshan Station in Antarctica. Appl. Sci. 2019, 9, 1968. [Google Scholar] [CrossRef]
  19. Chen, X.; Huang, W.; Ban, C.; Kosch, M.J.; Murphy, D.J.; Hu, Z.; Liu, J.; He, F.; Wang, R.; Yang, H.; et al. Dynamic Properties of a Sporadic Sodium Layer Revealed by Observations Over Zhongshan, Antarctica: A Case Study. J. Geophys. Res. Sp. Phys. 2021, 126, e2021JA029787. [Google Scholar] [CrossRef]
  20. Ban, C.; Pan, W.; Wang, R.; Huang, W.; Liu, F.; Wang, Z.; Fang, X.; Cheng, X.; Hu, H. Initial results of Rayleigh scattering lidar observations at Zhongshan station, Antarctica. Infrared Laser Eng. 2021, 50, 70–77. [Google Scholar] [CrossRef]
  21. Liu, F.; Wang, R.; Yi, F.; Huang, W.; Ban, C.; Pan, W.; Wang, Z.; Hu, H. Pure rotational Raman lidar for full-day troposphere temperature measurement at Zhongshan Station (6937° S, 7637° E), Antarctica. Opt. Express 2021, 29, 10059. [Google Scholar] [CrossRef]
  22. Iwai, H.; Aoki, M.; Oshiro, M.; Ishii, S. Validation of Aeolus Level 2B wind products using wind profilers, ground-based Doppler wind lidars, and radiosondes in Japan. Atmos. Meas. Tech. 2021, 14, 7255–7275. [Google Scholar] [CrossRef]
  23. Srinivasa Rao, I.; Anandan, V.K.; Narasimha Reddy, P. Evaluation of DBS wind measurement technique in different beam configurations for a VHF wind profiler. J. Atmos. Ocean. Technol. 2008, 25, 2304–2311. [Google Scholar] [CrossRef]
  24. Zeng, Z.; Wang, Z.; Ding, M.; Zheng, X.; Sun, X.; Zhu, W.; Zhu, K.; An, J.; Zang, L.; Guo, J.; et al. Estimation and Long-term Trend Analysis of Surface Solar Radiation in Antarctica: A Case Study of Zhongshan Station. Adv. Atmos. Sci. 2021, 38, 1497–1509. [Google Scholar] [CrossRef]
Figure 1. (a) Geographical location of Zhongshan Station (denoted by the red dot) in the southeast coastal area of Antarctica; (b) The picture of lidar observation containers at Zhongshan Station.
Atmosphere 14 00901 g001
Figure 2. The schematic diagram of the PCDL system.
Atmosphere 14 00901 g002
Figure 3. Schematic diagram of the DBS scan technique used to measure wind profiles.
Atmosphere 14 00901 g003
Figure 4. The profiles of horizontal wind speed and direction measured via PCDL at Zhongshan Station, (a) wind profiles of PCDL at 17:42, 22 May 2020; (b) wind profiles of PCDL at 20:28, 16 July 2020.
Atmosphere 14 00901 g004
Figure 5. The comparisons of horizontal wind speed and direction measured using PCDL (black line) and the radiosonde (red line) at Zhongshan Station. (a) Wind profiles of RS41-SG radiosonde and lidar at 17:06 on 26 February 2020; (b) Wind profiles of RS41-SG radiosonde and lidar at 14:24 on 14 May 2020; (c) Wind profiles of RS41-SG radiosonde and lidar at 15:21 on 2 July 2020; (d) Wind profiles of RS41-SG radiosonde and lidar at 16:32 on 3 October 2020.
Atmosphere 14 00901 g005
Figure 6. Scatter plot of wind speed (upper panel: (ac)) and direction (lower panel: (df)) measured by the PCDL and anemometer from 6 April to 7 April (left column: (a,d)), 9 August to 10 August (middle column: (b,e)) and 22 September to 23 September (right column: (c,f)).
Atmosphere 14 00901 g006
Figure 7. Temporal variation of wind fields measured using PCDL at Zhongshan station from 00:00 to 02:30 on 18 September 2020. (a) Wind vector profiles, (b) horizontal wind speed profiles, and (c) horizontal wind direction profiles.
Atmosphere 14 00901 g007
Figure 8. Temporal variation of wind fields measured using PCDL at Zhongshan station from 13:00 to 16:00 on 28 June 2020. (a) Wind vector profiles, (b) horizontal wind speed profiles, and (c) horizontal wind direction profiles.
Atmosphere 14 00901 g008aAtmosphere 14 00901 g008b
Table 1. The specifications of the PCDL.
ParametersSpecification
Wavelength1550 nm
Repetition rate10 kHz
Pulse energy150 μJ
Pulse width200 ns
Velocity measurement range±90 m s−1
Detection range3000 m maximum
Range resolution30 m
Telescope diameter100 mm
Table 2. The specifications of the anemometer and radiosonde.
ParametersSpecification
AnemometerTypeXFY3-1 (wind cup)
Maximum reported wind speed 160 m s−1
Directional measurement uncertainty
Speed measurement uncertainty0.5 m s−1 (0~10 m s−1)
5% × Vm m s−1 (10~95 m s−1)
RadiosondeTypeVaisala RS41-SG
Speed measurement range 95 m s−1
Directional measurement uncertainty
Speed measurement uncertainty0.7 m s−1
Table 3. Statistics for the PCDL wind data compared to the meteorological station anemometer.
DateStart Time
(UTC)
End Time
(UTC)
Observation PeriodNWind Speed (m s−1)Wind Direction (°)
RMSDBiasRRMSDBiasR
2020-02-169:0423:5914:5419860.850.680.96210.28−6.710.943
2020-02-170:0018:1218:12
2020-04-064:0323:5919:5620441.050.490.9769.96−11.550.925
2020-04-070:0014:0814:08
2020-05-123:5923:5919:5914710.970.640.9519.77−8.10.932
2020-05-130:004:324:32
2020-06-237:5823:5916:0014800.720.590.94413.61−18.630.891
2020-06-240:008:418:40
2020-07-118:4323:5915:1514131.250.810.90711.225.170.913
2020-07-120:008:188:18
2020-08-094:3423:5919:2521030.690.360.9759.73−15.620.925
2020-08-100:0015:3815:38
2020-09-222:2423:5921:3519361.080.760.9417.23−11.490.948
2020-09-230:0010:4210:42
2020-10-146:1823:5917:4115451.210.820.91212.56−14.120.915
2020-10-150:008:058:04
Disclaimer/Publisher’s Note: The statements, opinions and data contained in all publications are solely those of the individual author(s) and contributor(s) and not of MDPI and/or the editor(s). MDPI and/or the editor(s) disclaim responsibility for any injury to people or property resulting from any ideas, methods, instructions or products referred to in the content.

