Article

The Impact of COVID-19 Lockdown on Ambient Air Quality in Shanghai, 2022

1
Changwang School of Honors, Nanjing University of Information Science & Technology, Nanjing 210044, China
2
School of Management Engineering, Xi’an University of Finance and Economics, Xi’an 710100, China
3
School of Remote Sensing & Geomatics Engineering, Nanjing University of Information Science & Technology, Nanjing 210044, China
4
Laboratory of Target Microwave Properties, Deqing Academy of Satellite Applications, Huzhou 313000, China
5
School of Geography Science, Nanjing University of Information Science & Technology, Nanjing 210044, China
*
Author to whom correspondence should be addressed.
Atmosphere 2023, 14(5), 898; https://doi.org/10.3390/atmos14050898
Submission received: 11 April 2023 / Revised: 17 May 2023 / Accepted: 19 May 2023 / Published: 21 May 2023
(This article belongs to the Section Air Pollution Control)

Abstract

:
The COVID-19 lockdown contributes to the improvement of air quality. Most previous studies have attributed this to the reduction of human activity while ignoring the meteorological changes, this may lead to an overestimation or underestimation of the impact of COVID-19 lockdown measures on air pollution levels. To investigate this issue, we propose an XGBoost-based model to predict the concentrations of PM2.5 and PM10 during the COVID-19 lockdown period in 2022, Shanghai, and thus explore the limits of anthropogenic emission on air pollution levels by comprehensively employing the meteorological factors and the concentrations of other air pollutants. Results demonstrate that actual observations of PM2.5 and PM10 during the COVID-19 lockdown period were reduced by 60.81% and 43.12% compared with the predicted values (regarded as the period without the lockdown measures). In addition, by comparing with the time series prediction results without considering meteorological factors, the actual observations of PM2.5 and PM10 during the lockdown period were reduced by 50.20% and 19.06%, respectively, against the predicted values during the non-lockdown period. The analysis results indicate that ignoring meteorological factors will underestimate the positive impact of COVID-19 lockdown measures on air quality.

1. Introduction

The Yangtze River Delta, as one of the four source areas of heavy haze events in China, has led to considerable air pollution problems over the past few decades due to its rapid economic development and urbanization [1,2]. During the past three years from 2020 to 2022, some social distancing measures were adopted to control the COVID-19 epidemic in China, such as movement restrictions, the prohibition of public meetings, the shutdown of schools and public places, isolation, and quarantine [3]. These restrictions have significantly reduced anthropogenic emissions and prevented severe air pollution incidents in the Yangtze River Delta [4], including the reduced emissions from public and private vehicle transport [5]. Besides, some other major social events associated with the air pollution control measures, such as the Asia-Pacific Economic Cooperation (APEC) meeting in 2014 and the Victory Day parade of China in 2015, have demonstrated the positive effects of air pollution control measures [6]. A case study also indicated that Guangzhou’s ambient air quality was significantly improved in 2016 after the implementation of a series of air pollution control measures in Guangzhou and the surrounding cities from 2014 to 2016 [7].
Many countries have adopted closure measures during the COVID-19 epidemic period which control carbon emissions by sacrificing international shipping et al. and were mostly reported to have improved the local air quality [8,9,10]. As vehicle emissions and industrial productions are the main sources of PM2.5 and PM10 air pollution, these pollution sources were controlled by the safety measures adopted for the prevention of COVID-19. The impact of restriction policies for the COVID-19 pandemic on air quality varies considerably between countries depending on their different geographical, economic, industrial, and social characteristics [11]. By comparing the emission changes of the main pollutants in different regions of the world during the first six months of 2020, the eastern regions of China have the largest decrease in total emissions in February [4,12]. Research has shown that the concentrations of PM10 decreased by 75% during the lockdown in Salé City (Morocco) compared to PM10 in the normal period [13], and the same value decreased by 18% for PM10 in Portugal [14]. As for the reduction of PM2.5, the reports showed that the concentrations of PM2.5 decreased 76.5% in Malaysia, 58% in Spain, 53.1% in Delhi, and 53.1% in Tehran [9]. In addition, a reduction of 29.8% in PM2.5 was found during the partial lockdown period in São Paulo state, Brazil [15]. In the United States, PM2.5 declined in urban counties with early closed businesses [16]. In Wuhan, China, the concentrations of PM2.5 and PM10 in the lockdown period declined by 41.2% and 33.1%, respectively, compared to the pre-COVID-19 period [17]. Besides, reductions in surface PM2.5 and PM10 were reported in six mega-cities in India during the lockdown period [18,19]. In 2020, PM concentrations at the traffic and background stations are on average 15% and 13.4% lower than in the reference period in Wrocław, Poland [20]. In contrast, in Italy, no decrease in particulate matter (PM10 or PM2.5) was observed during the first phase of the COVID-19 epidemic [21] and Few sites (2–3 out of 16) experienced statistically significant drops in PM2.5 in Ontario, Canada [22].
However, most of the available studies on outbreak control measures and environmental pollutant levels have yet to quantify the effects of meteorological changes on air pollutant levels during the COVID-19 pandemic around the world, which would lead to an overestimation or underestimation of the impact of COVID-19 lockdown measures on air pollution levels. In general, meteorological factors are of special importance in affecting the regional air quality in China [1,23,24,25,26]. Meteorological conditions may be a determining factor in the occurrence of air pollution if the emissions of air pollutants in a region are essentially stable over a certain period [25]. Many meteorological factors, such as wind speed, wind force, temperature, precipitation, and humidity, also significantly affect air pollution levels [27,28,29]. The meteorological contribution to PM2.5 levels ranged from −4.8% to 4.3% in the Yangtze River Delta region [30]. The PM10 concentration is negatively correlated with the relative humidity and temperature [31]. The correlations between PM and NO2 and between PM and SO2 were moderate, while the correlations between PM and CO and between PM and O3 were weak and unstable, respectively [32]. Unfavorable meteorological conditions can offset the positive environmental impacts of closure measures; one report stated that control measures reduced PM2.5 in Beijing by 12 µg/m3. In comparison, meteorological forcing increased PM2.5 by 30 µg/m3, resulting in an increase in PM2.5 levels during the closure period [28]. In Hubei Province, China, which had the highest number of confirmed pneumonia cases in February 2020, the impact of total emissions reductions (72%) significantly outweighed the proportion of meteorologically driven PM2.5 increases (13%) [21]. The average PM2.5 concentration in the Singapore region decreased by 19% when the effect of meteorological parameters was taken into account; this decrease was lower than the decrease observed when the effect of meteorological parameters was not taken into account (29%) [33].
Although individual studies have incorporated meteorological parameters’ effects when assessing the impacts of COVID-19 on NO2 and PM2.5 pollutant levels [33], the machine-learning methods applied in those studies are inferior to XGBoost models in terms of their predictive accuracy [34,35]. XGBoost, as a typically integrated algorithm, can be executed efficiently using fewer resources [36]. Moreover, the XGBoost model combines hourly predictions with near-surface measurements of air pollutants and meteorological conditions to estimate daily PM2.5 concentrations in Shanghai, China, with improved model correlation coefficients of 50–100% and reduced standard deviations of 14–24 µg/m3 compared to the WRF-Chem model [37]. In addition to using meteorological data, air quality standard data such as SO2, NOX, and O3 data are utilized in the XGBoost algorithm to model the atmospheric PM10 concentrations [38].
Environmental factors play an important role in the spread of coronavirus disease 2019 (COVID-19) [39]. A comprehensive crisis management strategy for pandemic threats must also be based on environmental and socioeconomic factors and new technologies, not just on medically relevant parameters [40]. To gain experience that can be used to prevent future pandemic threats and to avoid overestimating or underestimating the impact of the COVID-19 outbreak on air pollution, this study used meteorological parameters (the mean temperature, dew point, visibility, and wind speed) and the concentrations of the remaining air pollutants to estimate the level of PM in the air during the COVID-19 outbreak. In addition, to account for the unpredictability of the lockdown measurements and increase the comparability of the results, this study examined trends of air pollutant concentrations from 2020 to 2022 (i.e., following the COVID-19 epidemic), as opposed to limiting the analysis to a predetermined lockdown period. We also compare the changes in air pollution levels in Shanghai during the lockout period (31 March to 1 June) in each year between 2015 and 2022 to provide a more comprehensive understanding of the effects of the novel coronavirus on air pollution.

2. Materials and Methods

2.1. Sample and Data

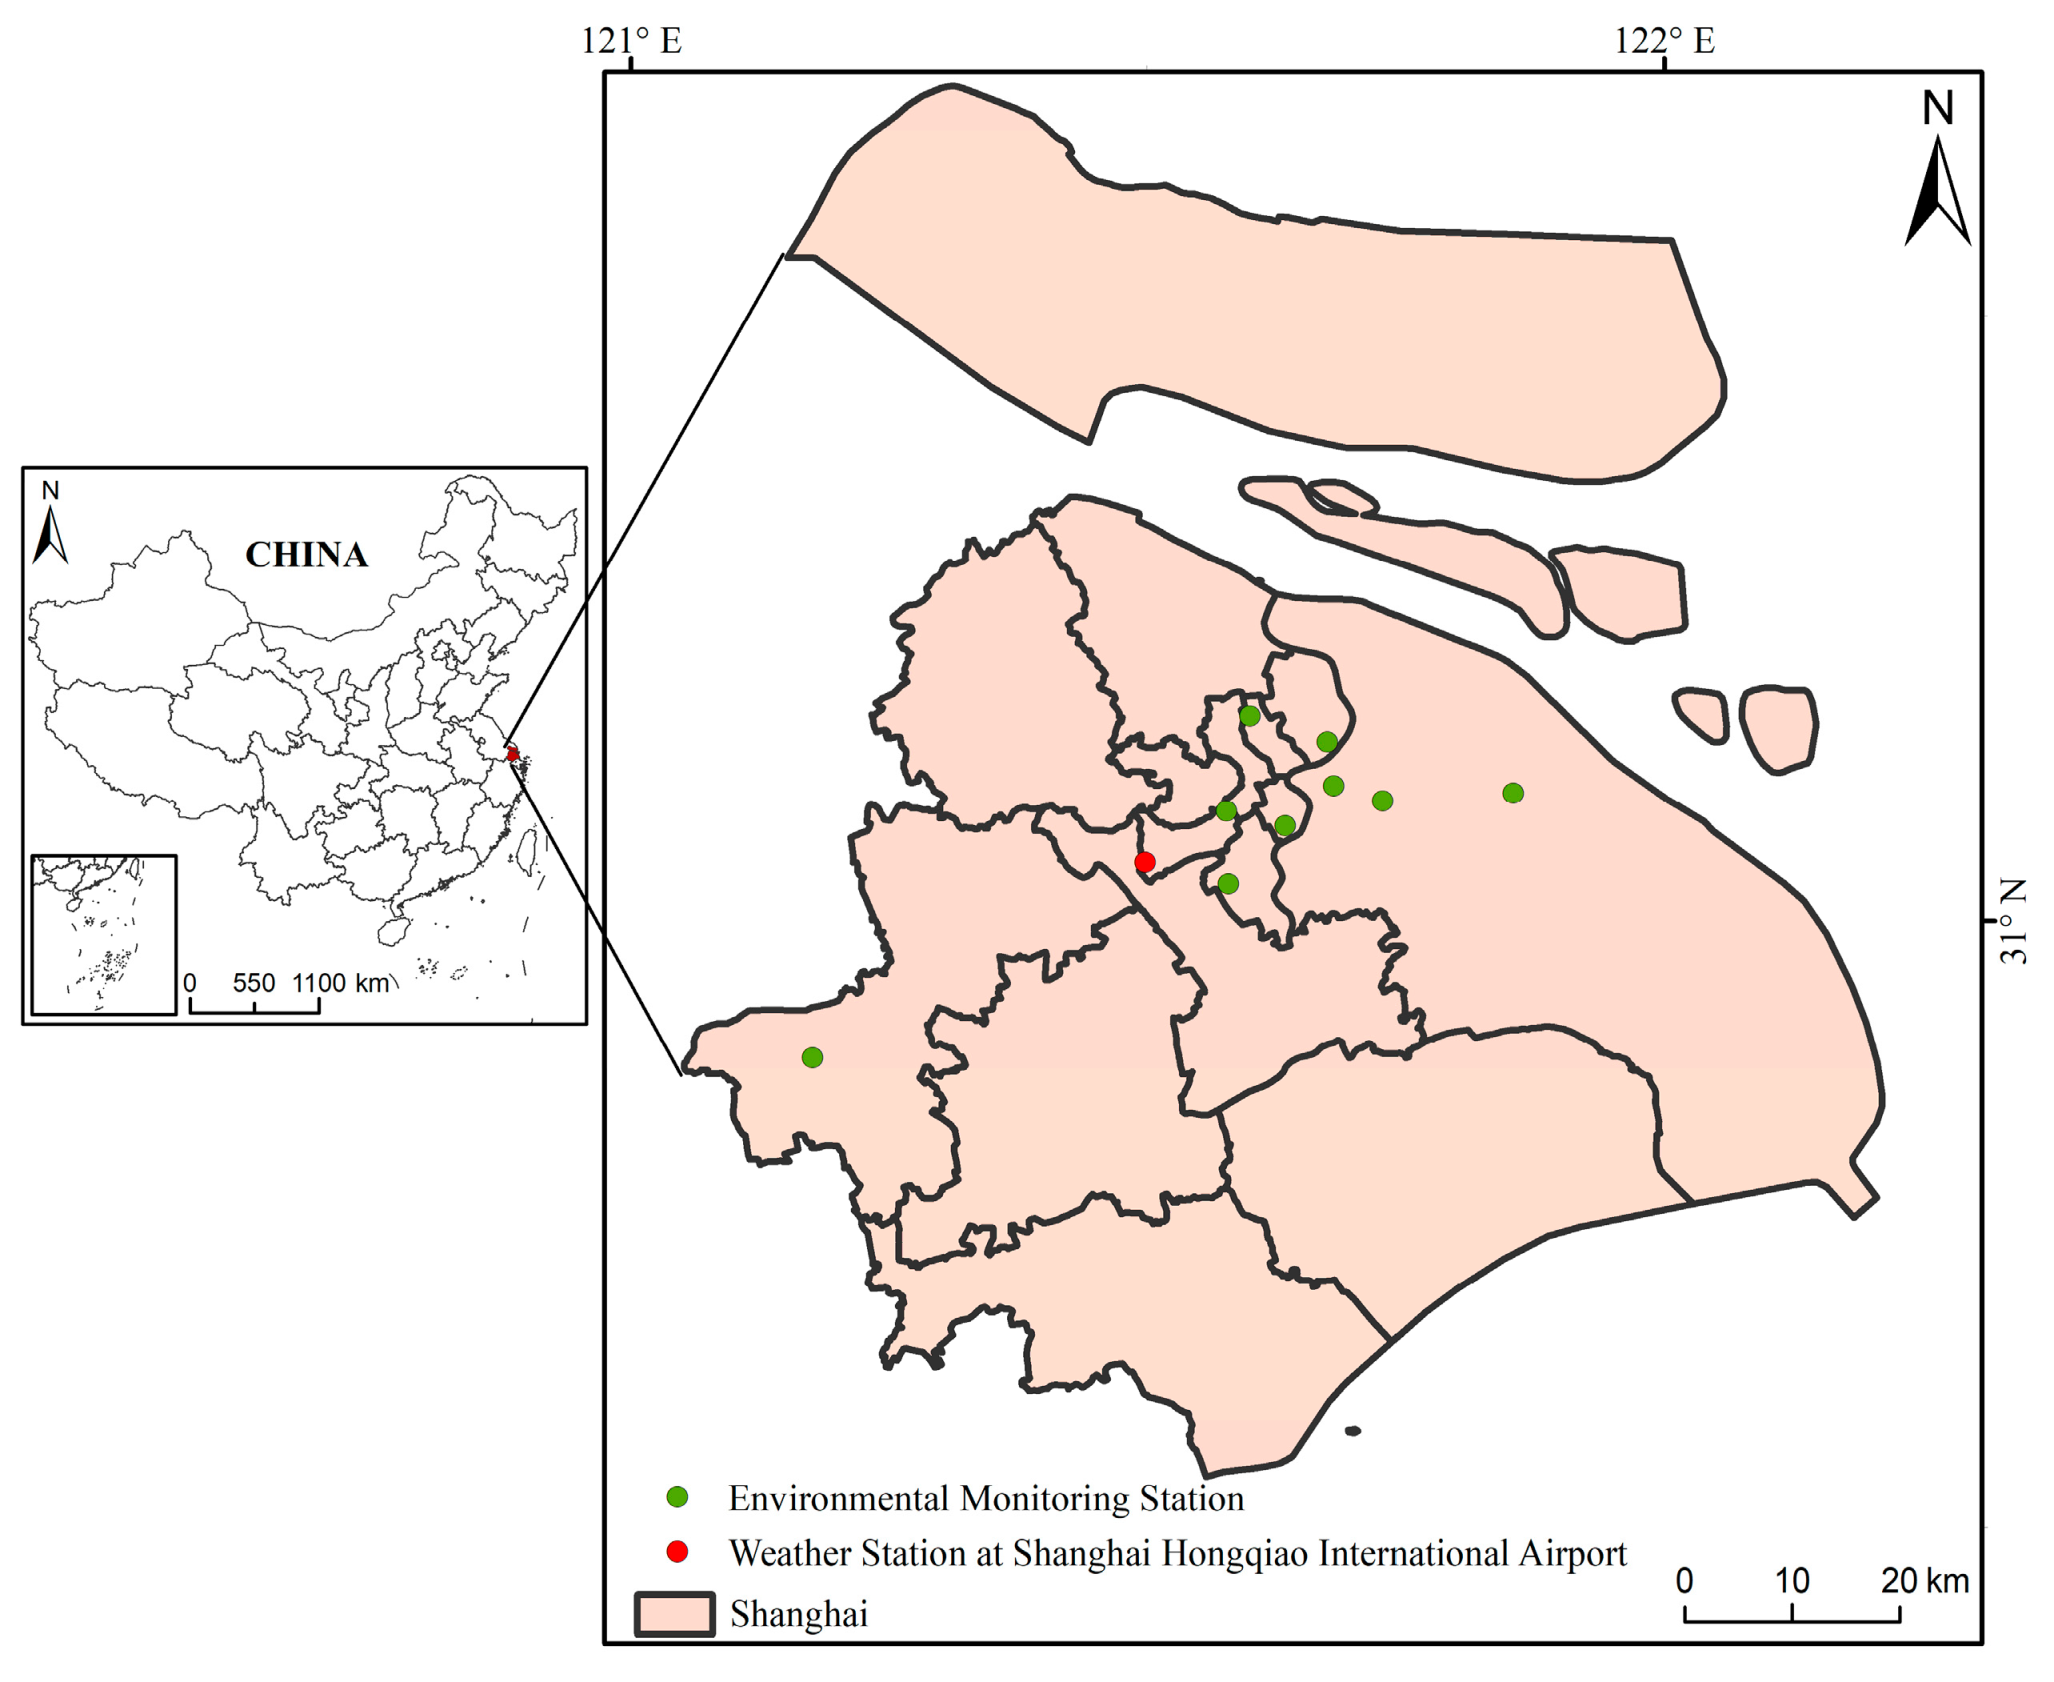
Shanghai, China’s worldwide economic, financial, trading, shipping, science, and technology innovation center, is located between 120°52′ and 122°12′ east and between 30°40′ and 31°53′ north. In late February 2022, a mutated strain of the Omicron virus triggered a significant public health disaster in Shanghai. The Shanghai City Government initiated a series of containment and control measures on 31 March 2022, and by 1 June 2022, the epidemic situation in Shanghai had been effectively contained. This study takes the COVID-19 lockdown period in Shanghai, in 2022, as the case study, to investigate the impact of the COVID-19 lockdown on the air quality changes. The different periods employed in this study for the prevalence of COVID-19 in Shanghai are shown in Table 1. The spatial distribution of Shanghai and monitoring stations is shown in Figure 1.
The daily Air Quality Index (AQI), which is used by government agencies to report daily air quality [41] and daily concentrations of six related air pollutants, PM2.5, PM10, NO2, CO, SO2, and O3, in Shanghai from 1 January 2015 to 30 September 2022 were obtained from the national real-time urban air quality release platform of the China National Environmental Monitoring Centre at http://106.37.208.233:20035, accessed on 24 October 2022. Table 2 shows the descriptive statistics of these air quality data. CO is given in mg/m3, the other gaseous pollutants are given in μg/m3 and AQI is a dimensionless relative value that collectively indicates the level of air pollution or the air quality rating.
The daily mean temperature (TEMP), dew point temperature (DEWP), visibility (VISIB), and wind speed (WDSP) data for Shanghai from 1 January 2015 to 30 September 2022 were obtained from the National Climatic Data Center (NCDC), which is part of the National Oceanic and Atmospheric Administration (NOAA) at Daily Observational Data (noaa.gov, accessed on 24 October 2022). The daily mean temperatures (TEMP) and dew point temperatures (DEWP) are given in degrees Fahrenheit; the daily mean visibility (VISIB) is given in feet; and the daily mean wind speed (WDSP) is given in knots.

2.2. Measures of Variables

2.2.1. Influence of Meteorological and Other Pollution Parameters on PM2.5 and PM10

The important factors that affect the migration and transformation of PM2.5 and PM10 include weather conditions and the concentrations of other pollutants [42]; moreover, numerous parameters influence the PM2.5 and PM10 concentrations and these processes are quite complex. Before estimating the PM2.5 and PM10 concentrations, it is crucial to study the essential parameters to improve the predictions and determine the change in these components’ potential to influence these concentrations. As not all distributions of the analyzed variables show normal distributions, the Spearman correlation coefficient [43] was chosen as the measuring indicator to evaluate the meteorological parameters and other pollution characteristics associated with PM2.5 and PM10 concentrations. The Spearman correlation coefficient was calculated using Equation (1), where x represents the rank variables of PM2.5 or PM10, y represents the rank variables of other data, and n represents the number of each type of data.
ρ x , y = n i = 1 n x i y i i = 1 n x i i = 1 n y i n i = 1 n x i 2 ( i = 1 n x i ) 2 n i = 1 n y i 2 ( i = 1 n y i ) 2 .

2.2.2. XGBoost-Based Prediction Model

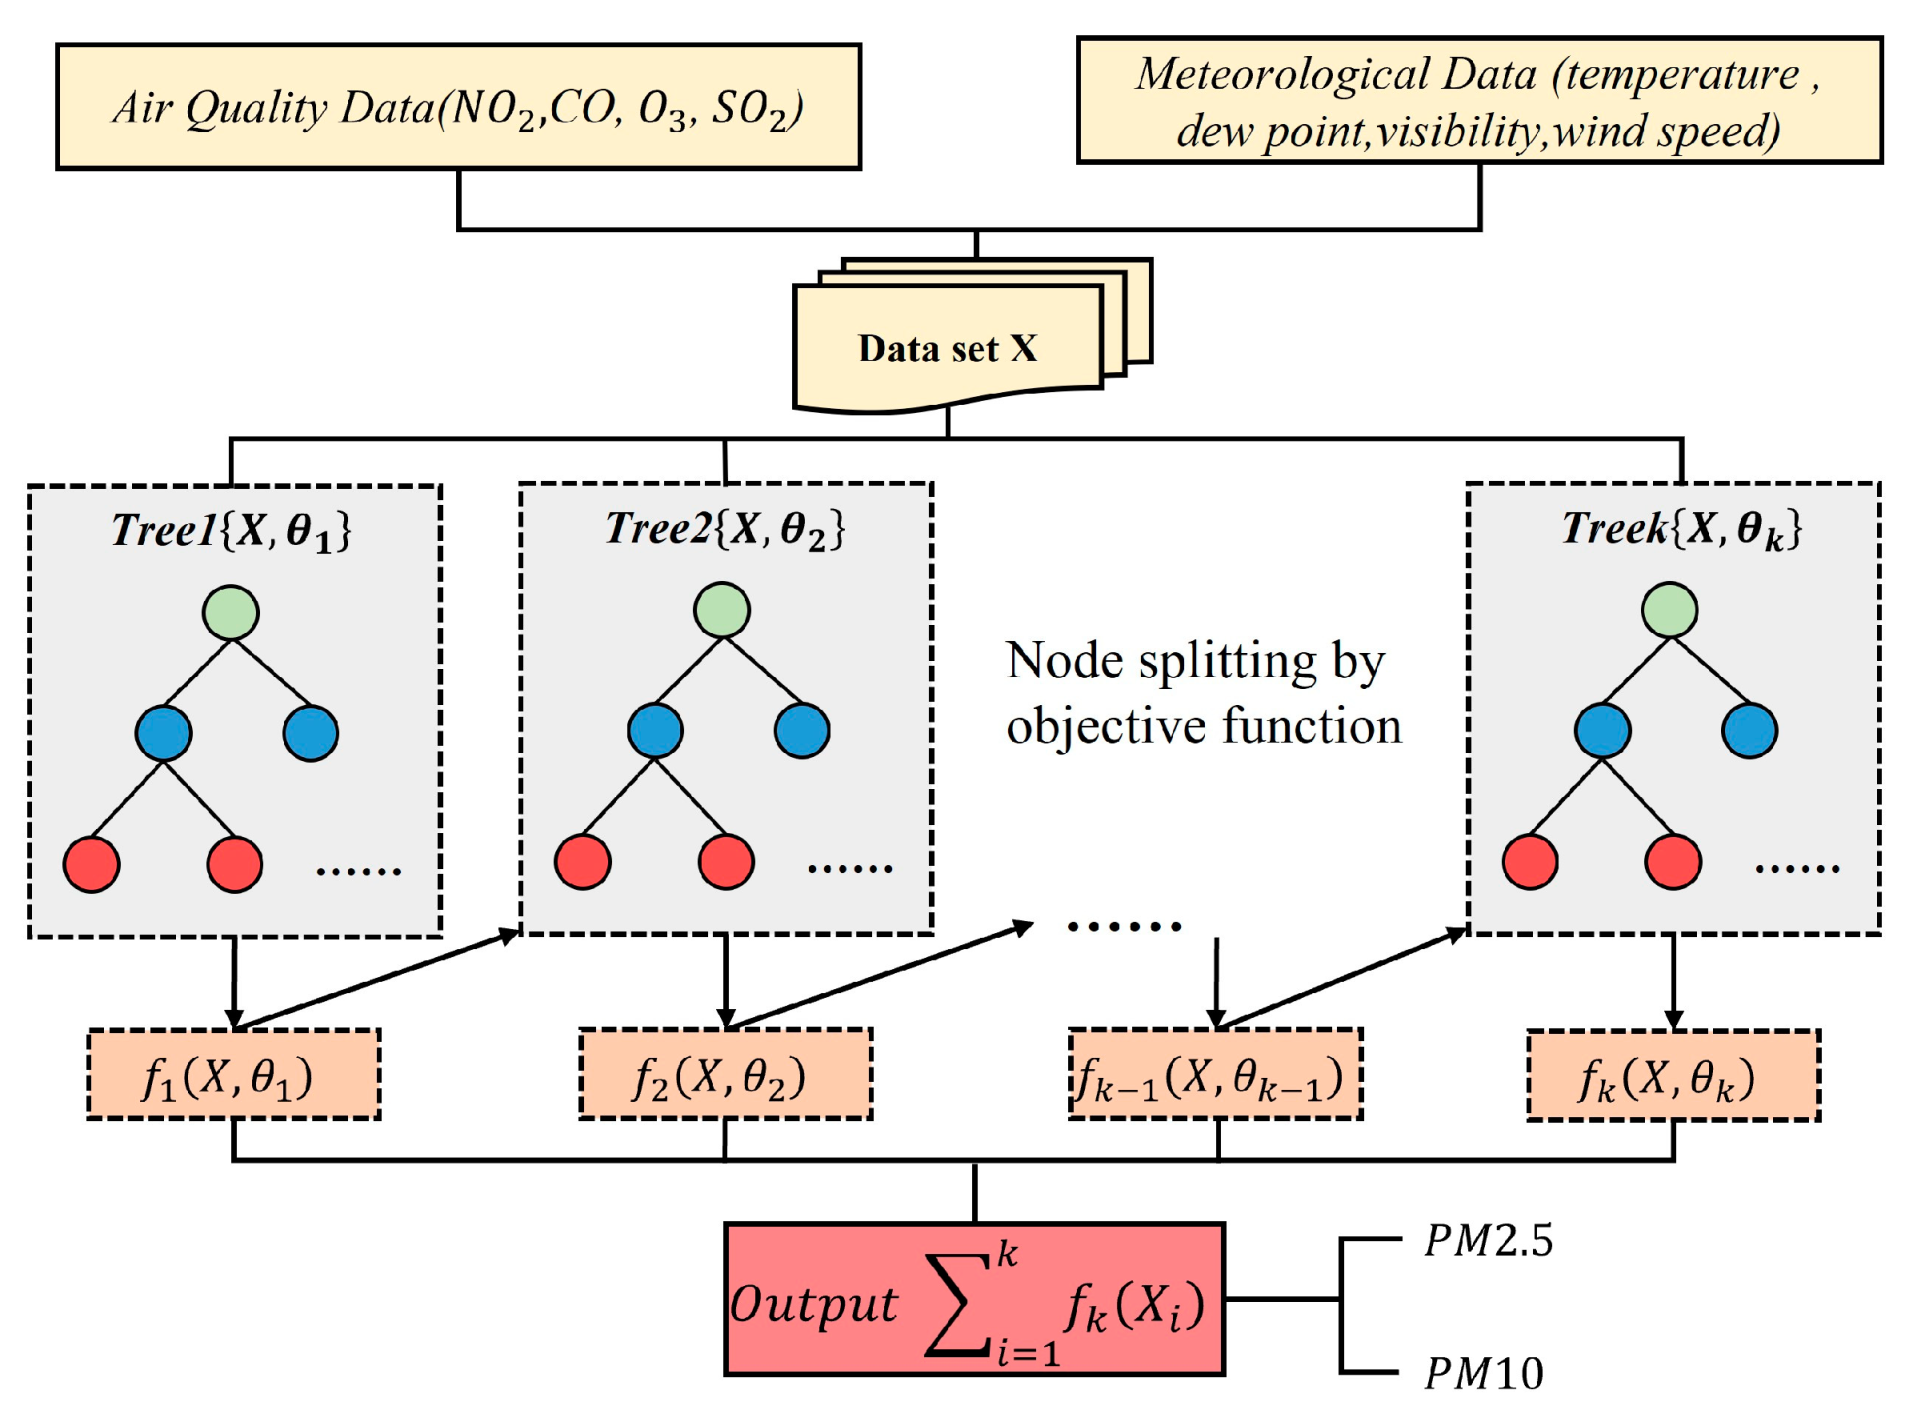
XGBoost (extreme gradient boosting) is a model that was initially proposed by Tianqi Chen and Carlos Guestrin in 2011 [36], which has been continuously optimized and enhanced by the follow-up researchers. The model is a learning framework built on boosting tree models. In view of this, we proposed an XGBoost-based prediction model to forecast the air quality changes during the COVID-19 lockdown period in Shanghai, 2022. The specific calculation steps of XGBoost-based prediction model are shown in Figure 2.
The model’s core concept is to combine the weak classifier CART tree with an additive model to create a strong classifier. Assuming that having a total of K trees, the tree model is integrated by using the addition method, with F representing the fundamental tree model:
y ^ i = k = 1 K f k ( x i ) , f k F ,
where y ^ i represents the predicted PM concentration, x i represents the predictors, and f k ( x ) is the k-th CART (Classification and Regression Trees) loss function.
L = i l ( y ^ i , y i ) + k Ω ( f k ) ,
where l is the loss function, representing the error between the predictive value and the actual value; Ω is the function used for regularization to prevent overfitting. The term   Ω is calculated as follows:
Ω ( f ) = γ T + 1 2 λ w 2 ,
where T represents the number of leaves per tree and w represents the weight of the leaves of each tree.
This function can be simplified by using the Taylor expansion. A CART node formula for loss reduction following a tree split from a particular node can be derived as follows:
Gain   = 1 2 [ ( i I L g i ) 2 i I L h i + λ + ( i I R g i ) 2 i I R h i + λ + ( i I g i ) 2 i I h i + λ ] γ ,
where I is a subset of the available observations in the current node, I L   and   I R are subsets of the available observations in the left and right nodes, respectively, following the split. The predictors are daily concentrations of four air pollutants (SO2, NO2, CO, and O3) and daily meteorological data (temperature, dew point, visibility, and wind speed) observations. In this way, an XGBoost-based prediction model was proposed and used to predict the ambient PM concentrations from 2020 to 2022, which was regarded as the air quality without the impact of COVID-19 lockdown measures.

2.2.3. Accuracy Evaluation Measure

In this study, three indicators were chosen to evaluate the accuracy of the PM value predictions, that is, the mean absolute error (MAE), root mean square error (RMSE), and mean percentage error (MPE). The formulas of these three evaluation indicators are shown in Equations (6)–(8):
RMSE = 1 n i = 1 n ( y ^ i y i ) 2 ,
MAE   = 1 n i = 1 n | ( y ^ i y i ) | ,
MPE = 100 % n i = 1 n y ^ i y i y i
where y i and y ^ i represent the observed and predicted PM concentrations, respectively, and n refers to the total logarithm of data in the test set.

2.3. Model Flowchart and Data Analysis Procedure

Figure 3 shows the proposed model flowchart and data analysis procedure, which include the following three steps:
Step 1. For air quality data and meteorological data collected in Shanghai from 1 January 2015 to 30 September 2022, during the data preprocessing phase, if air quality data were missing for a particular day, all data for that day were deleted; for missing individual visibility (VISIB) data, the average of all remaining valid visibility (VISIB) data was used to fill in the missing values. After that, all data were divided into two parts according to time: before the COVID-19 outbreak (Time 2015–2019) and during COVID-19 epidemic (Time 2020–2022).
Step 2. In order to investigate the impact of COVID-19 lockdown on air quality, the AQI data for a total of 63 days, from the 31 March to the 1 June (the time period of the lockdown in Shanghai), were independently analyzed for each of the years from 2015–2022. In addition, the difference between observed and predicted PM values during the lockdown in Shanghai were calculated to show the impact of COVID-19 lockdown on air quality.
Step 3. To avoid overestimating or underestimating the impact of the COVID-19 outbreak on air pollution, meteorological parameters (the mean temperature, dew point, visibility, and wind speed) and the concentrations of the remaining air pollutants (NO2, CO, O3, and SO2) were chosen as predictors to estimate the level of PM in the air during the COVID-19 epidemic. The XGBoost-based prediction model was selected as the prediction model: the training set was the data before the COVID-19 outbreak (Time 2015–2019) and the test set was the data during the COVID-19 epidemic (Time 2020–2022). In order to investigate whether predictors without meteorological factors overestimate or underestimate the impact of the COVID-19 lockdown, the two prediction results using different predictors were compared.

3. Discussion and Results

3.1. Air Quality Investigation before and during COVID-19 in Shanghai

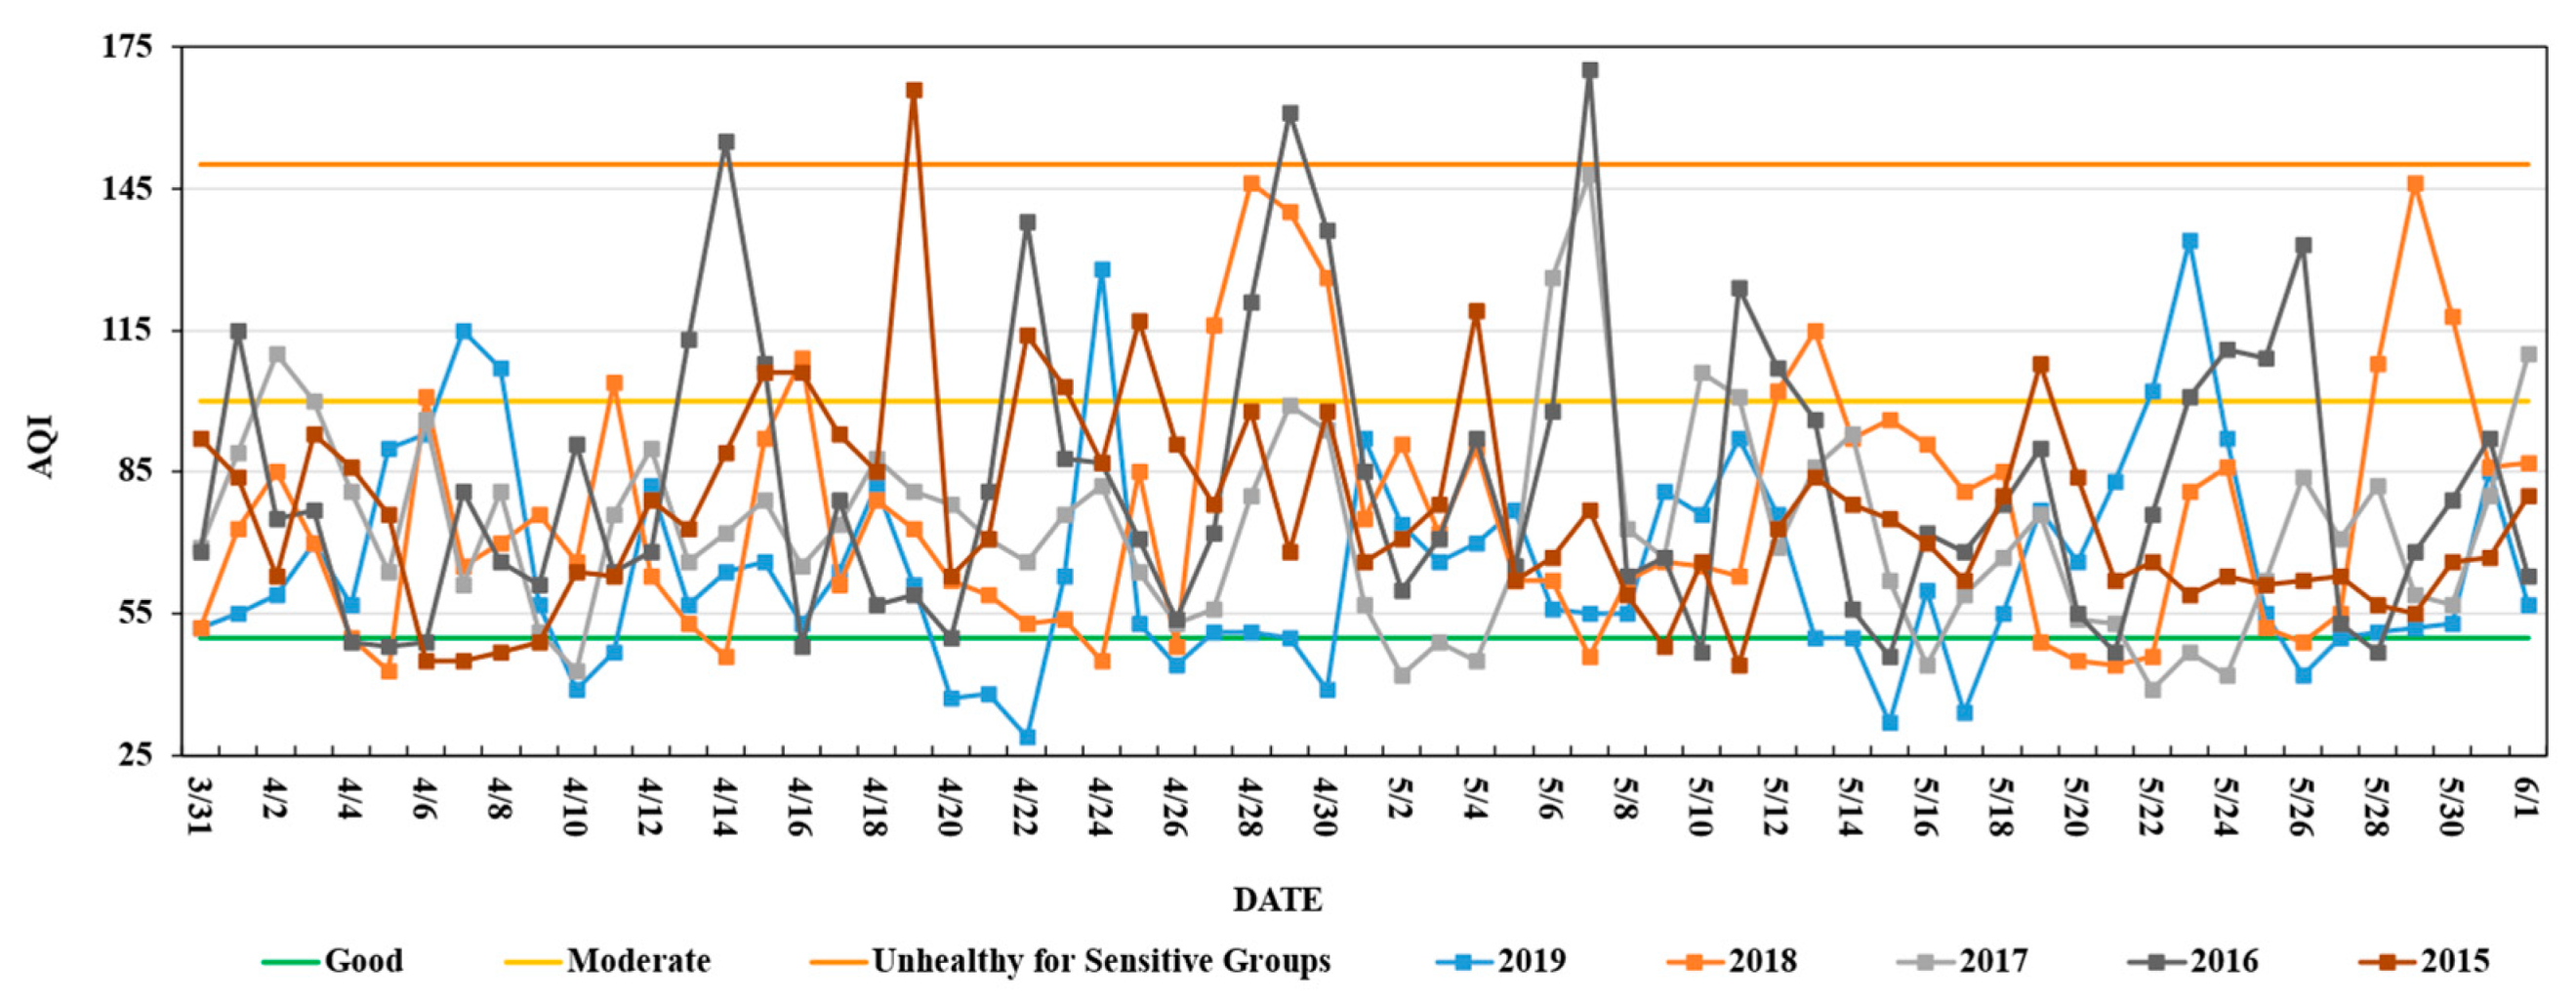
In order to investigate the air quality changes during the COVID-19 lockdown period in Shanghai from 31 March 2022 to 1 June 2022, we collected the AQI data with a total of 63 days from 31 March to 1 June from the year 2015 to 2022, the daily AQI tendency was presented for each year. To facilitate the data comparisons, we, respectively compared the AQI data for the period before COVID-19 and the period during COVID-19, as shown in Figure 4 and Figure 5. As is shown, three different AQI classification levels are employed to evaluate the daily air quality for each year in the same period, the specific classification levels are shown in Table 3. It is obvious that the AQI in Shanghai are fluctuated during the study period of each year, and the AQI during the COVID-19 epidemic period (31 March to 1 June, 2020–2022) is notably lower than that during the period before COVID-19 (2015–2019).
To further compare the air quality quantitatively before and during COVID-19 in Shanghai, we statistically analyzed the numbers and percentages of days with different air quality levels in the lockdown period (31 March to 1 June) in Shanghai from 2015 to 2022. As it is presented in the Table 4, the proportions of days with good air quality during the COVID-19 period in the year 2020, 2021, and 2022 are higher than 40%, which is significantly better than that (with the AQI lower than 16%) before the COVID-19 period (2015–2019). Furthermore, the number of days with good air quality during the COVID-19 period kept increasing every year, with 41.27%, 65.08%, and 71.43% in the years 2020, 2021, and 2022, respectively. It is noted that the epidemic lockdown period in 2022 are all with good or moderate air qualities in Shanghai. This can be attributed to the fact that the lockdown measures had a positive impact on the air quality since the COVID-19 broke out in December 2019.

3.2. Impacts of Prediction Factors on PM2.5 and PM10

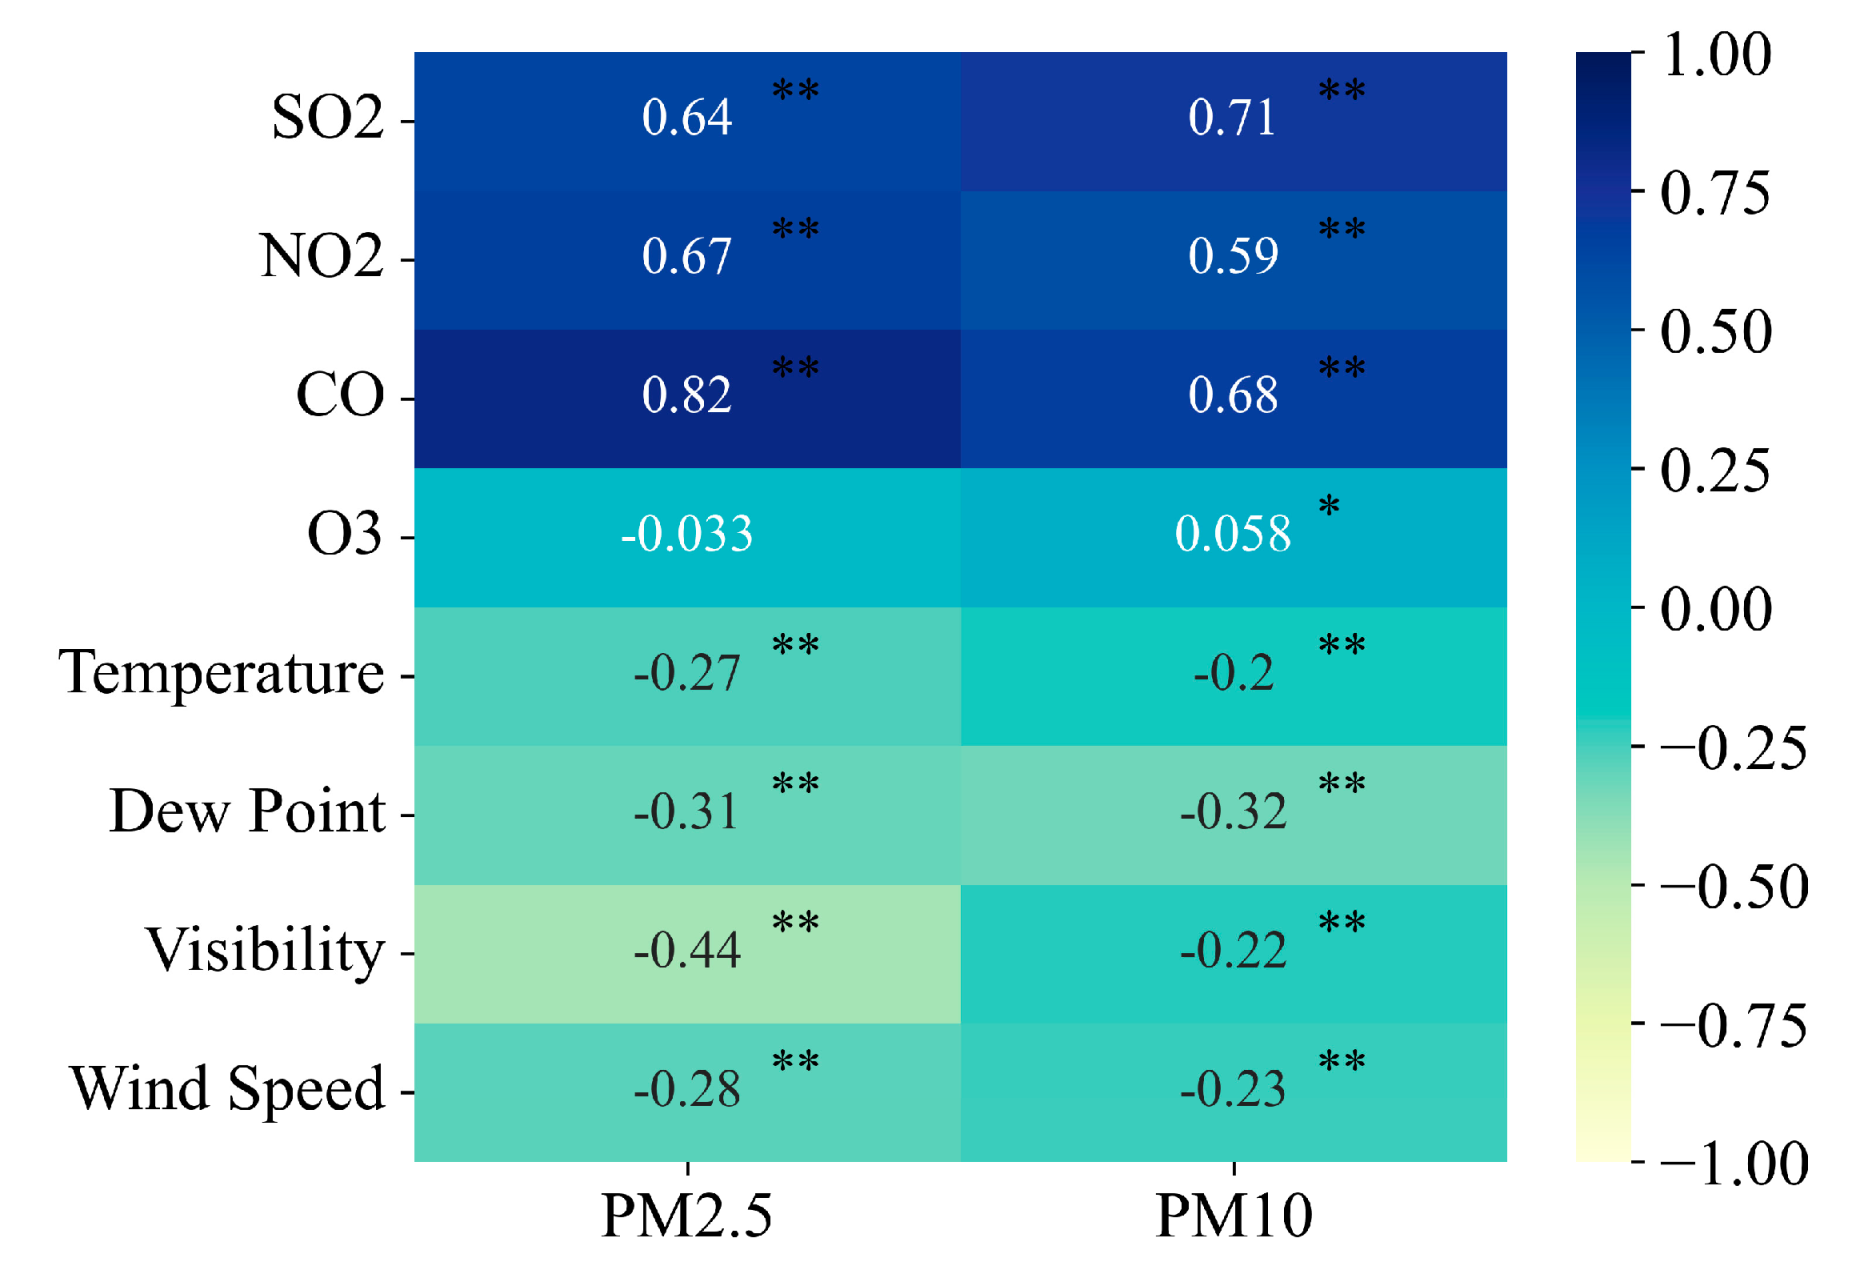
To determine the prediction factors that influence the concentration of PM2.5 and PM10 during the COVID-19 epidemic period, we first classified the factors into two categories, that is, the meteorological parameters, including the temperature, dew point, visibility, wind speed, and other environmental pollutants, including the concentrations of SO2, NO2, CO, and O3. To select the prediction factors with significant influence on the concentrations PM2.5 and PM10, the correlation coefficients between these factors and the concentrations of PM2.5 and PM10 are calculated and analyzed before and during the COVID-19 outbroken. The correlation coefficients are shown in Table A1 and indicated with the confusion matrix in Figure 6 and Figure 7, respectively.
As is shown in Figure 6 and Figure 7, the selected prediction factors are significantly related with the concentrations of PM2.5 and PM10, with the p-values for the seven factors (temperature, dew point, visibility, wind speed, the concentrations of SO2, NO2, and CO) are lower than 0.01. It is noted that there exist substantial connections between O3 and PM2.5 according to Lin Huang’s research [44], although the correlation coefficient for O3 was relatively low compared to those of SO2, NO2, and CO. Public researches indicated that high temperatures and high humidity would lead to the dust to be more active to disperse into the air, and, therefore, increase the concentrations of PM2.5 and PM10 [45]. Furthermore, weak wind is not conducive to the diffusion of air pollutants and usually results in higher concentrations of PM2.5 and PM10 [46]. Therefore, the combination of all these factors will comprehensively influence the concentrations of PM2.5 and PM10. In addition, our study also demonstrated that the correlation coefficients between the concentrations of PM2.5 and PM10 and other air pollutants and various meteorological factors did not change notably during the two different time periods (before the COVID-19 outbroken and during the COVID-19 epidemic), as compared by Figure 6 and Figure 7. Therefore, all factors were selected to predict the concentrations of PM2.5 and PM10 during the COVID-19 epidemic period.

3.3. Analysis of the Predicted PM2.5 and PM10 Concentrations in Shanghai

3.3.1. Data Prediction and Accuracy Analysis

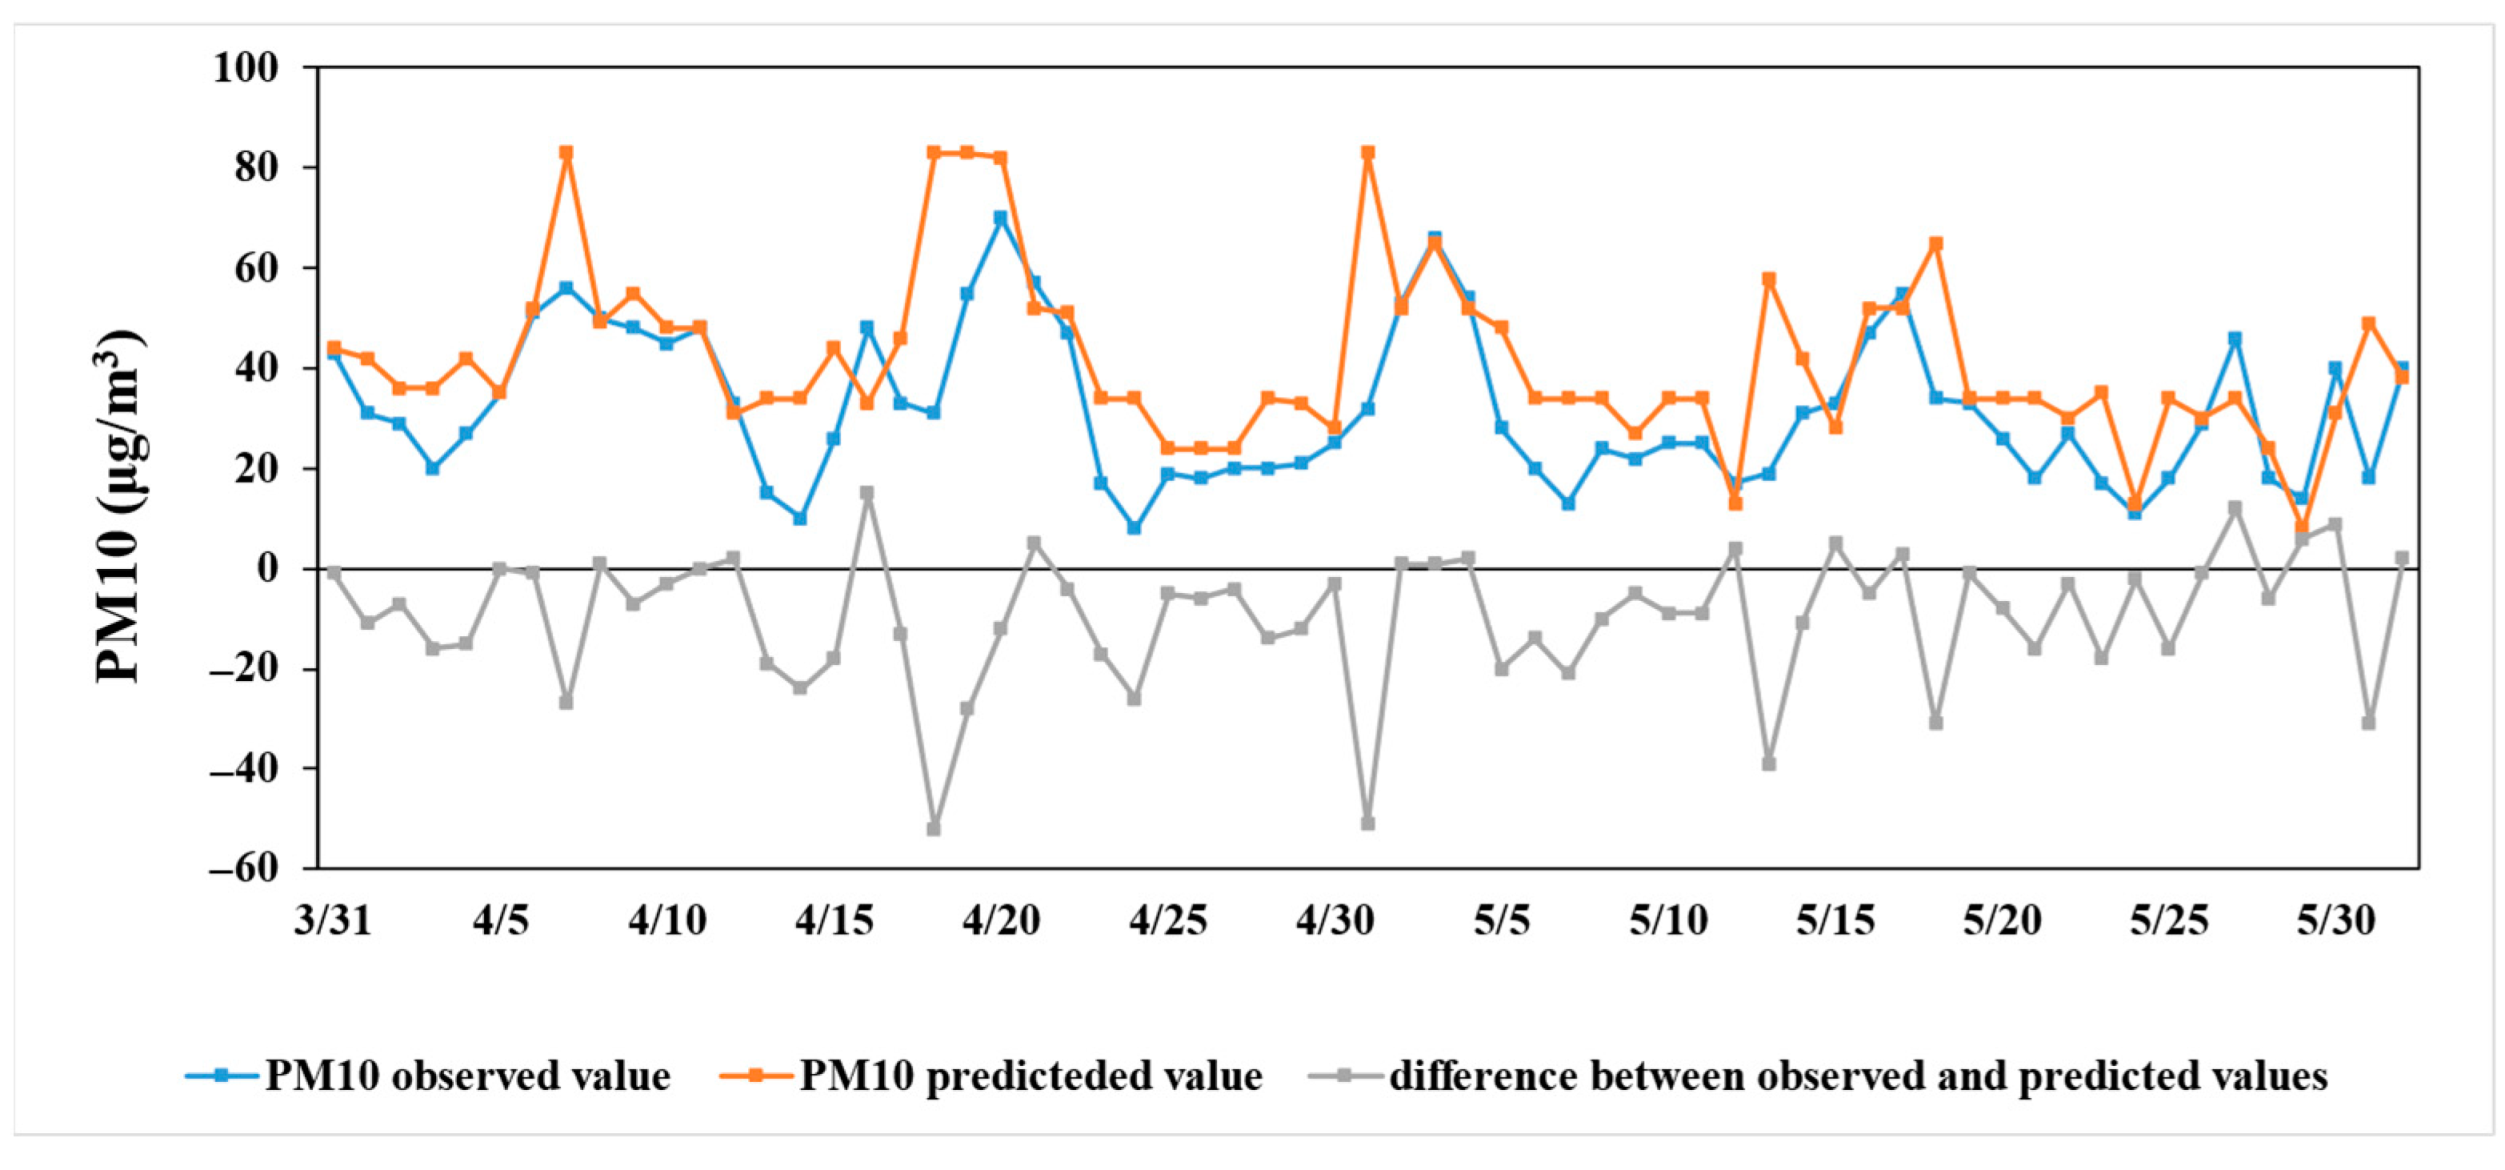
The XGBoost-based prediction model was used to predict concentrations of PM2.5 and PM10 in Shanghai. As for the model with the dependent variable PM2.5, the predictors are the daily concentration data of NO2, CO, SO2, and O3 and daily mean temperature, dew point temperature, visibility, and wind speed data. In terms of the model with the dependent variable is PM10, the predictors are the same as that of PM2.5 prediction. Additionally, the data before the COVID-19 outbreak (2015 to 2019) was set as the training set, which was used to predict the daily PM2.5 and PM10 concentrations during the period of the COVID-19 epidemic (2020 to 2022), and the results of the predicted and observed values were obtained as shown in Figure 8 and Figure 9. Furthermore, the root mean square error (RMSE) and mean absolute error (MAE) of the PM2.5 and PM10 predictions for each year were calculated and are shown in Table 5.
As is shown in Table 5, the root mean square error (RMSE) of PM2.5 predictions for each year are all distributed around 12, which is lower than other PM2.5 prediction accuracy results from existing studies using the same model [39,47,48]. Moreover, the root mean square error (RMSE) and the mean absolute error (MAE) of PM10 predictions for each year are all under 21.4 and 14.3, respectively, which are lower than other PM10 prediction accuracy results using different predicted models like MLR and ANN [49].

3.3.2. Comparison of Predicted and Observed Value during the Lockdown Period in Shanghai

To investigate the effect of COVID-19 lockdown measures in Shanghai on the PM2.5 and PM10 concentrations, statistical comparisons of the differences between predicted and observed concentrations of PM2.5 and PM10 were performed from 31 March to 1 June 2022. The results are presented in Table 6. Furthermore, the difference between the observed and predicted concentrations of PM2.5 and PM10 during the lockdown period are shown in Figure 10 and Figure 11.
As is presented in Table 6, the predicted and observed values of PM2.5 and PM10 differ significantly during the lockdown period, as the p-value were 0.000 and 0.003. From this, we can speculate that lockdown measures have a significant impact on the daily concentration of PM2.5 and PM10. In addition, as is shown in Figure 10 and Figure 11, the majority of predicted PM2.5 and PM10 values were higher than observed values during the lockdown period. It is calculated that the mean value of the subtractive difference between the observed and predicted PM2.5 concentrations is −8.49 μg/m3, and this value is −7.51 μg/m3 for PM10. Moreover, the predicted concentrations of PM2.5 and PM10 in Shanghai were higher by an average of 60.81% and 43.12% per day, respectively compared to the observed values throughout the lockdown period from 31 March to 1 June 2022. Therefore, COVID-19 lockdown measures in Shanghai can be considered to have a positive impact on air quality, which is similar to the findings of some public studies researching the changes in the levels of PM2.5 and PM10 during the lockdown [9,15,17,18,19,20]. However, unlike other studies, our study regarded predicted concentrations of PM2.5 and PM10 during the lockdown period as the concentrations without lockdown measures.

3.3.3. Comparison of Prediction Results with and without Meteorological Predictors

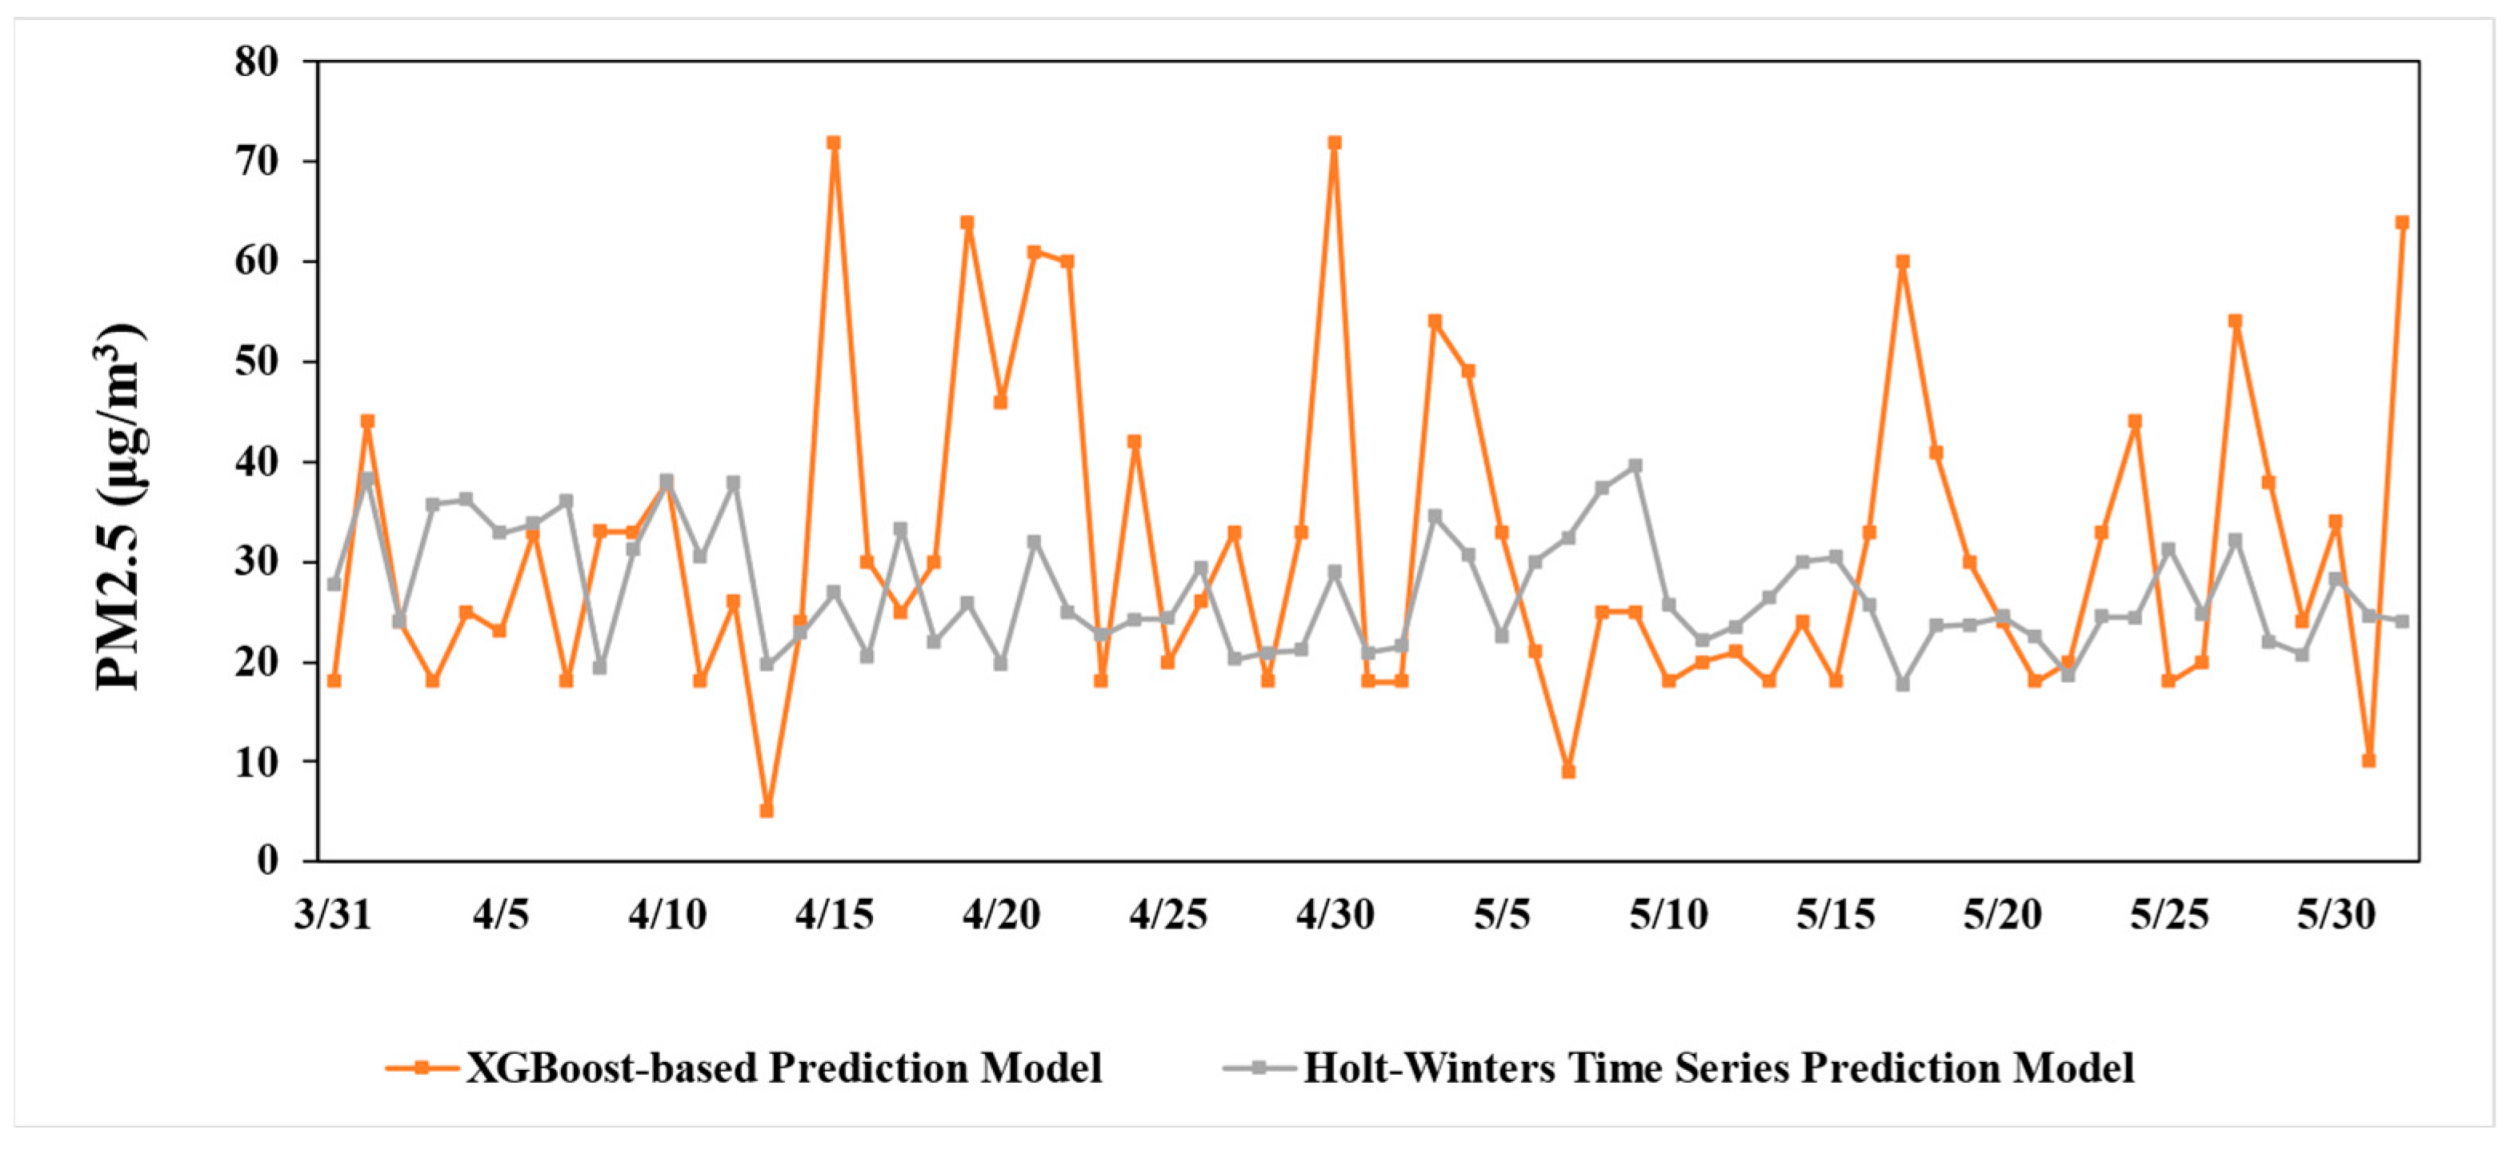
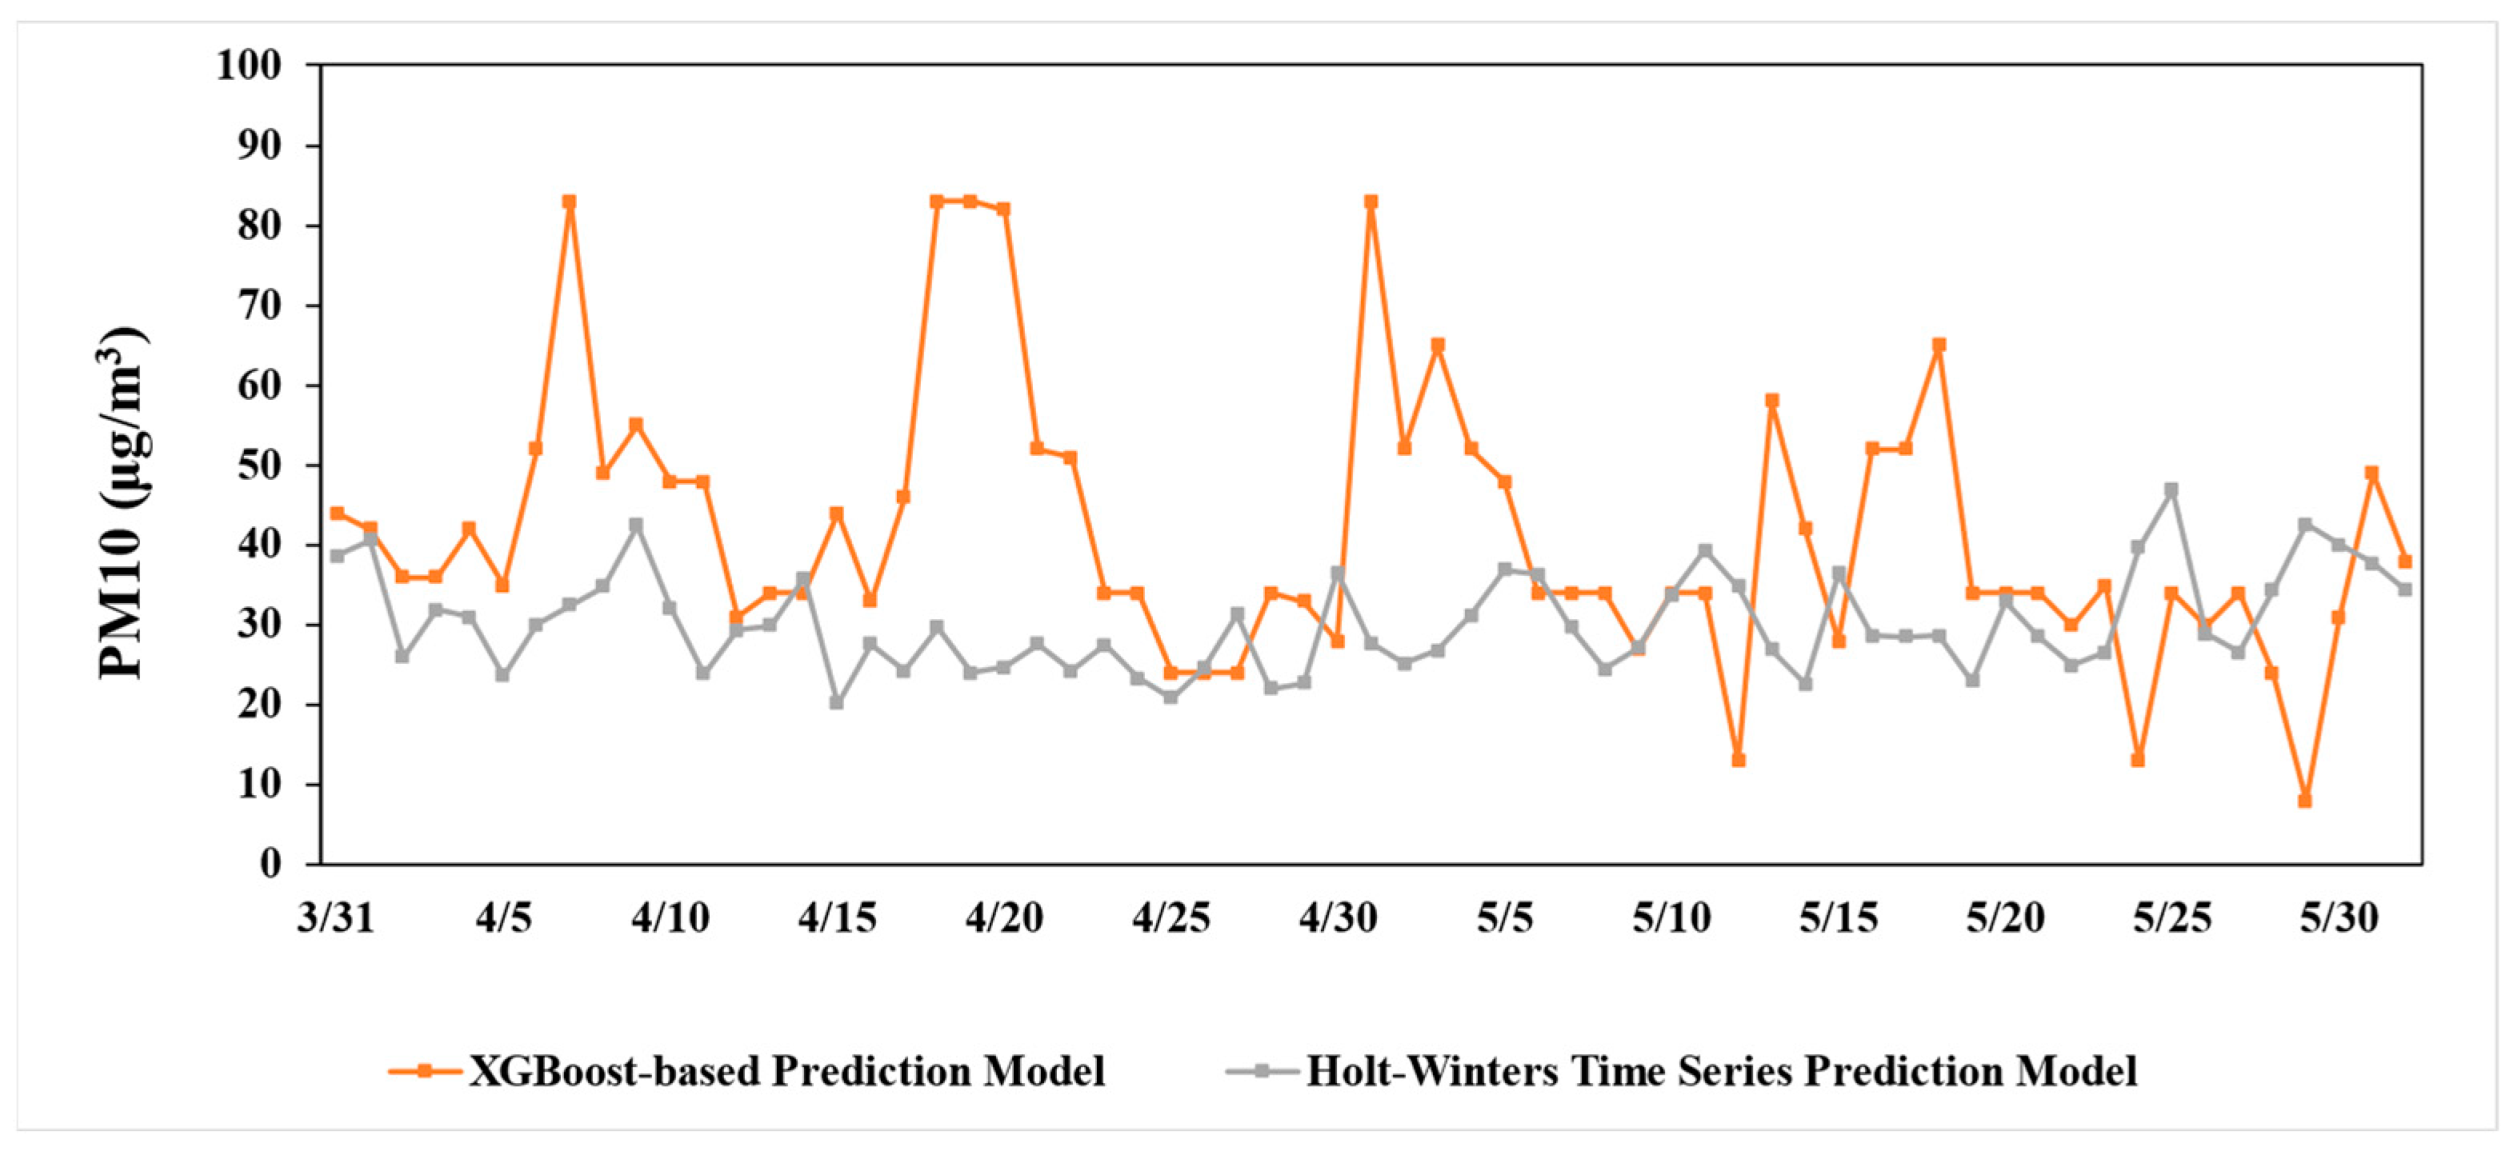
To investigate whether predictors without meteorological factors overestimate or underestimate the impact of the COVID-19 lockdown, Holt-Winters time series exponential smoothing model [50] was used to predict the concentrations of PM2.5 and PM10 during the lockdown period. In the model where the dependent variable is PM2.5, the predictors are the concentrations of PM2.5 before COVID-19 broke out. In the model where the dependent variable is PM10, the predictors are the concentrations of PM10 before COVID-19 broke out. The results of PM2.5 and PM10 predicted values by using different prediction models are shown in Figure 12 and Figure 13. Furthermore, the mean percentage error (MPE) of PM2.5 and PM10 predictions during the lockdown period in Shanghai using XGBoost-based prediction model and Holt-Winters time series prediction model are shown in Table 7.
As is indicated in Figure 12 and Figure 13, the prediction results by using meteorological factors as predictors (XGBoost-based prediction model) have a better presentation of the volatility of daily PM2.5 and PM10 concentrations. It can be noted that most predictions without meteorological predictors are lower than those with meteorological predictors. In addition, as is shown in Table 7, it is calculated that the predicted concentrations of PM2.5 and PM10 without meteorological predictors (Holt-Winters time series prediction model) were higher by an average of 50.20% and 19.06% per day, respectively compared to the observed values throughout the lockdown period from 31 March to 1 June 2022 in Shanghai. In contrast, the predicted concentrations of PM2.5 and PM10 using meteorological predictors (XGBoost-based prediction model) were 60.81% and 43.12% higher on average per day compared to the observed values. Therefore, if the pre-COVID-19 epidemic data were used to predict PM2.5 and PM10 concentrations during the COVID-19 lockdown period without the use of meteorological predictors, the positive impact of the lockdown measures on air quality would be underestimated.

4. Conclusions

This study investigated the ambient air quality changes in Shanghai during the COVID-19 lockdown period. Firstly, by analyzing the air quality during the study period, it was found that the proportion of days with good air quality in the three years of COVID-19 were increased year by year, with 41.27%, 65.08%, and 71.43% in 2020, 2021, and 2022, respectively. Then, based on the proposed XGBoost-based time series prediction model, the concentrations of PM2.5 and PM10 are predicted with the assumption that no COVID-19 lockdown measures were adopted. Thus, by comparing the actual observations during the COVID-19 lockdown period with predicted values, the concentrations of PM2.5 and PM10 were totally reduced by 60.81% and 43.12% in COVID-19 lockdown period (from 31 March to 1 June 2022). Furthermore, in terms of the predicted results without considering meteorological factors, the concentrations of PM2.5 and PM10 during the lockdown period were reduced by 50.20% and 19.06%, respectively, compared to the predicted values during the non-lockdown period. These indicate that the epidemic containment measures have had a positive impact on air quality.
To sum up, this study mainly provides three contributions: (1) quantified the continuous air quality changes and compared air pollution levels before and during the COVID-19 lockdown period in Shanghai; (2) comprehensively utilized the meteorological factors and air pollutant data to predict the concentration of PM in Shanghai during COVID-19 lockdown period in 2022, which has avoided the underestimation of the positive impact of COVID-19 lockdown measures on air quality by considering the meteorological factors; (3) Under the most basic conditions of life, the impact of human activity restrictions on PM provides data support for the future government to formulate environmental governance measures.
However, this paper is limited in some respects. In our future studies, we will try to use larger amounts of PM2.5 and PM10 data in more regions for better model performance. In this work, we only studied the changes in air quality before and during the COVID-19 lockdown period, except for this, our future studies will focus on the air quality changes before, during, and after the lockdown period. Furthermore, we did not consider the variations of PM2.5 or PM10 with specific human factors such as mobility, industry, manufacturing, or residential activity due to the lack of data. Therefore, our future studies will try to investigate correlations between the variations of PM2.5, PM10 and the specific anthropogenic factors.
Author Contributions

Conceptualizations, H.L., Q.Z. (Qi Zhang), Q.Z. (Qian Zhang) and M.L.; methodology, H.L., Q.Z. (Qi Zhang) and Q.Z. (Qian Zhang); software, Q.Z. (Qian Zhang) and Q.Z. (Qi Zhang); validation, Q.Z. (Qian Zhang); formal analysis, Q.Z. (Qi Zhang) and H.L.; investigation, Q.Z. (Qi Zhang), H.L. and Q.Z. (Qian Zhang); resources, M.L. and H.L.; data curation, Q.Z. (Qian Zhang); writing—original draft preparation, Q.Z. (Qi Zhang) and Q.Z. (Qian Zhang); writing—review and editing, H.L. and M.L., visualization, Q.Z. (Qi Zhang); supervision, M.L. and H.L.; project administration, H.L.; funding acquisition, M.L. and H.L. All authors have read and agreed to the published version of the manuscript.

Funding

This research was funded by the National Natural Science Foundation of China, grant number 41871285, the National Natural Science Foundation of China, grant number 52104158, and Open Research Fund of Laboratory of Target Microwave Properties, grant number 2022-KFJJ-005.

Institutional Review Board Statement

Not applicable.

Informed Consent Statement

Not applicable.

Data Availability Statement

The air quality data and meteorological Data utilized in this paper were sourced from the China National Environmental Monitoring Centre (http://106.37.208.233:20035, accessed on 24 October 2022) and the National Climatic Data Center (noaa.gov, accessed on 24 October 2022), respectively.

Acknowledgments

Many thanks to the reviewers for their valuable comments.

Conflicts of Interest

The authors declare that they have no known competing financial interest or personal relationships that could have appeared to influence the work reported in this paper.

Appendix A

Table A1. Correlation coefficients between meteorological factors and other pollutant concentrations with PM2.5 and PM10 concentrations before and during the COVID-19 outbreak.
SO2NO2COO3TemperatureDew PointVISIBWeed Speed
2015–2019PM2.50.636 **0.671 **0.825 **−0.033−0.265 **−0.308 **−0.442 **−0.282 **
PM100.706 **0.592 **0.678 **0.058 *−0.202 **−0.323 **−0.216 **−0.235 **
2020–2022PM2.50.449 **0.638 **0.712 **0.003−0.297 **−0.337 **−0.373 **−0.247 **
PM100.603 **0.557 **0.461 **0.107 **−0.23 **−0.376 **−0.053−0.143 **
* p < 0.05 ** p < 0.01.

References

  1. Xu, X.; Zhao, T.; Liu, F.; Gong, S.; Kristovich, D.; Lu, C.; Guo, Y.; Cheng, X.; Wang, Y.; Ding, G. Climate Modulation of the Tibetan Plateau on Haze in China. Atmos. Chem. Phys. Discuss. 2015, 15, 28915–28937. [Google Scholar] [CrossRef]
  2. Gui, K.; Che, H.; Wang, Y.; Wang, H.; Zhang, L.; Zhao, H.; Zheng, Y.; Sun, T.; Zhang, X. Satellite-Derived PM2.5 Concentration Trends over Eastern China from 1998 to 2016: Relationships to Emissions and Meteorological Parameters. Environ. Pollut. 2019, 247, 1125–1133. [Google Scholar] [CrossRef] [PubMed]
  3. Di Domenico, L.; Pullano, G.; Sabbatini, C.E.; Boëlle, P.-Y.; Colizza, V. Impact of Lockdown on COVID-19 Epidemic in Île-de-France and Possible Exit Strategies. BMC Med. 2020, 18, 240. [Google Scholar] [CrossRef]
  4. Doumbia, T.; Granier, C.; Elguindi, N.; Bouarar, I.; Darras, S.; Brasseur, G.; Gaubert, B.; Liu, Y.; Shi, X.; Stavrakou, T.; et al. Changes in Global Air Pollutant Emissions during the COVID-19 Pandemic: A Dataset for Atmospheric Modeling. Earth Syst. Sci. Data 2021, 13, 4191–4206. [Google Scholar] [CrossRef]
  5. Srivastava, A. COVID-19 and Air Pollution and Meteorology-an Intricate Relationship: A Review. Chemosphere 2021, 263, 128297. [Google Scholar] [CrossRef]
  6. Lin, H.; Liu, T.; Fang, F.; Xiao, J.; Zeng, W.; Li, X.; Guo, L.; Tian, L.; Schootman, M.; Stamatakis, K.A.; et al. Mortality Benefits of Vigorous Air Quality Improvement Interventions during the Periods of APEC Blue and Parade Blue in Beijing, China. Environ. Pollut. 2017, 220, 222–227. [Google Scholar] [CrossRef]
  7. Yu, M.; Zhu, Y.; Lin, C.-J.; Wang, S.; Xing, J.; Jang, C.; Huang, J.; Huang, J.; Jin, J.; Yu, L. Effects of Air Pollution Control Measures on Air Quality Improvement in Guangzhou, China. J. Environ. Manag. 2019, 244, 127–137. [Google Scholar] [CrossRef]
  8. Faridi, S.; Yousefian, F.; Janjani, H.; Niazi, S.; Azimi, F.; Naddafi, K.; Hassanvand, M.S. The Effect of COVID-19 Pandemic on Human Mobility and Ambient Air Quality around the World: A Systematic Review. Urban Clim. 2021, 38, 100888. [Google Scholar] [CrossRef]
  9. Gao, C.; Li, S.; Liu, M.; Zhang, F.; Achal, V.; Tu, Y.; Zhang, S.; Cai, C. Impact of the COVID-19 Pandemic on Air Pollution in Chinese Megacities from the Perspective of Traffic Volume and Meteorological Factors. Sci. Total Environ. 2021, 773, 145545. [Google Scholar] [CrossRef]
  10. Xu, L.; Yang, Z.; Chen, J.; Zou, Z. Impacts of the COVID-19 Epidemic on Carbon Emissions from International Shipping. Mar. Pollut. Bull. 2023, 189, 114730. [Google Scholar] [CrossRef]
  11. Akan, A.P.; Coccia, M. Changes of Air Pollution between Countries Because of Lockdowns to Face COVID-19 Pandemic. Appl. Sci. 2022, 12, 12806. [Google Scholar] [CrossRef]
  12. Yin, Z.; Zhang, Y.; Wang, H.; Li, Y. Evident PM2.5 Drops in the East of China Due to the COVID-19 Quarantine Measures in February. Atmos. Chem. Phys. 2021, 21, 1581–1592. [Google Scholar] [CrossRef]
  13. Otmani, A.; Benchrif, A.; Tahri, M.; Bounakhla, M.; Chakir, E.M.; El Bouch, M.; Krombi, M. Impact of COVID-19 Lockdown on PM10, SO2 and NO2 Concentrations in Salé City (Morocco). Sci. Total Environ. 2020, 735, 139541. [Google Scholar] [CrossRef] [PubMed]
  14. Gama, C.; Relvas, H.; Lopes, M.; Monteiro, A. The Impact of COVID-19 on Air Quality Levels in Portugal: A Way to Assess Traffic Contribution. Environ. Res. 2021, 193, 110515. [Google Scholar] [CrossRef] [PubMed]
  15. Nakada, L.Y.K.; Urban, R.C. COVID-19 Pandemic: Impacts on the Air Quality during the Partial Lockdown in São Paulo State, Brazil. Sci. Total Environ. 2020, 730, 139087. [Google Scholar] [CrossRef]
  16. Berman, J.D.; Ebisu, K. Changes in U.S. Air Pollution during the COVID-19 Pandemic. Sci. Total Environ. 2020, 739, 139864. [Google Scholar] [CrossRef]
  17. Sulaymon, I.D.; Zhang, Y.; Hopke, P.K.; Zhang, Y.; Hua, J.; Mei, X. COVID-19 Pandemic in Wuhan: Ambient Air Quality and the Relationships between Criteria Air Pollutants and Meteorological Variables before, during, and after Lockdown. Atmos. Res. 2021, 250, 105362. [Google Scholar] [CrossRef]
  18. Kumar, S. Effect of Meteorological Parameters on Spread of COVID-19 in India and Air Quality during Lockdown. Sci. Total Environ. 2020, 745, 141021. [Google Scholar] [CrossRef]
  19. Nigam, R.; Pandya, K.; Luis, A.J.; Sengupta, R.; Kotha, M. Positive Effects of COVID-19 Lockdown on Air Quality of Industrial Cities (Ankleshwar and Vapi) of Western India. Sci. Rep. 2021, 11, 4285. [Google Scholar] [CrossRef]
  20. Turek, T.; Diakowska, E.; Kamińska, J.A. Has COVID-19 Lockdown Affected on Air Quality?—Different Time Scale Case Study in Wrocław, Poland. Atmosphere 2021, 12, 1549. [Google Scholar] [CrossRef]
  21. Pala, D.; Casella, V.; Larizza, C.; Malovini, A.; Bellazzi, R. Impact of COVID-19 Lockdown on PM Concentrations in an Italian Northern City: A Year-by-Year Assessment. PLoS ONE 2022, 17, e0263265. [Google Scholar] [CrossRef] [PubMed]
  22. Al-Abadleh, H.A.; Lysy, M.; Neil, L.; Patel, P.; Mohammed, W.; Khalaf, Y. Rigorous Quantification of Statistical Significance of the COVID-19 Lockdown Effect on Air Quality: The Case from Ground-Based Measurements in Ontario, Canada. J. Hazard. Mater. 2021, 413, 125445. [Google Scholar] [CrossRef]
  23. Tie, X.; Huang, R.-J.; Cao, J.; Zhang, Q.; Cheng, Y.; Su, H.; Chang, D.; Pöschl, U.; Hoffmann, T.; Dusek, U.; et al. Severe Pollution in China Amplified by Atmospheric Moisture. Sci. Rep. 2017, 7, 15760. [Google Scholar] [CrossRef] [PubMed]
  24. An, Z.; Huang, R.-J.; Zhang, R.; Tie, X.; Li, G.; Cao, J.; Zhou, W.; Shi, Z.; Han, Y.; Gu, Z.; et al. Severe Haze in Northern China: A Synergy of Anthropogenic Emissions and Atmospheric Processes. Proc. Natl. Acad. Sci. USA 2019, 116, 8657–8666. [Google Scholar] [CrossRef] [PubMed]
  25. Kan, H.; Chen, R.; Tong, S. Ambient Air Pollution, Climate Change, and Population Health in China. Environ. Int. 2012, 42, 10–19. [Google Scholar] [CrossRef] [PubMed]
  26. Shen, L.; Zhao, T.; Wang, H.; Liu, J.; Bai, Y.; Kong, S.; Zheng, H.; Zhu, Y.; Shu, Z. Importance of Meteorology in Air Pollution Events during the City Lockdown for COVID-19 in Hubei Province, Central China. Sci. Total Environ. 2021, 754, 142227. [Google Scholar] [CrossRef]
  27. Zhang, X.; Xu, H.; Liang, D. Spatiotemporal Variations and Connections of Single and Multiple Meteorological Factors on PM2.5 Concentrations in Xi’an, China. Atmos. Environ. 2022, 275, 119015. [Google Scholar] [CrossRef]
  28. Hua, J.; Zhang, Y.; de Foy, B.; Shang, J.; Schauer, J.J.; Mei, X.; Sulaymon, I.D.; Han, T. Quantitative Estimation of Meteorological Impacts and the COVID-19 Lockdown Reductions on NO2 and PM2.5 over the Beijing Area Using Generalized Additive Models (GAM). J. Environ. Manag. 2021, 291, 112676. [Google Scholar] [CrossRef]
  29. Hoque, M.; Ashraf, Z.; Kabir, M.; Nasrin, S. Meteorological Influences on Seasonal Variations of Air Pollutants (SO2, NO2, O3, CO, PM2.5 and PM10) in the Dhaka Megacity. Am. J. Pure Appl. Biosci. 2020, 2, 15–23. [Google Scholar] [CrossRef]
  30. Xiao, Q.; Zheng, Y.; Geng, G.; Chen, C.; Huang, X.; Che, H.; Zhang, X.; He, K.; Zhang, Q. Separating Emission and Meteorological Contributions to Long-Term PM2.5 Trends over Eastern China during 2000–2018. Atmos. Chem. Phys. 2021, 21, 9475–9496. [Google Scholar] [CrossRef]
  31. Kliengchuay, W.; Worakhunpiset, S.; Limpanont, Y.; Meeyai, A.C.; Tantrakarnapa, K. Influence of the Meteorological Conditions and Some Pollutants on PM10 Concentrations in Lamphun, Thailand. J. Environ. Health Sci. Eng. 2021, 19, 237–249. [Google Scholar] [CrossRef]
  32. Xie, Y.; Zhao, B.; Zhang, L.; Luo, R. Spatiotemporal Variations of PM2.5 and PM10 Concentrations between 31 Chinese Cities and Their Relationships with SO2, NO2, CO and O3. Particuology 2015, 20, 141–149. [Google Scholar] [CrossRef]
  33. Li, Y.; Zhu, Y.; Tan, J.Y.K.; Teo, H.C.; Law, A.; Qu, D.; Luo, W. The Impact of COVID-19 on NO2 and PM2.5 Levels and Their Associations with Human Mobility Patterns in Singapore. Ann. GIS 2022, 28, 515–531. [Google Scholar] [CrossRef]
  34. Zamani Joharestani, M.; Cao, C.; Ni, X.; Bashir, B.; Talebiesfandarani, S. PM2.5 Prediction Based on Random Forest, XGBoost, and Deep Learning Using Multisource Remote Sensing Data. Atmosphere 2019, 10, 373. [Google Scholar] [CrossRef]
  35. Pan, B. Application of XGBoost Algorithm in Hourly PM2.5 Concentration Prediction. IOP Conf. Ser. Earth Environ. Sci. 2018, 113, 012127. [Google Scholar] [CrossRef]
  36. Chen, T.; Guestrin, C. XGBoost: A Scalable Tree Boosting System. In Proceedings of the 22nd ACM SIGKDD International Conference on Knowledge Discovery and Data Mining, San Francisco, CA, USA, 13 August 2016; pp. 785–794. [Google Scholar]
  37. Ma, J.; Yu, Z.; Qu, Y.; Xu, J.; Cao, Y. Application of the XGBoost Machine Learning Method in PM2.5 Prediction: A Case Study of Shanghai. Aerosol Air Qual. Res. 2020, 20, 128–138. [Google Scholar] [CrossRef]
  38. Tırınk, S.; Öztürk, B. Evaluation of PM10 Concentration by Using Mars and XGBOOST Algorithms in Iğdır Province of Türkiye. Int. J. Environ. Sci. Technol. 2022, 20, 5349–5358. [Google Scholar] [CrossRef]
  39. Coccia, M. Sources, Diffusion and Prediction in COVID-19 Pandemic: Lessons Learned to Face next Health Emergency. AIMSPH 2023, 10, 145–168. [Google Scholar] [CrossRef]
  40. Coccia, M. Pandemic Prevention: Lessons from COVID-19. Encyclopedia 2021, 1, 433–444. [Google Scholar] [CrossRef]
  41. US Department of Commerce, N. Air Quality Index. Available online: https://www.weather.gov/safety/airquality-aqindex (accessed on 29 April 2023).
  42. Pan, S.; Du, S.; Wang, X.; Zhang, X.; Xia, L.; Liu, J.; Pei, F.; Wei, Y. Analysis and Interpretation of the Particulate Matter (PM10 and PM2.5) Concentrations at the Subway Stations in Beijing, China. Sustain. Cities Soc. 2019, 45, 366–377. [Google Scholar] [CrossRef]
  43. Myers, J.L.; Well, A. Research Design and Statistical Analysis, 2nd ed.; Lawrence Erlbaum Associates: Mahwah, NJ, USA, 2003; ISBN 978-0-8058-4037-7. [Google Scholar]
  44. Huang, L.; Sun, J.; Jin, L.; Brown, N.J.; Hu, J. Strategies to Reduce PM2.5 and O3 Together during Late Summer and Early Fall in San Joaquin Valley, California. Atmos. Res. 2021, 258, 105633. [Google Scholar] [CrossRef]
  45. Le, T.; Wang, Y.; Liu, L.; Yang, J.; Yung, Y.L.; Li, G.; Seinfeld, J.H. Unexpected Air Pollution with Marked Emission Reductions during the COVID-19 Outbreak in China. Science 2020, 369, 702–706. [Google Scholar] [CrossRef] [PubMed]
  46. Su, Z.; Duan, Z.; Deng, B.; Liu, Y.; Chen, X. Impact of the COVID-19 Lockdown on Air Quality Trends in Guiyang, Southwestern China. Atmosphere 2021, 12, 422. [Google Scholar] [CrossRef]
  47. Gui, K.; Che, H.; Zeng, Z.; Wang, Y.; Zhai, S.; Wang, Z.; Luo, M.; Zhang, L.; Liao, T.; Zhao, H.; et al. Construction of a Virtual PM2.5 Observation Network in China Based on High-Density Surface Meteorological Observations Using the Extreme Gradient Boosting Model. Environ. Int. 2020, 141, 105801. [Google Scholar] [CrossRef]
  48. Fan, Z.; Zhan, Q.; Yang, C.; Liu, H.; Bilal, M. Estimating PM2.5 Concentrations Using Spatially Local Xgboost Based on Full-Covered SARA AOD at the Urban Scale. Remote Sens. 2020, 12, 3368. [Google Scholar] [CrossRef]
  49. Taheri Shahraiyni, H.; Sodoudi, S. Statistical Modeling Approaches for PM10 Prediction in Urban Areas; A Review of 21st-Century Studies. Atmosphere 2016, 7, 15. [Google Scholar] [CrossRef]
  50. Chatfield, C. The Holt-Winters Forecasting Procedure. Appl. Stat. 1978, 27, 264. [Google Scholar] [CrossRef]
Figure 1. Spatial distribution of the Shanghai and monitoring stations (period under study: 1 January 2015 to 1 June 2022).
Atmosphere 14 00898 g001
Figure 2. Flow chart of the proposed XGBoost-based prediction model.
Atmosphere 14 00898 g002
Figure 3. Model flowchart and data analysis procedure.
Atmosphere 14 00898 g003
Figure 4. Changes in air quality in Shanghai during the lockdown period (31 March to 1 June) from 2015 to 2019 with three different air quality levels.
Atmosphere 14 00898 g004
Figure 5. Changes in air quality in Shanghai during the lockdown period (31 March to 1 June) from 2020 to 2022 with three different air quality levels.
Atmosphere 14 00898 g005
Figure 6. Map of the correlation coefficients between the PM2.5 and PM10 concentration values and meteorological factors and other pollutant concentrations before the COVID-19 outbreak (2015 to 2019) in Shanghai, with ** denotes that p-value is lower than 0.01, * indicates that p-value is lower than 0.05, no * indicates that p-value is higher than 0.05.
Atmosphere 14 00898 g006
Figure 7. Map of the correlation coefficients between the PM2.5 and PM10 concentration values and meteorological factors and other pollutant concentrations after the COVID-19 outbreak (2020 to 2022) in Shanghai, with ** denotes that p-value is lower than 0.01, no * indicates that p-value is higher than 0.05.
Atmosphere 14 00898 g007
Figure 8. Predicted and observed PM2.5 values during the period of COVID-19 epidemic (2020 to 2022) in Shanghai.
Atmosphere 14 00898 g008
Figure 9. Predicted and observed PM10 values during the period of COVID-19 epidemic (2020 to 2022) in Shanghai.
Atmosphere 14 00898 g009
Figure 10. Difference between the observed and predicted PM2.5 values during the lockdown period in Shanghai.
Atmosphere 14 00898 g010
Figure 11. Difference between the observed and predicted PM10 values during the lockdown period in Shanghai.
Atmosphere 14 00898 g011
Figure 12. PM2.5 predictions during the lockdown period in Shanghai by using two different prediction models.
Atmosphere 14 00898 g012
Figure 13. PM10 predictions during the lockdown period in Shanghai by using two different prediction models.
Atmosphere 14 00898 g013
Table 1. The different periods employed in this study for the prevalence of COVID-19 in Shanghai.
PeriodsPrevalence Control of COVID-19 in Shanghai
1 January 2015–31 December 2019Period before COVID-19
1 January 2020–1 June 2022Period during COVID-19
31 March 2022–1 June 2022COVID-19 lockdown period
Table 2. Descriptive statistics of air quality data.
ParameterUnitRangeAverageSt. Dev.
AQI [10, 270]61.9632.19
PM2.5μg/m3[2, 219]37.3926.12
PM10μg/m3[6, 308]52.0731.47
NO2μg/m3[4, 142]39.5618.81
COmg/m3[0.31, 2.21]0.710.24
SO2μg/m3[3, 74]9.316.20
O3μg/m3[8, 178]70.5728.73
Table 3. Air Quality Index Scale and Color Legend.
Levels of ConcernValues of Index
Good0~50
Moderate51~100
Unhealthy for Sensitive Groups101~150
Unhealthy151~200
Table 4. Numbers and percentages of days with different air quality levels in the lockdown period (31 March to 1 June) in Shanghai from 2015 to 2022.
YearGood/dayProportionModerate/dayProportionUnhealthy for Sensitive Groups/dayProportionUnhealthy/dayProportion
20224571.43%1828.57%00.00%00.00%
20214165.08%1828.57%46.35%00.00%
20202641.27%3555.56%23.17%00.00%
20191015.87%4876.19%57.94%00.00%
20181015.87%4165.08%1219.05%00.00%
2017812.70%4876.19%711.11%00.00%
2016812.70%4063.49%1219.05%34.76%
201569.52%4977.78%711.11%11.59%
Table 5. Evaluation of the prediction results for each year during the COVID-19 epidemic.
YearRMSEMAE
PM2.5202212.1048.590
202111.8438.419
202011.7058.691
PM10202217.39012.545
202121.42314.249
202017.44811.935
Table 6. Statistical comparisons of the differences between predicted and observed concentrations during the lockdown period, with * indicates that p-value is lower than 0.05.
Zp
PM2.5−3.8210.000 *
PM10−3.0000.003 *
Table 7. The mean percentage error (MPE) of PM2.5 and PM10 predictions during the lockdown period in Shanghai by two different prediction models.
XGBoost-Based
Prediction Model
Holt-Winters Time Series Prediction Model
PM2.560.81%50.20%
PM1043.12%19.06%
Disclaimer/Publisher’s Note: The statements, opinions and data contained in all publications are solely those of the individual author(s) and contributor(s) and not of MDPI and/or the editor(s). MDPI and/or the editor(s) disclaim responsibility for any injury to people or property resulting from any ideas, methods, instructions or products referred to in the content.