Article

Climate Variability and Trends in Imotski, Croatia: An Analysis of Temperature and Precipitation

1
Faculty of Civil Engineering, Architecture and Geodesy, Split University, Matice hrvatske 15, 21000 Split, Croatia
2
Faculty of Mining, Geology and Civil Engineering, University of Tuzla, Univerzitetska 2, 75000 Tuzla, Bosnia and Herzegovina
*
Author to whom correspondence should be addressed.
Atmosphere 2023, 14(5), 861; https://doi.org/10.3390/atmos14050861
Submission received: 6 April 2023 / Revised: 25 April 2023 / Accepted: 10 May 2023 / Published: 11 May 2023

Abstract

:
This paper examines the long-term changes in temperature and precipitation in the karst region of Imotski, Croatia, which is of particular interest due to its abundance of karst phenomena. This study analyses temperatures and precipitation on monthly and annual scales at two climatological stations in the region, Imotski and Ričice. Linear regression, the Theil–Sen estimator (β), and the Mann–Kendall test were used to determine the trends and statistical significance. The homogeneity of the data was checked using the Standard Normal Homogeneity Test (SNHT), and the F-test and t-test were used to test the significance of the mean shift between the two subseries. Additionally, the coefficient of variability, standardized rainfall anomaly, and precipitation concentration index were employed to analyze the precipitation variability. The study found a statistically significant (p < 0.05) upward trend in the mean (β = 0.0437) and maximum (β = 0.0590) annual air temperature at the Imotski station and the mean (β = 0.0387) annual temperature at the Ričice station. The SNHT test showed a statistically significant (p < 0.05) shift in the mean annual temperatures after 2007 and maximum annual temperatures after 1998 at the Imotski station. Similarly, a statistically significant (p < 0.05) shift in the mean annual temperatures after 2011 and the maximum annual temperatures after 1998 was found at the Ričice station. A seasonal distribution of precipitation is observed at both the Ričice and Imotski stations, with a downward trend (β = −2.7693) at Ričice and an upward trend (β = 6.0575) at Imotski; however, neither trend is statistically significant (p > 0.05). An increase in the intensity of dry periods and the occurrence of extreme events was also noted. The climatological analysis, conducted for the first time in this area, is a crucial step toward understanding local climate patterns and making informed decisions toward sustainable development and adaptation strategies.

1. Introduction

Climate change is one of the major contemporary environmental issues that can increase the risk of exposure to disasters by changing the dynamics of the frequency and intensity of climate-related hazards, affecting vulnerability, and altering exposure patterns [1]. The detection of climate-induced changes is only possible with an adequate monitoring network with sufficiently long observation series and with the analysis of the spatiotemporal trend of key meteorological variables. The analysis of temperatures and precipitation is therefore the first step in understanding the progression of climate change and its impact on the hydrological cycle.
The high sensitivity of the hydrological cycle to climate change is particularly evident in the Mediterranean region, which is considered one of the major hotspots of climate change [2,3,4,5]. High sensitivity is a consequence of the geographical position in the transition zone between the temperate climate of the mid-latitudes and the hotter North African climate [2,5,6]. Local factors resulting from the topography of the terrain, orography, and distance from the sea further increase the sensitivity and local and regional differences. Analyses of observation-based data indicate that in the past half-century, the Mediterranean region has experienced a trend toward warmer and drier conditions, with a corresponding rise in the frequency of extreme events [2,5,7,8]. Statistically significant warming trends are found in most of the subcontinental regions studied by Giorgi [9], including the Mediterranean, where the regional temperature trends are characterized by pronounced interdecadal variability. The analysis of five pilot sites, namely, Portugal, Spain, Tunisia, Greece, and Turkey, also revealed positive temperature trends in all the areas studied [8]. Except for Greece, all the observed temperature trends were statistically significant. Thus, the Mediterranean region is currently experiencing temperature increases above the global average, with the largest changes occurring in the warm temperature extremes [5,10,11]. As a result of the increase in the air temperatures and evaporation, and the decrease in the runoff, droughts have become more frequent and intense.
However, the trend in precipitation in the Mediterranean region varies greatly depending on the location of the observation site within the basin [7]. An analysis of 40 stations [12] showed a decrease in the annual precipitation in the western, central, and eastern Mediterranean, and an increase in northern Africa, southern Italy, and the western Iberian Peninsula, consistent with the conclusions of Todaro et al. [8]. According to Mariotti et al. [13], the trend of the mean annual precipitation has decreased by 0.6 × 10⁻² mm/day/decade in the last century throughout the Mediterranean region. Increased interannual variability and large spatial variability of precipitation are observed in most Mediterranean regions [5,9,11]. Predictions also suggest a decrease of 4–22% in most areas, depending on the emission scenario [7]. In addition to the expected decrease in precipitation, heat waves and droughts are also expected to increase, as is precipitation variability [5,14].
As in the Mediterranean region, three predominant processes of climate change occur in Croatia, including the increase in average temperature, the decrease in precipitation, and more frequent and severe extreme weather events. A more pronounced increase in air temperature occurred in the 20th century [15,16,17], and according to Bonacci [18,19], a sudden increase was recorded already after 1988. The increase in air temperature is more pronounced on the coast than inland [15]. The decadal increase in air temperature was in the range from 0.04 °C to 0.08 °C until 2004, and between 0.05 °C and 0.10 °C until 2008 [17]. The observed trends of the increase in mean annual air temperatures were statistically significant at all analyzed stations except at the Osijek station [17]. The largest contribution to the increase in mean annual air temperatures is the result of changes in the warm-season temperatures on the coast and changes in the winter temperatures inland [15,17].
The variability of annual precipitation shows a decrease in northwestern Croatia, mountainous regions, and northern coastal areas, and an increase in the eastern lowlands and Dalmatian islands [20,21,22]. The negative trend is most pronounced on the northeast coast of the Adriatic [20]. The analysis of changes in the precipitation regime at four Croatian meteorological stations (Split, Hvar, Lastovo, and Zagreb) has shown a decrease in the number of days per year with precipitation, and an increase in the number of days with intense precipitation at all analyzed stations, as well as a redistribution of precipitation throughout the year [21]. This is evidence of the great variability of precipitation at the regional level, which is further supported by the division of Croatia into thirteen precipitation zones based on the vertical gradient of precipitation and the base potential of precipitation [23]. Despite the downward trend in annual precipitation, according to Gajić-Čapka et al. [23], there is no evidence of major secular changes in precipitation extremes.
This paper studies the changes in temperature and precipitation in the karst region of Imotski. Since climatological data have not been previously analyzed in this area, this analysis will contribute to a better understanding of local climate patterns by providing valuable information on the long-term trends and variations in climate factors affecting the local environment. The analyses performed over the period of 40 years (1981–2021) and 28 years (1993–2021) aim to detect non-stationarity (trends, jumps, and seasonality) in the temperature and precipitation regime on two time scales (month and year). The goal is to identify climate trends that can assist in addressing the significant challenge of managing karst aquifers and developing effective management strategies in light of climate change. Climate change has the potential to affect climate patterns at various scales, including local, regional, and global, and may result in climate-related hazards such as droughts, floods, reduced water availability, and damage to various sectors. Considering the importance of Imotski and its surroundings due to their rich karst phenomena, such as the Blue and Red Lakes, the identification of climatic changes could play a crucial role in the hydrological cycle of the area. Among other things, water from the nearby Opačac Spring serves as a water supply for the entire region, and the availability and abundance of the spring may be threatened by climate change. In addition, there are also hydropower plants in the area where a reduction in river discharge may result in a reduced power supply. The decrease in precipitation and water scarcity may also have a negative impact on agriculture. This study will provide an initial assessment of the changes taking place and serve as a starting point for assessing the risk of climate change impacts at the local and regional scales as there is a lack of previous literature on climate trends in the area studied.

2. Materials and Methods
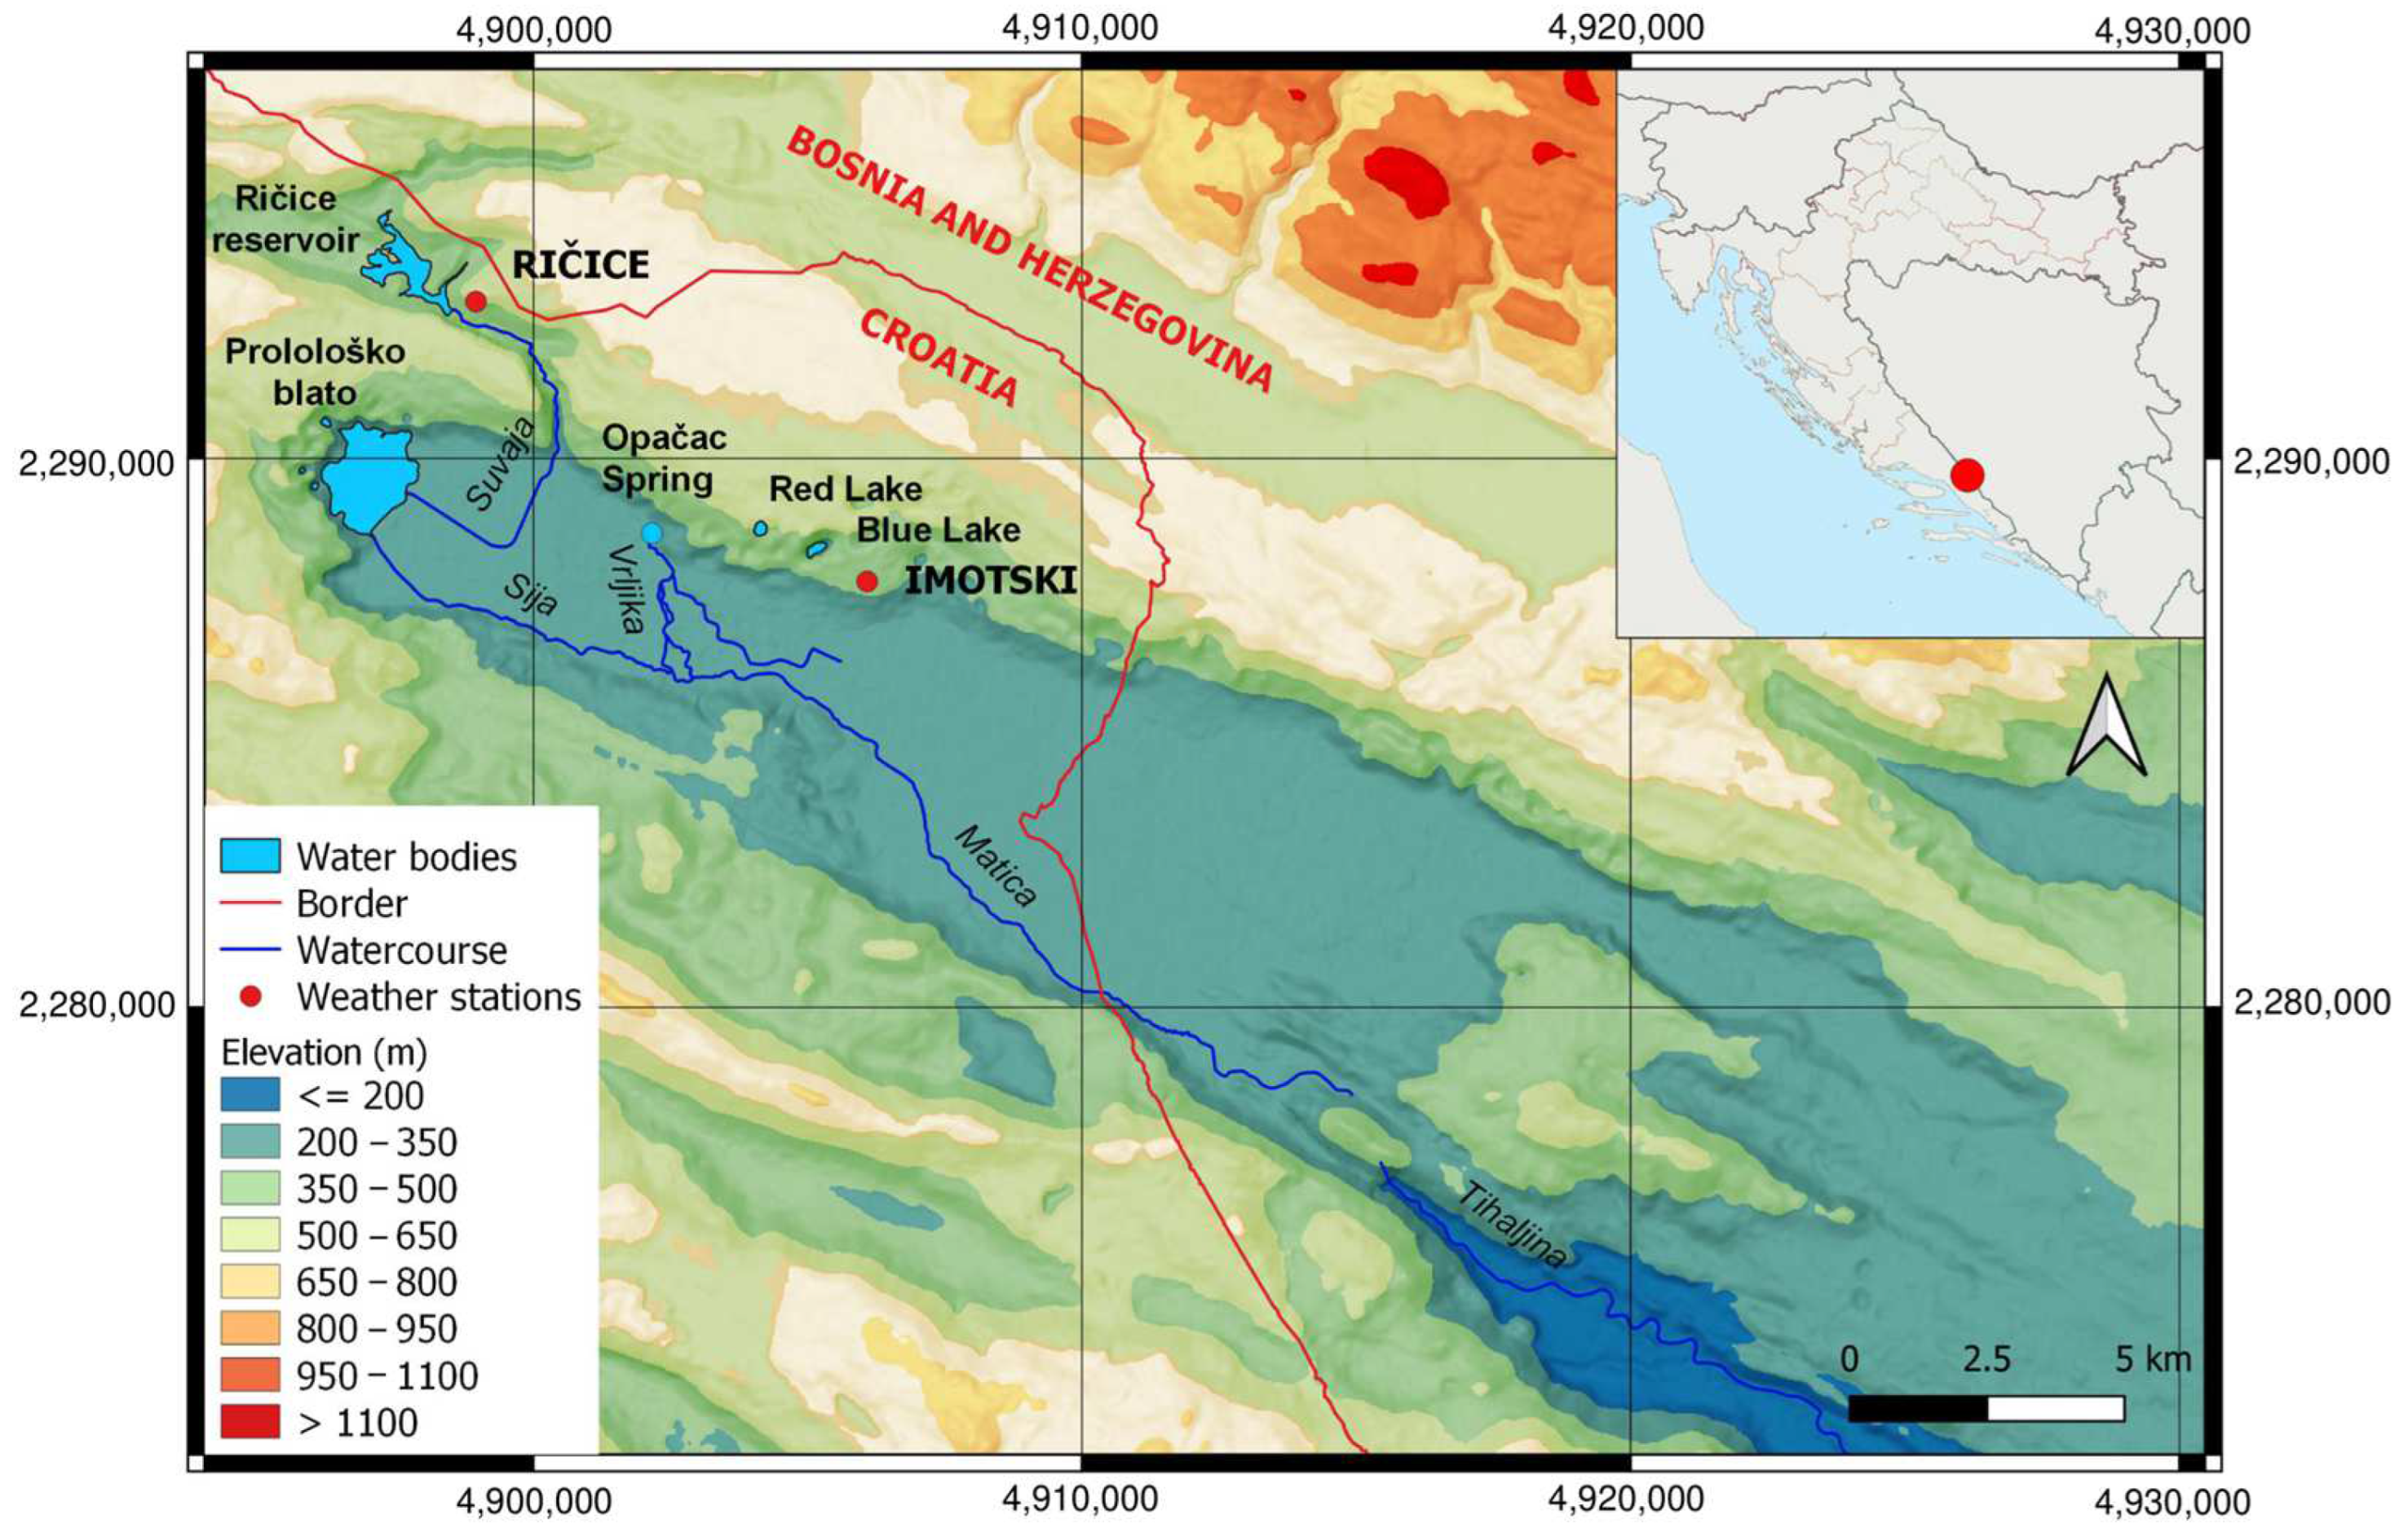
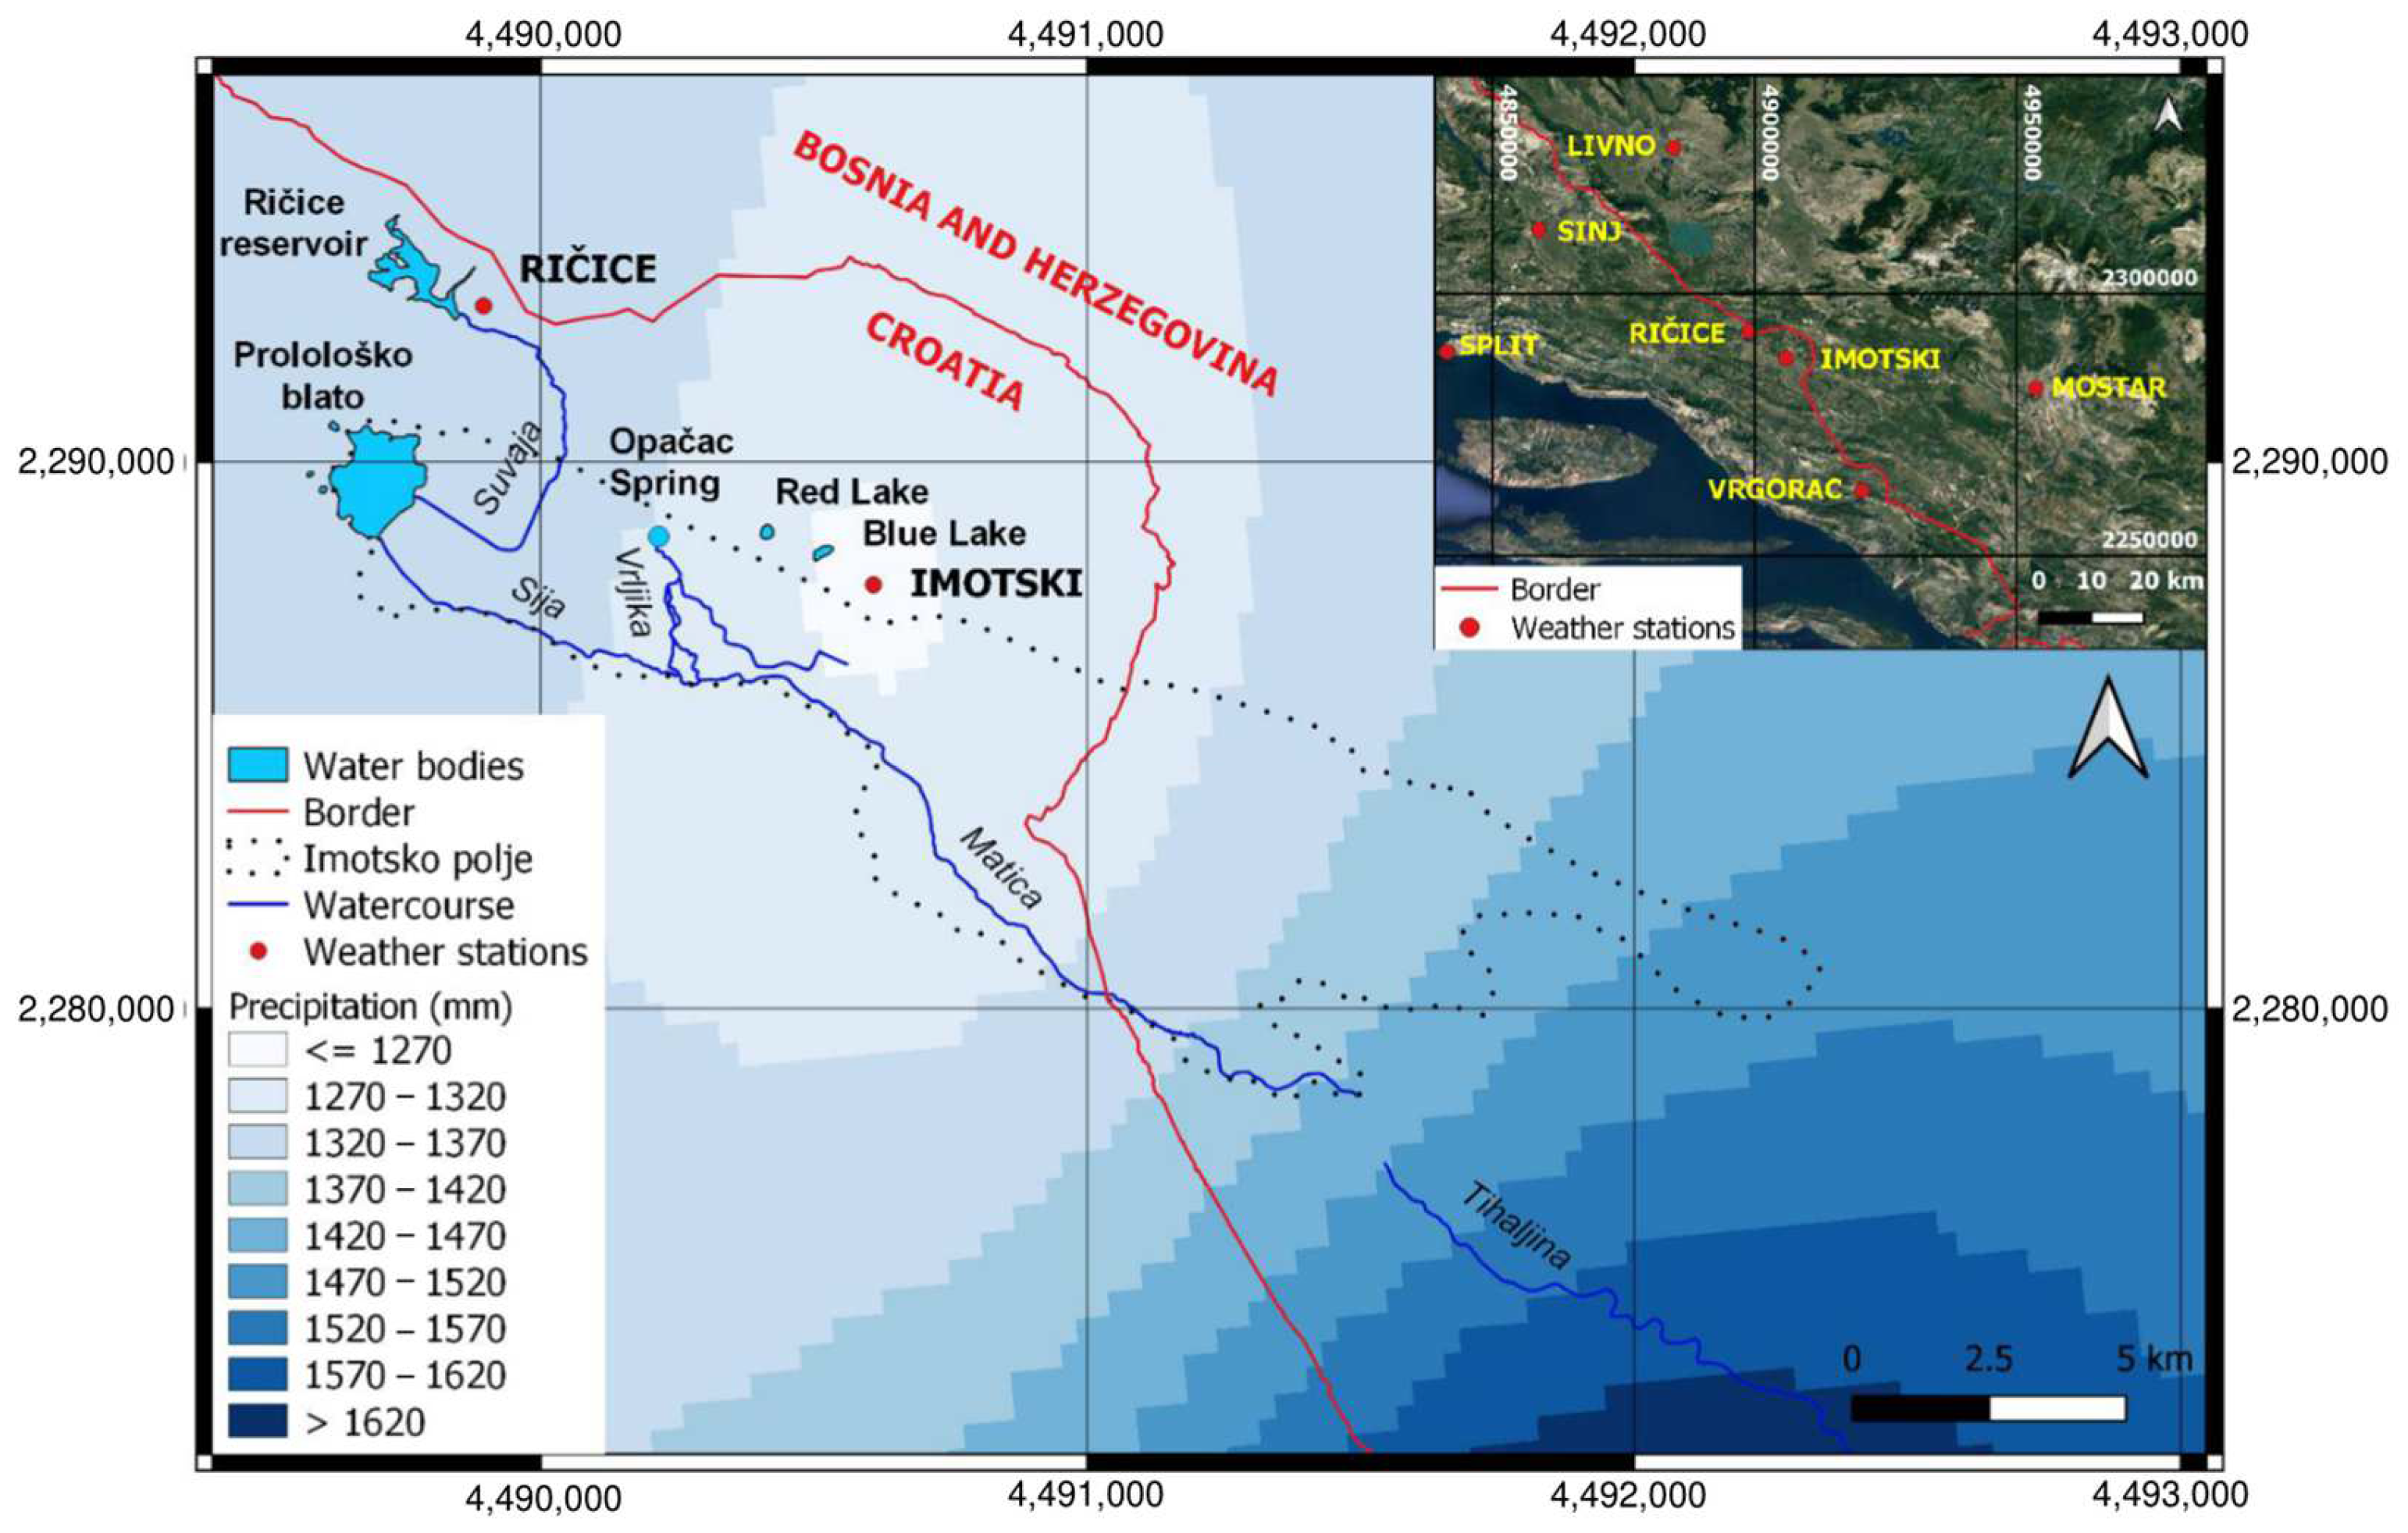
2.1. Study Area

The study is based on the analysis of data from the Croatian Meteorological and Hydrological Service for the two climatological stations, Imotski and Ričice (Figure 1). The climatological station Imotski is located in the center of the small town of Imotski (LAT: 43°26′41″, LON: 17°13′17″) at an altitude of 399 m above sea level. The other station, Ričice, is about 920 m air distance from Imotski station and is located near the Ričice reservoir (LAT: 43°29′48″, LON: 17°8′2″) at an altitude of 402 m above sea level. These two stations are the only climate observatories in the wider area of Imotsko Polje, our area of research interest. Imotsko Polje is an example of a polje in the karst, surrounded by the Biokovo Mountains to the southwest and the Dinaric Alps to the northeast. This particular geographical position and relief provide unique climatic characteristics with often strong diurnal air temperature fluctuations, as well as the occurrence of temperature inversions, which are particularly evident in valleys such as Imotsko Polje. In the scientific literature published so far, no long-term analysis of climatological parameters in the area has been carried out.
The study area can be divided into a higher NE karst plateau consisting of permeable carbonate rocks, mainly Upper Cretaceous limestone, and an area of Imotsko Polje with mainly alluvial deposits, ending with impermeable rocks in the south of the Sija and Matica rivers [24,25,26]. Due to the highly karstified carbonate rocks, the area is rich in karst features—dolines, collapsed doline, caves, etc. There are no surface streams in the karst plateau, and due to the high degree of karstification, most precipitation infiltrates, feeding the karst aquifer. The boundaries of the catchment area and the directions of groundwater circulation are unknown [25,27], but it is known that the karst aquifer is fed from wider areas that also include streams and reservoirs in Bosnia and Herzegovina [25,28,29]. Tracer tests have proven the connection between the Ričice reservoir and the spring in the Polje [25]. Thus, the water from the higher karst plateau and also from the Ričice reservoir occurs in Polje in the springs or in the surface stream Vrljika [25]. This is evidence of the extraordinary interdependence of surface and subsurface flow and, finally, of the extremely complex water circulation in karst, especially in this area of highly karstified rocks.
The climate is Mediterranean with continental influence, and according to the Köppen–Geiger [30] climate classification, it belongs to class Cfb, a temperate climate without dry seasons and with warm summers. The most famous phenomena are the Blue and Red Lakes, collapsed dolines, but also natural piezometers, as the oscillations of the water level follow the fluctuations of the groundwater level in the karst aquifer [25]. Opačac, which supplies water to the Imotski region, is the most important spring.

2.2. Data

This paper analyzes monthly and annual temperatures, and monthly and annual total precipitation observed at the Imotski and Ričice climatological stations of the Croatian Meteorological and Hydrological Service (DHMZ). All data used in this paper are official data from Croatian Meteorological and Hydrological Service (DHMZ) and Federal Hydro-Meteorological Institute (FHMZ) in Bosnia and Herzegovina, for which we express our gratitude. The primary focus is on the analysis of temperatures and precipitation at the Imotski and Ričice stations, but data from nearby stations were also considered to further discuss spatial precipitation variability and interdependence between stations.
The observation period for the Imotski station is the period from 1981 to 2021, while the observation period for the Ričice station is somewhat shorter, covering 1993 to 2021. For the Imotski station, the annual mean temperatures for 2004 and 2020, and the annual minimum temperatures for 2008 and 2020 are missing, while the annual maximum temperatures are complete. The series of annual minimum temperatures for the Ričice station is complete, while the annual mean and maximum temperatures for 1993 are missing. Methods of measuring daily mean temperatures and temperature extremes vary, resulting in inconsistent gaps in the data.
The mean annual temperature is the average of the mean monthly temperatures, while the mean monthly temperatures are the average of the mean daily temperatures. The mean daily temperature is calculated according to the expression [31,32,33,34,35] used in some central and eastern European countries (e.g., Croatia, Slovenia, Serbia) as follows:
T m e a n , d a i l y = ( T 7 + T 14 + 2 · T 21 ) / 4 ,
where T7, T14, and T21 are temperatures measured at 7, 14, and 21 h (local time). The equation in use today is over a century old and was formulated based on the assumptions and understanding of that time [32,36].
Daily minimum and maximum temperatures are read using minimum and maximum thermometers in the meteorological station at 2 m above the ground. The readings are taken at 9 h (local time) and refer to the period from 9 p.m. of the previous day to 9 p.m. of the day on which they are recorded, i.e., the last 24 h.

2.3. Homogeneity of Data and Differences between Two Time Series

The homogeneity of the data was tested using the Standard Normal Homogeneity Test (SNHT) [37]. The SNHT tests the null hypothesis that the tested values are independent and identically distributed, and the alternative hypothesis that there is a break in the time series, i.e., that a stepwise shift in the mean occurs [38]. The test can determine the probable year of break and is therefore called a location-specific test [39].
If there is a mean shift between two subseries, the significance of the mean shift is tested using the F-test and the t-test. The F-test is a statistical test used to test the null hypothesis that two normal populations have the same variance. The t-test, on the other hand, is used to determine if there is a significant difference between the means of the two groups. In both tests, the value of p < 0.05 was chosen as the level of the significance of differences.

2.4. Trend and Variability Analysis

A variety of techniques were used in the data analysis to identify trends, analyze variability, and determine the frequency of occurrence of extreme values.
Trends are represented by the direction of linear regression. Each direction is defined by the following expression:
y = a · t + b ,
where y is variable of interest (air temperature in °C or precipitation in mm), t is a time label, a is the slope of the line, and b is the y-intercept. The sign of the coefficient a indicates the trend (falling or rising). The strength of the linear relationship between the variables t and y is indicated by the square of the Pearson correlation coefficient R2.
Two nonparametric tests for trend detection were used to analyze potential trends in time series data; the Theil–Sen (TS) estimator [40] was used to determine the slopes of trends, and the Mann–Kendall (MK) test [41,42] was used to assess statistical significance. The advantage of using nonparametric tests is that they do not require distributional fitting and the estimators are not susceptible to the influence of extreme values (outliners) that are common in meteorological data [43,44]. The MK test compares the null hypothesis that there is no trend in time series with the alternative hypothesis that there is a trend. In this work, a modified Mann–Kendall test for Matlab [45] was used, which takes into account the modification of Hamed and Ramachandra Rao [46] regarding the presence of autocorrelation in the data. The statistical significance of the trends was examined at a 95% confidence level. If a linear trend is present, the magnitude of the monotonic trend in the time series is estimated using the Theil–Sen estimator. The magnitude of the trend (β) is equal to the median of the slope values between values xi and xj at time steps i and j as follows:
β = m e d i a n [ ( x j - x i ) / ( j - i ) ] , i < j ,
The value of the magnitude of the trend indicates its steepness, while its sign indicates whether the trend is increasing or decreasing.
Rainfall variability was analyzed using the coefficient of variability (CV), the standardized rainfall anomaly (SRA), and the precipitation concentration index (PCI). The coefficient of variation (CV) shows the extent of variability in relation to the mean and is defined as the ratio of the standard deviation to the mean. It is applicable to data measured on a ratio scale, i.e., continuous data with a meaningful zero. Otherwise, data with an interval scale will yield different coefficient values depending on the scale used. For this reason, the coefficients of variation were not calculated for the temperature data given in Celsius. The coefficient of variation of precipitation data defines the variability of precipitation in the observed time interval at a certain location of interest. A higher value of CV is an indicator of greater variability and vice versa, calculated as follows:
C V = ( σ / μ ) · 100 ,
where σ is the standard deviation and μ is the mean precipitation. CV is used to classify the degree of variability of rainfall events as low (CV < 20), moderate (20 < CV < 30), and high (CV > 30) [47,48].
Standardized rainfall anomaly (or standardized rainfall anomaly index, Standardized Anomaly Index [44,49,50,51]) defines the nature of trends and provides information about the frequency and severity of drought. Thus, drought severity can be classified as extreme drought (SRA < −1.65), severe drought (−1.28 > SRA > −1.65), moderate drought (−0.84 > SRA > −1.28), and no drought (SRA > −0.84) [52]. SRA is defined as follows:
S R A = ( P i - P - i ) / σ · 100
where Pi is the annual precipitation of the particular year (mm),  P - i  is the mean annual precipitation over a period of observation (mm), and σ is the standard deviation of annual precipitation over the period of observation.
The variability and distribution of rainfall at different scales is defined by the precipitation concentration index (PCI). This is a dimensionless value that examines the heterogeneity pattern of rainfall [47]. The most commonly used scale is the annual scale, and PCI is then defined as follows:
P C I a n n u a l = i = 1 12 P i 2 / ( i = 1 12 P i ) 2 · 100
where Pi is the monthly precipitation in month i (mm). In addition to the annual scale, PCI can also be calculated on the seasonal or even supra-seasonal scale, which includes the division into dry and wet periods [53]. According to Oliver [54], a PCI of less than 10 indicates a uniform distribution, and a value of 11 to 20 suggests a seasonal distribution. At the same time, an index of more than 20 represents marked seasonal differences with increasing monthly concentration. Depending on the value of PCI, monthly precipitation concentration can be classified as low (for uniform distributed precipitation), moderate for values from 11 to 15, high for values from 16 to 20, and very high for values above 21 [47,49,50,51,55,56].

3. Results and Discussion

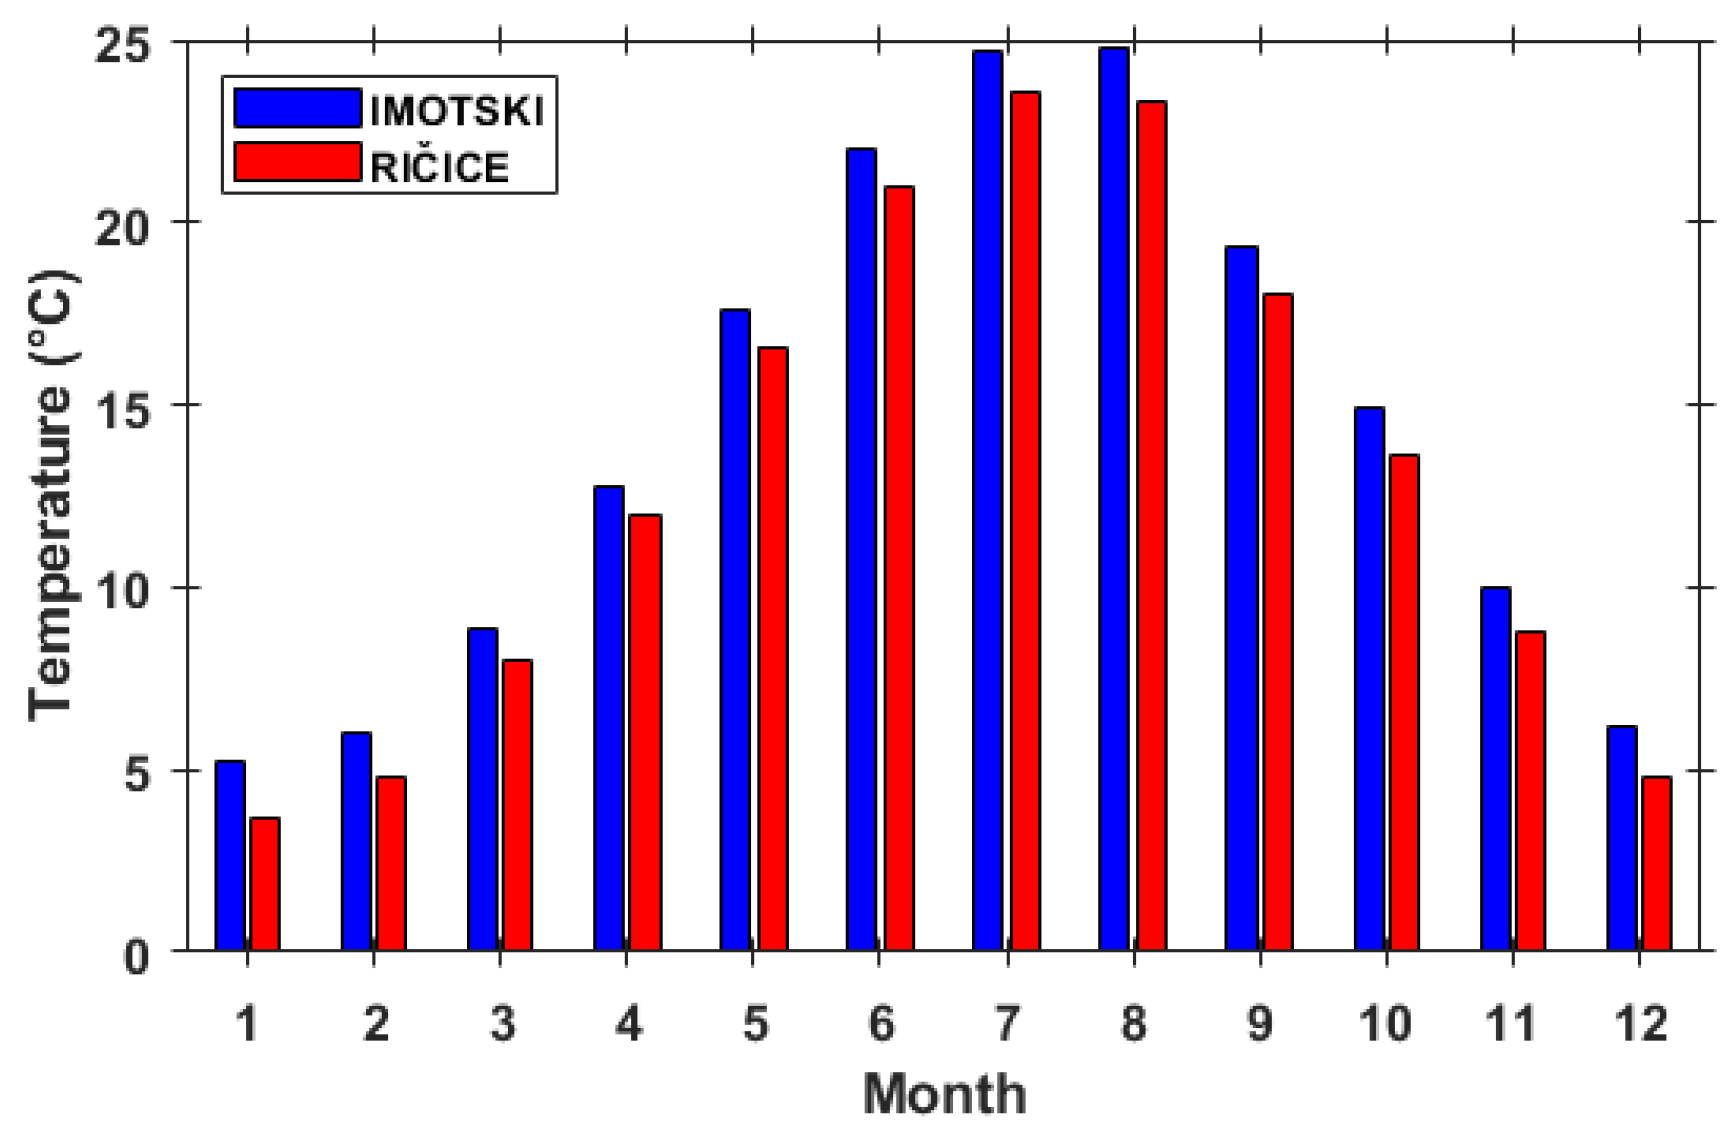
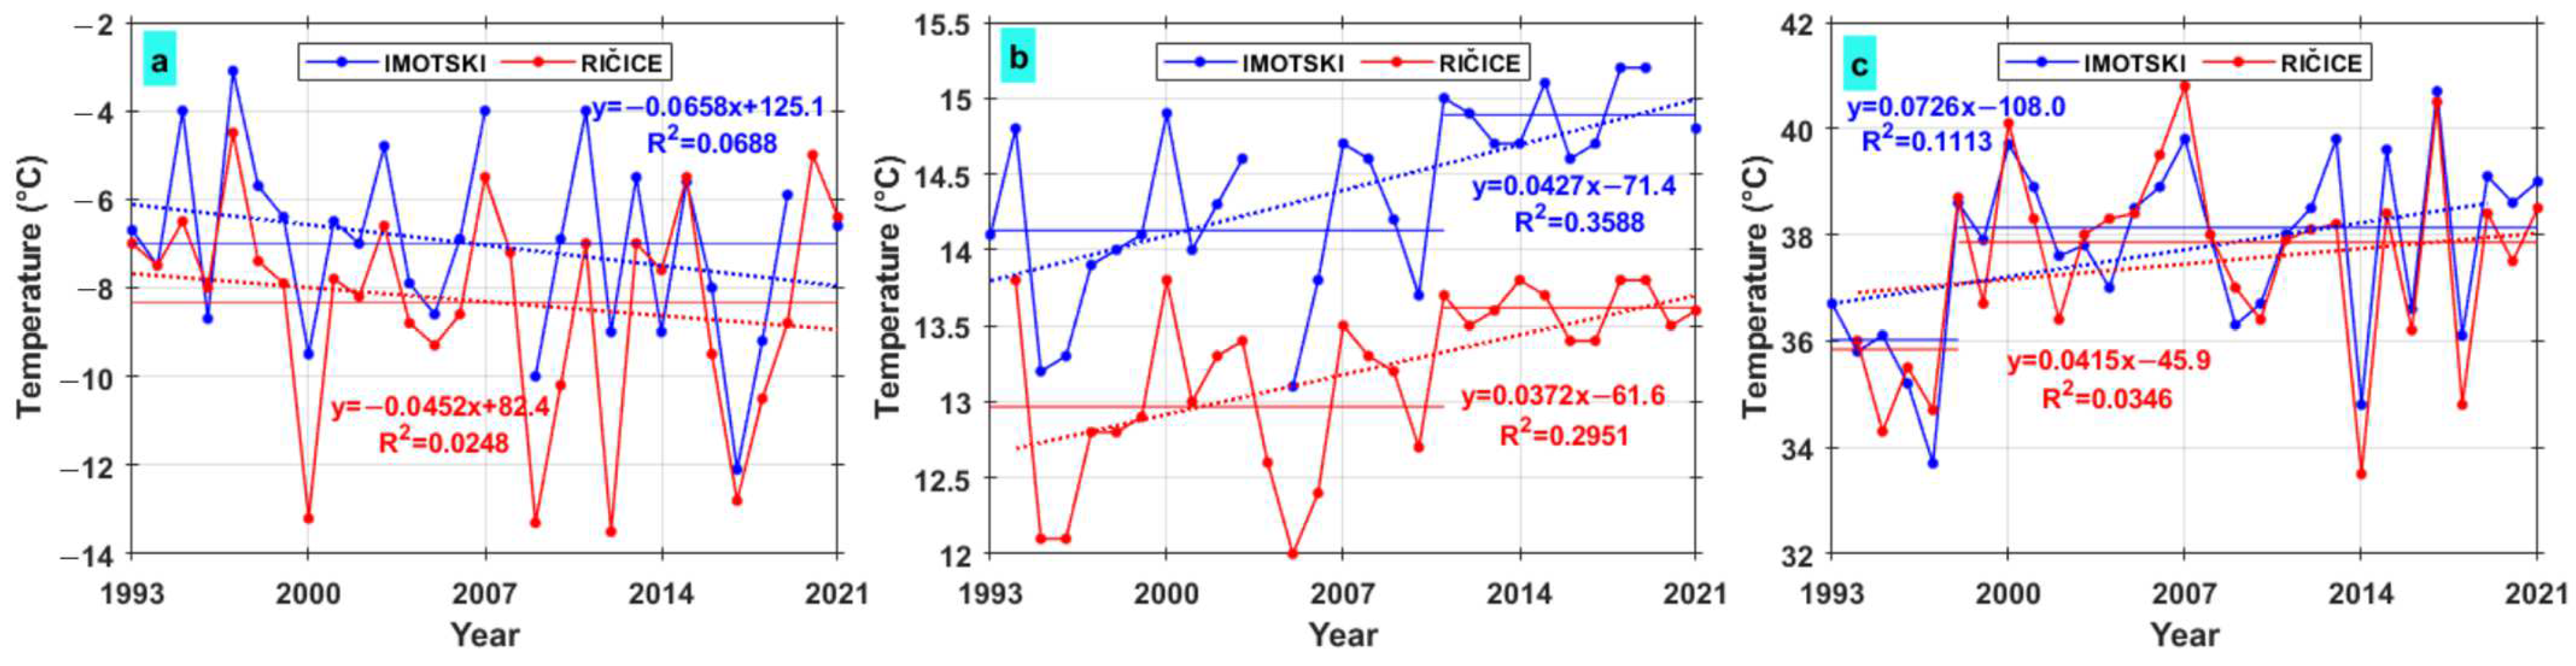
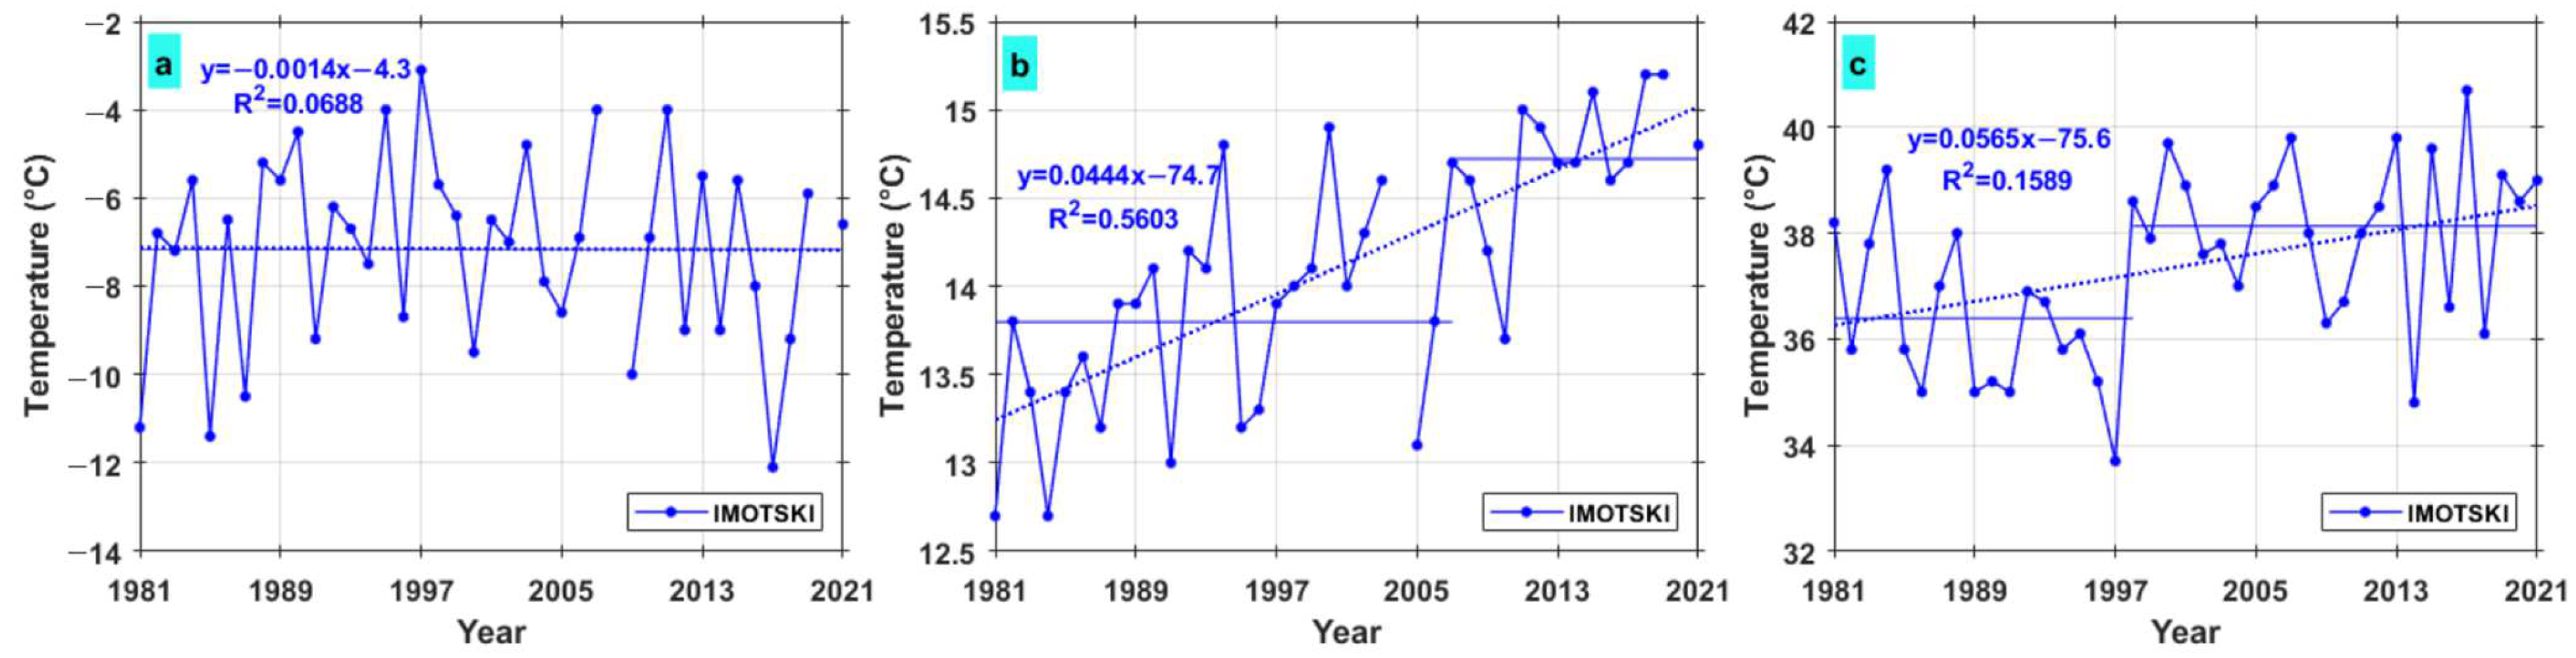
3.1. Analysis of Air Temperature Dynamics

An analysis of air temperature dynamics includes analyses at various spatial and temporal scales. Long-term trend analyses of three characteristic indicators (minimum, mean, and maximum) are critical for understanding climate variability, detecting the potential impacts of climate change, and applying appropriate adaptation measures. The analysis was conducted on the available data series, taking into account that the available data sets for the two stations are not of equal length. Therefore, an analysis of the entire available data set was performed at the Imotski station, while the comparison of the characteristic values at the two stations was performed for overlapping periods (1993–2021).
The analysis of the monthly average temperatures shows that the station in Imotski had higher temperatures than the station in Ričice (Figure 2), which can be attributed to the geographical location of the stations due to the difference in altitude and temperature inversion. The temperature differences vary throughout the months and are the lowest in the spring months. The highest monthly average temperature occurs in August at the Imotski station with a value of 24.8 °C. At the Ričice station, the highest monthly average temperature is measured in July with a value of 23.6 °C. On the other hand, the lowest monthly average temperature is observed in January, with a value of 5.2 °C at Imotski station and 3.7 °C at Ričice station.
A comparison of the characteristic values for the two stations for the period from 1993 to 2021 is shown in Figure 3. The analysis of the minimum temperatures found that the average minimum temperature at the Imotski station is −7 °C, and at the Ričice station, −8.3 °C. The minimum temperature range at Imotski station is from −3.1 to −12.1 °C, and at Ričice station, from −4.5 to −13.5 °C. The direction of the linear regression indicates the temperature trend. In both cases, the temperature trend is downward. The trend is more pronounced at the Imotski station, which is reflected in the magnitude of the trend, which is −0.0667 for Imotski and −0.0510 for Ričice. However, as shown in Table 1, the decreasing trends in the minimum temperature are not statistically significant (p > 0.05). The SNHT test performed at both stations did not reveal any shift in the mean.
At the Imotski station, the annual mean temperature ranged between 13.1 and 15.2 °C with an average of 14.4 °C, while at the Ričice station, it varied between 12 and 13.8 °C with an average of 13.2 °C. Both stations have an upward trend with a similar magnitude of trend (Table 1). The results of the Mann–Kendall test show statistically significant trends at both stations (p < 0.05). The SNHT test reveals a shift in the mean after 2011 at both stations. The results of the t-test show that the shifts at the Imotski and Ričice stations are statistically significant (p < 0.05).
The annual maximum temperatures at the two stations coincide quite well (Figure 3), with minor differences in the annual values. At the Imotski station, the annual maximum temperature ranged between 33.7 and 40.7 °C with an average of 37.7 °C, while at the Ričice station, it varied between 33.5 and 40.8 °C with an average of 37.5 °C. As with the annual mean temperatures, an upward trend can be observed in the annual maximum temperatures at both stations. The trend is more pronounced for the Imotski station, which is also evident in the value of the trend magnitude. According to the results of the Mann–Kendall test, the trends of increasing maximum temperature are not statistically significant (p > 0.05). The SNHT test reveals a shift in the mean after 1998 at both stations. The results of the t-test show that the shifts at the Imotski and Ričice stations are statistically significant (p < 0.05).
The analysis of the complete data series at the Imotski station shows an average annual mean temperature of 14.1 °C, an average annual minimum temperature of −7.2 °C, and an average annual maximum temperature of 37.4 °C. The average characteristic values for the period from 1981 compared to the period from 1993 show a decrease in the average annual minimum temperature and an increase in the average mean and maximum annual temperatures. The trends are the same for both periods considered and include a decrease in the annual minimum temperatures, and an increase in the mean and maximum annual temperatures (Figure 4). For the period from 1981 onwards, in addition to the annual mean temperatures, a statistically significant increase in the annual maximum temperatures can also be observed (Table 2). The SNHT test show a shift in the mean for the annual maximum temperatures after 1998, similar to the analysis of the period beginning in 1993, while the shift in the mean for the annual mean temperatures occurred after 2007. The results of the t-test show that the shifts in the annual mean temperatures and annual maximum temperatures are statistically significant (p < 0.05).
The air temperature trends in Imotski and Ričice show an agreement with those observed at the regional and national scales. The most significant changes are observed in the annual mean temperature. Thus, in Croatia, a statistically significant increase in the annual mean temperatures is observed even at four out of five stations considered [17,57]. Other stations in the region, such as Hvar, Komiža, and Split, also show statistically significant increasing trends in the annual mean temperature [58,59]. In particular, the stations in Hvar and Split show a statistically significant upward trend in the 1992–2019 sub-period [58], which is consistent with the statistically significant upward trends in the annual mean temperature in Imotski and Ričice after 1998, and in the annual maximum temperature after 2007 and 2011, respectively. In addition, the stations on the islands of Palagruža, Lastovo, and Biševo have shown statistically significant increases in the mean and maximum annual air temperature [22,58]. According to Branković et al. [60], there is a statistically significant increase in the Croatian coastal zone, which has intensified within a shorter period, as evidenced by the recording of five to seven of the ten warmest years in the period of 2001–2010. Furthermore, a statistically significant increase in the annual maximum temperatures was also observed inland [61,62]. Perčec-Tadić et al. [63] found stronger trends in the continental and mountainous regions. Since the Imotski and Ričice stations have continental influences in addition to a Mediterranean climate, it is reasonable to relate these results to these particular stations. The results presented in this paper are consistent with the regional warming trends observed in Croatia and the Western Balkans [18,19,60], and suggest that such statistically significant annual and seasonal trends were observed in the second half of the 1990s until the end of the 21st century [22,60,61,63].

3.2. Analysis of Precipitation

Precipitation, along with temperature, is one of the most important parameters for weather and climate forecasting, understanding climate variability, and analyzing the occurrence of natural disasters (droughts and floods), but also for analyzing water availability, especially in karst areas such as Imotsko Polje and its surroundings. Precipitation analysis includes an analysis of the average monthly precipitation, trends in annual precipitation and its spatial distribution, and an analysis of precipitation variability using the parameters coefficient of variation (CV), standardized rainfall anomaly (SRA), and precipitation concentration index (PCI).

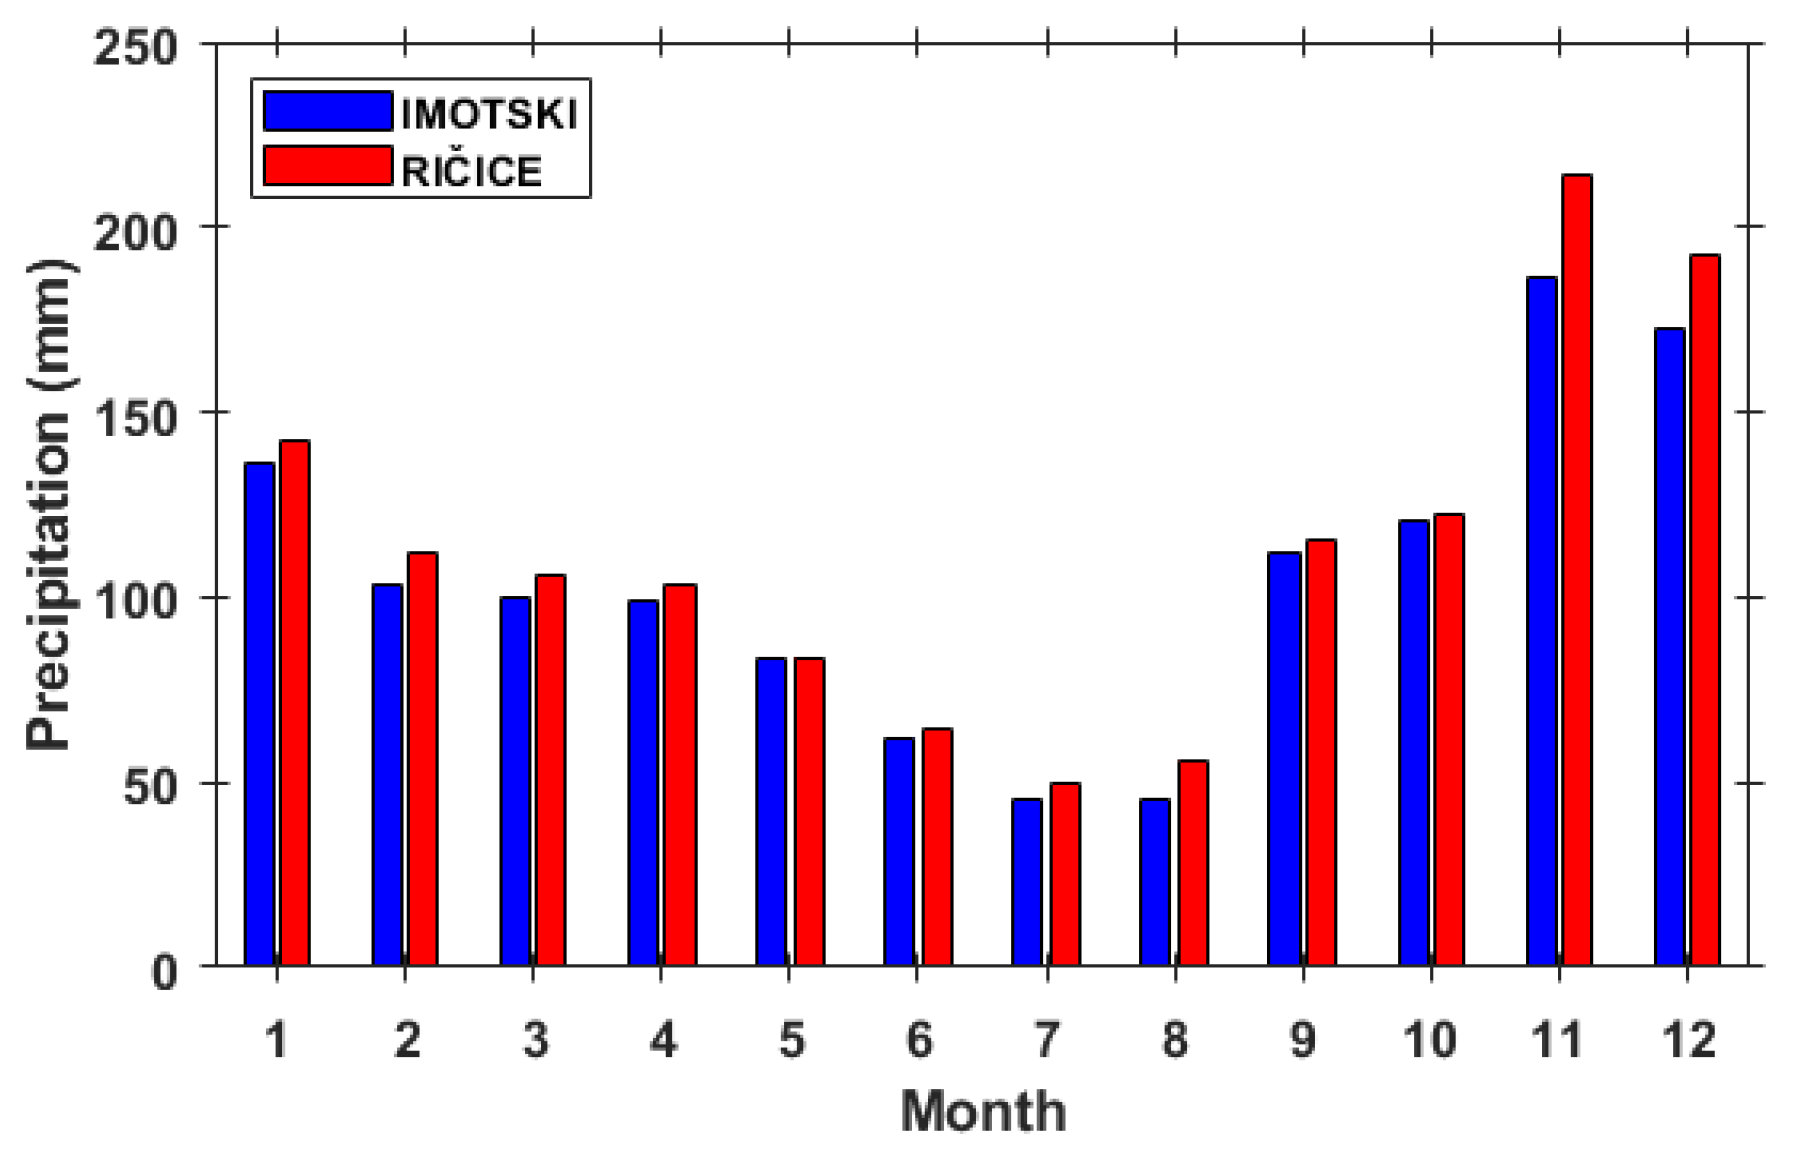
3.2.1. Precipitation Analysis on Monthly Scale

The average monthly precipitation is the highest in November with 186.2 mm at Imotski station and 214.2 mm at Ričice station, while the lowest precipitation is recorded in July with 45.3 mm in Imotski and 49.5 mm in Ričice (Figure 5). The values of the average monthly precipitation are higher at the Ričice station. The differences in the precipitation are relatively uniform, except for the months of November and December, when the precipitation at the Ričice station is much higher. The higher precipitation in the winter months is reflected in the floods of Imotsko Polje, which, in addition to precipitation, are mainly influenced by groundwater. A higher precipitation in the colder season and a lower precipitation in the warmer season is a characteristic of the maritime precipitation regime.
Table 3 provides an overview of the minimum, mean, and maximum monthly precipitation values along with the coefficients of variation used to measure the variability of the mean monthly precipitation for the period of 1993–2021. At the Ričice station, November is the rainiest month, when the highest minimum and maximum values occur. Although the highest maximum value at the Imotski station is measured in December, the highest mean precipitation occurs in November, when the highest minimum is also measured. In the southern Adriatic, the discrepancy between the mean maximum precipitation amounts decreases [60]. As a result, the southern stations record the highest precipitation in December. Therefore, it is not a coincidence that the Imotski station records the highest precipitation amounts in December.
The coefficient of variation for the mean monthly precipitation indicates a considerable degree of fluctuation in the monthly precipitation each month. The variability of precipitation is most pronounced in the summer months. According to the values of the coefficient of variation, the mean monthly precipitation values are found to be highly variable over the years. The analysis of the average annual precipitation values show a coefficient of variation of 23 for the Imotski station and 23.1 for the Ričice station. The values of the coefficients indicate a low variability of the annual precipitation.

3.2.2. Spatial Distribution of Precipitation

The spatial distribution of the average annual precipitation in the period from 1993 to 2021 for the wider area of Imotsko Polje is shown in Figure 6. The spatial distribution was determined using the inverse distance to power grid method, a weighted average interpolation method in which data points are weighted based on their distance from the grid node [64,65]. To better represent the spatial distribution of precipitation, in addition to the stations Imotski and Ričice, the more distant stations of Sinj, Split, and Vrgorac in Croatia, as well as Livno and Mostar in Bosnia and Herzegovina, were also considered (Figure 6). The edges of the field, northwest toward Prološko Blato and southeast toward the river Matica, have higher values of precipitation.
In addition to the analysis of spatial variability of precipitation, the Pearson coefficients of determination for the annual precipitation between neighboring stations in the period of 1993–2021 were calculated (Figure 7). Imotski and Ričice were used as the target stations, while the other stations served as the reference stations. Our results show high coefficients of determination, especially for the stations located in close proximity to the target stations.

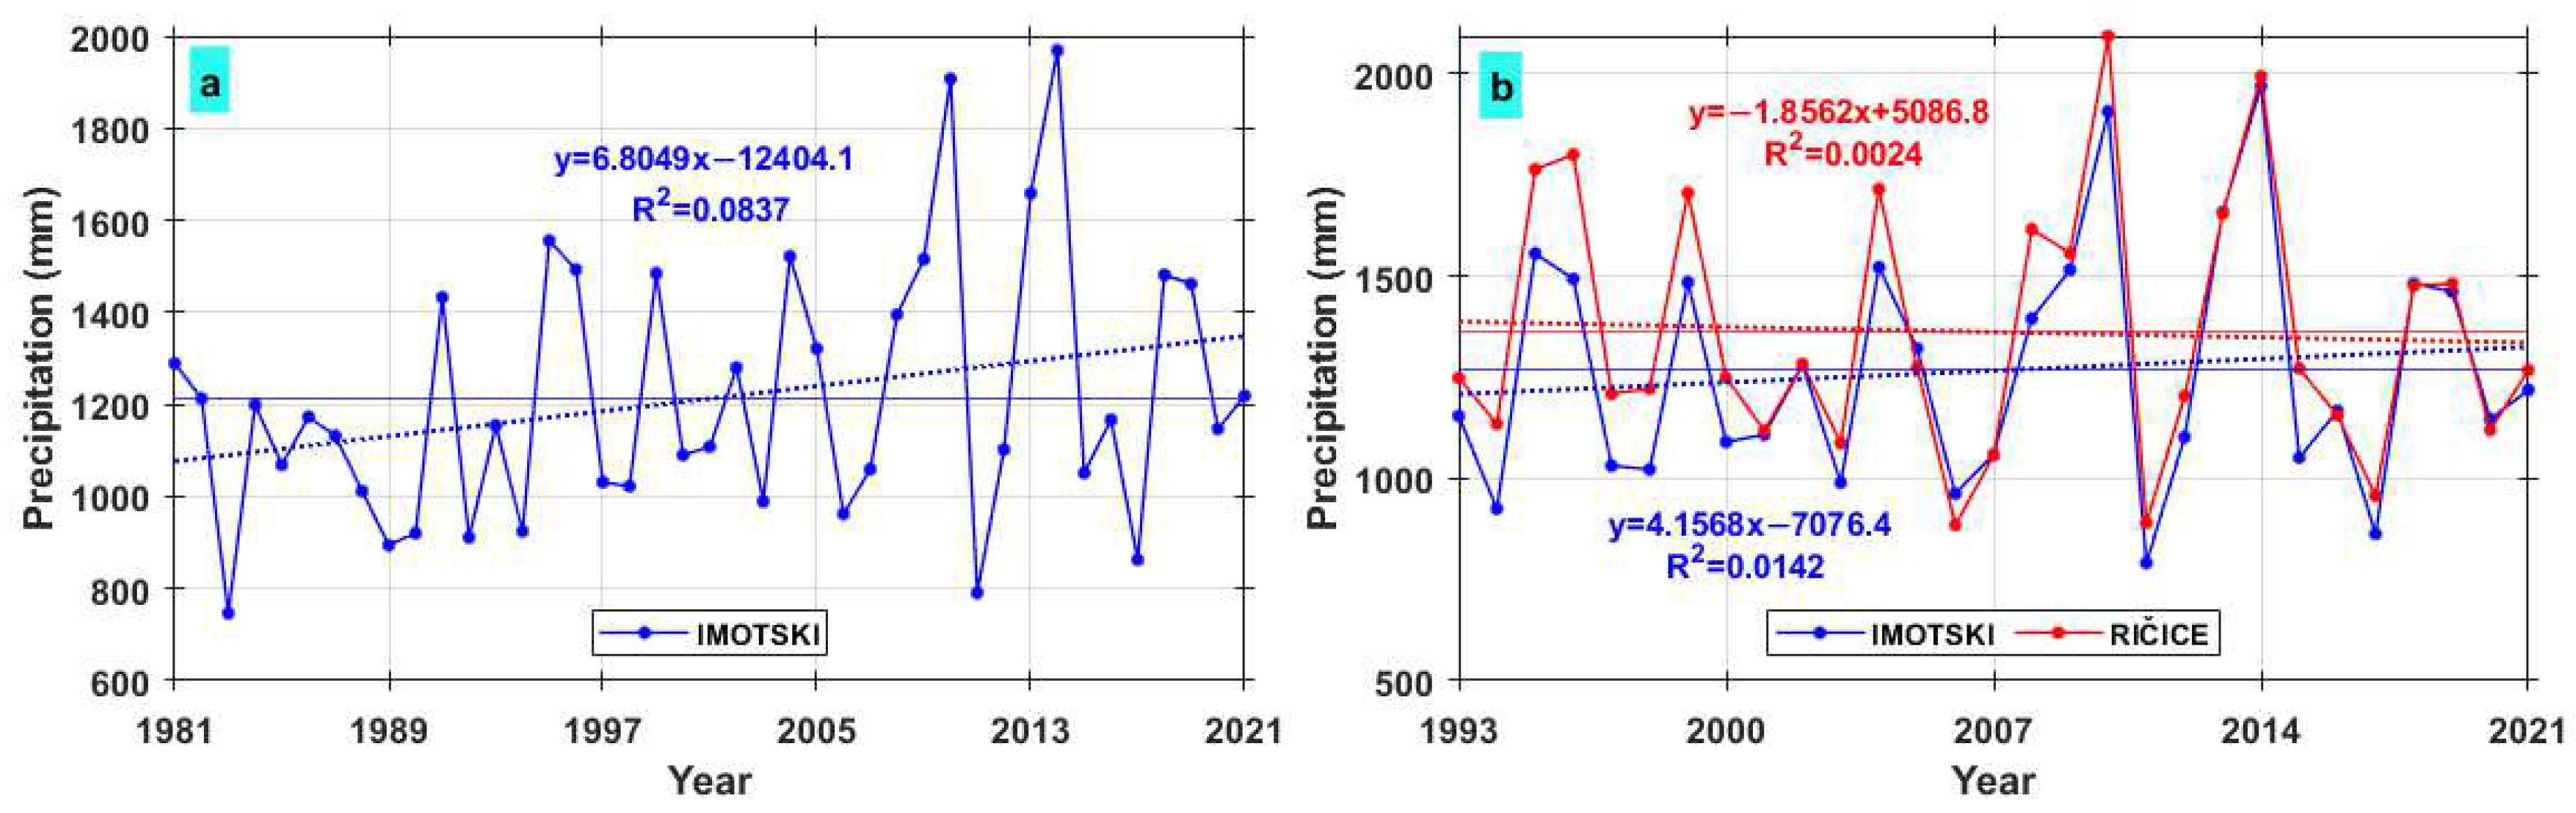
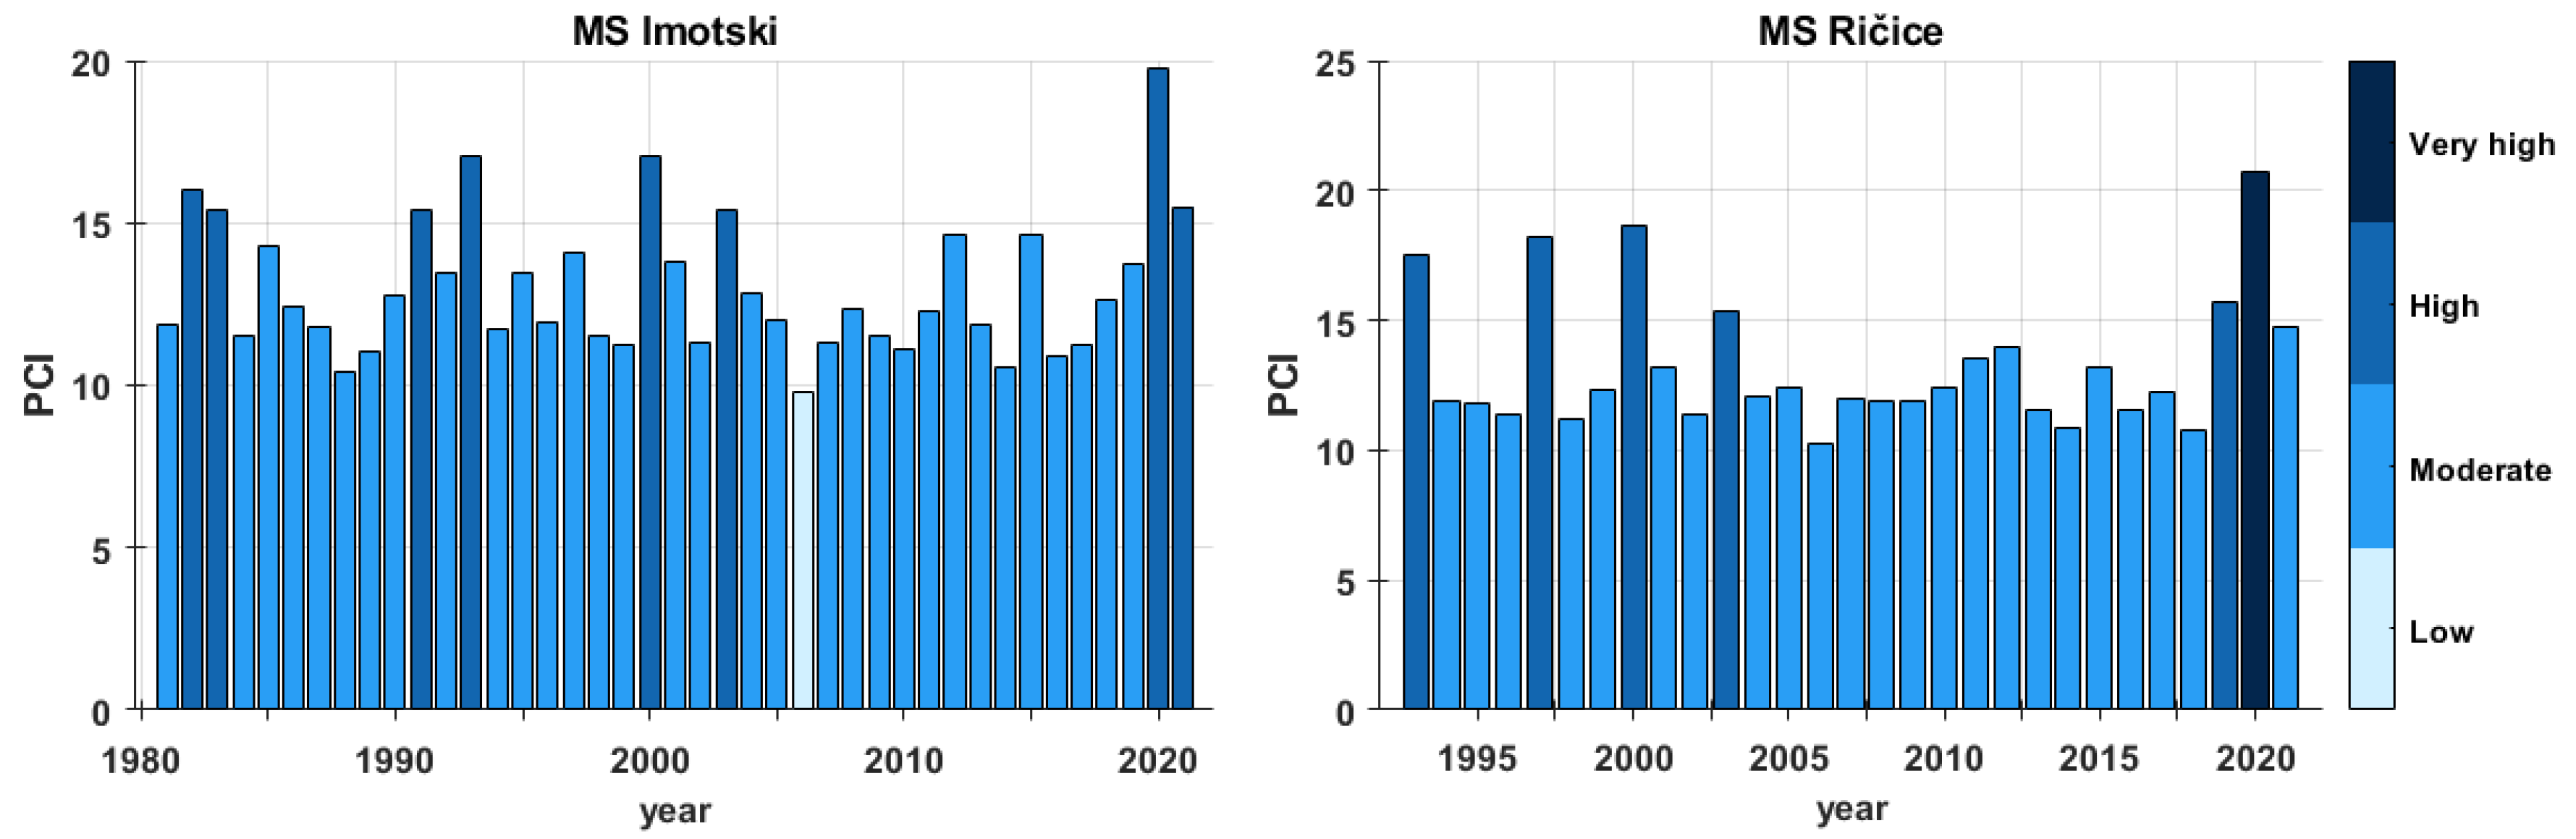
3.2.3. Precipitation Analysis on Annual Scale

Figure 8 shows the annual precipitation and trends for the entire Imotski station data set, as well as a comparison of the annual precipitation at two stations for overlapping periods. The average annual precipitation at the Imotski station is 1212.5 mm. An analysis of the whole data set (Figure 8a) shows an upward trend in the annual precipitation, and the magnitude of the trend is 6.0575. However, the results of the MK test (Table 4) show that the increasing trend is not statistically significant (p > 0.05). The SNHT test did not reveal any shift in the mean.
The comparison of the annual precipitation in Figure 8b shows different trends of the annual precipitation at the two meteorological stations. The trend of the annual precipitation at the Imotski station is increasing, while the trend at the Ričice station is decreasing. The magnitude of the trend is more pronounced at the Imotski station, but neither trend is statistically significant (Table 5). The SNHT test at both stations did not reveal any shift in the mean. The negative trend in precipitation at the station Ričice is consistent with the trends in other parts of Croatia [6,20,66,67]. Thus, most Croatian regions, with the exception of the eastern mainland [6] and some Dalmatian islands [20,21,22], experienced a negative trend. This trend along the Adriatic coast is most pronounced on the northern Adriatic coast (Crikvenica) and is observed less inland [20] and on the central Dalmatian islands, where on some of them, there is no precipitation trend at all [66]. On the other hand, a positive trend is observed at the Imotski station, which can be explained by continental influences and local factors. Due to the significant spatial variability of precipitation and the varying trends observed at different stations, including those analyzed in other papers, it is not possible to draw a single conclusion about the actual trend of the precipitation regime. However, according to Bonacci [21], the precipitation regimes analyzed at four stations (Split, Hvar, Lastovo, and Zagreb) show slight tendencies toward the intensification of precipitation regimes, which is related to a decrease in the number of days per year with a certain amount of precipitation and an increase in intensive precipitation.
Table 6 shows each maximum value of the annual or monthly precipitation for the Imotski station in the period of 1981–2021 and the Ričice station in the period of 1993–2021, together with the value of the return period determined by the generalized extreme value (GEV) distribution.
The distribution of precipitation at both stations is seasonal (Figure 9). The seasonal distribution of precipitation means that the monthly precipitation varies greatly depending on the time of year; the minimum amount of precipitation falls in the summer months, while higher amounts fall in the winter months. At the Imotski station, only the year 2006 shows a uniform precipitation distribution, but the high value of the PCI of 9.77 indicates that the distribution tends to be seasonal. At both stations, the precipitation concentration is described as moderate in 79% of the years, with a moderate amount of precipitation that deviates from the average. At the Imotski station, the precipitation concentration is high in 19% of the years, while in Ričice it is 17%. Extremely high concentration occurs at the Ričice station in 2020, while at the Imotski station, the same year is marked as moderate, but with an extremely high PCI value of 19.75. An example of the movement of low, moderate, and high precipitation concentration is shown in Figure 10, using the example of 2006 with a uniform precipitation distribution, 1997 with the highest precipitation in November moderately deviating from the annual average, and 2020 with extreme precipitation in December highly deviating from the annual average. The trend of the values of the PCI at the Imotski station for the period from 1981 to 2021 is downward and not statistically significant (p > 0.05), while the trend in Ričice is upward and also not statistically significant (p > 0.05). If we consider the same period for the Imotski station as for Ričice, the trend is also upward and statistically not significant.
Figure 11 shows the dryness or wetness of certain years in the period of 1981–2021 at the Imotski station and in the period of 1993–2021 at the Ričice station. The SRA values at the Imotski station do not increase statistically significant when considering the entire series and the period after 1993, which also suggests a lower occurrence of droughts or perhaps, rather, a decrease in their intensity. At the Imotski station, 20% of the years were dry (8 years), including one extreme, one severe, and six moderate years. For 1981–2020, five dry years were recorded, and only three after that. In this case, the number of dry periods does not increase, but actually decreases. However, with the exception of the 1983 drought, the SRA values indicate that droughts are less frequent but more intense. In the Ričice station, 17% of the years were dry (5 years), of which two were severely dry and three were moderately dry, with no extreme drought recorded. In contrast to the Imotski station, dry periods have increased in recent years, as shown by the decreasing trend of the SRA value, which, however, is not yet statistically significant. It is also possible that the intensity of drought increased in Ričice as in Imotski, but this cannot be accurately confirmed due to the much shorter time series of the observations. It is certain that at both stations, the intensity of positive SRA values, i.e., the presence of wetter years, increases. Thus, the highest SRA values at both stations were measured in 2010 and 2014, which can be attributed to the high precipitation in those years. The rainfall anomalies indicate the presence of more pronounced extreme phenomena, whether a highly wet year is associated with an excessive amount of precipitation or a highly dry year is associated with a lack of precipitation.
The influence of precipitation is also evident in the hydrological functioning of karst forms. Thus, the most intense drought after 1983 was in 2011, when Blue Lake dried up for 88 days. Blue Lake is more sensitive to precipitation than Red Lake, which is influenced by regional flow and groundwater [16]. As a result, Blue Lake dried out during almost all recorded dry periods (SRA > −0.84). On the opposite hand, floods recorded in 2010 and 2014 caused the river Vrljika to overflow its banks and flood agricultural land. How strong the flood wave was in 2010 is proven by the fact that the water level in Blue Lake rose by 5 m within 24 h, and even 700,000 cubic meters of water flowed into the Ričice reservoir in only 4 h. The above proves the importance of precipitation monitoring and analysis in understanding the complex hydrologic functioning of this area and in taking timely action to mitigate the effects of extreme events.

4. Conclusions

This paper examines air temperature and precipitation dynamics as two of the most important factors affecting karst hydrology that can be extremely useful for comprehending both the movement of hydrologic parameters and the hydrologic state of the study area. In addition, identifying trends in air temperature and precipitation allows for more efficient management of regional water resources and associated hazards.
The analysis of temperature dynamics reveals a statistically significant increase in the mean and maximum annual air temperature at the Imotski station and a statistically significant increase in the mean annual temperatures at the Ričice station. The minimum annual temperatures decrease at both stations, but neither trend is statistically significant. The results of the SNHT test show that both the Imotski and Ričice meteorological stations experienced statistically significant shifts in temperature trends over time. At the Imotski station, there was a statistically significant shift in the annual mean temperatures after 2007 and annual maximum temperatures after 1998, while at the Ričice station, there was a statistically significant shift in the annual mean temperatures after 2011 and annual maximum temperatures after 1998. These results suggest climate variability rather than inhomogeneity, considering there was no relocation of the stations or measurement instruments at these years in the history of the two stations.
The precipitation trend at the Ričice station is negative, while at the Imotski station, it is positive. The differences in temperature and precipitation at the two stations are due to the different lengths of the time series and the influence of local factors. The influence of local factors is especially reflected in the amount of precipitation, which depends on the humidity of the air mass, the intensity and direction of the airflow, and also on the vertical component of motion, which can be significantly modified by local influences [6,23]. The significant spatial variability of precipitation and varying trends observed at different stations make it difficult to draw a single conclusion about the actual trend of the precipitation regime in this area [23].
The precipitation variability is high at the monthly level, but low at the annual level. The PCI values at both stations yielded the same results, indicating a seasonal distribution of precipitation. Although the trend of the PCI at the Imotski station is decreasing, both stations have a high or very high value of the PCI, indicating a pronounced seasonality, i.e., large differences between the precipitation and non-precipitation periods. The number of dry periods increases at the Ričice station, while it decreases at the Imotski station, but their intensity increases. Both stations also show an increase in wet years. The SRA values indicate the presence of extreme events, either drought or extremely wet years, affecting the water flow between karst features.
The analysis of climatological data of long time series carried out for the first time in this area brought valuable and significant conclusions about local climate patterns that can be significant for predicting future climate trends and assessing the potential impacts of climate change on the local environment and communities. Because this is a highly karstified area with a very complex circulation of water in karst, understanding the climate trends and variability at these two stations is particularly important, as extreme phenomena associated with rising temperatures and seasonally poorly distributed precipitation can have negative impacts on karst hydrology and water availability. To mitigate climate-related risks, novel irrigation technologies, water storage, and efficient water supply infrastructure, coupled with the use of real-time monitoring systems and advanced prediction tools, can play a crucial role in ensuring the long-term sustainability of communities and ecosystems in karst areas. It is also important to emphasize the importance of the availability of high-resolution data, which is possible with a sufficiently dense network of meteorological stations, which unfortunately does not exist in this part of Croatia.
The authors hope that this study will contribute to a better understanding of both local and regional climate, and that the results presented in this paper will provide valuable insights into climate change in the wider Mediterranean region and will be considered in the further consideration of the hydrology of this karst area.

Author Contributions

Conceptualization, data curation, formal analysis, investigation, and writing of the original draft, A.V.; supervision and review and editing, I.A.; validation and review, O.B.; validation and review, O.K. All authors have read and agreed to the published version of the manuscript.

Funding

This research was supported through project KK.05.1.1.02.0024, “VODIME-Waters of Imotski region”, a project financed by the Croatian Government and the European Union through the European Structural Fund—within the call “Strengthening the applied research for climate change adaptation measures”. This research was partially supported through project KK.01.1.1.02.0027, a project co-financed by the Croatian Government and the European Union through the European Regional Development Fund—the Competitiveness and Cohesion Operational Programme.

Institutional Review Board Statement

Not applicable.

Informed Consent Statement

Not applicable.

Data Availability Statement

Not applicable.

Conflicts of Interest

The authors declare no conflict of interest.

References

  1. Lavell, A.; Oppenheimer, M.; Diop, C.; Hess, J.; Lempert, R.; Li, J.; Muir-Wood, R.; Myeong, S.; Moser, S.; Takeuchi, K.; et al. Climate Change: New Dimensions in Disaster Risk, Exposure, Vulnerability, and Resilience. In Managing the Risks of Extreme Events and Disasters to Advance Climate Change Adaptation: Special Report of the Intergovernmental Panel on Climate Change; Cambridge University Press: Cambridge, UK; New York, NY, USA, 2012; pp. 25–64. [Google Scholar]
  2. Moatti, J.-P.; Thiébault, S. The Mediterranean Region under Climate Change. A Scientific Update: Abridged English/French Version; Allenvi: Marseille, France, 2016. [Google Scholar]
  3. Pastor, F.; Valiente, J.A.; Khodayar, S. A Warming Mediterranean: 38 Years of Increasing Sea Surface Temperature. Remote. Sens. 2020, 12, 2687. [Google Scholar] [CrossRef]
  4. Giorgi, F. Climate Change Hot-Spots. Geophys. Res. Lett. 2006, 33, 101029. [Google Scholar] [CrossRef]
  5. Lionello, P.; Gacic, M.; Gomis, D.; Garcia-Herrera, R.; Giorgi, F.; Planton, S.; Trigo, R.; Theocharis, A.; Tsimplis, M.N.; Ulbrich, U.; et al. Program Focuses on Climate of the Mediterranean Region. Eos Trans. Am. Geophys. Union 2012, 93, 105–106. [Google Scholar] [CrossRef]
  6. Gajić-Čapka, M.; Cindrić, K.; Pasarić, Z. Trends in Precipitation Indices in Croatia, 1961–2010. Theor. Appl. Climatol. 2015, 121, 167–177. [Google Scholar] [CrossRef]
  7. Ali, E.; Cramer, W.; Carnier, J.; Georgopoulou, E.; Hilmi, N.; le Cozannet, G.; Lionello, P. Cross-Chapter Paper 4: Mediterranean Region. In Climate Change 2022: Impacts, Adaptation and Vulnerability; Cambridge University Press: Cambridge, UK; New York, NY, USA, 2022; pp. 2233–2272. [Google Scholar]
  8. Todaro, V.; D’Oria, M.; Secci, D.; Zanini, A.; Tanda, M.G. Climate Change over the Mediterranean Region: Local Temperature and Precipitation Variations at Five Pilot Sites. Water 2022, 14, 2499. [Google Scholar] [CrossRef]
  9. Giorgi, F. Variability and Trends of Sub-Continental Scale Surface Climate in the Twentieth Century. Part I: Observations. Clim. Dyn. 2002, 18, 675–691. [Google Scholar] [CrossRef]
  10. Ulbrich, U.; Xoplaki, E.; Dobricic, S.; García-Herrera, R.; Lionello, P.; Adani, M.; Baldi, M.; Barriopedro, D.; Coccimiglio, P.; Dalu, G.; et al. Past and Current Climate Changes in the Mediterranean Region. In Regional Assessment of Climate Change in the Mediterranean: Volume 1: Air, Sea and Precipitation and Water; Springer: Dordrecht, The Netherlands, 2013; pp. 9–51. [Google Scholar]
  11. Lionello, P.; Malanotte-Rizzoli, P.; Boscolo, R.; Alpert, P.; Artale, V.; Li, L.; Luterbacher, J.; May, W.; Trigo, R.; Tsimplis, M.; et al. The Mediterranean Climate: An Overview of the Main Characteristics and Issues. Dev. Earth Environ. Sci. 2006, 4, 1–26. [Google Scholar]
  12. Philandras, C.M.; Nastos, P.T.; Kapsomenakis, J.; Douvis, K.C.; Tselioudis, G.; Zerefos, C.S. Long Term Precipitation Trends and Variability within the Mediterranean Region. Nat. Hazards Earth Syst. Sci. 2011, 11, 3235–3250. [Google Scholar] [CrossRef]
  13. Mariotti, A.; Pan, Y.; Zeng, N.; Alessandri, A. Long-Term Climate Change in the Mediterranean Region in the Midst of Decadal Variability. Clim. Dyn. 2015, 44, 1437–1456. [Google Scholar] [CrossRef]
  14. Flaounas, E.; Drobinski, P.; Vrac, M.; Bastin, S.; Lebeaupin-Brossier, C.; Stéfanon, M.; Borga, M.; Calvet, J.-C. Precipitation and Temperature Space–Time Variability and Extremes in the Mediterranean Region: Evaluation of Dynamical and Statistical Downscaling Methods. Clim. Dyn. 2013, 40, 2687–2705. [Google Scholar] [CrossRef]
  15. Zaninovič, K.; Gajić-Čapka, M. Climate Change and the Influence on Health [Klimatske Promjene i Utjecaj Na Zdravlje]. Infektoloski Glas. 2008, 28, 5–15. [Google Scholar]
  16. Beslik, S.; Causevic, A. Climate Risk Assessment Report: Croatia; Nordea: Helsinki, Finland, 2019. [Google Scholar]
  17. Branković, Č.; Cindrić, K.; Gajić-Čapka, M.; Güttler, I.; Patarčić, M.; Srnec, L.; Vučetić, V.; Zaninović, K. Peto Nacionalno Izvješće Republike Hrvatske Prema Okvirnoj Konvenciji Ujedinjenih Naroda o Promjeni Klime (UNFCCC); Izabrana Poglavlja: Opažene Klimatske Promjene u Hrvatskoj Scenarij Klimatskih Promjena Utjecaj Klimatskih Varijacija i Promjena Na Biljke i Na Opasnost Od Šumskih Požara; DHMZ: Zagreb, Croatia, 2009. [Google Scholar]
  18. Bonacci, O. Analiza Nizova Srednjih Godišnjih Temperatura Zraka u Hrvatskoj. Građevinar 2010, 62, 781–791. [Google Scholar]
  19. Bonacci, O. Increase of Mean Annual Surface Air Temperature in the Western Balkans during Last 30 Years. Vodoprivreda 2012, 40, 75–89. [Google Scholar]
  20. Gajić-Čapka, M.; Cindrić, K. Secular Trends in Indices of Precipitation Extremes in Croatia, 1901–2008. Geofizika 2011, 28, 293–312. [Google Scholar]
  21. Bonacci, O.; Andrić, I.; Vrsalović, A.; Bonacci, D. Precipitation Regime Changes at Four Croatian Meteorological Stations. Atmosphere 2021, 12, 885. [Google Scholar] [CrossRef]
  22. Bonacci, O. Air Temperature and Precipitation Analyses on a Small Mediterranean Island: The Case of the Remote Island of Lastovo (Adriatic Sea, Croatia). Acta Hydrotech. 2019, 32, 135–150. [Google Scholar] [CrossRef]
  23. Gajić-Čapka, M.; Tadić, M.P.; Patarčić, M. Digitalna Godišnja Oborinska Karta Hrvatske. Hrvat. Meteoroloski Cas. 2003, 38, 21–33. [Google Scholar]
  24. Zdilar, S. Reljef Zavale Imotskog Polja i Njegovo Geoekološko Vrednovanje; Augustini: Zagreb, Croatia, 2001. [Google Scholar]
  25. Bonacci, O.; Roje-Bonacci, T. Interpretation of Groundwater Level Monitoring Results in Karst Aquifers: Examples from the Dinaric Karst. Hydrol. Process. 2000, 14, 2423–2438. [Google Scholar] [CrossRef]
  26. Vrsalović, A.; Andrić, I.; Buzjak, N.; Bonacci, O. Karst Lake’s Dynamics Analysis as a Tool for Aquifer Characterisation at Field Scale, Example of Cryptodepression—Red Lake in Croatia. Water 2022, 14, 830. [Google Scholar] [CrossRef]
  27. Bonacci, O.; Andrić, I. Morphological Study of Red Lake in Dinaric Karst Based on Terrestrial Laser Scaning and Sonar System. Acta Carsologica 2014, 43, 229. [Google Scholar] [CrossRef]
  28. Bonacci, O.; Željković, I.; Galić, A. Karst Rivers’ Particularity: An Example from Dinaric Karst (Croatia/Bosnia and Herzegovina). Environ. Earth Sci. 2013, 70, 963–974. [Google Scholar] [CrossRef]
  29. Bonacci, O.; Roje-Bonacci, T. Water Losses from the Ričice Reservoir Built in the Dinaric Karst. Eng. Geol. 2008, 99, 121–127. [Google Scholar] [CrossRef]
  30. Šegota, T.; Filipčić, A. Köppenova Podjela Klima i Hrvatsko Nazivlje. Geoadria 2003, 8, 17–37. [Google Scholar] [CrossRef]
  31. Bonacci, O.; Željković, I.; Trogrlić, R.Š.; Milković, J. Differences between True Mean Daily, Monthly and Annual Air Temperatures and Air Temperatures Calculated with Three Equations: A Case Study from Three Croatian Stations. Theor. Appl. Climatol. 2013, 114, 271–279. [Google Scholar] [CrossRef]
  32. Bezak, N.; Cerović, L.; Šraj, M. Impact of the Mean Daily Air Temperature Calculation on the Rainfall-Runoff Modelling. Water 2020, 12, 3175. [Google Scholar] [CrossRef]
  33. Weiss, A.; Hays, C.J. Calculating Daily Mean Air Temperatures by Different Methods: Implications from a Non-Linear Algorithm. Agric. Meteorol. 2005, 128, 57–65. [Google Scholar] [CrossRef]
  34. Gough, W.A.; Žaknić-Ćatović, A.; Zajch, A. Sampling Frequency of Climate Data for the Determination of Daily Temperature and Daily Temperature Extrema. Int. J. Climatol. 2020, 40, 5451–5463. [Google Scholar] [CrossRef]
  35. Bonacci, O.; Željković, I. Differences between True Mean Temperatures and Means Calculated with Four Different Approaches: A Case Study from Three Croatian Stations. Theor. Appl. Climatol. 2018, 131, 733–743. [Google Scholar] [CrossRef]
  36. Conner, G.; Foster, S. Searching for the Daily Mean Temperature. In Proceedings of the 17th Conference on Applied Climatology, 88th Annual Meeting American Meteorological Society, Whistler, BC, Canada, 11–15 August 2008. [Google Scholar]
  37. Alexandersson, H. A Homogeneity Test Applied to Precipitation Data. J. Climatol. 1986, 6, 661–675. [Google Scholar] [CrossRef]
  38. Costa, A.C.; Soares, A. Homogenization of Climate Data: Review and New Perspectives Using Geostatistics. Math. Geosci. 2009, 41, 291–305. [Google Scholar] [CrossRef]
  39. Wijngaard, J.B.; Klein Tank, A.M.G.; Können, G.P. Homogeneity of 20th Century European Daily Temperature and Precipitation Series. Int. J. Climatol. 2003, 23, 679–692. [Google Scholar] [CrossRef]
  40. Sen, P.K. Estimates of the Regression Coefficient Based on Kendall’s Tau. J. Am. Stat. Assoc. 1968, 63, 1379–1389. [Google Scholar] [CrossRef]
  41. Mann, H.B. Non-Parametric Test of Randomness against Trend. Econometrica 1945, 13, 245–249. [Google Scholar] [CrossRef]
  42. Kendall, M.G. Rank Correlation Methods, 4th ed.; Charles Griffin: London, UK, 1975. [Google Scholar]
  43. Hirsch, R.M.; Slack, J.R. A Nonparametric Trend Test for Seasonal Data With Serial Dependence. Water. Resour. Res. 1984, 20, 727–732. [Google Scholar] [CrossRef]
  44. Mewded, M.; Abebe, A.; Tilahun, S.; Agide, Z. Climate Variability and Trends in the Endorheic Lake Hayk Basin: Implications for Lake Hayk Water Level Changes in the Lake Basin, Ethiopia. Environ. Syst. Res. 2022, 11, 10. [Google Scholar] [CrossRef]
  45. Fatichi, S. Mann-Kendall Modified Test. MATLAB Central File Exchange. 2023. Available online: https://www.mathworks.com/matlabcentral/fileexchange/25533-mann-kendall-modified-test (accessed on 1 April 2023).
  46. Hamed, K.H.; Ramachandra Rao, A. A Modified Mann-Kendall Trend Test for Autocorrelated Data. J. Hydrol. 1998, 204, 182–196. [Google Scholar] [CrossRef]
  47. Asfaw, A.; Simane, B.; Hassen, A.; Bantider, A. Variability and Time Series Trend Analysis of Rainfall and Temperature in Northcentral Ethiopia: A Case Study in Woleka Sub-Basin. Weather Clim. Extrem. 2018, 19, 29–41. [Google Scholar] [CrossRef]
  48. Hare, W. Assessment of Knowledge on Impacts of Climate Change—Contribution to the Specification of Art. 2 of the UNFCCC: Impacts on Ecosystems, Food Production, Water and Socio-Economic Systems; Postdam Institute for Climate Impact Research: Postdam, Germany, 2003. [Google Scholar]
  49. Zakwan, M.; Ara, Z. Statistical Analysis of Rainfall in Bihar. Sustain. Water Resour. Manag. 2019, 5, 1781–1789. [Google Scholar] [CrossRef]
  50. Mohamed, M.A.; el Afandi, G.S.; El-Mahdy, M.E.S. Impact of Climate Change on Rainfall Variability in the Blue Nile Basin. Alex. Eng. J. 2022, 61, 3265–3275. [Google Scholar] [CrossRef]
  51. Alemu, M.M.; Bawoke, G.T. Analysis of Spatial Variability and Temporal Trends of Rainfall in Amhara Region, Ethiopia. J. Water Clim. Chang. 2020, 11, 1505–1520. [Google Scholar] [CrossRef]
  52. Agnew, C.T.; Chappell, A. Drought in the Sahel. GeoJournal 1999, 48, 299–311. [Google Scholar] [CrossRef]
  53. de Luis, M.; González-Hidalgo, J.C.; Brunetti, M.; Longares, L.A. Precipitation Concentration Changes in Spain 1946–2005. Nat. Hazards Earth Syst. Sci. 2011, 11, 1259–1265. [Google Scholar] [CrossRef]
  54. Oliver, J.E. Monthly Precipitation Distribution: A Comparative Index. Prof. Geogr. 1980, 32, 300–309. [Google Scholar] [CrossRef]
  55. Jaswal, A.; Kumar, N. Climate Variability in Dharamsala—A Hill Station in Western Himalayas. J. Indian Geophys. Union 2014, 18, 336–355. [Google Scholar]
  56. Mehzabin, S.; Mondal, M.S. Assessing Impact of Climate Variability in Southwest Coastal Bangladesh Using Livelihood Vulnerability Index. Climate 2021, 9, 107. [Google Scholar] [CrossRef]
  57. Vilibić, I.; Denamiel, C.; Pranić, P.; Tojčić, I.; Mihanović, H.; Bonaldo, D.; Raicich, F.; Colucci, R.; Pomaro, A. Assessing Different Aspects of Present State and Ongoing Climate Changes at Both Adriatic and Local Scale; Report by INTERREG Italy—Croatia CHANGE WE CARE Project; 2020. Available online: https://www.italy-croatia.eu/documents/279156/0/D.3.1.1_Present_state_and_changes_at_Adriatic_and_local_scale_v1+%281%29.pdf/7f2531b4-3a33-3813-3962-27954266dd2b?t=1645623251290 (accessed on 1 April 2023).
  58. Bonacci, O.; Patekar, M.; Pola, M.; Roje-Bonacci, T. Analyses of Climate Variations at Four Meteorological Stations on Remote Islands in the Croatian Part of the Adriatic Sea. Atmosphere 2020, 11, 1044. [Google Scholar] [CrossRef]
  59. Bonacci, O.; Bonacci, D.; Patekar, M.; Pola, M. Increasing Trends in Air and Sea Surface Temperature in the Central Adriatic Sea (Croatia). J. Mar. Sci. Eng. 2021, 9, 358. [Google Scholar] [CrossRef]
  60. Branković, Č.; Güttler, I.; Gajić-Čapka, M. Evaluating Climate Change at the Croatian Adriatic from Observations and Regional Climate Models’ Simulations. Clim. Dyn. 2013, 41, 2353–2373. [Google Scholar] [CrossRef]
  61. Bonacci, O.; Bonacci, D.; Roje-Bonacci, T. Different Air Temperature Changes in Continental and Mediterranean Regions: A Case Study from Two Croatian Stations. Theor. Appl. Climatol. 2021, 145, 1333–1346. [Google Scholar] [CrossRef]
  62. Bonacci, O.; Vrsalović, A. Differences in Air and Sea Surface Temperatures in the Northern and Southern Part of the Adriatic Sea. Atmosphere 2022, 13, 1158. [Google Scholar] [CrossRef]
  63. Perčec Tadić, M.; Pasarić, Z.; Guijarro, J.A. Croatian High-Resolution Monthly Gridded Dataset of Homogenised Surface Air Temperature. Theor. Appl. Climatol. 2023, 151, 227–251. [Google Scholar] [CrossRef]
  64. Liu, Z.; Zhang, Z.; Zhou, C.; Ming, W.; Du, Z. An Adaptive Inverse-Distanceweighting Interpolation Method Considering Spatial Differentiation in 3D Geological Modeling. Geosciences 2021, 11, 51. [Google Scholar] [CrossRef]
  65. Babak, O.; Deutsch, C.V. Statistical Approach to Inverse Distance Interpolation. Stoch. Environ. Res. Risk Assess. 2009, 23, 543–553. [Google Scholar] [CrossRef]
  66. Gajić-Čapka, M.; Zaninović, K. Long-Term Trends in Temperature, Precipitation and Runoff at the Croatian Eastern Adriatic Coast. In Proceedings of the BALWOIS 2006, Ohrid, Macedonia, 26 May 2006. [Google Scholar]
  67. Patarčić, M.; Gajić-Čapka, M.; Cindrić, K.; Branković, Č. Recent and Near-Future Changes in Precipitation-Extreme Indices over the Croatian Adriatic Coast. Clim. Res. 2014, 61, 157–176. [Google Scholar] [CrossRef]
Figure 1. Map of the study area showing elevations, locations of weather stations, and water bodies with the dominant watercourse.
Atmosphere 14 00861 g001
Figure 2. Average monthly air temperatures at the stations Imotski and Ričice.
Atmosphere 14 00861 g002
Figure 3. Time series of minimum (a), mean (b), and maximum (c) annual air temperatures at Imotski and Ričice stations for the period from 1993 to 2021.
Atmosphere 14 00861 g003
Figure 4. Time series of minimum (a), mean (b), and maximum (c) annual air temperatures at Imotski station for the period from 1981 to 2021.
Atmosphere 14 00861 g004
Figure 5. Average monthly precipitation at the stations Imotski and Ričice.
Atmosphere 14 00861 g005
Figure 6. Spatial distribution of annual precipitation in the wider area of Imotsko polje, with the locations of the target (Imotski and Ričice) and reference (Vrgorac, Livno, Mostar, Sinj, and Split) stations.
Atmosphere 14 00861 g006
Figure 7. Heatmap with Pearson coefficients of determination for annual precipitation between neighboring stations in the period 1993–2021.
Atmosphere 14 00861 g007
Figure 8. Time series of annual precipitation and trends for Imotski station from 1981 to 2021 (a) and comparison of annual precipitation and trends for Imotski and Ričice stations for the period from 1993 to 2021 (b).
Atmosphere 14 00861 g008
Figure 9. Precipitation concentration index (PCI) on an annual scale at the Imotski and Ričice meteorological stations.
Atmosphere 14 00861 g009
Figure 10. Monthly precipitation at Imotski station for the years 1997, 2006, and 2020, for which monthly precipitation is classified as low, moderate, and high, respectively, according to PCI values.
Atmosphere 14 00861 g010
Figure 11. Standardized rainfall anomalies (SRA) at the Imotski and Ričice meteorological stations.
Atmosphere 14 00861 g011
Table 1. Magnitudes of the trend (β) and results of the Mann–Kendall test (p) for the series of annual minimum, mean, and maximum temperatures at the Imotski (IM) and Ričice (RI) stations for the period from 1993 to 2021.
S-Slope (β)MK-Test (p)
Temperature (°C)IMRIIMRI
minimum−0.0667−0.05100.07210.4092
mean0.04370.0387 9.88   ×   10 - 4  * 7.10   ×   10 - 6  *
maximum0.08130.03830.11310.1650
* statistically significant trend.
Table 2. Magnitudes of the trend (β) and results of the Mann–Kendall test (p) for the series of minimum, mean, and maximum annual temperatures at the station Imotski for the period from 1981 to 2021.
Temperature (°C)S-Slope (β)MK-Test (p)
minimum−0.00500.7670
mean0.0437 3.76   ×   10 - 7  *
maximum0.05900.0131 *
* statistically significant trend.
Table 3. Monthly minimum, mean, maximum precipitation (mm), and coefficients of variation for Imotski and Ričice stations during the 1993–2021 period.
MinimumMeanMaximumCV
MonthImotskiRičiceImotskiRičiceImotskiRičiceImotskiRičice
January1.42.6136.4142.1310.7313.165.464.0
February0.71.4103.8112.1236.7238.461.161.9
March0.00.199.8105.9259.1276.172.371.8
April21.66.398.9103.6202.322342.850.1
May13.611.283.283.8201.5177.451.854.2
June7.94.362.264.1256.1178.287.368.2
July1.82.845.249.5164.3225.689.8104.8
August0.0045.256.1238.9236.9109.093.2
September21.926.5112.0115.1340.4307.963.561.3
October12.67.5120.7122.3281.2298.764.156.2
November47.054.1186.2214.2361.2470.149.456.5
December0.00172.7192.4444.9450.262.361.3
Table 4. Magnitude of the trend (β) and result of the Mann–Kendall test (p) for annual precipitation at Imotski station for the period from 1981 to 2021.
S-Slope (β)MK-Test (p)
Annual precipitation6.05750.1474
Table 5. Magnitudes of the trend (β) and results of the Mann–Kendall test (p) for the series of annual precipitation at stations Imotski (IM) and Ričice (RI) for the period from 1993 to 2021.
S-Slope (β)MK-Test (p)
StationIMRIIMRI
Annual precipitation4.7727−2.76930.58650.6936
Table 6. Precipitation, P (mm), and its return periods, T (year), calculated for maximum annual and maximum monthly precipitation measured at Imotski station in 1981–2021 and at Ričice station in 1993–2021, using GEV distribution.
IMOTSKIRIČICE
Pmax (mm)T (Year)Pmax (mm)T (Year)
annual1968.763209336
monthly444.9100313.150
Disclaimer/Publisher’s Note: The statements, opinions and data contained in all publications are solely those of the individual author(s) and contributor(s) and not of MDPI and/or the editor(s). MDPI and/or the editor(s) disclaim responsibility for any injury to people or property resulting from any ideas, methods, instructions or products referred to in the content.

