Abstract
Atmospheric environmental pollution has become a critical issue in eastern coastal cities in China, so a broad understanding of its spatiotemporal characteristics is of importance to develop public policies. In this study, hourly data of ρ(PM2.5), ρ(PM10), ρ(NO2), ρ(SO2), ρ(O3) and φ(CO) of five different types of national air quality monitoring sites from 2016 to 2020 were analyzed, combined with the change of meteorological elements in the same period in Yancheng, which was a rapidly developed eastern coastal city in China. The results indicated that the pollutant concentrations except for ρ(O3) was low in summer and high in winter, decreasing year by year from 2016 to 2020. The proportion of moderately and heavily contaminated days in the whole year was decreasing from 80 days in 2016 to 52 days in 2020, and the days with good quality increased from 284 days in 2016 to 311 days in 2020. ρ(O3) was the highest in spring and the lowest in winter, increasing slightly year by year. The variation of ρ(PM2.5), ρ(PM10), ρ(NO2), ρ(SO2) and φ(CO) showed a double-peak type, reaching the peak value at 8:00–10:00 and 20:00–22:00, corresponding to the early and evening rush hours. ρ(PM2.5), ρ(PM10) and φ(CO) on the weekend were higher than on weekdays, while an insignificant difference of ρ(NO2), ρ(O3) and ρ(SO2) was found between weekdays and the weekend. Wind direction played a key role in the variation of pollutant concentration in the Yancheng urban area, and the correlation analysis indicated that ρ(PM2.5) and ρ(PM10) were highly correlated to wind direction. Temperature was positively correlated to ρ(O3), while air pressure was significantly negatively correlated to ρ(O3). Relative humidity was negatively correlated to ρ(PM2.5), ρ(PM10), ρ(NO2), ρ(SO2) and φ(CO), while air pressure was positively correlated with these pollutants.
1. Introduction
The World Health Organization (WHO) reported that 99% of the world population in 2019 was living in places where the updated WHO Air Quality Guidelines’ (AQG) level for annual average fine particular matter (PM2.5) concentration (5 µg/m3) was not met [1]. Annually, there were 4.2 million premature deaths throughout the world attributed to air pollution, both for cities and rural aeras [2]. Recent studies conducted in North America have shown that long-term exposure to PM2.5 was associated with mortality also at low exposures (i.e., below the current WHO guideline). Particularly in North America and Europe, tougher air quality policies have led to a reduction in emissions and a gradual decline in ambient air pollution concentrations [3].
The five megacities with the highest particulate matter pollution level are all located in developing countries [4]. With the rapid development of urbanization and the economy, energy transition and a rising number of motor vehicles in China, the atmospheric environmental pollution problem has attracted great public attention [5]. The adverse impacts of ambient air pollution on human health and the ecosystem have been widely recognized [6]. Air quality and its effect on human health is an important indicator for the construction of an ecological city and sustainable development. In China, four long-duration, highly contaminated and extensively affected heavy-pollution processes occurred in January of 2013. PM2.5 index monitors of more than 30 cities in China were maxed out, indicating the rather worse air quality [7]. In fact, after early December every year, days of heavy pollution caused by haze always run at a high level in eastern coastal cities, due to coal burning for central heating. Therefore, atmospheric pollutants deserve to be investigated with a characteristic analysis to better guide air pollution control. In 2014, in order to control inhalable particle (PM10) and fine particulate (PM2.5) concentration, the Air Pollution Prevention and Control Action Plan was put out in China. Thereafter, comprehensive measures were intensified to reduce the discharge of multiple pollutants in order to control PM10 and PM2.5. In order to evaluate the effect of the comprehensive measures adopted, a spatiotemporal assessment of atmospheric pollutants was quite necessary by comparing historic monitoring data among the assessment years. Song et al. [8] investigated the spatiotemporal characteristics and health impacts of ambient fine particulate matter in China, which were very important for clarifying the current pollution situation and the health impact of air pollution, providing a reference for assessing the damage caused by air pollution. However, few studies have been able to document the variation at the city level or national scale [1].
Recently, a characteristic analysis and formation mechanism of atmospheric pollutants were studied in terms of a synoptic circulation pattern and a numerical simulation [9]. It was widely recognized that stable weather conditions, temperature inversion and abundant water vapor were rather beneficial for the occurrence of heavy pollution. Investigation of the evolution characteristics of air quality of the Beijing-Tianjin-Hebei region and the Yangtze River Delta economic zone indicated that ρ(PM2.5) was closely related to human daily life during the air heavy pollution event [10,11]. In our previous study, it was found that the implementation of emission reduction measures during the spring festival in 2015 was rather beneficial for the improvement of air quality in Nanjing, China [12]. Wang et al. [13] found that industrial emission reduction was efficient for the improvement of air quality in the Yangtze River Delta economic zone of China, especially during a heavy pollution period. Based on atmospheric-environment-monitoring data, Liu et al. [14] indicated peak control of particulate pollution such as PM2.5 and PM10 through emergency measures could be achieved more easily than that of gas pollution such as SO2 and NO2. After the implementation of the Air Pollution Prevention and Control Action Plan in 2013, air quality in China significantly improved. The PM2.5 concentration in the Yangtze River Delta economic zone in 2017 decreased by 34.3% compared to that in 2013 [11]. Thereby, structural optimization of industry, energy and communication and transportation that benefits from the adopted air pollution control regulation could be promoted.
Yancheng City is located east of the Jianghuai Plain, belonging to the Yangtze River Delta economic zone of China. It is the intersection of the Yangtze River Economic Belt, where the automobile industry, textile, chemical and machinery industries were developed rapidly recently. After the implementation of the Air Pollution Prevention and Control Action Plan, a characteristic analysis and spatiotemporal assessment of atmospheric pollutants in Yancheng City deserved to be carried out. In this study, variation characteristics and trend of the air pollutant concentration of Yancheng City in the winter from 2016 to 2020 was analyzed based on air pollutant monitoring data and meteorological monitoring data. A spatiotemporal assessment of atmospheric pollutants affecting air quality in Yancheng City was carried out. This study would provide a technical basis for the development of an accurate air pollution control strategy.
2. Materials and Methods
2.1. Sampling Locations
In order to investigate air quality characteristics, the main contaminant affecting air quality and the main meteorological element in the urban area of Yancheng City, continuous monitoring data of an automatic monitoring station for ambient air quality from 2016 to 2020 were used in this study, including ρ(PM2.5), ρ(PM10), ρ(NO2), ρ(SO2), ρ(O3), φ(CO) and contemporaneous meteorological data. Five national air quality monitoring sites were adopted, including the Yancheng power plant, Yancheng monitoring station, development zone management committee, Baolong square and Wenfeng secondary school (Figure 1). These monitoring sites were all located in flat urban areas, without tall buildings and local air pollution around. They covered places of industry, culture and education, commerce, residence and traffic, which were representative.
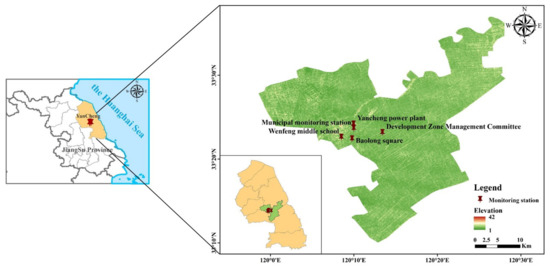
Figure 1.
Distribution map of observation stations in Yancheng City.
2.2. Analytical Methods
PM2.5 and PM10 concentrations were analyzed on a particle monitor (BAM1020, Metone, Grants Pass, OR, USA) based on a beta ray decay method. The measurement resolution and display resolution of PM2.5 and PM10 were found to be 0.1 µg/m3 and 1 µg/m3, respectively. The NO2 concentration was analyzed on a nitrogen-oxide analyzer (T200, API, Washington, DC, USA) based on a chemiluminescence method, whose detection limit was 0.4 ppb. The SO2 concentration was analyzed on a SO2 analyzer (T100, API, USA) based on an ultraviolet fluorescence method, whose detection limit was 0.4 ppb. The O3 concentration was analyzed on an ultraviolet ozone analyzer (400E, API, USA) based on an ultraviolet spectrophotometric method, whose detection limit was 0.6 ppb. The CO concentration was analyzed on a CO analyzer (300E, API, USA) based on an infrared absorption method, whose detection limit was 0.04 ppm. Hourly concentration values of air pollutants from the five national air quality monitoring sites were collected in this study, with the average values and standard deviations calculated within a specific time range. Quality assurance and quality control of the ground monitoring data have been reported in previous studies [15]. All downloaded data were pre-processed to reject spatial and temporal outliers. This was carried out by comparing every single value with the values from adjacent monitoring stations and with the time series data. Percentiles were used to evaluate the spatiotemporal characteristics of atmospheric pollutants. The Daily Individual Air Quality Indexes (IAQIs) of the main pollutants (PM2.5, PM10, SO2, NO2, CO, O3) were calculated based on the standards of air quality classification in the Technical Regulation of Ambient Air Quality Index (HJ 633-2012). The maximal IAQI values among the IAQI values of the main pollutants were chosen as the Air Quality Index (AQI).
3. Results
3.1. Overview of Air Quality in the Urban Area of Yancheng
Based on the analysis of Air Quality Index (AQI) variation of the Yancheng urban area from 2016 to 2020, the total numbers of excellent and good days were calculated to be 284, 286, 290, 286 and 311 days, respectively (Figure 2a). The primary pollutants in the Yancheng urban area were found to be PM2.5, PM10 and O3. The total numbers of excellent and good days in the Yancheng urban area were calculated to be higher than 80% of the total days every year, and the percentages were increasing year by year. From 2016 to 2020, no severely contaminated days were observed. There were 80, 76, 68, 78 and 52 moderately and heavily contaminated days from 2016 to 2020, with the average percentage being 4.3%.
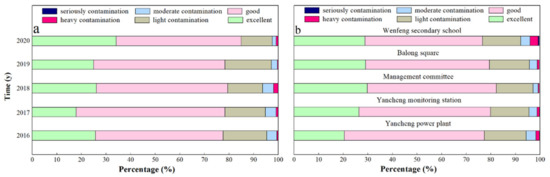
Figure 2.
(a) Percentage of days with different contamination types from 2016 to 2020 overall and (b) at the five national air quality monitoring sites.
The average ratio of excellent and good days for the five national control stations, namely the Yancheng power plant, Yancheng monitoring station, development zone management committee, Baolong square and Wenfeng secondary school, was calculated to be 79.1%. Among the five stations, the Wenfeng secondary school station showed the lowest ratio of excellent and good days, i.e., 76.6%, while the development zone management committee station showed the highest ratio, i.e., 82.3%.
3.2. Interannual and Seasonal Characteristics of Air Pollutant Concentrations
Statistics and analysis of the variation in the concentrations of major air pollutants was carried out in order to investigate the pollution characteristics from 2016 to 2020 in the urban area of Yancheng. As indicated in Figure 3a, the annual average values of ρ(PM2.5), ρ(PM10), ρ(NO2), ρ(SO2), φ(CO) and ρ(O3) were 69.8 µg/m3, 40.5 µg/m3, 24.9 µg/m3, 9.4 µg/m3, 0.7 mg/m3 and 104.1 µg/m3, respectively. The overall trend of ρ(PM2.5), ρ(PM10), ρ(NO2), ρ(SO2) and φ(CO) was downward but with slight fluctuation from 2016 to 2020 in Yancheng. However, ρ(O3) was increased slightly. The annual average values of ρ(PM2.5), ρ(PM10), ρ(NO2), ρ(SO2) and φ(CO) in Yancheng were obviously lower than those observed in the cities such as Nanjing within Jiangsu Province. The annual average values of ρ(PM2.5), ρ(PM10), ρ(NO2), ρ(SO2), φ(CO) and ρ(O3) were 231 µg/m3, 283 µg/m3, 119 µg/m3, 82.6 µg/m3, 2.2 mg/m3 and 99 µg/m3 from December in 2014 to February in 2015 in Nanjing. During 2014–2016, the annual population-weighted-average (PWA) values in China were 33.3–39.6 µg/m3 for NO2, 21.9–34.1 µg/m3 for SO2 and 1.1–1.2 mg/m3 for CO, which was comparable with those in this study [15].
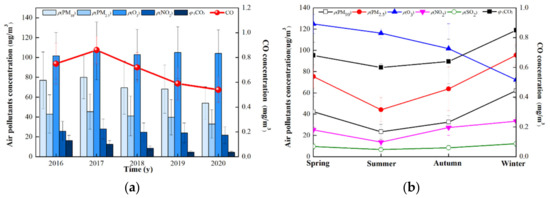
Figure 3.
The (a) annual and (b) seasonal variations of air pollution concentration.
The seasonal variation of air pollutant concentrations is illustrated in Figure 3b. It could be seen that ρ(O3) showed an obvious seasonal variation, following the order of spring > summer > autumn > winter. In spring, the increase of temperature and solar radiation was rather beneficial for the generation and accumulation of O3, resulting the maximum value within the whole year. In summer, due to the influence of plum rain and typhoon in Yancheng, solar radiation could be weakened and air convection could be sped up by the severe precipitation and strong wind. In addition, due to the wet cleaning by the precipitation and pollutant diffusion by the wind, the ozone precursor in the air could be eliminated, resulting the decrease of ρ(O3). This was the main reason that contributed to the lower ρ(O3) in summer, even at higher solar radiation than in spring. However, this result was quite different from the observation that the highest ρ(O3) was observed in summer when solar radiation was the strongest, in cities such as Beijing [16], Chengdu [17] and Shenzhen [18]. During autumn and winter, with the decrease of temperature and solar duration, ρ(O3) decreased gradually, reaching the minimum value in winter [18]. However, other pollutants such as PM2.5, PM10, NO2, SO2 and CO reached the maximum values in winter due to the low temperature, calm and steady weather, easy occurrence of temperature inversion, high humidity and calm wind in winter [17]. In addition, dust brought from the cold northern air was helpful for the increase of air pollutant concentration. In summer, the concentrations of other pollutants were also decreased due to the effect of plum rain and typhoon, which was consistent with other studies [5].
3.3. Monthly Variation of Air Pollutant Concentrations
As indicated in Figure 4a,b, both ρ(PM2.5) and ρ(PM10) showed a U-type monthly trend, which was different from W-type monthly trend observed in the Beijing-Tianjin-Hebei region [19]. The highest ρ(PM2.5) and ρ(PM10) values were often observed in January, followed by those in December. For example, ρ(PM2.5) and ρ(PM10) in January of 2018 were as high as 80.5 µg/m3 and 118.3 µg/m3, respectively. This phenomenon was closely related to the energy consumption for heating, calm and steady weather and the dust carried by the cold air in the north [20]. ρ(PM10) showed a more significant increase than ρ(PM2.5) did, indicating that ρ(PM10) was more prone to being affected by the dust carried by the cold air than ρ(PM2.5) was. The lowest ρ(PM2.5) and ρ(PM10) values were 16.1 µg/m3 and 31.6 µg/m3, respectively, which were observed in August of 2018 and 2019, probably due to the most frequent typhoon activity. In August, ρ(PM2.5) and ρ(PM10) reached minimum values due to the occurrence of heavy wind and rain [21]. In addition, ρ(PM2.5) and ρ(PM10) values in 2017 were higher than in other years, due to the largest construction area in 2017 within the five years. Dust emission generated from construction and transportation resulted in high concentrations of ρ(PM2.5) and ρ(PM10). A similar phenomenon was also observed by Song et al. [8]. It was found that in terms of the PM2.5 concentration, January and December were the most polluted months, whereas July and August were the least polluted months. The most highly polluted areas were concentrated in northern China, probably due to the increased energy consumption for heating in northern China, especially in winter.
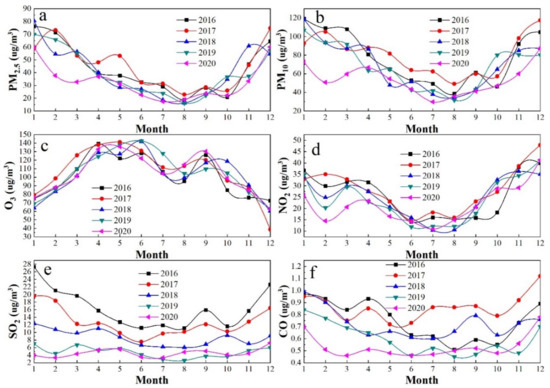
Figure 4.
Monthly variation of air pollution concentration ((a): PM2.5; (b): PM10; (c): O3; (d): NO2; (e): SO2; (f): CO).
As indicated in Figure 4c, ρ(O3) usually reached the minimum values in November, December and January, and often reached the maximum values in May and June due to the increased solar radiation [17]. In July and August, ρ(O3) often decreased due to the effect of plum rain and typhoon. In September, ρ(O3) often increased again due to the enhanced sunshine and solar radiation under reduced typhoon activity, before the reduction in October. The variation profile of ρ(O3) was in the shape of an inverted U, which was rather different from that of ρ(PM2.5) and ρ(PM10). After 2017, ρ(O3) in summer increased year by year, although the increase was insignificant. NOx release in cities was mainly due to motor traffic sources, power plants and industries [22]. Among them, motor vehicle emissions were responsible for more than 50% of the total emissions [23]. ρ(NO2) in Yancheng reached the maximal value of 47.9 µg/m3 in December and the minimal value of 11.8 µg/m3 in June of 2019. During the Spring Festival in February, ρ(NO2) was slightly decreased due to reduced human activity and halted production of the factory. Emission of NOx, which is recognized as another acid rain precursor, is expected to increase due to the rapidly increasing number of motor vehicles. A decreasing trend of ρ(NO2) was observed from 2016 to 2020 year by year, indicating great effectiveness of the adopted measures, such as denitration of flue gas and motor vehicle exhaust control [24]. Similarly, ρ(SO2) decreased year by year from 2016 to 2020. The maximal value was observed in January, with the annual average value of 14.1 µg/m3, while the minimal value was observed in June, with the annual average value of 6.6 µg/m3. Considering the fact that there was no obvious heating season in Yancheng, and the increase of coal burning in winter was relatively limited, the average ρ(SO2) was significantly lower than the values observed in the northeast and the Beijing-Tianjin-Hebei region [25]. However, a similar variation profile was observed, and peak values were observed in autumn and winter. With an increase in the number of vehicles, high enrichment factors of [SO42-] were obtained. Similar to NO2, the low emissions of SO2 could be attributed to the wide adoption of desulfurization and the effective control of motor vehicle exhaust, promoting a cleaner atmosphere [25]. Similar to those of ρ(NO2) and ρ(SO2), the peak value of φ(CO) was also observed in December and January, due to the increased coal burning in winter. However, as compared to those of ρ(O3), ρ(NO2) and ρ(SO2), the monthly variation of φ(CO) was relatively smooth.
3.4. Daily Variation of Air Pollutant Concentrations
Daily variations of ρ(PM2.5), ρ(PM10), ρ(NO2), ρ(SO2), φ(CO) and ρ(O3) are demonstrated in Figure 5. It could be observed that the daily variation of ρ(O3) showed a typical unimodal shape within the recent five years, with the peak value observed at 14:00. The peak value of the average ρ(O3) was observed to be 106.4 µg/m3 at 14:00, while the minimal value of the average ρ(O3) was calculated to be 47.5 µg/m3 at 07:00. This phenomenon could be attributed to the promotion of O3 generation under high temperature and intense radiation at noon, when the atmospheric photochemical reaction was accelerated [26]. However, before and after sunrise, solar radiation was relatively weak, and the increased ρ(NO2) during the morning rush hour was beneficial for the consumption of O3 through the reductive reaction. Thereafter, with the increase of solar radiation, ρ(O3) increased gradually. The daily variation of ρ(NO2) showed a shape consisting of a single valley and double peaks [27]. However, the fluctuation was not obvious, and peak values were observed during 6:00–7:00 and 20:00–21:00. With the increase of solar radiation, NO2 could act as a precursor of O3 in the photochemical reaction, which could be consumed after sunrise [28]. The valley value of ρ(NO2) was observed at 13:00–14:00. Thereafter, with the approaching evening rush hour, emission sources such as vehicle exhaust were enhanced, resulting in the accumulation of NO2. At around 20:00, ρ(NO2) reached the highest point, which was consistent with the profile of ρ(NO2) in Nanjing observed in our previous study [12]. The daily variations of ρ(PM2.5) and ρ(PM10) were basically synchronized, showing bimodal patterns. ρ(PM2.5) and ρ(PM10) reached peak values at around 8:00 and 20:00 and reached valley values at around 14:00. The peak values of ρ(PM2.5) and ρ(PM10) were corresponding well to the morning and evening rush hours, indicating the contribution of motor vehicle exhaust emissions [29]. After 23:00 and before the early morning, due to reduced human activity, ρ(PM2.5) and ρ(PM10) were relatively low, with relatively slight variation, even at the relatively high humidity and relatively stable atmospheric stratification.
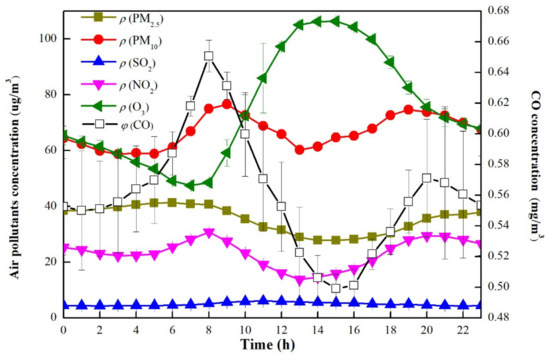
Figure 5.
Daily variations of ρ(PM2.5), ρ(PM10), ρ(NO2), ρ(SO2), φ(CO) and ρ(O3).
The daily variation of ρ(SO2) was relatively stable, with ρ(SO2) maintained at a relatively low level. ρ(SO2) reached the peak value at 11:00–12:00, probably due to the accumulation of SO2 during the morning rush hours. After sunrise, due to the thermal effect of solar radiation, partial SO2 in the upper inversion layer was transferred to the ground through vertical convection, resulting in the peak values observed at around noon. CO should be considered as a potential public health risk to urban populations at current ambient exposure levels [30]. The daily variation of φ(CO) showed a typical bimodal pattern in Yancheng, with the peak values observed at around 08:00 and 20:00 and valley values observed at around 15:00. From 22:00 to 05:00, with the reduce of anthropogenic emission sources and formation of nocturnal inversion, φ(CO) varied slightly. After 06:00, with the increase of emissions from motor vehicles during the morning rush hours and the increase of plant emission sources, φ(CO) increased rapidly. After the morning rush hours, φ(CO) decreased, until valley values were observed at around 15:00. In addition, with the increase of solar radiation, temperature and atmospheric turbulence, CO participated in photochemical reactions as reactants, which was also responsible for the decrease of φ(CO) [31]. Thereafter, during the evening rush hours, with the decrease of solar radiation, φ(CO) was increased until peak values were observed at around 20:00.
3.5. Weekend Effect in Air Pollution Concentration
Variation in atmospheric pollutant concentrations is often subject to periodic changes in emission sources. Therefore, a different variation profile was often observed between working days and the weekend. It is widely recognized that the weekend effect is closely related to the human lifestyle, reflecting the local economic level and industrial production [32]. In this study, the air pollution concentration profiles of working days and the weekend were compared in order to investigate the weekly periodic variation profile. As indicated in Figure 6, ρ(PM2.5), ρ(PM10) and φ(CO) on the weekend were obviously higher than those on working days, which was rather different from some typical cities such as Chongqing, where the pollutant concentrations on working days are higher than those on the weekend [33]. This phenomenon could be related to the high density of traffic and frequent activity on the weekend in Yancheng. In addition, it could be observed that the variation profiles of pollution concentration on the weekend were consistent with those on working days. ρ(PM2.5) reached peak values at around 08:00 and reached valley values at 13:00–14:00 on both the weekend and working days. In the daytime, the difference of both ρ(PM10) and φ(CO) between the working days and the weekend was insignificant, with the discrepancy maintained at around 5%. However, during 20:00–01:00, the discrepancy of ρ(PM10) and φ(CO) would be magnified to 17% and 13%, respectively. An insignificant difference in terms of ρ(NO2), ρ(O3) and ρ(SO2) could be observed between the working days and the weekend. At around 07:00–08:00, valley values of ρ(O3) and peak values of ρ(NO2) were observed, while peak values of ρ(O3) and valley values of ρ(NO2) were observed at around 14:00. At 11:00, the maximum difference in terms of ρ(SO2) between the working days and the weekend was observed to be as high as 20%, although the average difference of ρ(SO2) within the whole day was as low as 2%. The main reason was that SO2 in the inversion layer before sunrise was transported to the ground through vertical convection after sunrise due to the thermal effect caused by solar radiation, resulting in the formation of peak concentrations at noon. At night, ρ(SO2) was lower than that in the daytime, probably due to the clearing of SO2 through wet deposition at the high humidity of air in the evening.
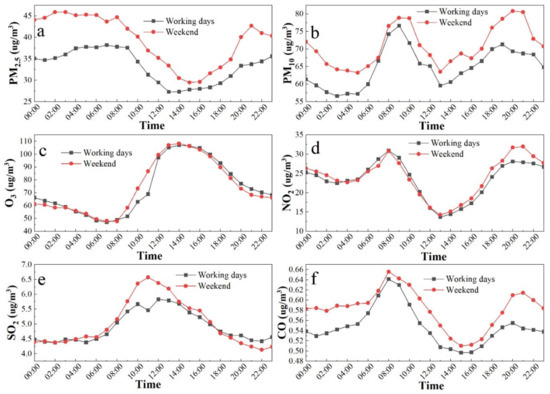
Figure 6.
Difference of air pollution concentrations between working days and the weekend: PM2.5 (a), PM10 (b), O3 (c), NO2 (d), SO2 (e) and CO (f).
3.6. Relationship between Atmospheric Pollutants and Meteorology
Yancheng, as the central coastal city of Jiangsu, China, enjoys a monsoon and subtropical humid climate on the northern edge, with four distinct seasons. Based on the wind direction frequency statistics in the four seasons, it could be seen that east-to-southeast wind dominated in spring and summer, with the wind direction frequency as high as 22% (Figure 7). The clean air at sea could be transported to Yancheng by east-to-southeast wind, which was beneficial for the diffusion purification of atmospheric pollutants. In addition, during the plum rain period in summer, rainfall was frequent, and typhoon was active, which was helpful for the wet removal of contaminants.
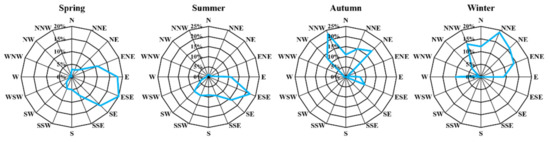
Figure 7.
Seasonal wind direction frequency in Yancheng (the blue line indicated the wind direction).
The wind speed in March, April and May was often the highest within the whole year. The average wind speed in April was as high as 5 m/s, while the average wind speed in October was as low as 2.5 m/s. High wind speed in spring and summer, as well as the east-to-southeast wind, was rather beneficial for the diffusion and dilution of various pollutants, resulting in better air quality. In autumn and winter, northeastern and northwest wind was dominant in Yancheng, respectively. Under the condition of steady weather, low wind speed and temperature inversion, extraneous pollutant air mass and local pollution was beneficial for the accumulation of pollutants. Therefore, air quality in autumn and winter was worse than that in spring and summer.
Pearson correlation coefficient analysis of atmospheric pollutant concentrations and meteorological elements was carried out, as indicated in Figure 8. ρ(PM2.5), ρ(PM10), ρ(NO2), ρ(SO2), φ(CO) and ρ(O3) showed a negative correlation to relative humidity, which could be attributed to the wet removal of contaminants under high humidity in the area close to the Yellow Sea. Ρ(PM2.5), ρ(PM10) and ρ(NO2) showed a significant negative correlation to temperature. However, ρ(O3) showed a positive correlation to temperature but a negative correlation to relative humidity, indicating that high temperature and low humidity was beneficial for the photolysis reaction. In the photolysis reaction, O3 could be generated, while the precursor, namely NO2, could be assumed [16]. Therefore, ρ(NO2) showed a negative correlation to temperature and wind speed, while ρ(O3) showed a positive correlation to wind speed, indicating that low-level air transport would increase the accumulation of air contaminants and result in the increase of contaminant concentration. ρ(PM2.5), ρ(PM10) and φ(CO) showed a significant negative correlation to temperature, due to pollutant diffusion under a high temperature [34]. Except for ρ(NO2), other contaminants showed insignificant positive correlations to wind speed, indicating high pollutant transport under high wind speed. ρ(PM2.5), ρ(PM10) and ρ(NO2) showed significant positive correlations to atmospheric pressure. The strong wind brought by subtropical high and cold high pressure was rather beneficial for the transport of pollutants such as PM2.5, PM10 and NO2 from other places [35]. In Hefei, the capital city of the Anhui Province in China, the Pearson correlation coefficient was used to identify the relationship between PM2.5 and SO2, CO, NO2 and O3. It was found that SO2, CO and NO2 had significant correlations with PM2.5, but O3 had no significant correlation with PM2.5 [36].
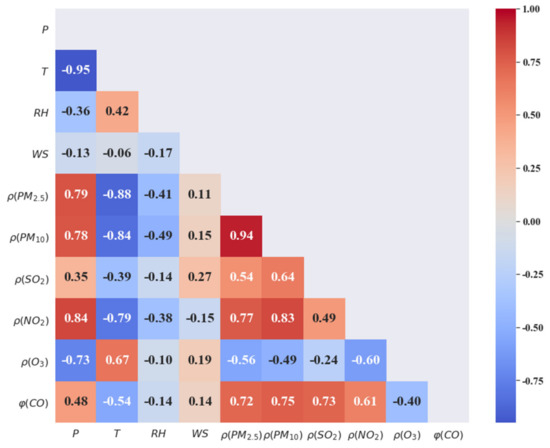
Figure 8.
The correlation coefficients between atmospheric pollutant concentrations and meteorological factors.
4. Conclusions
In this study, ρ(PM2.5), ρ(PM10), ρ(NO2), ρ(SO2), ρ(O3) and φ(CO) of Yancheng from 2016 to 2020, combined with the change of meteorological elements, were analyzed. ρ(PM2.5), ρ(PM10), ρ(NO2), ρ(SO2) and φ(CO) were low in summer and high in winter, decreasing year by year from 2016 to 2020. ρ(O3) was the highest in spring and the lowest in winter, increasing slightly year by year. The variations of ρ(PM2.5), ρ(PM10), ρ(NO2), ρ(SO2) and φ(CO) showed a double-peak type, reaching the peak values at the early and evening rush hours. ρ(PM2.5), ρ(PM10) and φ(CO) on the weekend were higher than on weekdays, while an insignificant difference of ρ(NO2), ρ(O3) and ρ(SO2) was found between the weekdays and weekend. Wind direction played a key role in the variation of pollutant concentrations in the Yancheng urban area. Temperature was positively correlated to ρ(O3), while air pressure was significantly negatively correlated to ρ(O3). Relative humidity was negatively correlated to ρ(PM2.5), ρ(PM10), ρ(NO2), ρ(SO2) and φ(CO), while air pressure was positively correlated with these pollutants.
Author Contributions
Conceptualization: B.W. and L.H.; methodology: C.Z.; formal analysis: G.Z.; investigation: X.Y.; writing—original draft preparation: B.W.; writing—review and editing: L.H.; visualization: R.Y.; supervision: M.Z. All authors have read and agreed to the published version of the manuscript.
Funding
This work was financed by the National Natural Science Foundation of China (No. 41575135) and the Scientific Research Project of Jiangsu Meteorological Bureau (KZ201906, KM202105).
Institutional Review Board Statement
Not applicable.
Informed Consent Statement
Not applicable.
Data Availability Statement
Not applicable.
Conflicts of Interest
The authors declare no conflict of interest.
References
- Faridi, S.; Krzyzanowski, M.; Cohen, A.J.; Malkawi, M.; Safi, H.A.M.; Yousefian, F.; Azimi, F.; Naddafi, K.; Momeniha, F.; Niazi, S.; et al. Ambient Air Quality Standards and Policies in Eastern Mediterranean Countries: A Review. Int. J. Public Health 2023, 68, 1605352. [Google Scholar] [CrossRef] [PubMed]
- Duarte, A.L.; Schneider, I.L.; Artaxo, P.; Oliveira, M.L.S. Spatiotemporal assessment of particulate matter (PM10 and PM2.5) and ozone in a Caribbean urban coastal city. Geosci. Front. 2022, 13, 101168. [Google Scholar] [CrossRef]
- de Hoogh, K.; Chen, J.; Gulliver, J.; Hoffmann, B.; Hertel, O.; Ketzel, M.; Bauwelinck, M.; van Donkelaar, A.; Hvidtfeldt, U.A.; Katsouyanni, K.; et al. Spatial PM2.5, NO2, O3 and BC models for Western Europe-Evaluation of spatiotemporal stability. Environ. Int. 2018, 120, 81–92. [Google Scholar] [CrossRef] [PubMed]
- Wang, H.B.; Zhao, L.J. A joint prevention and control mechanism for air pollution in the Beijing-Tianjin-Hebei region in China based on long-term and massive data mining of pollutant concentration. Atmos. Environ. 2018, 174, 25–42. [Google Scholar] [CrossRef]
- Wang, B.N.; Luo, X.C.; Liu, D.Y.; Su, Y.; Wu, Z.Y. The effect of construction dust and agricultural fertilization on the precipitation chemical composition during summer in the Yangtze River Delta area, China. Atmos. Pollut. Res. 2021, 12, 101121. [Google Scholar] [CrossRef]
- Heroux, M.E.; Anderson, H.R.; Atkinson, R.; Brunekreef, B.; Cohen, A.; Forastiere, F.; Hurley, F.; Katsouyanni, K.; Krewski, D.; Krzyzanowski, M.; et al. Quantifying the health impacts of ambient air pollutants: Recommendations of a WHO/Europe project. Int. J. Public Health 2015, 60, 619–627. [Google Scholar] [CrossRef]
- Zhao, P.S.; Dong, F.; He, D.; Zhao, X.J.; Zhang, X.L.; Zhang, W.Z.; Yao, Q.; Liu, H.Y. Characteristics of concentrations and chemical compositions for PM2.5 in the region of Beijing, Tianjin, and Hebei, China. Atmos. Chem. Phys. 2013, 13, 4631–4644. [Google Scholar] [CrossRef]
- Song, Y.; Wang, X.; Maher, B.A.; Li, F.; Xu, C.; Liu, X.; Sun, X.; Zhang, Z. The spatial-temporal characteristics and health impacts of ambient fine particulate matter in China. J. Clean. Prod. 2016, 112, 1312–1318. [Google Scholar] [CrossRef]
- Zhang, R.H.; Li, Q.; Zhang, R.N. Meteorological conditions for the persistent severe fog and haze event over eastern China in January 2013. Sci. China-Earth Sci. 2014, 57, 26–35. [Google Scholar]
- Zhang, X.L.; Shi, M.J.; Li, Y.J.; Pang, R.; Xiang, N. Correlating PM2.5 concentrations with air pollutant emissions: A longitudinal study of the Beijing-Tianjin-Hebei region. J. Clean. Prod. 2018, 179, 103–113. [Google Scholar] [CrossRef]
- Xu, G.Y.; Ren, X.D.; Xiong, K.N.; Li, L.Q.; Bi, X.C.; Wu, Q.L. Analysis of the driving factors of PM2.5 concentration in the air: A case study of the Yangtze River Delta, China. Ecol. Indic. 2020, 110, 105889. [Google Scholar] [CrossRef]
- Wang, B.N.; Pu, M.J.; Chen, P.; Sun, M. Characteristic Analysis of Atmospheric Pollutants in Nanjing Urban Area in Winter. Res. Environ. Sci. 2017, 30, 1335–1345. [Google Scholar]
- Wang, X.Y.; Jiang, F.; Xu, S.C.; Tian, X.D.; Yao, D.F. Assessment of Emergency Emission Reduction Effect during a Severe Air Pollution Episode in Yangtze River Delta Region. Res. Environ. Sci. 2020, 33, 783–791. [Google Scholar]
- Liu, W.W.; Duan, J.C.; Hu, J.N.; Yin, L.N.; Hu, B.X.; Yang, C.; Yu, R. Effect Assessment of Emergency Measures for Heavy Air Pollution based on Environmental Monitoring Data. Res. Environ. Sci. 2019, 32, 734–741. [Google Scholar]
- Song, C.; Wu, L.; Xie, Y.; He, J.; Chen, X.; Wang, T.; Lin, Y.; Jin, T.; Wang, A.; Liu, Y.; et al. Air pollution in China: Status and spatiotemporal variations. Environ. Pollut. 2017, 227, 334–347. [Google Scholar] [CrossRef]
- Wang, Y.; Konopka, P.; Liu, Y.; Chen, H.; Mueller, R.; Ploeger, F.; Riese, M.; Cai, Z.; Lu, D. Tropospheric ozone trend over Beijing from 2002–2010: Ozonesonde measurements and modeling analysis. Atmos. Chem. Phys. 2012, 12, 8389–8399. [Google Scholar] [CrossRef]
- Xiao, K.; Wang, Y.K.; Wu, G.; Fu, B.; Zhu, Y.Y. Spatiotemporal Characteristics of Air Pollutants (PM10, PM2.5, SO2, NO2, O3, and CO) in the Inland Basin City of Chengdu, Southwest China. Atmosphere 2018, 9, 74. [Google Scholar] [CrossRef]
- Duan, W.J.; Wang, C.; Pei, N.C.; Zhang, C.; Gu, L.; Jiang, S.S.; Hao, Z.Z.; Xu, X.H. Spatiotemporal Ozone Level Variation in Urban Forests in Shenzhen, China. Forests 2019, 10, 247. [Google Scholar] [CrossRef]
- Li, H.; Wang, S.L.; Zhang, W.J.; Wang, H.; Han Wang, H.; Wang, S.B.; Li, H.S. Characteristics and Influencing Factors of Urban Air Quality in Beijing-Tianjin-Hebei and Its Surrounding Areas (2+26’Cities). Res. Environ. Sci. 2021, 34, 172–184. [Google Scholar]
- Song, W.; Chang, Y.H.; Liu, X.J.; Li, K.H.; Gong, Y.M.; He, G.X.; Wang, X.L.; Christie, P.; Zheng, M.; Dore, A.J. A Multiyear Assessment of Air Quality Benefits from China’s Emerging Shale Gas Revolution: Urumqi as a Case Study. Environ. Sci. Technol. 2015, 49, 2066–2072. [Google Scholar] [CrossRef]
- Lai, L.W. The relationship between typhoon features and fine particulate matter: Events in Metropolitan Taipei. Theor. Appl. Climatol. 2020, 139, 127–143. [Google Scholar] [CrossRef]
- Rohit Jaikumar, R.; Nagendra, S.M.S.; Sivanandan, R. Modeling of real time exhaust emissions of passenger cars under heterogeneous traffic conditions. Atmos. Pollut. Res. 2017, 8, 80–88. [Google Scholar] [CrossRef]
- Hu, J.L.; Wu, L.; Zheng, B.; Zhang, Q.; He, K.B.; Chang, Q.; Li, X.H.; Yang, F.M.; Ying, Q.; Zhang, H.L. Source contributions and regional transport of primary particulate matter in China. Environ. Pollut. 2015, 207, 31–42. [Google Scholar] [CrossRef] [PubMed]
- Wang, X.; Song, G.H.; Wu, Y.Z.; Yu, L.; Zhai, Z.Q. A NOx Emission Model Incorporating Temperature for Heavy-Duty Diesel Vehicles with Urea-SCR Systems Based on Field Operating Modes. Atmosphere 2019, 10, 337. [Google Scholar] [CrossRef]
- Zhu, L.; Gan, Q.M.; Liu, Y.; Yan, Z.J. The impact of foreign direct investment on SO2 emissions in the Beijing-Tianjin-Hebei region: A spatial econometric analysis. J. Clean. Prod. 2017, 166, 189–196. [Google Scholar] [CrossRef]
- Menezes, D.L.A.; Bannwart, E.S.; De Souza, J.E.; Rojas, S.S. Thermoluminescence emission on lead oxychloroborate glasses under UV exposure. Luminescence 2019, 34, 918–923. [Google Scholar] [CrossRef]
- Gadzhiev, I.S. The method for measuring of daily dynamics of variation of O3 and NO2 concentrations along roadways. Sens. Syst. 2013, 2, 43–45. [Google Scholar]
- Li, K.L.; Wang, H.; Chen, L.C.; Li, J.Y.; Dong, F. Synergistic degradation of NO and C7H8 for inhibition of O3 generation. Appl. Catal. B Environ. 2022, 312, 121423. [Google Scholar] [CrossRef]
- Qin, D.S.; Gao, C.Y. Control Measures for Automobile Exhaust Emissions in PM2.5 Governance. Discret. Dyn. Nat. Soc. 2022, 2022, 8461406. [Google Scholar] [CrossRef]
- Burnett, R.T.; Cakmak, S.; Raizenne, M.E.; Stieb, D.; Vincent, R.; Krewski, D.; Brook, J.R.; Philips, O.; Ozkaynak, H. The association between ambient carbon monoxide levels and daily mortality in Toronto, Canada. J. Air Waste Manag. Assoc. 1998, 48, 689–700. [Google Scholar] [CrossRef]
- Hasanayn, F.; Abu-El-Ez, D. Calculation of Dramatic Differences in the Activation Energy of Phenyl Migratory Insertion in the Isomers of [Rh(PMe3)(2)CI(CO)(Ph)H]: Important Effects from Both the Ligand trans to Ph and the Ligand trans to CO. Inorg. Chem. 2010, 49, 9162–9168. [Google Scholar] [CrossRef] [PubMed]
- Elansky, N.F.; Shilkin, A.V.; Ponomarev, N.A.; Semutnikova, E.G.; Zakharova, P.V. Weekly patterns and weekend effects of air pollution in the Moscow megacity. Atmos. Environ. 2020, 224, 117303. [Google Scholar] [CrossRef]
- Chen, Y.; Tian, M.; Huang, R.J.; Shi, G.M.; Wang, H.B.; Peng, C.; Cao, J.J.; Wang, Q.Y.; Zhang, S.M.; Guo, D.M.; et al. Characterization of urban amine-containing particles in southwestern China: Seasonal variation, source, and processing. Atmos. Chem. Phys. 2019, 19, 3245–3255. [Google Scholar] [CrossRef]
- Gong, Y.L.; Luo, X.Y. Design of Dynamic Diffusion Simulation System for Atmospheric Pollutants in Coastal Cities under Persistent Inverse Temperature. J. Coast. Res. 2020, 103, 526–529. [Google Scholar] [CrossRef]
- Sun, X.Y.; Zhou, Y.; Zhao, T.L.; Bai, Y.Q.; Huo, T.; Leng, L.; He, H.; Sun, J. Effect of Vertical Wind Shear on PM2.5 Changes over a Receptor Region in Central China. Remote Sens. 2022, 14, 3333. [Google Scholar] [CrossRef]
- Mi, K.; Zhuang, R.; Zhang, Z.; Gao, J.; Pei, Q. Spatiotemporal characteristics of PM2.5 and its associated gas pollutants, a case in China. Sustain. Cities Soc. 2019, 45, 287–295. [Google Scholar] [CrossRef]


Disclaimer/Publisher’s Note: The statements, opinions and data contained in all publications are solely those of the individual author(s) and contributor(s) and not of MDPI and/or the editor(s). MDPI and/or the editor(s) disclaim responsibility for any injury to people or property resulting from any ideas, methods, instructions or products referred to in the content. |
© 2023 by the authors. Licensee MDPI, Basel, Switzerland. This article is an open access article distributed under the terms and conditions of the Creative Commons Attribution (CC BY) license (https://creativecommons.org/licenses/by/4.0/).