Article

Spatial and Temporal Variation of Aerosol Optical Depth in Huaihai Economic Zone from 1982 to 2021

1
School of Environment and Spatial Informatics, China University of Mining and Technology, Xuzhou 221116, China
2
Artificial Intelligence Research Institute, China University of Mining and Technology, Xuzhou 221116, China
3
School of Computing and Mathematics, College of Science and Engineering, University of Derby, Kedleston Road, Derby DE22 1GB, UK
*
Author to whom correspondence should be addressed.
Atmosphere 2023, 14(5), 822; https://doi.org/10.3390/atmos14050822
Submission received: 28 March 2023 / Revised: 25 April 2023 / Accepted: 30 April 2023 / Published: 2 May 2023
(This article belongs to the Section Aerosols)

Abstract

:
Aerosol Optical Depth (AOD), quantifying the amount of aerosol in the atmosphere, is widely regarded as a crucial indicator for research on atmospheric physics and regional air quality. At present, the inversion of AOD from observation of satellite remote sensing sensors has become the main technology for large-scale monitoring of aerosol load. The Huaihai Economic Zone is the connecting belt of two key areas of atmospheric governance (the Yangtze River Delta and the Beijing-Tianjin-Hebei region, China), and it has been suffering from air pollution for many years and few studies of AOD focus on this region. Therefore, the spatial and temporal characteristics of the AOD are explored using MODIS AOD data and AVHRR AOD data in this region during the period from 1982 to 2021 in this study. The correlation coefficients between the AOD of satellite observation and actual air pollution were analyzed by combining PM2.5 pollutant concentration and air quality index (AQI) data. The results showed that the AOD is higher in the northwest than in the southeast, and it is different from season to season. The annual variation of AOD in the Huaihai Economic Zone is a W-shaped trend from 1982 to 2011, while the trend of annual AOD is decreasing after 2011. In terms of seasons, the whole differences in AOD are evident, exhibiting AOD values in summer > those in spring > those in autumn > and those in winter. Furthermore, it indicated that the quarterly and monthly variation of the AOD tends to be flat in recent years. Since 2015, the concentration of PM2.5 has continued to decline, the same as that of AQI. Meanwhile, the quarterly and monthly differences in PM2.5 are still obvious, with higher PM2.5 in winter and lower PM2.5 in summer. However, it also represented that PM2.5 is significantly higher in spring than in autumn from 2015 to 2018, which is the opposite for 2019 to 2021. Lastly, the correlation between AOD and PM2.5/AQI is also given; i.e., the correlation coefficients of AOD with PM2.5/AQI are 0.84/0.82, with the highest correlation coefficient in autumn (R = 0.86/0.91) and the lowest in winter (R = 0.46/0.48).
Keywords:
aerosol; PM2.5; AQI; AOD; AVHRR; MODIS

1. Introduction

Aerosols are a collection of liquid and solid particles suspended in the air, which directly or indirectly affect the climate [1,2,3]. Moreover, their accumulation near the ground can cause a reduction in atmospheric visibility and deterioration of air quality, which can seriously affect the normal life of human beings and even endanger their health [4,5,6,7,8]. Aerosol pollution shows regionalization; therefore, it is important to study the physical and chemical properties of aerosols and monitor their spatiotemporal variability on a regional scale [9,10,11,12]. Aerosol optical depth (AOD) is an important indicator and key parameter for understanding atmospheric physics and regional air quality by quantifying the aerosol load in the atmosphere [13,14,15].
There are two main methods to measure AOD in the atmosphere, which are ground-based observations using sunphotometer measurements on the ground and remote sensing inversion, which relies on sensor data from the satellite platform. At present, several ground-based monitoring networks have been established to provide AOD data in the world, such as AERosol RObotic NETwork (AERONET) [16], Multifilter Rotating Shadow Band Radiometer (MFRSR) [17], Chinese Sun Hazemeter Network (CSHNET) [18], Chinese Aerosol Remote Sensing NETwork (CARSNET) [19], European Brewer Network (EuBrewNet) [20,21], Sun-sky radiometer Observation Network (SONET) [22], Sky Radiometer Network (SKYNET) [23], etc. However, these networks are overly dependent on the density of station deployment, which leads to the fact that it is difficult to ensure the full integration of the regional scope and results in high construction and maintenance costs. With the continuous optimization and updating of satellite sensors and inversion algorithms, AOD measurements taken by remote sensors have become more and more accurate, and the calculation of AOD from satellite remote sensing data has become the main technique for the large-scale monitoring of aerosol loads [24]. There are many sensors that can monitor AOD, such as the Moderate Resolution Imaging Spectroradiometer (MODIS) [23], the Visible Infrared Imaging Radiometer (VIIRS) [25], the Advanced Very High Resolution Radiometer (AVHRR) [26], the Ozone Monitoring Instrument (OMI) [27], the Cloud-Aerosol Lidar and Infrared Pathfinder Satellite Observations (CALIPSO) [28], the Polarization and Anisotropy of Reflectances for Atmospheric Sciences coupled with Observations from a Lidar (PARASOL) [29], etc. Among them, the AVHRR, which is carried on the NOAA series of satellites, has been continuously conducting Earth observation missions since 1979, so it has an accumulation of data for more than 40 years and a great potential for applications. At the same time, the MODIS, which is developed by NASA and carried on the TERRA and AQUA satellites, is widely used for studying regional AOD due to its advantages, such as easy access and excellent spatial and temporal resolution.
Many studies have shown that there is a correlation between AOD and PM2.5 concentrations [30,31,32,33], and many scholars have estimated near-ground atmospheric particulate matter concentrations based on satellite remote sensing AOD products [34,35,36,37,38]. However, the correlation between AOD and PM2.5 concentrations on a time scale with periodic characteristics is ignored. In particular, it is also possible that the correlation between AOD and PM2.5 concentrations is different in various regions due to their geographical location and meteorological environment. Current domestic and international studies on the regional level of air pollution in China mainly focus on economically developed regions such as Beijing-Tianjin-Hebei [39,40], Yangtze River Delta [41,42,43,44,45], Pearl River Delta [46,47] and other key regions, such as the Fenwei Plain [48], and there are fewer studies on other regions. The Huaihai Economic Zone, established in 1986, is one of the earliest groups of regional economic cooperation organizations in China and is located in the combined zone of Beijing-Tianjin-Hebei, Central Plains Economic Zone, and Yangtze River Delta in China. It is a typical inter-provincial border cooperation region in China, covering the junction area of Jiangsu, Shandong, Henan, and Anhui provinces [49,50]. In the region, there are geopolitical connections, humanistic connections, abundant resources, and obvious transportation location advantages. At the same time, it is also a key area for China’s national industrial transformation and the conversion of old and new dynamics, national food security, a new national economic development support belt, and an important coal and energy base in east China. In the overall pattern of national regional development, it resides in the strategic position of connecting the north and the south and carrying the east and the west and is also the key to speeding up the high-quality development of the four provinces of Jiangsu, Shandong, Henan, and Anhui. In addition, the region is located in the north–south climate transition zone of China, and as the connection zone between two key regions of air management around the Yangtze River Delta and Beijing-Tianjin-Hebei, it presents significant composite pollution characteristics and becomes one of the most polluted areas in the country; thus, it becomes a key control area of the Ministry of Ecology and Environment.
Accurate information on the spatiotemporal distribution of AOD and the relationship between AOD and atmospheric environmental pollution is important for understanding the extent of atmospheric pollution and promoting inter-regional aerosol transport decompression government decisions. In this study, based on the AOD data from MODIS and AVHRR, the spatiotemporal variation characteristics of AOD in the Huaihai Economic Zone during 1982–2021 are investigated. We also combine PM2.5 pollutant concentration data and air quality index (AQI) data to analyze the correlation between the AOD observed by satellite and the actual air pollution, which provides effective data support for the implementation of regional coordinated development strategy among provinces and cities in the Huaihai Economic Zone and the establishment of a more effective new mechanism for regional synergistic pollution reduction.

2. Data and Methods

2.1. Study Area

The latitude and longitude range of the study area is approximately 113–121° E, 32–37° N, with a temperate continental monsoon climate. In this paper, 10 cities in the Huaihai Economic Zone are selected for exploration and analysis, namely, Xuzhou, Lianyungang, and Suqian in Jiangsu Province; Huaibei and Suzhou in Anhui Province; Zaozhuang, Jining, Heze and Linyi in Shandong Province; and Shangqiu in Henan Province. The Huaihai Economic Zone has a resident population of about 59.32 million, as shown in Figure 1, with several resource-based cities, and the 10 cities in the region still have a large proportion of industrial activity.

2.2. Data Source and Description

2.2.1. Satellite AOD Data

In this study, we mainly used the AVHRR AOD data product from Jin et al. [51] and the MCD19A2 V6 data product (https://ladsweb.modaps.eosdis.nasa.gov/search/; accessed on 7 January 2023). Jin et al. [51] have retrieved and published the 1982–2016 AOD datasets in China based on AVHRR data with a spatial resolution of 5 km × 10 km. It has been verified that the correlation coefficient between this AOD data product and the AERONET and CARSNET ground-measured AOD is 0.78, and 63.31% of the points are within the Expected Error (EE) range of ± (0.05 + 0.25τ). Moreover, the Root Mean Squared Error (RMSE) of this data is 0.26, which is better than AVHRR Deep Blue (DB) AOD in mainland China. The MCD19A2 V6 data product is MODIS Multi-angle Implementation of Atmospheric Correction (MAIAC) Land AOD gridded Level 2 product produced daily, and it is a global AOD product released by NASA with 1 km spatial resolution. Some traditional AOD inversion algorithms, such as Dark Target (DT), assume that the land surface is uniform in the inversion process, but in fact the land surface is often non-uniform, especially in bright surface areas such as cities or deserts. The high reflectance and high heterogeneity of the land surface make AOD inversion extremely complex. The MAIAC algorithm, which uses time series data to decouple aerosol and surface contributions, assumes that the surface state is stable in a short period of time and has spatial heterogeneity. At the same time, the influence of bidirectional surface reflectance is also considered in the proposed algorithm, and the combination of time series and spatial analysis helps to improve the quality of cloud and snow detection. Thus, it has higher data accuracy on heterogeneous surfaces due to its improved cloud detection and surface characterization using the MAIAC algorithm that includes time series and spatial processing. So, this data can well meet the requirements of different applications such as the analysis of atmospheric particulate pollution and aerosol environmental effects. Among them, the AVHRR AOD data from 2002–2016 were used for validation only. For the time series analysis, we used the AVHRR AOD for the period 1982–2002 and the Aqua MODIS AOD for the period 2002–2021. In addition, we retained their original resolution for the study.

2.2.2. Ground-Based Monitoring Data

The AOD ground-based monitoring data from the data of AERONET provided by the National Aeronautics and Space Administration (NASA) and the Centre National de la Recherche Scientifique (CNRS) (https://aeronet.gsfc.nasa.gov/; accessed on 7 January 2023) were selected. The automatic tracking and scanning sun photometer (CE-318), developed and manufactured by CIMEL, is one of the key observing instruments of the AERONET observing network and is one of the most effective ways to observe the physical and optical properties of atmospheric aerosols, mainly for measuring the direct sun irradiance over multiple observation channels in the 340–1640 nm spectral range from the visible to the near infrared. In addition, the ground-based monitoring data for PM2.5 and AQI from the National Urban Real-Time Air Quality Release Platform (http://113.108.142.147:20035/; accessed on 7 January 2023) also are selected. It is an official data distribution platform based on the Ambient Air Quality Standard (GB 3095–2012), which uses monitoring sites across the country to collect data including hourly monitoring values of PM2.5 concentration and AQI.

2.3. Methods and Data Processing

The pre-processing of MCD19A2 data mainly includes geo-correction, raster projection, mosaic averaging, outlier rejection, band extraction, and cropping. The MCD19A2 product uses a 10° (longitude) × 10° (latitude) (1200 km × 1200 km) tile approach to provide hierarchical data format (HDF), and this study area involves data with row numbers 26, 27, and 28 and column number 5. Since the data set includes aerosol parameters such as 550 nm AOD, percentage of fine particles, and uncertainty factor, we extracted AOD and time band data from them for the study. After that, the AOD data were excluded and cropped, and only the AOD data in the study area were retained. Finally, the values of AOD at the points of interest were extracted and information such as the average value of AOD for each time period was calculated.
The spatial scale of AERONET data is different from that of satellite data, and the AOD was processed in order to maintain spectral, spatial, and temporal consistency. The AOD of AERONET data at 550 nm was obtained according to the Ångström formula [52] and so was the interpolation of AOD at 440 nm and 870 nm following Equation (1). It can be simplified as following Equation (2).
τ 550 = τ 500 exp α × ln 500 550
τ 550 = τ 500 × 500 550 α
ln(*) is the logarithmic function of ‘*’; τ500 is the AOD value at 500 nm; α is the Ångström index at 440–870 nm; and τ550 is the AOD value at 550 nm obtained by interpolation.
In this paper, we acquired the yearly average, quarterly average, monthly average, and weekly average synthetic images of MCD19A2 550 nm AOD data and AVHRR 550 nm AOD data, respectively, and analyzed the spatiotemporal characteristics of aerosols in the junction area of Jiangsu, Anhui, Shandong, and Henan at different scales, mainly includes the spatiotemporal dependence of weather and pollution, the characteristics of annual/seasonal/monthly variation and spatial distribution. At the same time, the correlative analysis of the measured data of PM2.5 and AQI with AOD was conducted. In the analysis process, we mainly used Pearson’s correlation (R) for the correlative analysis among the parameters, and the RMSE was used to determine the uncertainty of the data following Equations (2) and (3). In addition, we mainly use the standard deviation (STD) to quantify the fluctuation between data following Equation (4).
R = i = 1 n x i x ¯ y i y ¯ i = 1 n x i x ¯ 2 × i = 1 n y i y ¯ 2
R M S E = 1 n i = 1 n x i y i 2
S T D = 1 n 1 i = 1 n x i x ¯ 2
n denotes the number, x i and y i are the individual sample values of the two parameters, and x ¯ and y ¯ are the mean values of x and y, respectively.

3. Results and Discussion

3.1. Evaluations of AVHRR AOD and MODIS AOD

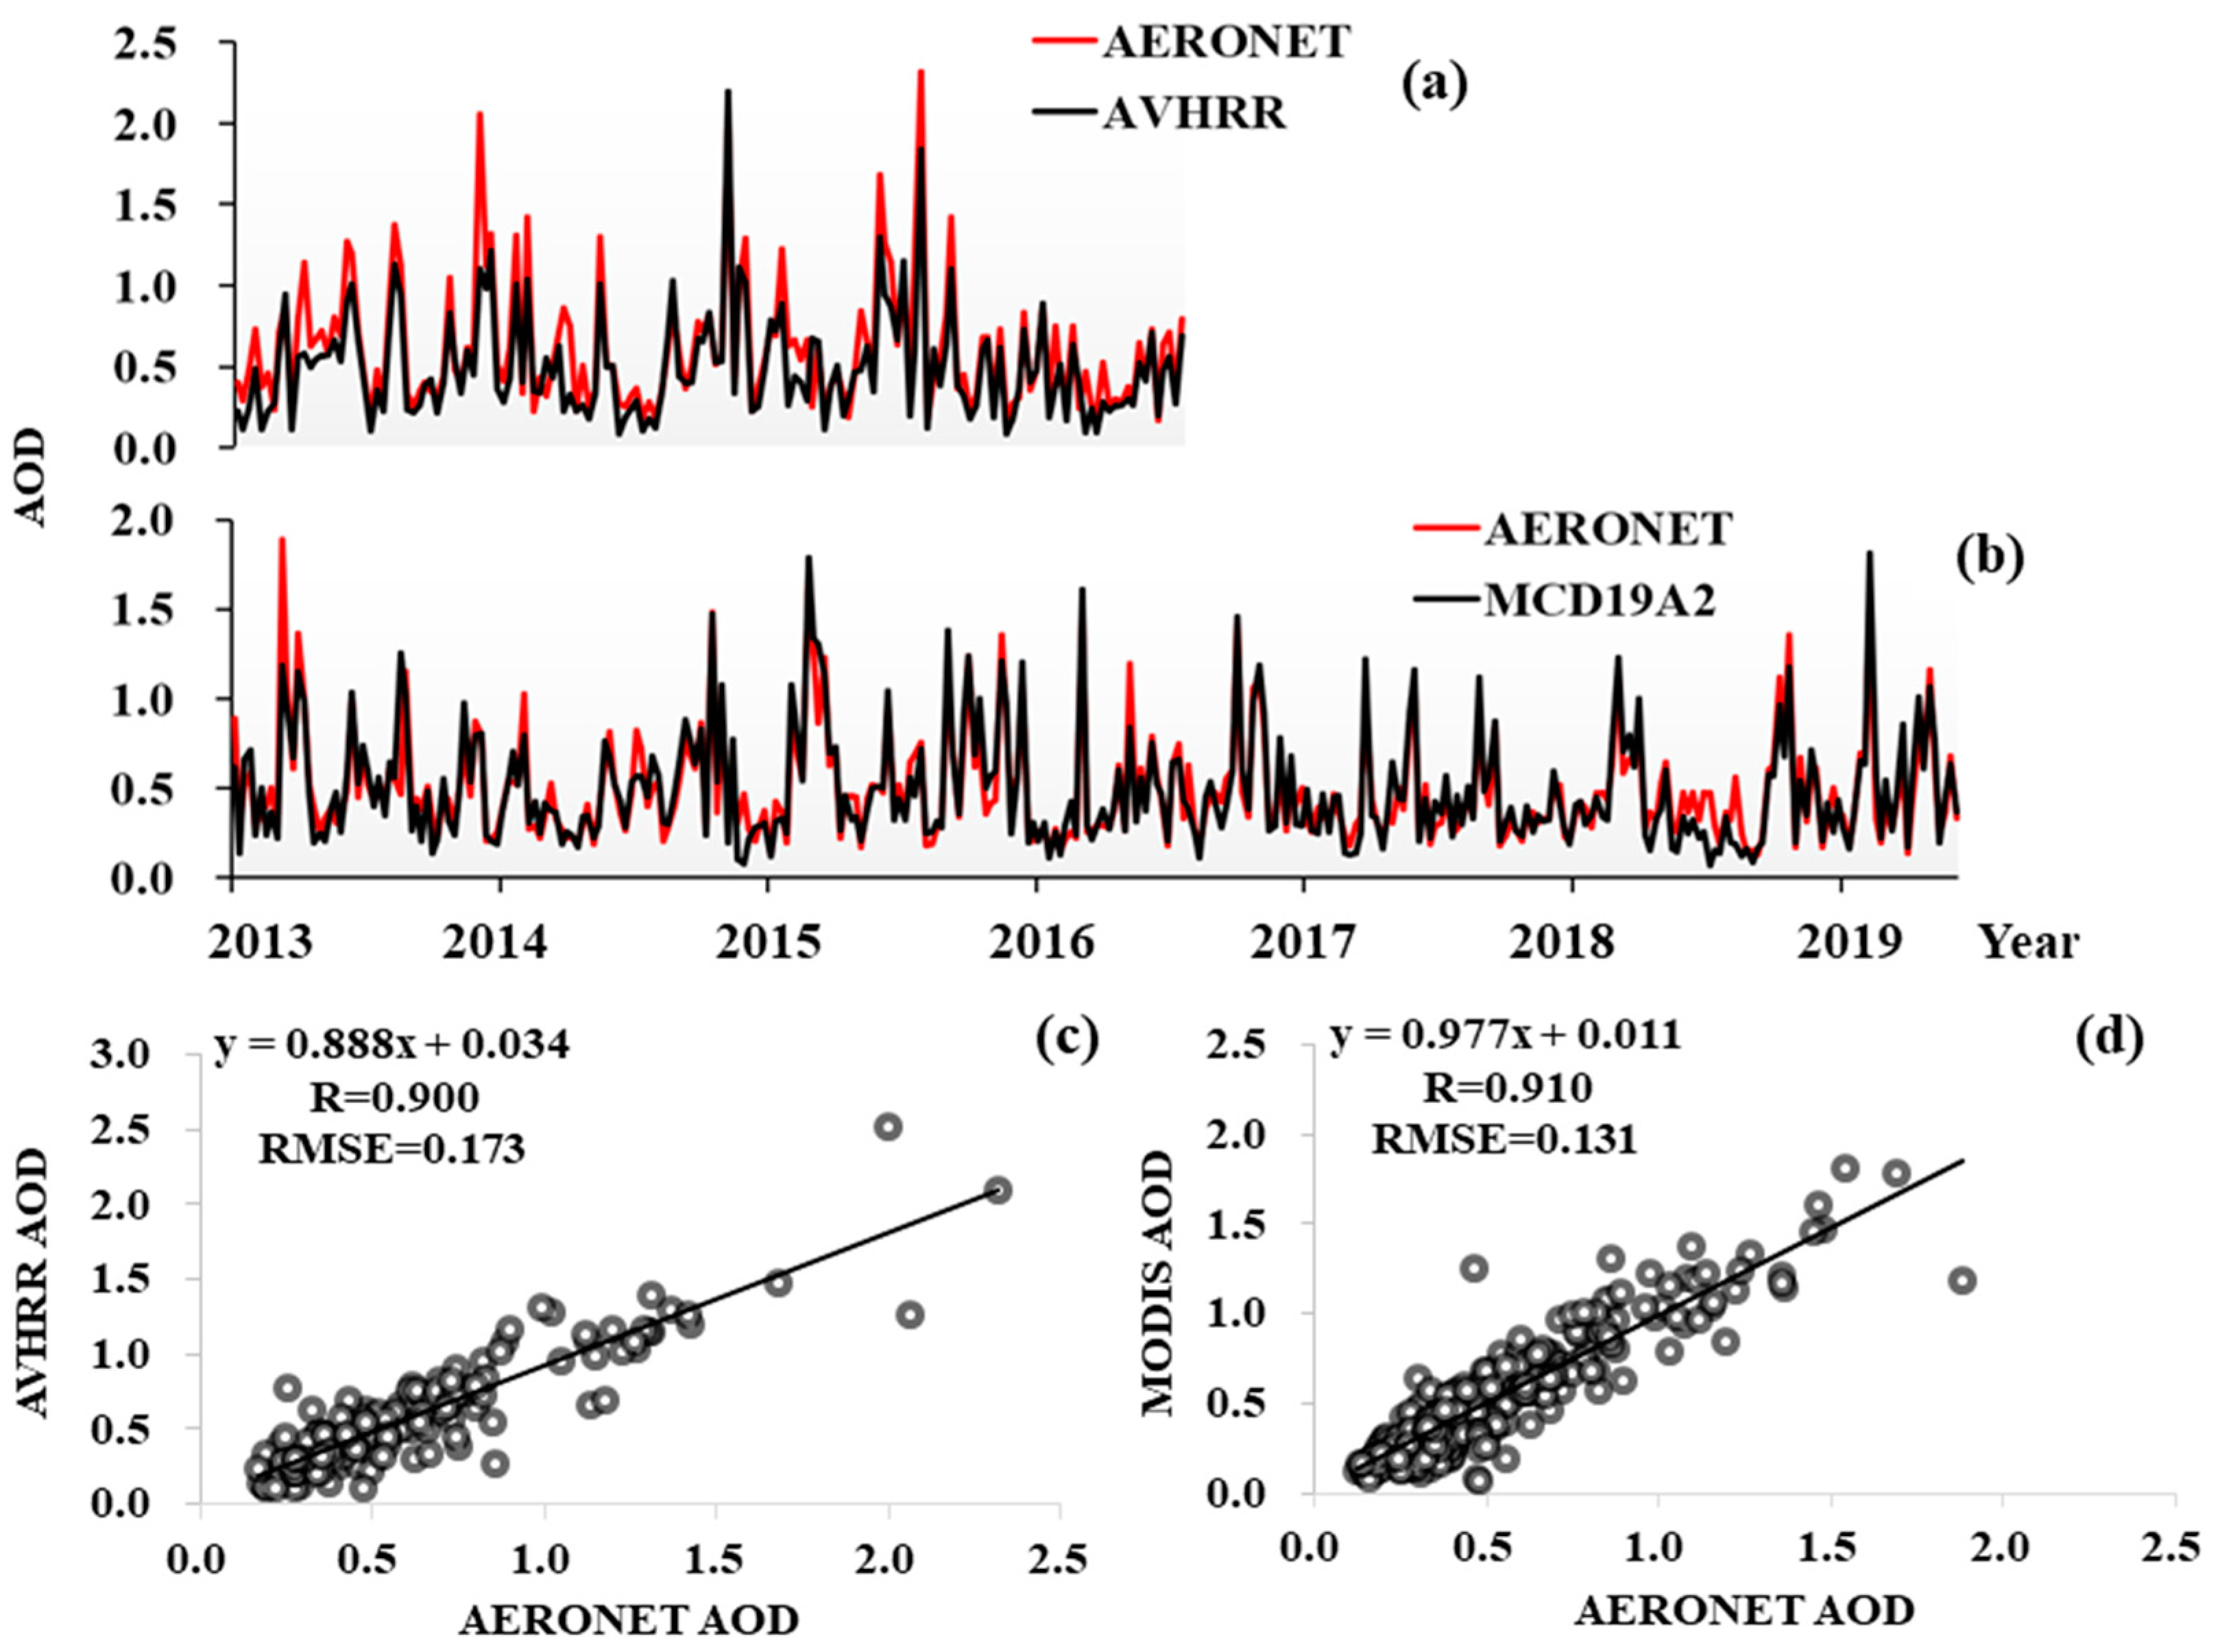
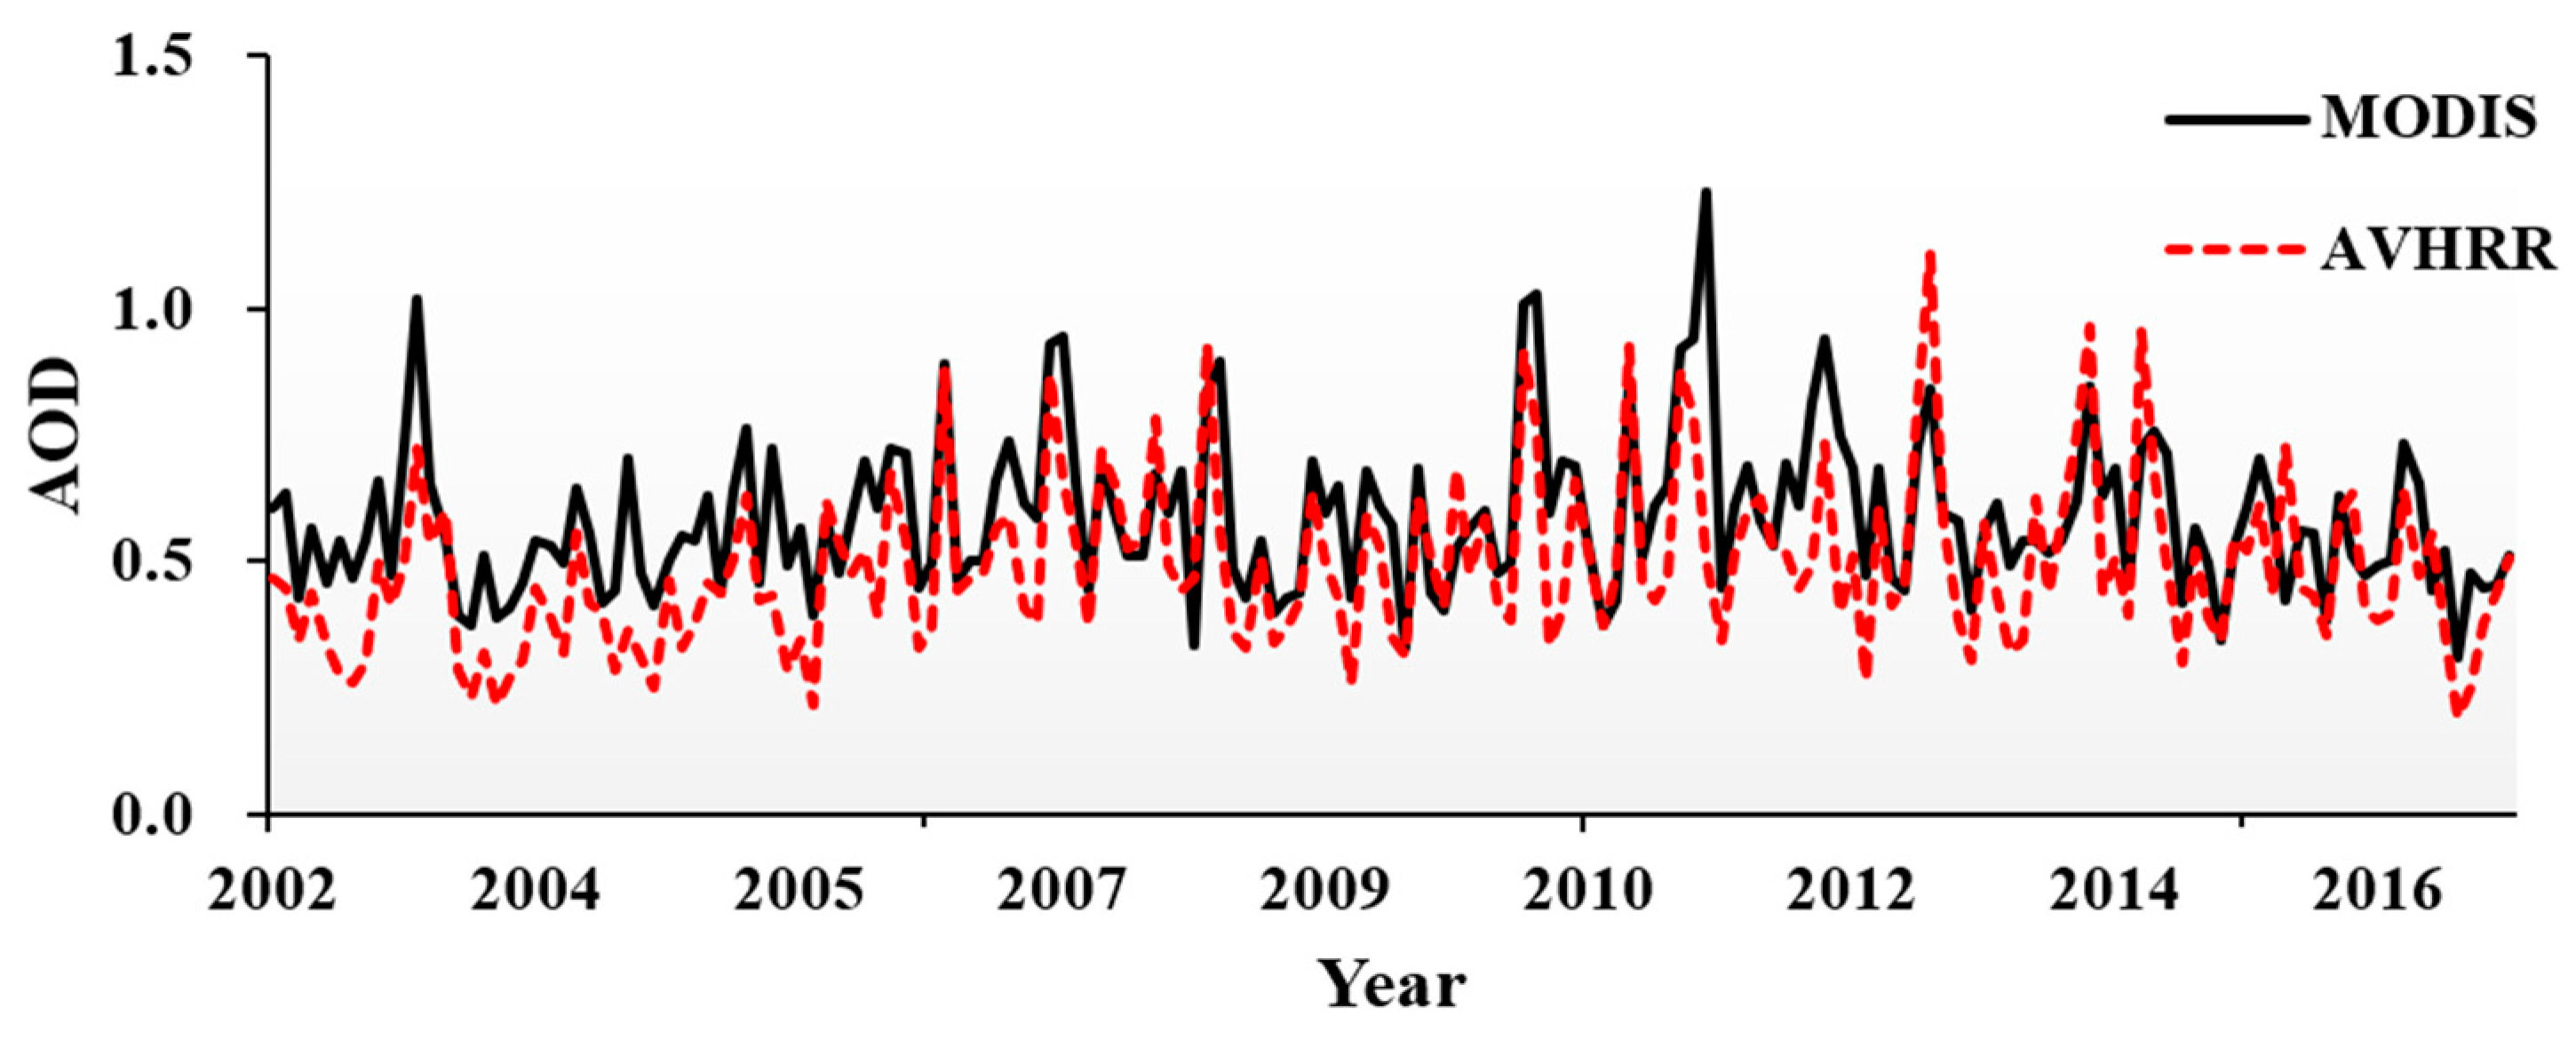
Based on AERONET data within a ‘±1 h time window’ from the AVHRR/AQUA local time, the satellite data products in the study area during the study period are verified, respectively. Figure 2 shows that the AVHRR AOD data products and MODIS AOD data products have good accuracy, and the correlation coefficients with AERONET reach 0.900 and 0.910, respectively. There is also a remarkable consistency in the trends (Figure 2). Then, the correlative analysis of AVHRR AOD data and MODIS AOD data is carried out, and the results show that they also show good spatiotemporal consistency in Figure 3. Therefore, it is feasible and reasonable to analyze the spatiotemporal distribution of the Huaihai Economic Zone in the past 40 years based on two satellite AOD data products.

3.2. Spatial Patterns of AOD

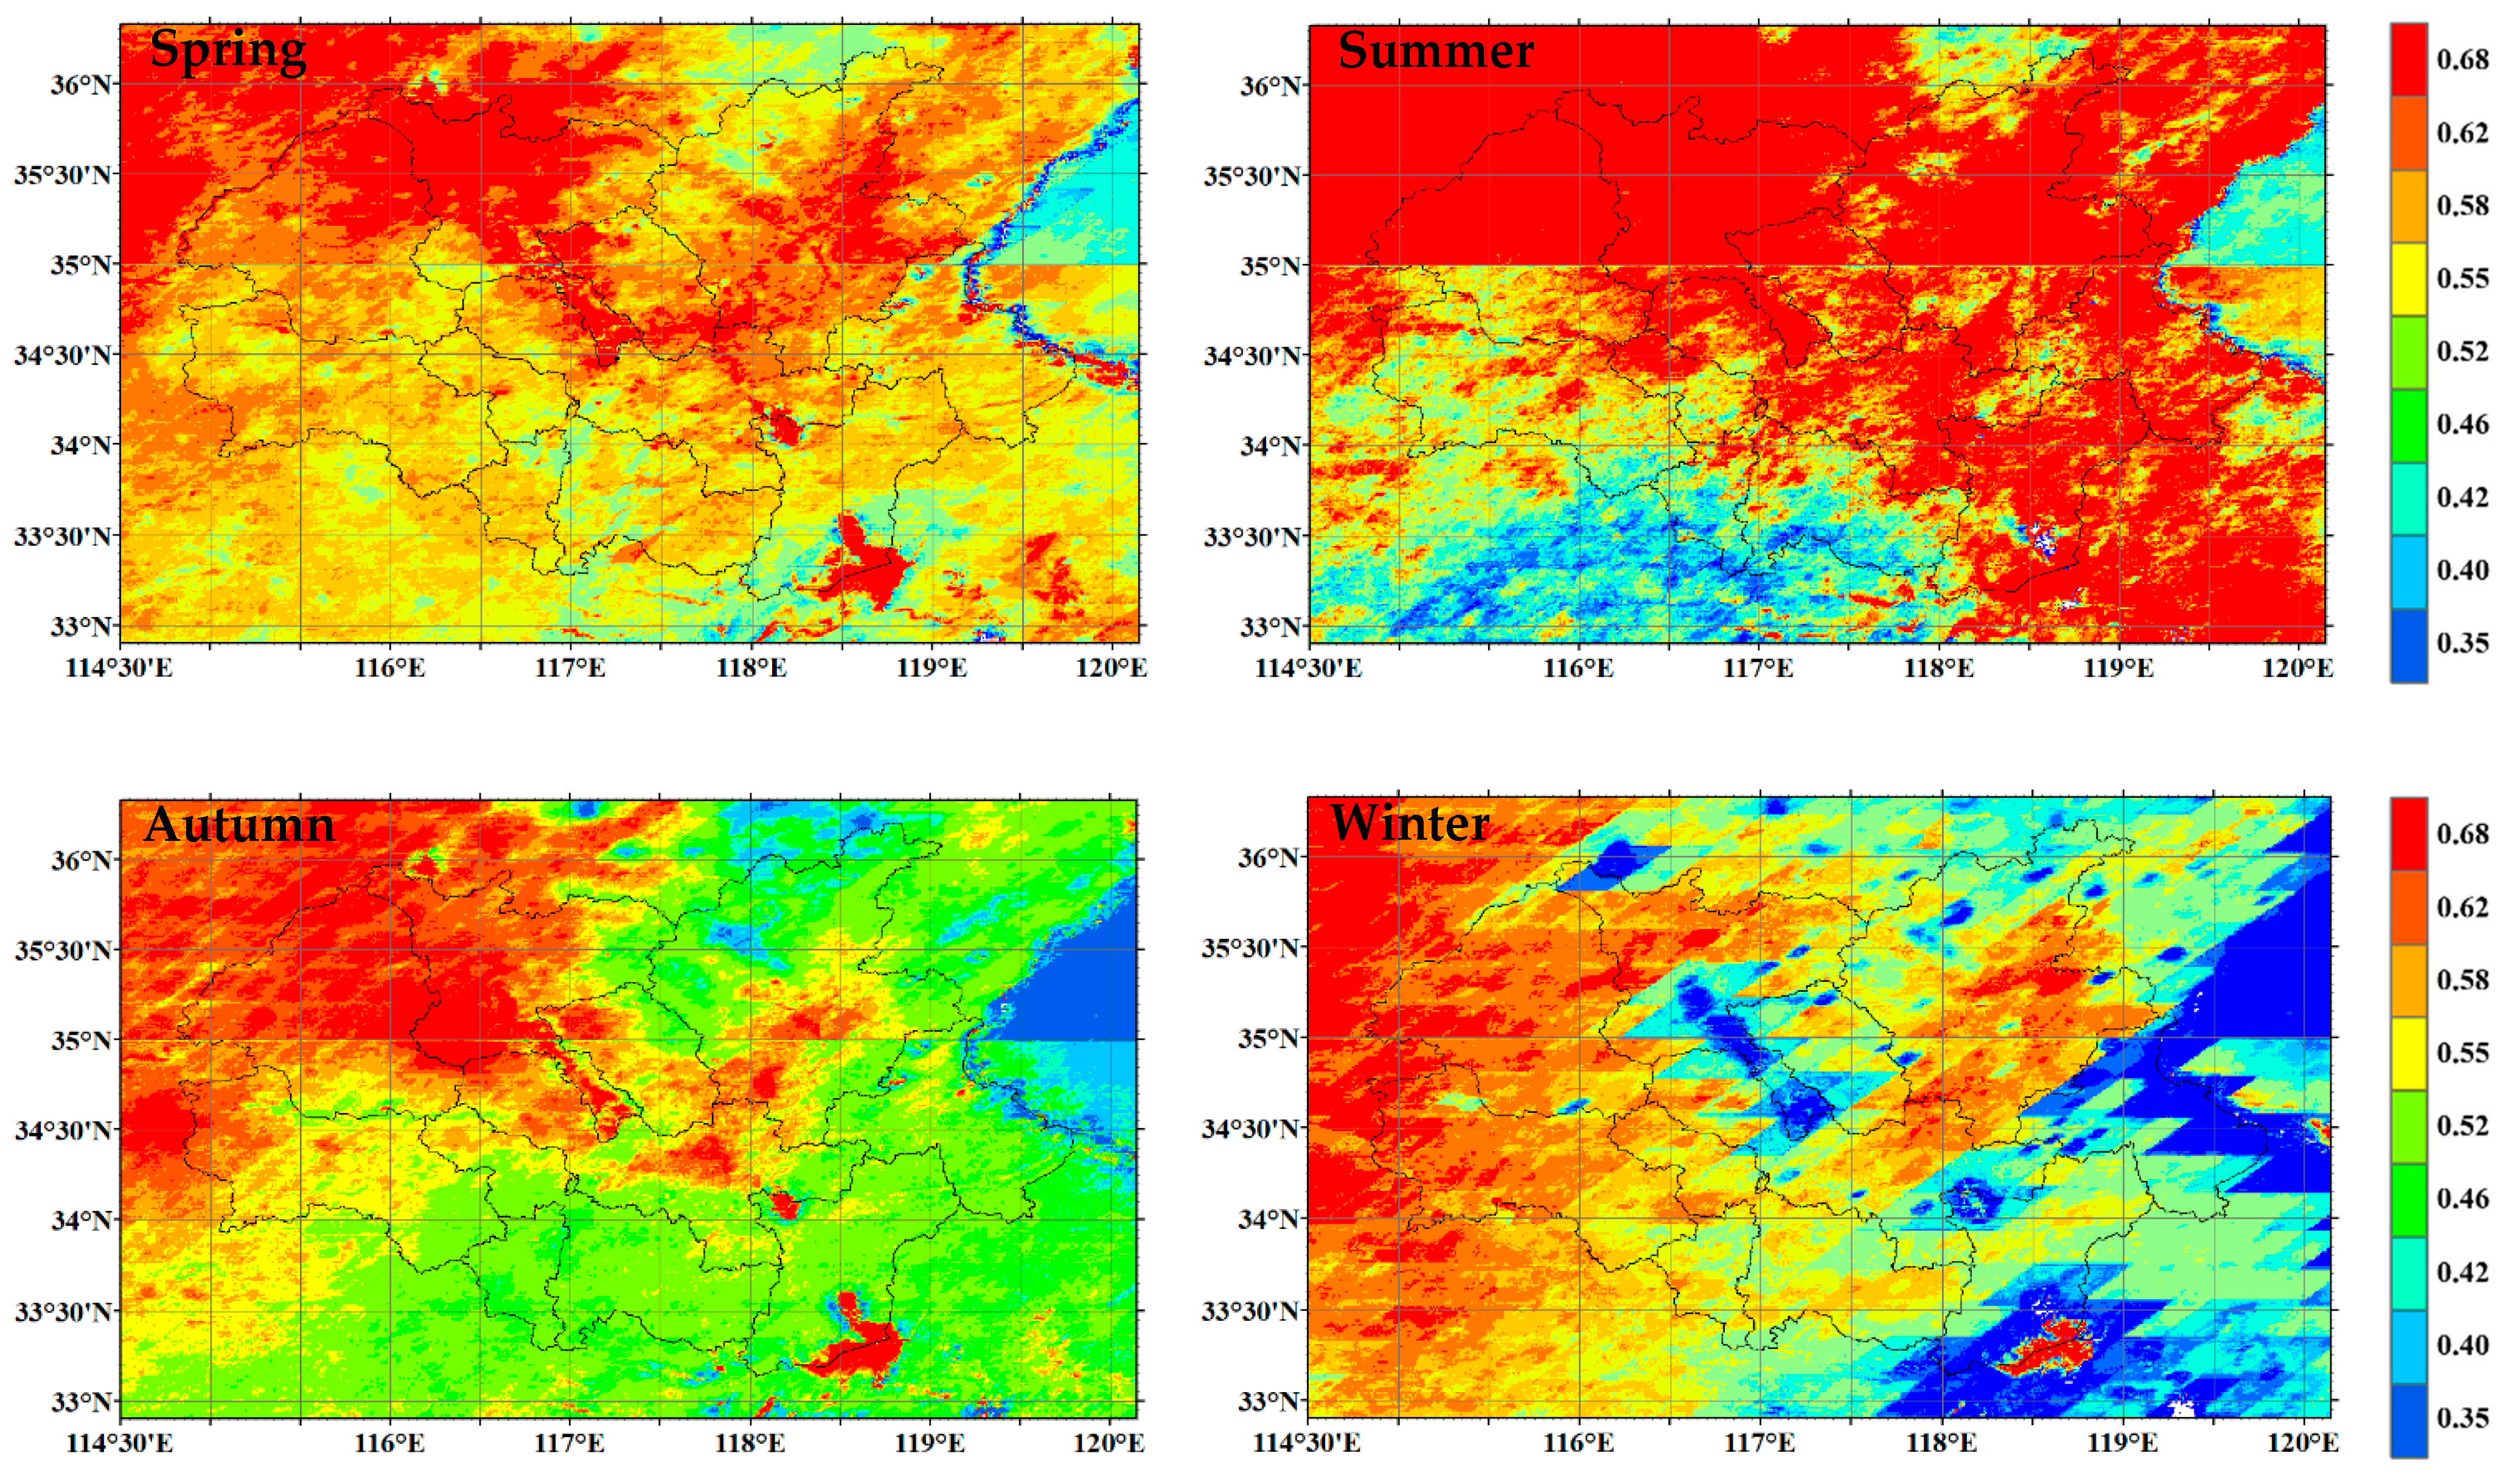
In this paper, we used every five years as a time point, but we used AVHRR AOD data to show the changes during 1982–2002 and Aqua MODIS AOD data to show the changes during 2003–2021. Due to the quality control problem of the MODIS data, the data are abnormal at the 35° N boundary. Therefore, the data close to this location are discontinuous. This phenomenon has little effect on our research. Specifically, we divided the period of 1997–2006 into two periods, 1997–2002 and 2003–2006, because the resolution of the two data are different. The results of annual and seasonal means of AOD for 1982–2021 are shown in Figure 4 and Figure 5. There are differences in the pillar industries, land use classification, and population distribution of each city, all of which can lead to regional differences in AOD distribution. The annual means of AVHRR AOD show that the AOD of cities in the Huaihai Economic Zone (MEAN in 0.4–0.45) is rather uniformly distributed during the period before 2002. It can also be seen that the AOD in the northeastern part of the study area is lower than that in the southwestern part. In addition, the areas of heavy pollution were different in each area; for example, there was a prominent high value in the urban area of Heze City in the period of 1992–1996, while in the period of 1997–2002, the significant high values were found in the urban parts of the mineral-rich city of Huaibei and Shangqiu. In addition, the annual means of MODIS AOD show that there are obvious regional differences in the study area, with decreasing direction from northwest to southeast. Among them, Heze City (MEAN = 0.626) has the highest AOD value, followed by Jining City (MEAN = 0.622). Lianyungang City (MEAN = 0.502) has lower AOD values. The spatial distribution of AOD also varies slightly among seasons, which may be related to meteorological factors, elevation, population, and so on [53]. For example, the eastern coastal area represented has high values of AOD in summer, which is due to the monsoon transported sea salt aerosol and water vapor from the sea, and the hygroscopic particulate matter in the air is easy to combine with water vapor to form a new aerosol, resulting in a large increase in AOD. In contrast, in autumn and winter, the contribution of water vapor to AOD decreases significantly as the monsoon winds change direction to blow from land to sea, while the contribution of the particulate matter in the air to AOD increases, but the overall trend is slowly decreasing. The above reasons lead to the overall decline of AOD from northwest to southeast in the autumn and winter. However, it exhibits lower values of AOD in the southwestern region and higher values of AOD in the northern and southeastern regions in summer (Figure 5). On the other hand, as shown in Figure 6, the seasonal variations in AOD are distinct for different cities. For example, the difference in the average AOD of Shangqiu City (STD = 0.017), Suzhou City (STD = 0.021), and Huaiibei City (STD = 0.032) are slight in each quarter, while that of Jining City (STD = 0.106), Lianyungang city (STD = 0.102) and Suqian city (STD = 0.087) are very variable in all seasons.

3.3. Temporal Variability of AOD

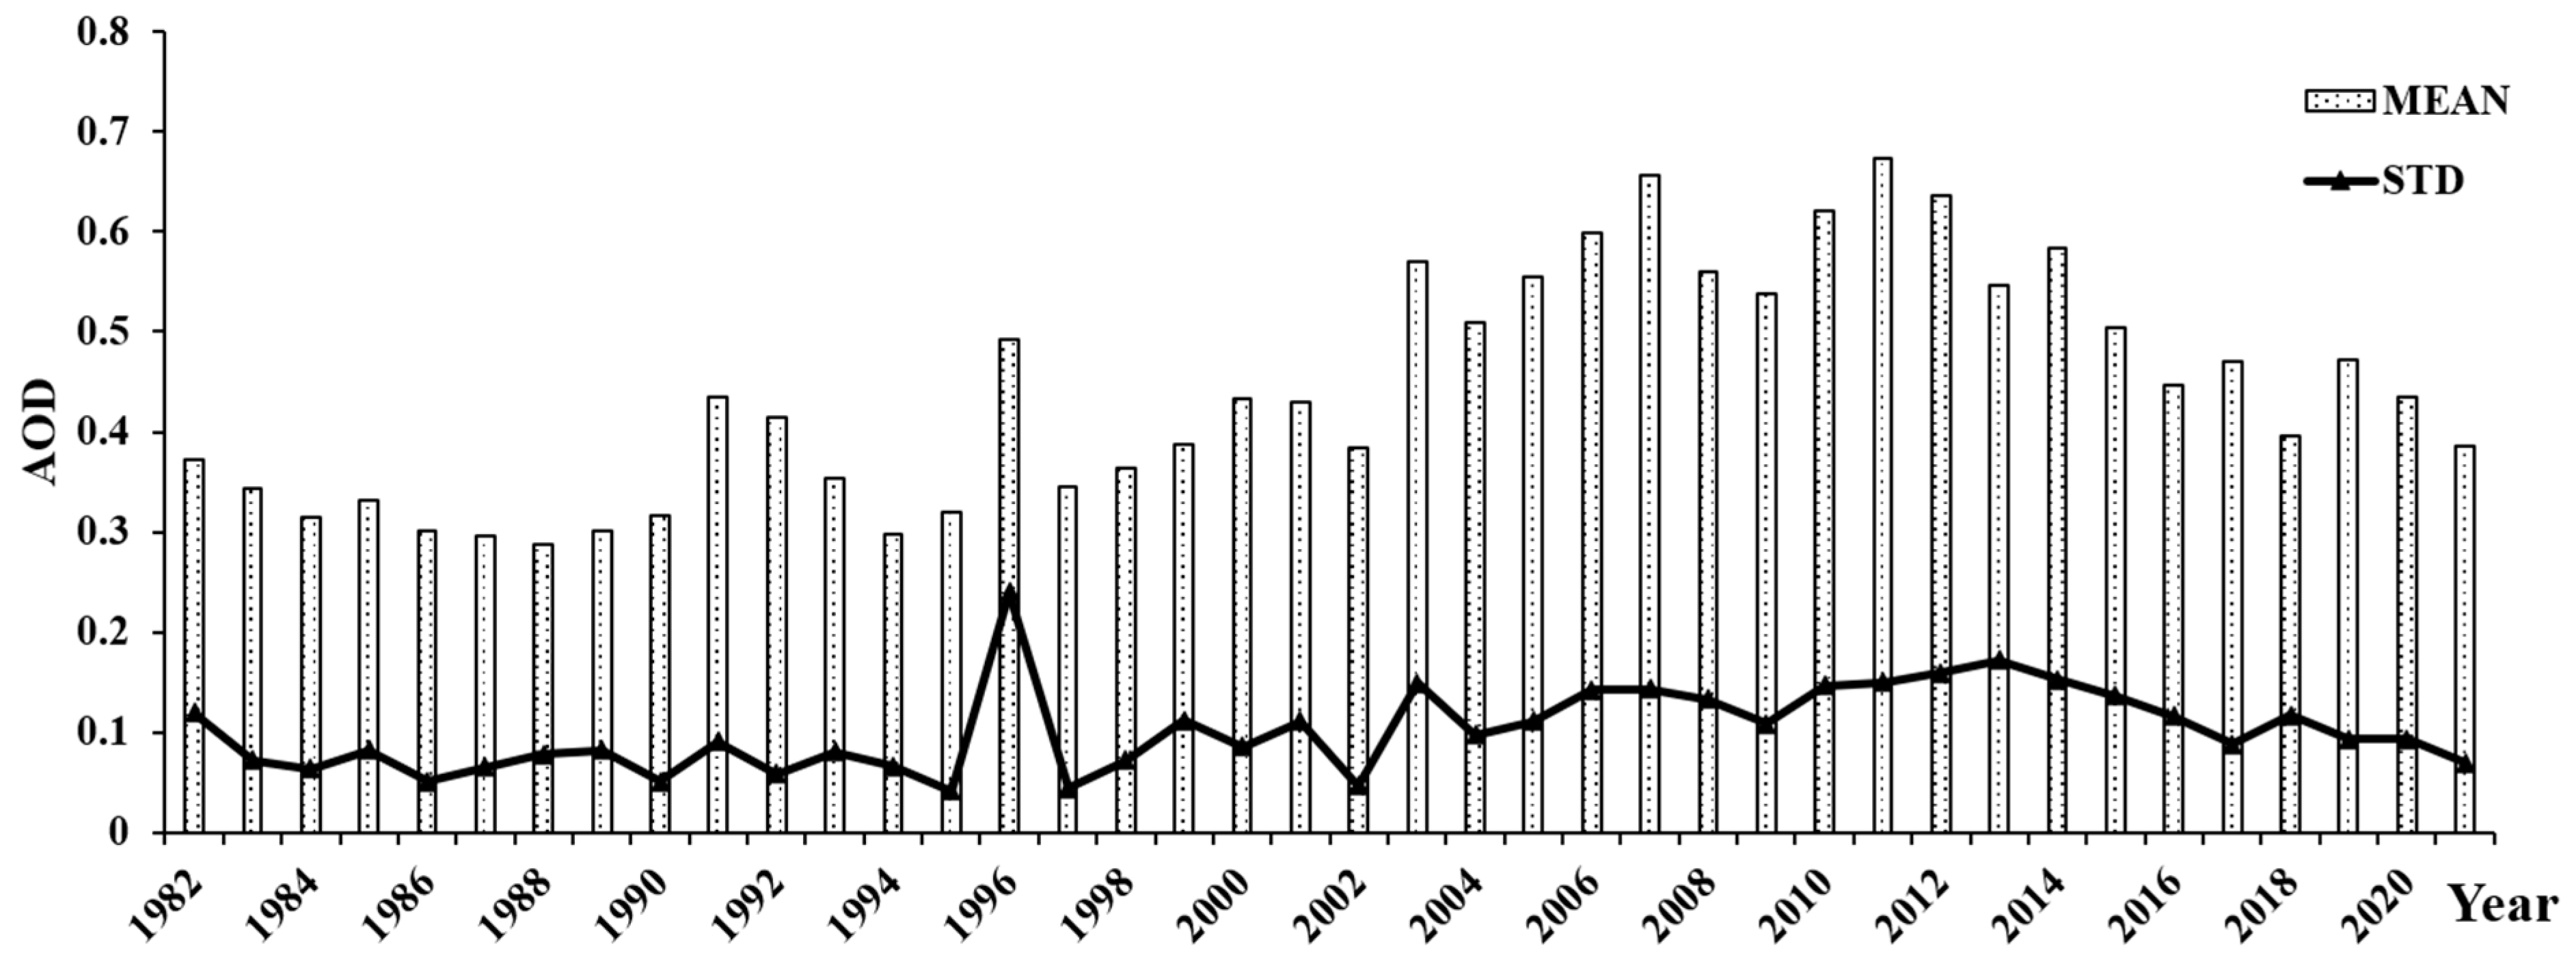
The mean and standard deviation of AOD for each year in the Huaihai Economic Zone over the last four decades are shown in Figure 7. Overall, the AOD was higher during the period of 2003–2015, with an annual mean greater than 0.5. In addition, the annual average AOD was even greater than 0.6 during 2007 and 2010–2012. This suggests that the atmospheric turbidity was very high during this period, which may be the result of the intense industrial development that was going on [54]. Furthermore, the annual average AOD remained consistently and steadily below 0.5 for the past six years, and the annual average AOD was below 0.4 in 2018 (MEAN = 0.396) and 2021 (MEAN = 0.386).
During 1982–2001, the average AOD values in the study area showed a W-shaped trend. After that, between 2002 and 2011, the Huaihai Economic Zone showed two stages of increasing trends in AOD, which coincided with the rapid industrialization of China after 2000. The highest value of AOD was reached in 2011 (MEAN = 0.673). However, after 2011, the AOD in the Huaihai Economic Zone showed a significant decreasing trend, which is consistent with the results of Zhao et al. [54]. This phenomenon can be related to the promulgation of a series of national air pollution control policies and the implementation of measures on straw burning, fireworks discharge, and the improvement of automobile emission standards [55]. In addition, we can see that the AOD fluctuates greatly in 1996, with the highest standard deviation (0.240) of AOD. The standard deviation of AOD is also relatively high at around 0.15 in 2010–2015, which reflects the large variation of regional AOD in these years.
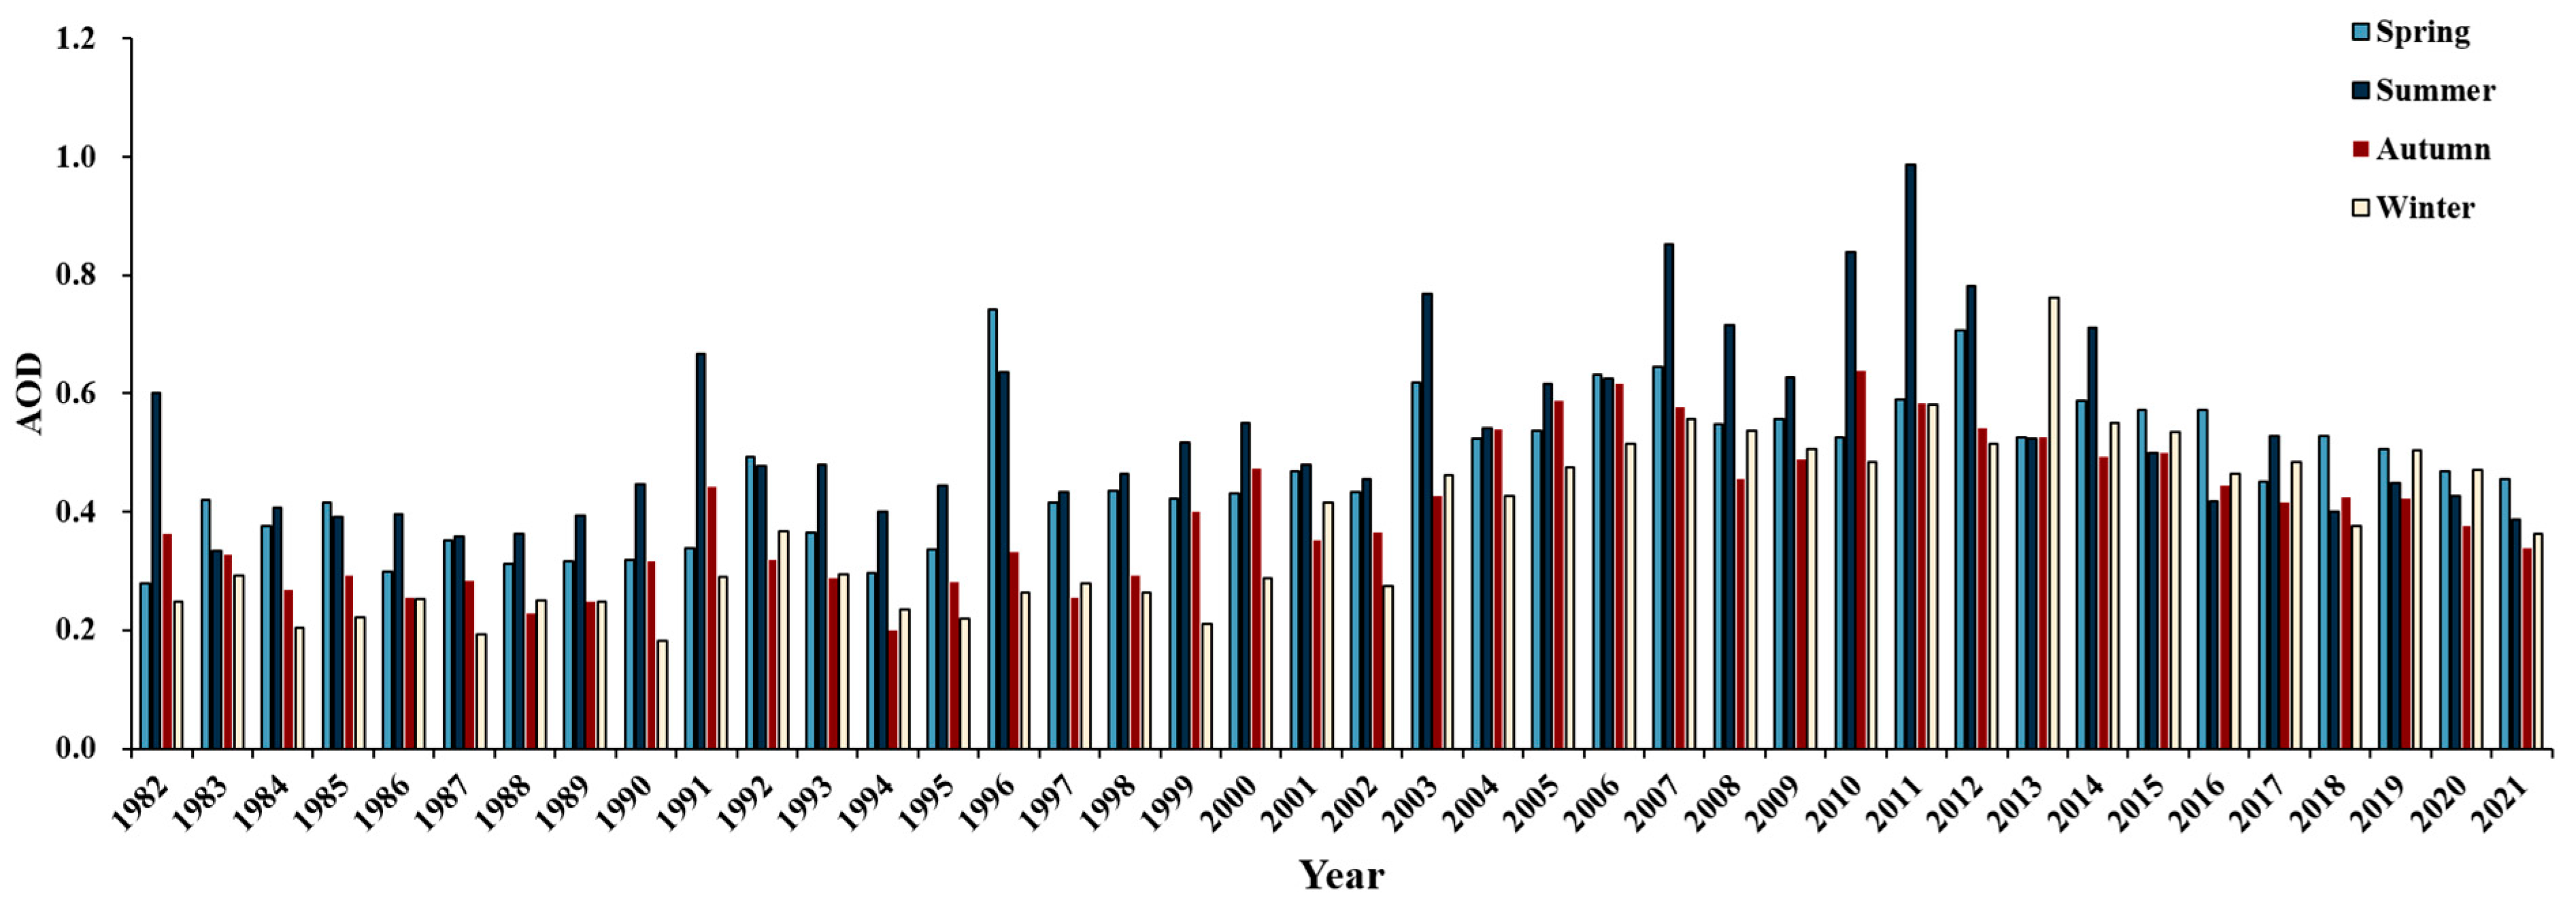
Overall, seasonal differences in AOD are significant in Figure 8, displaying summer (MEAN = 0.535) > spring (MEAN = 0.471) > autumn (MEAN = 0.400) > winter (MEAN = 0.377). This phenomenon is correlated with meteorological and other factors. For example, the high temperature and humidity in summer provide environmental conditions for photochemical reactions, which promotes aerosol formation and facilitates the hygroscopic expansion of water-soluble aerosols, leading to an increase in the AOD content [53,56,57]. On the other hand, spring is relatively dry, and it is the seeding season, which leads to more particulate matter in the air [58,59]. This is a rather unexpected finding, as the highest AOD for all seasons occurred in winter in 2013. Moreover, the average AOD in winter was higher than in autumn after 2013 with the exception of 2018, and the average AOD in summer was no longer prominently high. This also means that the authorities have achieved good results in controlling AOD in the summer.
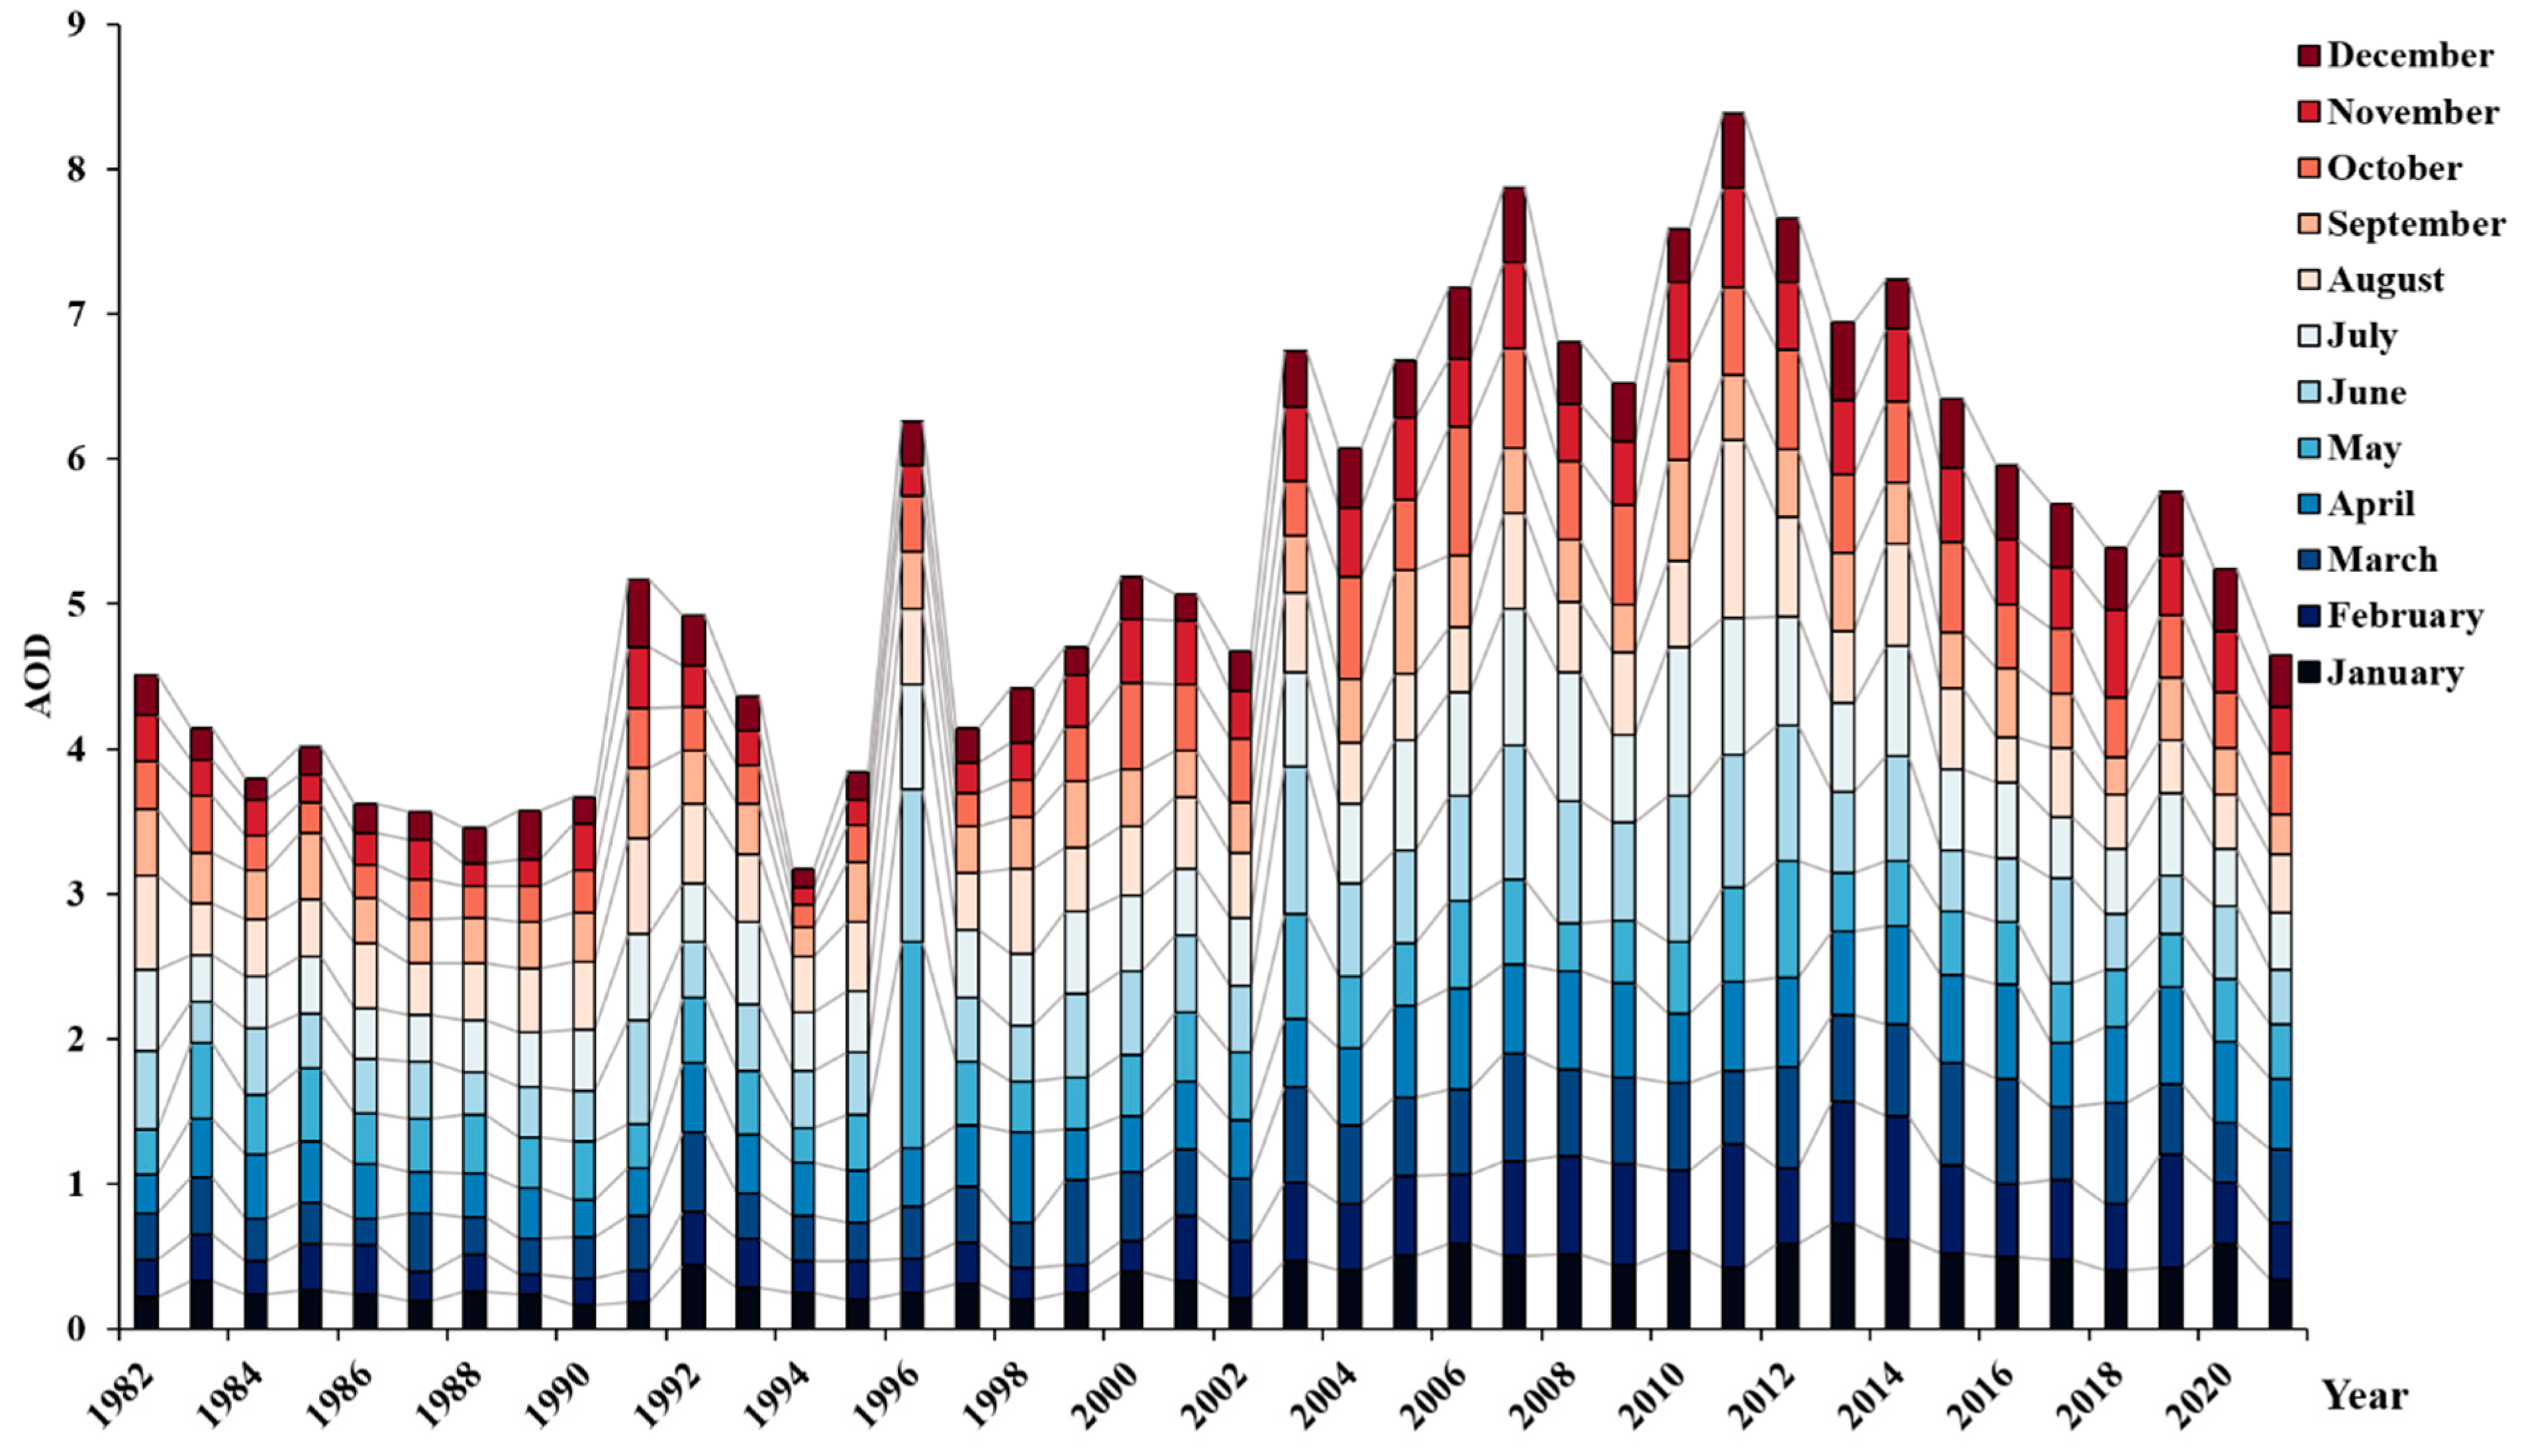
In terms of AOD differences between months, the trend in the average AOD is nearly the same across months (Figure 9). June (MEAN = 0.568) and July (MEAN = 0.553) had the highest mean values of AOD with more than 0.5 in 1982–2021, they were followed by August (MEAN = 0.499), April (MEAN = 0.480), March (MEAN = 0.472), May (MEAN = 0.466), October (MEAN = 0.428), February (MEAN = 0.426), September (MEAN = 0.399), November (MEAN = 0.375), January (MEAN = 0.373) and December (MEAN = 0.399). This is consistent with the above inter-seasonal AOD differences. At the same time, we can find that the monthly mean AOD trends have gradually leveled off in recent years, which may be due to the increasing intensity of local pollution control and the control of targeted sub-regional and sub-period pollution.
Furthermore, it can be noted from Figure 9 that a very high AOD is observed in May (MEAN = 1.419) and June (MEAN = 1.057) in 1996 specifically, which resulted in an average AOD of 0.198 and 0.196 higher in that year than in 1995 and 1997, respectively. Similarly, a surprisingly high average AOD was recorded in August (MEAN = 1.228) 2011, resulting in the highest average AOD for that year in 40 years. Therefore, the occurrence of high values in some years is often due to anomalously high values resulting from the transit of high pollution in a specific month.

3.4. Relationship between AOD and PM2.5/AQI

According to ambient air quality standards (GB 3095-2012) of China, the ambient air functional zones are divided into nature reserves and other areas requiring special protection (Class I) and residential areas, commercial traffic and residential mixed areas, cultural areas, industrial areas, and rural areas (Class II). Since air quality stations are mainly located in Class II areas, the secondary concentration limit of PM2.5 (daily average is 75 μg/m3 and annual average is 35 μg/m3) is adopted in this study as the criterion to judge whether the PM2.5 concentration in this area exceeds the standard. We conducted statistics and analysis of PM2.5 and AQI data from ground-based air quality monitoring stations, and the annual average values and PM2.5 concentration exceedances are shown in Table 1. It is very obvious that the annual average AQI and PM2.5 concentrations are decreasing since 2015. The frequency of PM2.5 concentration exceedances is also declining, which means that heavy pollution is decreasing, and air quality is improving. There is slightly a difference in 2019, in which the average value of pollution is lower than the previous year, but the number of PM2.5 concentration exceedances of the standard is somewhat higher.
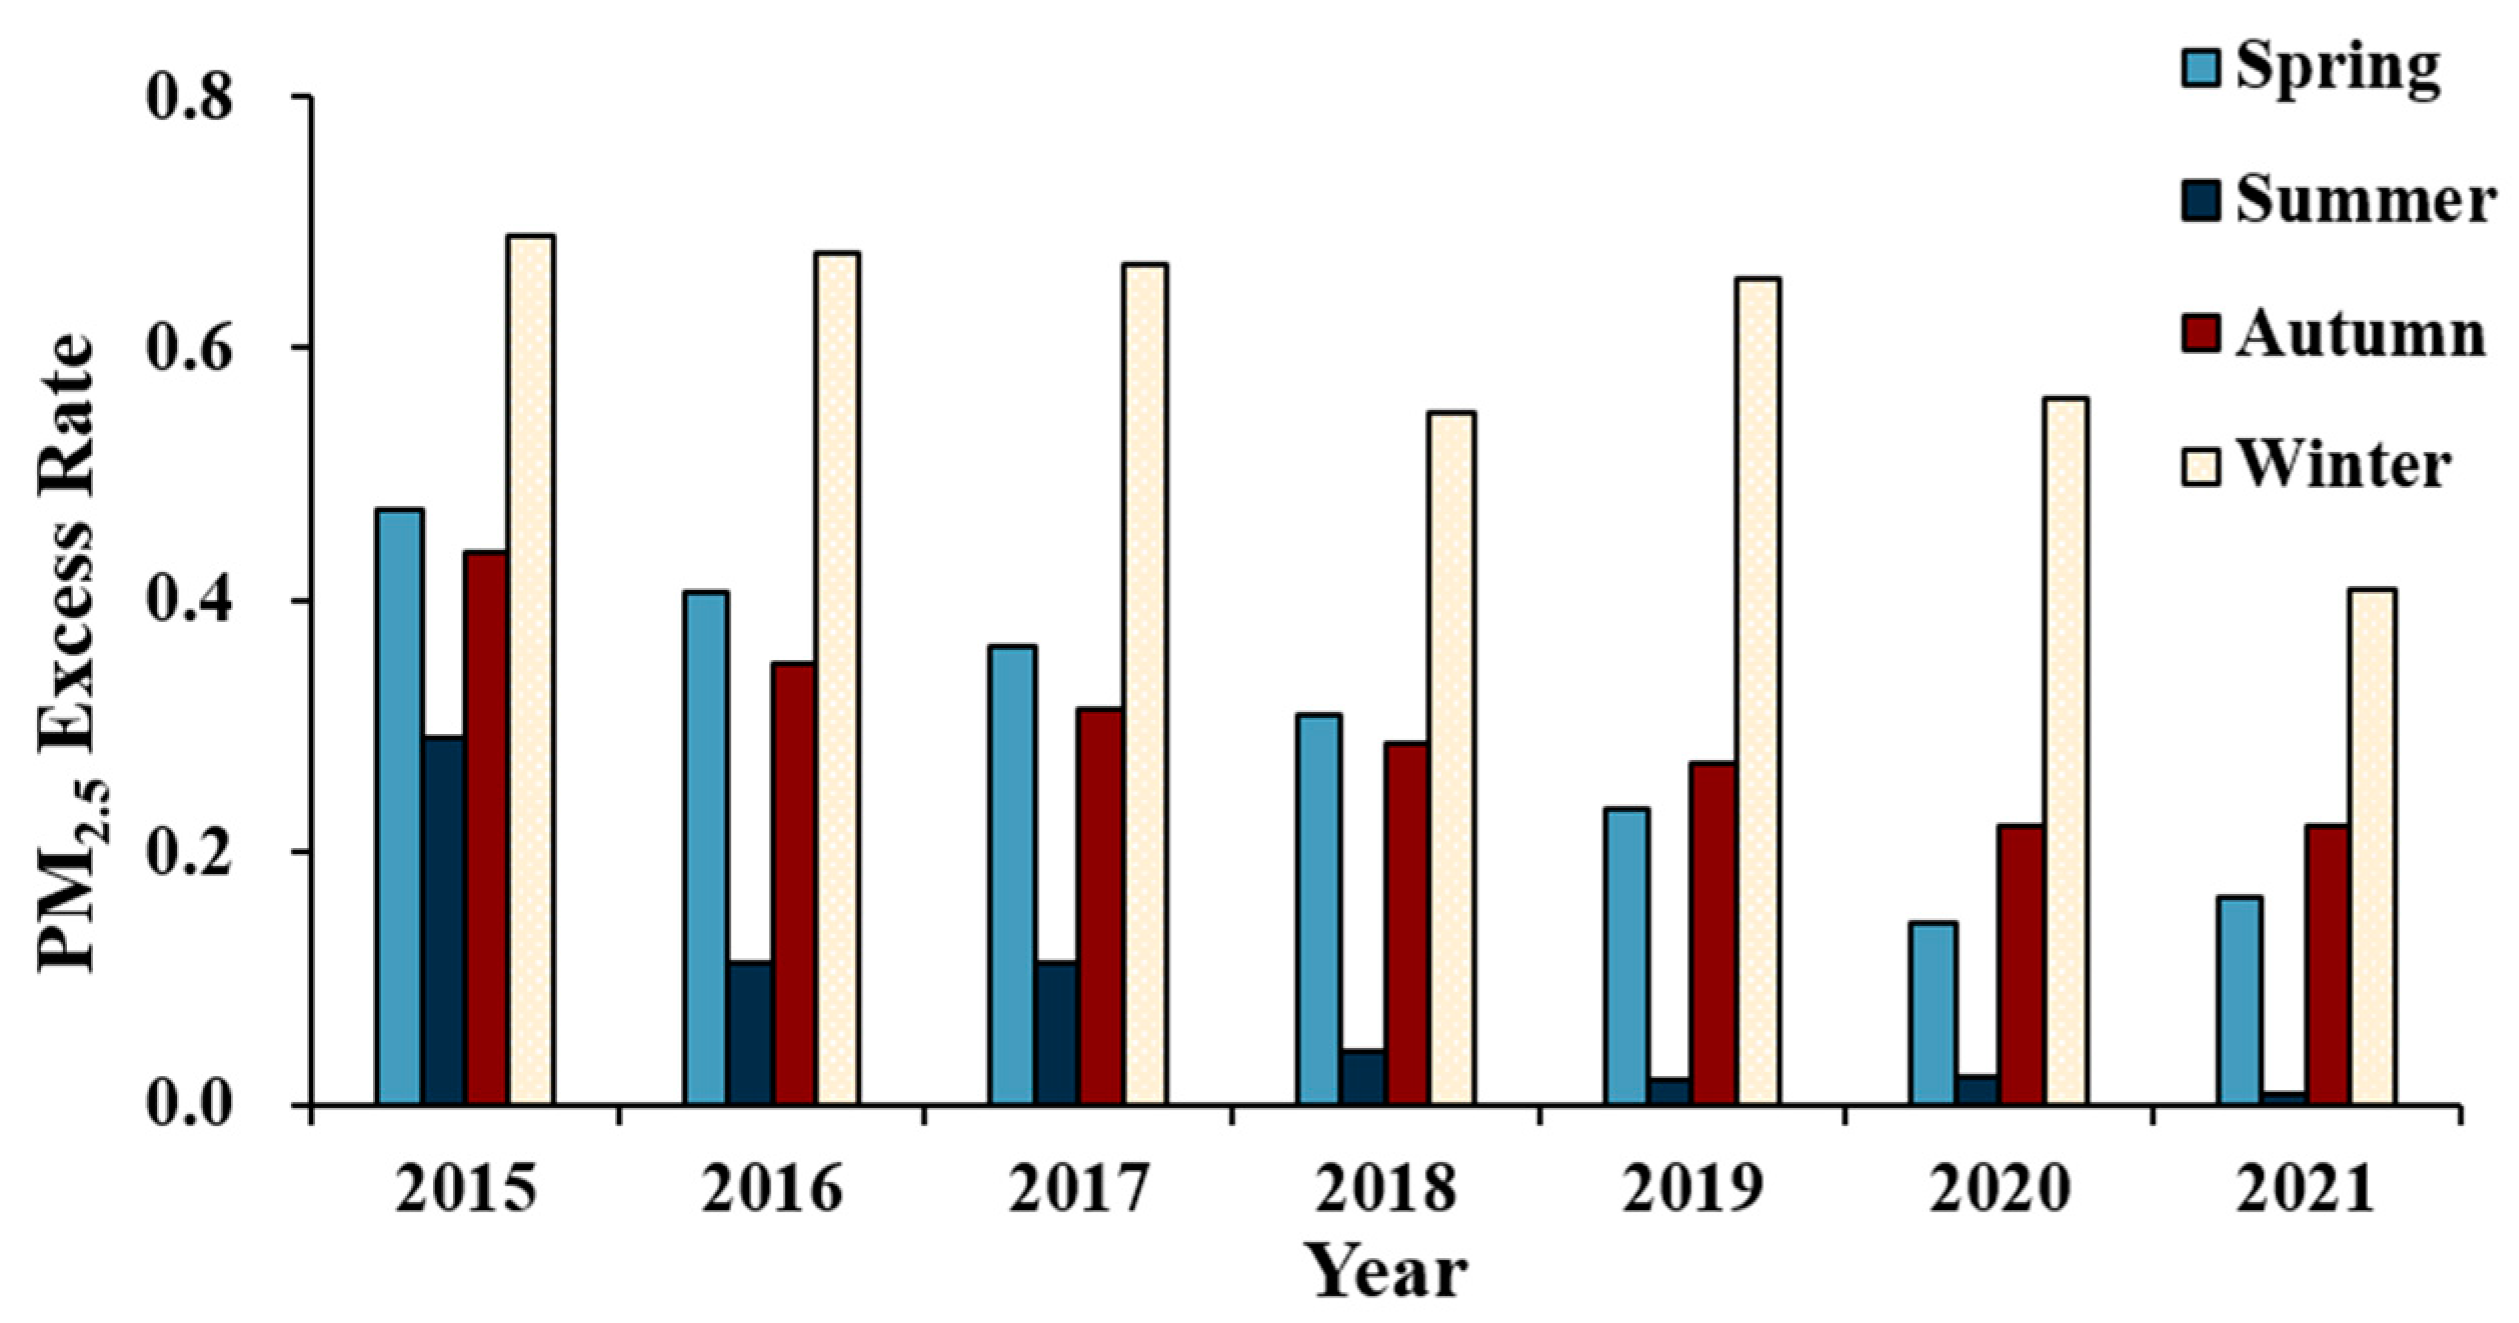
The seasonal PM2.5 exceedances for each year were calculated, and it can be seen in Figure 10 that PM2.5 exceedances were mainly concentrated in winter, while the exceedance rate in summer was still low, relatively. Surprisingly, the exceedances were explicitly higher in spring than in autumn until 2018, which was reversed after 2019. In addition, the exceedance rate suddenly picks up in the winter of 2019 and gradually decreases thereafter. In the spring, the exceedance rate is on a downward trend from 2015 to 2020 and only rises in 2021, but the rise is not high and remains smaller than in 2019 and before. On the other hand, it is gratifying to find that the PM2.5 exceedance rate has been decreasing in the autumn and summer.
Subsequently, we have also statistics on the monthly situation of the Huaihai Economic Zone, and the data show that the monthly trend is relatively consistent for each year, showing a U-shape (Figure 11). Among them, July (MEAN = 7.78%) and August (MEAN = 6.23%) have small exceedance rates, both less than 8%. However, the exceedances in January (MEAN = 67.09%), February (MEAN = 53.09%), and December (MEAN = 59.97%) were very serious, all greater than 50%. At the same time, it can be clearly seen that the variation of each month in each year does not exactly coincide with the overall variation of each year. For example, the exceedances in November and December in 2016 (MEAN11 = 56.53%, MEAN12 = 74.48%) were higher than in 2015 (MEAN11 = 49.89%, MEAN12 = 67.92%), although the annual exceedance rate in 2015 (MEAN = 47.03%) was higher than in 2016 (MEAN = 38.49%). Moreover, the highest value of the exceedance rate for each month from 2015–2021 was found in January 2020, reaching 75.28%. This reminds us that the number of heavily polluted days does not necessarily decrease when annual pollution is decreasing, especially in the months with the high frequency of pollution.
In order to further understand the air pollution in the Huaihai Economic Zone, we conducted statistics and analysis on the average PM2.5 concentration and AQI of ten cities. According to the data, Heze has the most serious air pollution, with the highest PM2.5 concentration (MEAN = 61.52 μg/m3) and AQI (MEAN = 100.04) among the ten cities, which are far higher than other cities. Lianyungang has the cleanest air, with a PM2.5 concentration of 43.16 μg/m3 and an AQI of 73.77. This is due to the high air humidity in the Lianyungang coastal area, which is not conducive to the growth of particulate matter. According to PM2.5 concentrations in descending order, the other cities are Jining (MEAN = 54.80 μg/m3), Suzhou (MEAN = 54.70 μg/m3), zaozhuang (MEAN = 53.87 μg/m3), Shangqiu (MEAN = 51.73 μg/m3), Xuzhou (MEAN = 49.17 μg/m3), Linyi (MEAN = 47.80 μg/m3), Suqian (MEAN = 47.68 μg/m3), and Huaibei (MEAN = 47.63 μg/m3). This is closely related to the industrial structure and regional geography of each city. If we follow the AQI values, the ranking between cities differs somewhat from the above, in order of zaozhuang (MEAN = 90.71), Jining (MEAN = 89.50), Shangqiu (MEAN = 86.45), Linyi (MEAN = 85.72), Suzhou (MEAN = 84.52), Xuzhou (MEAN = 84.30), Huaibei (MEAN = 79.56) and Suqian (MEAN = 78.14).
Finally, we studied the correlation coefficient between AOD and PM2.5 concentrations/AQI for the period 2015 to 2021 based on MODIS AOD data, PM2.5 concentration data, and AQI data. The results can be seen in Figure 12, and the annual trends of the three are generally consistent. After extensive data calculations, the correlation between AOD and PM2.5 was 0.84, and the correlation between AOD and AQI was 0.82. Because of the significant differences in the seasonal changes in AOD and PM2.5, we also calculated the correlation coefficients of the three by season. The results showed that the correlation coefficients between AOD and PM2.5 and AQI were the highest in autumn, at 0.86 and 0.91, respectively. In winter, the correlation coefficients between AOD and PM2.5 and AQI were the lowest, at 0.46 and 0.48, respectively. This result is consistent with the findings of many existing studies [34,60]. It also means that the correlation between AOD and AQI was higher than that of PM2.5 in autumn and winter. However, this was not the case in spring and autumn. In spring, the correlation coefficients of AOD with PM2.5 and AQI were 0.79 and 0.71, respectively. In summer, the correlation coefficients of AOD with PM2.5 and AQI were 0.66 and 0.65, respectively. In addition, we also noticed the variations and the totally reversed seasonal characteristics between AOD and PM2.5. This is due to the fact that the concentration of PM2.5 is related to the source of pollution, atmospheric deposition, diffusion degree, vegetation adsorption, and other factors. In the winter and spring, the vegetation coverage is low and the wind speed is high, which makes it easy to produce dusty weather. Moreover, coal-burning heating in northern areas also releases a lot of soot, which leads to an increase in PM2.5 concentration. In summer, there are many rainy days, and the washing of rain is beneficial to the deposition of PM2.5, thus reducing the PM2.5 concentration [61]. The Huaihai Economic zone belongs to the temperate continental monsoon climate, which has the characteristics of mild, humid, rain, and heat at the same time. There is a large part of plain terrain with low topography, and the vegetation is mainly deciduous broad-leaved vegetation. Aerosol is a general term for liquid or solid particles suspended in the atmosphere, so the concentration of aerosol is positively correlated with the water vapor content in the atmosphere, in summer, there are many clouds in the sky during the rainy season, and hygroscopic particles are easy to form new aerosols with water vapor, so the AOD value is large [62]. In winter and spring, the weather is sunny and the air is dry, so the contribution of water vapor to AOD decreases significantly, while the contribution of airborne particles to AOD increases, but the overall AOD shows a decreasing trend.

4. Conclusions

AOD is closely related to meteorological climate and human life and property safety. In this paper, we analyzed the spatial and temporal evolution characteristics of the AOD in the Huaihai Economic Zone over the past four decades based on daily AOD products of AVHRR and MODIS. The correlation coefficient between AOD and PM2.5/AQI is explored by combining PM2.5 concentration data and AQI data from air quality monitoring stations. The results show that the geographical differences of AOD gradually increase with the intensification of industrial production activities and the development of urbanization. Due to the differences in the meteorological environment and geography of the four seasons, the distribution of AOD in the study area is not exactly the same in all four seasons. In terms of temporal variation, with the development of industrialization, the AOD shows an upward trend until it peaked in 2011. There is a significant downward trend after the aggressive implementation of local clean air policies. In recent years, the monthly and quarterly differences in AOD have gradually decreased, which means that the targeted pollution reduction measures in the Huaihai Economic Zone have played a good role. The data from the air quality site showed that the air quality in the Huaihai Economic Zone has improved significantly in recent years, and PM2.5 air pollution has been controlled effectively. At the same time, the PM2.5/AQI showed a significant correlation with AOD and the highest correlation coefficient in autumn.
This study provides data support for atmospheric environmental monitoring, pollution assessment, and traceability, and helps local authorities to better utilize the coordination and linkage mechanism of the Huaihai Economic Zone to develop holistic management initiatives. The “integration” to solve the “fragmentation” problem, which can promote the development of the overall regional ecological environment, and further improve the atmospheric quality of the Huaihai Economic Zone. This is of great significance to improve regional strategic coordination, integrated development, regional cooperation and mutual assistance, and inter-regional benefit compensation. However, it is not enough to grasp the spatial and temporal distribution of AOD at present. We need to understand the sources of pollution as well as explore the reasons for the changes in AOD, which is the next step in our research.

Author Contributions

Conceptualization, S.W. and Y.X.; methodology, S.W.; validation, S.W., C.J. and Y.X.; formal analysis, S.W.; investigation, S.W.; resources, S.W. and C.J.; data curation, S.W. and Y.S.; writing—original draft preparation, S.W.; writing—review and editing, S.W., M.Z. and Y.X.; visualization, S.W.; supervision, X.J. and X.L.; funding acquisition, Y.X. All authors have read and agreed to the published version of the manuscript.

Funding

This research was funded by the Fundamental Research Funds for the Central Universities, grant number 2022XSCX17.

Institutional Review Board Statement

Not applicable.

Informed Consent Statement

Not applicable.

Data Availability Statement

Data sharing is not applicable to this article, as no new data were created or analyzed in this study.

Acknowledgments

The authors are very grateful for the comments and remarks of the reviewers who helped to improve the manuscript. Thanks to the editors for all their work on this manuscript.

Conflicts of Interest

The authors declare no conflict of interest.

References

  1. Kaufman, Y.J.; Tanré, D.; Boucher, O. A Satellite View of Aerosols in the Climate System. Nature 2002, 419, 215–223. [Google Scholar] [CrossRef] [PubMed]
  2. Rosenfeld, D.; Lohmann, U.; Raga, G.B.; O’Dowd, C.D.; Kulmala, M.; Fuzzi, S.; Reissell, A.; Andreae, M.O. Flood or Drought: How Do Aerosols Affect Precipitation? Science 2008, 321, 1309–1313. [Google Scholar] [CrossRef] [PubMed]
  3. Guo, L.; Turner, A.G.; Highwood, E.J. Local and Remote Impacts of Aerosol Species on Indian Summer Monsoon Rainfall in a GCM. J. Clim. 2016, 29, 6937–6955. [Google Scholar] [CrossRef]
  4. Kloog, I.; Koutrakis, P.; Coull, B.A.; Lee, H.J.; Schwartz, J. Assessing Temporally and Spatially Resolved PM2.5 Exposures for Epidemiological Studies Using Satellite Aerosol Optical Depth Measurements. Atmos. Environ. 2011, 45, 6267–6275. [Google Scholar] [CrossRef]
  5. Evans, J.; van Donkelaar, A.; Martin, R.V.; Burnett, R.; Rainham, D.G.; Birkett, N.J.; Krewski, D. Estimates of Global Mortality Attributable to Particulate Air Pollution Using Satellite Imagery. Environ. Res. 2013, 120, 33–42. [Google Scholar] [CrossRef]
  6. Kumar, M.; Singh, R.S.; Banerjee, T. Associating Airborne Particulates and Human Health: Exploring Possibilities. Environ. Int. 2015, 84, 201–202. [Google Scholar] [CrossRef]
  7. Wang, Y.; Jiang, J.H.; Su, H. Atmospheric Responses to the Redistribution of Anthropogenic Aerosols. J. Geophys. Res. 2015, 120, 9625–9641. [Google Scholar] [CrossRef]
  8. Banerjee, T.; Kumar, M.; Mall, R.K.; Singh, R.S. Airing “clean Air” in Clean India Mission. Environ. Sci. Pollut. Res. 2017, 24, 6399–6413. [Google Scholar] [CrossRef]
  9. Chen, S.-P.; Lu, C.-H.; Davies, J.E.; Ou-Yang, C.-F.; Lin, N.-H.; Huff, A.K.; Pierce, B.R.; Kondragunta, S.; Wang, J.-L. Infusing Satellite Data into Aerosol Forecast for near Real-Time Episode Detection and Diagnosis in East Asia. Sci. Total Environ. 2023, 856, 158797. [Google Scholar] [CrossRef]
  10. Sogacheva, L.; Rodriguez, E.; Kolmonen, P.; Virtanen, T.H.; Saponaro, G.; Leeuw, D.; Georgoulias, A.K. Spatial and Seasonal Variations of Aerosols over China from Two Decades of Multi-Satellite Observations. Part II: AOD Time Series for 1995–2017 Combined from ATSR ADV and MODIS C6.1 for AOD Tendencies Estimation. Atmos. Chem. Phys. Discuss. 2018, 18, 16631–16652. [Google Scholar] [CrossRef]
  11. Wei, J.; Peng, Y.; Mahmood, R.; Sun, L.; Guo, J. Intercomparison in Spatial Distributions and Temporal Trends Derived from Multi-Source Satellite Aerosol Products. Atmos. Chem. Phys. 2019, 19, 7183–7207. [Google Scholar] [CrossRef]
  12. Xia, X. Variability of Aerosol Optical Depth and Angstrom Wavelength Exponent Derived from AERONET Observations in Recent Decades. Environ. Res. Lett. 2011, 6, 044011. [Google Scholar] [CrossRef]
  13. Bhatia, N.; Tolpekin, V.A.; Stein, A.; Reusen, I. Estimation of AOD under Uncertainty: An Approach for Hyperspectral Airborne Data. Remote Sens. 2018, 10, 947. [Google Scholar] [CrossRef]
  14. Filonchyk, M.; Yan, H.; Zhang, Z.; Yang, S.; Li, W.; Li, Y. Combined Use of Satellite and Surface Observations to Study Aerosol Optical Depth in Different Regions of China. Sci. Rep. 2019, 9, 18650. [Google Scholar] [CrossRef] [PubMed]
  15. Li, Y.; Xue, Y.; Guang, J.; de Leeuw, G.; Self, R.; She, L.; Fan, C.; Xie, Y.; Chen, G. Spatial and Temporal Distribution Characteristics of Haze Days and Associated Factors in China from 1973 to 2017. Atmos. Environ. 2019, 214, 116862. [Google Scholar] [CrossRef]
  16. Holben, B.N.; Eck, T.F.; Slutsker, I.; Tanré, D.; Buis, J.P.; Setzer, A.; Vermote, E.; Reagan, J.A.; Kaufman, Y.J.; Nakajima, T.; et al. AERONET-A Federated Instrument Network and Data Archive for Aerosol Characterization. Remote Sens. Environ. 1998, 66, 1–16. [Google Scholar] [CrossRef]
  17. Slater, J.F.; Dibb, J.E.; Campbell, J.W.; Moore, T.S. Physical and Chemical Properties of Surface and Column Aerosols at a Rural New England Site during MODIS Overpass. Remote Sens. Environ. 2004, 92, 173–180. [Google Scholar] [CrossRef]
  18. Xin, J.; Wang, Y.; Li, Z.; Wang, P.; Hao, W.M.; Nordgren, B.L.; Wang, S.; Liu, G.; Wang, L.; Wen, T.; et al. Aerosol Optical Depth (AOD) and Angstrom Exponent of Aerosols Observed by the Chinese Sun Hazemeter Network from August 2004 to September 2005. J. Geophys. Res.-Atmos. 2007, 112, D05203. [Google Scholar] [CrossRef]
  19. Che, H.; Zhang, X.; Chen, H.; Damiri, B.; Goloub, P.; Li, Z.; Zhang, X.; Wei, Y.; Zhou, H.; Dong, F.; et al. Instrument Calibration and Aerosol Optical Depth Validation of the China Aerosol Remote Sensing Network. J. Geophys. Res. Atmos. 2009, 114, D03206. [Google Scholar] [CrossRef]
  20. Lopez-Solano, J.; Redondas, A.; Carlund, T.; Rodriguez-Franco, J.J.; Diemoz, H.; Leon-Luis, S.F.; Hernandez-Cruz, B.; Guirado-Fuentes, C.; Kouremeti, N.; Grobner, J.; et al. Aerosol Optical Depth in the European Brewer Network. Atmos. Chem. Phys. 2018, 18, 3885–3902. [Google Scholar] [CrossRef]
  21. Rimmer, J.S.; Redondas, A.; Karppinen, T. EuBrewNet-A European Brewer Network (COST Action ES1207), an Overview. Atmos. Chem. Phys. 2018, 18, 10347–10353. [Google Scholar] [CrossRef]
  22. Ma, Y.; Li, Z.; Li, Z.; Xie, Y.; Fu, Q.; Li, D.; Zhang, Y.; Xu, H.; Li, K. Validation of MODIS Aerosol Optical Depth Retrieval over Mountains in Central China Based on a Sun-Sky Radiometer Site of SONET. Remote Sens. 2016, 8, 111. [Google Scholar] [CrossRef]
  23. Pilahome, O.; Ninssawan, W.; Jankondee, Y.; Janjai, S.; Kumharn, W. Long-Term Variations and Comparison of Aerosol Optical Properties Based on MODIS and Ground-Based Data in Thailand. Atmos. Environ. 2022, 286, 119218. [Google Scholar] [CrossRef]
  24. Wei, X.; Chang, N.-B.; Bai, K.; Gao, W. Satellite Remote Sensing of Aerosol Optical Depth: Advances, Challenges, and Perspectives. Crit. Rev. Environ. Sci. Technol. 2020, 50, 1640–1725. [Google Scholar] [CrossRef]
  25. He, L.; Wang, L.; Lin, A.; Zhang, M.; Bilal, M.; Wei, J. Performance of the NPP-VIIRS and Aqua-MODIS Aerosol Optical Depth Products over the Yangtze River Basin. Remote Sens. 2018, 10, 117. [Google Scholar] [CrossRef]
  26. Xue, Y.; He, X.; de Leeuw, G.; Mei, L.; Che, Y.; Rippin, W.; Guang, J.; Hu, Y. Long-Time Series Aerosol Optical Depth Retrieval from AVHRR Data over Land in North China and Central Europe. Remote Sens. Environ. 2017, 198, 471–489. [Google Scholar] [CrossRef]
  27. Stammes, P. OMI Algorithm Theoretical Basis Document Volume III Clouds, Aerosols, and Surface UV Irradiance, 2nd ed.; Stammes, P., Ed.; NASA Goddard Space Flight Center: Greenbelt, MD, USA, 2002; Volume 3, pp. 1–114.
  28. Kumar, A.; Singh, N.; Anshumali; Solanki, R. Evaluation and Utilization of MODIS and CALIPSO Aerosol Retrievals over a Complex Terrain in Himalaya. Remote Sens. Environ. 2018, 206, 139–155. [Google Scholar] [CrossRef]
  29. Formenti, P.; Mbemba Kabuiku, L.; Chiapello, I.; Ducos, F.; Dulac, F.; Tanré, D. Aerosol Optical Properties Derived from POLDER-3/PARASOL (2005-2013) over the Western Mediterranean Sea- Part 1: Quality Assessment with AERONET and in Situ Airborne Observations. Atmos. Meas. Tech. 2018, 11, 6761–6784. [Google Scholar] [CrossRef]
  30. Chudnovsky, A.; Tang, C.; Lyapustin, A.; Wang, Y.; Schwartz, J.; Koutrakis, P. A Critical Assessment of High-Resolution Aerosol Optical Depth Retrievals for Fine Particulate Matter Predictions. Atmos. Chem. Phys. 2013, 13, 10907–10917. [Google Scholar] [CrossRef]
  31. Xin, J.; Gong, C.; Liu, Z.; Cong, Z.; Gao, W.; Song, T.; Pan, Y.; Sun, Y.; Ji, D.; Wang, L.; et al. The Observation-Based Relationships between PM2.5 and AOD over China. J. Geophys. Res.-Atmos. 2016, 121, 10701–10716. [Google Scholar] [CrossRef]
  32. Xu, Q.; Chen, X.; Yang, S.; Tang, L.; Dong, J. Spatiotemporal Relationship between Himawari-8 Hourly Columnar Aerosol Optical Depth (AOD) and Ground-Level PM2.5 Mass Concentration in Mainland China. Sci. Total Environ. 2021, 765, 144241. [Google Scholar] [CrossRef] [PubMed]
  33. Yang, Q.; Yuan, Q.; Yue, L.; Li, T.; Shen, H.; Zhang, L. The Relationships between PM2.5 and Aerosol Optical Depth (AOD) in Mainland China: About and behind the Spatio-Temporal Variations. Environ. Pollut. 2019, 248, 526–535. [Google Scholar] [CrossRef] [PubMed]
  34. Kim, S.-M.; Koo, J.-H.; Lee, H.; Mok, J.; Choi, M.; Go, S.; Lee, S.; Cho, Y.; Hong, J.; Seo, S.; et al. Comparison of PM2.5 in Seoul, Korea Estimated from the Various Ground-Based and Satellite AOD. Appl. Sci.-Basel 2021, 11, 10755. [Google Scholar] [CrossRef]
  35. Park, S.; Lee, J.; Im, J.; Song, C.-K.; Choi, M.; Kim, J.; Lee, S.; Park, R.; Kim, S.-M.; Yoon, J.; et al. Estimation of Spatially Continuous Daytime Particulate Matter Concentrations under All Sky Conditions through the Synergistic Use of Satellite-Based AOD and Numerical Models. Sci. Total Environ. 2020, 713, 136516. [Google Scholar] [CrossRef] [PubMed]
  36. Wei, J.; Huang, W.; Li, Z.; Xue, W.; Peng, Y.; Sun, L.; Cribb, M. Estimating 1-Km-Resolution PM2.5 Concentrations across China Using the Space-Time Random Forest Approach. Remote Sens. Environ. 2019, 231, 111221. [Google Scholar] [CrossRef]
  37. Wei, J.; Li, Z.; Lyapustin, A.; Sun, L.; Peng, Y.; Xue, W.; Su, T.; Cribb, M. Reconstructing 1-Km-Resolution High-Quality PM2.5 Data Records from 2000 to 2018 in China: Spatiotemporal Variations and Policy Implications. Remote Sens. Environ. 2021, 252, 112136. [Google Scholar] [CrossRef]
  38. Zhang, H.; Kondragunta, S. Daily and Hourly Surface PM2.5 Estimation from Satellite AOD. Earth Space Sci. 2021, 8, e2020EA001599. [Google Scholar] [CrossRef]
  39. Sun, L.; Li, R.-B.; Tian, X.-P.; Wei, J. Analysis of the Temporal and Spatial Variation of Aerosols in the Beijing-Tianjin-Hebei Region with a 1 Km AOD Product. Aerosol Air Qual. Res. 2017, 17, 923–935. [Google Scholar] [CrossRef]
  40. Zhao, C.; Wang, Q.; Ban, J.; Liu, Z.; Zhang, Y.; Ma, R.; Li, S.; Li, T. Estimating the Daily PM2.5 Concentration in the Beijing-Tianjin-Hebei Region Using a Random Forest Model with a 0.01 Degrees x 0.01 Degrees Spatial Resolution. Environ. Int. 2020, 134, 105297. [Google Scholar] [CrossRef]
  41. Fan, W.; Qin, K.; Xu, J.; Yuan, L.; Li, D.; Jin, Z.; Zhang, K. Aerosol Vertical Distribution and Sources Estimation at a Site of the Yangtze River Delta Region of China. Atmos. Res. 2019, 217, 128–136. [Google Scholar] [CrossRef]
  42. Liu, Y.; de Leeuw, G.; Kerminen, V.-M.; Zhang, J.; Zhou, P.; Nie, W.; Qi, X.; Hong, J.; Wang, Y.; Ding, A.; et al. Analysis of Aerosol Effects on Warm Clouds over the Yangtze River Delta from Multi-Sensor Satellite Observations. Atmos. Chem. Phys. 2017, 17, 5623–5641. [Google Scholar] [CrossRef]
  43. Sun, E.; Che, H.; Xu, X.; Wang, Z.; Lu, C.; Gui, K.; Zhao, H.; Zheng, Y.; Wang, Y.; Wang, H.; et al. Variation in MERRA-2 Aerosol Optical Depth over the Yangtze River Delta from 1980 to 2016. Theor. Appl. Climatol. 2019, 136, 363–375. [Google Scholar] [CrossRef]
  44. Wang, X.; Guo, Z.; Wang, Y.; Chen, Y.; Zheng, X.; Xu, X. Monitoring Temporal-Spatial Variations of AOD over the Yangtze River Delta, China. Stoch. Environ. Res. Risk Assess. 2018, 32, 2619–2632. [Google Scholar] [CrossRef]
  45. Xiao, Q.; Wang, Y.; Chang, H.H.; Meng, X.; Geng, G.; Lyapustin, A.; Liu, Y. Full-Coverage High-Resolution Daily PM2.5 Estimation Using MAIAC AOD in the Yangtze River Delta of China. Remote Sens. Environ. 2017, 199, 437–446. [Google Scholar] [CrossRef]
  46. Song, W.; Jia, H.; Huang, J.; Zhang, Y. A Satellite-Based Geographically Weighted Regression Model for Regional PM2.5 Estimation over the Pearl River Delta Region in China. Remote Sens. Environ. 2014, 154, 1–7. [Google Scholar] [CrossRef]
  47. Zhang, M.; Wang, Y.; Ma, Y.; Wang, L.; Gong, W.; Liu, B. Spatial Distribution and Temporal Variation of Aerosol Optical Depth and Radiative Effect in South China and Its Adjacent Area. Atmos. Environ. 2018, 188, 120–128. [Google Scholar] [CrossRef]
  48. Li, X.; Xie, P.; Li, A.; Xu, J.; Ren, H.; Ren, B.; Li, Y.; Li, J. Study of Aerosol Characteristics and Sources Using MAX-DOAS Measurement during Haze at an Urban Site in the Fenwei Plain. J. Environ. Sci. 2021, 107, 1–13. [Google Scholar] [CrossRef]
  49. State Council of the People’s Republic of China. The Approval of the State Council on the Overall Urban Planning of Xuzhou. Available online: http://www.gov.cn/zhengce/content/2017-06/23/content_5204776.htm (accessed on 7 January 2023).
  50. National Development and Reform Commission. Notice of the National Development and Reform Commission concerning Printing and Distributing the Huaihe Ecological Ecomnmic Belt Development Plan. Available online: https://www.ndrc.gov.cn/xxgk/zcfb/ghwb/201811/t20181107_962252_ext.html (accessed on 7 January 2023).
  51. Jin, C.; Xue, Y.; Jiang, X.; Wu, S.; Sun, Y. Retrieval and Validation of Long-Term Aerosol Optical Depth from AVHRR Data over China. Int. J. Digit. Earth 2022, 15, 1817–1832. [Google Scholar] [CrossRef]
  52. Ångström, A. The Parameters of Atmospheric Turbidity. Tellus 1964, 16, 64–75. [Google Scholar] [CrossRef]
  53. He, Q.; Zhang, M.; Huang, B. Spatio-Temporal Variation and Impact Factors Analysis of Satellite-Based Aerosol Optical Depth over China from 2002 to 2015. Atmos. Environ. 2016, 129, 79–90. [Google Scholar] [CrossRef]
  54. Zhao, B.; Jiang, J.H.; Gu, Y.; Diner, D.; Worden, J.; Liou, K.-N.; Su, H.; Xing, J.; Garay, M.; Huang, L. Decadal-Scale Trends in Regional Aerosol Particle Properties and Their Linkage to Emission Changes. Environ. Res. Lett. 2017, 12, 054021. [Google Scholar] [CrossRef]
  55. Mehta, M.; Singh, R.; Singh, A.; Singh, N.; Anshumali. Recent Global Aerosol Optical Depth Variations and Trends-A Comparative Study Using MODIS and MISR Level 3 Datasets. Remote Sens. Environ. 2016, 181, 137–150. [Google Scholar] [CrossRef]
  56. Bian, Y.X.; Zhao, C.S.; Ma, N.; Chen, J.; Xu, W.Y. A Study of Aerosol Liquid Water Content Based on Hygroscopicity Measurements at High Relative Humidity in the North China Plain. Atmos. Chem. Phys. 2014, 14, 6417–6426. [Google Scholar] [CrossRef]
  57. Zhang, L.; Sun, J.Y.; Shen, X.J.; Zhang, Y.M.; Che, H.; Ma, Q.L.; Zhang, Y.W.; Zhang, X.Y.; Ogren, J.A. Observations of Relative Humidity Effects on Aerosol Light Scattering in the Yangtze River Delta of China. Atmos. Chem. Phys. 2015, 15, 8439–8454. [Google Scholar] [CrossRef]
  58. Cheng, T.; Xu, C.; Duan, J.; Wang, Y.; Leng, C.; Tao, J.; Che, H.; He, Q.; Wu, Y.; Zhang, R.; et al. Seasonal Variation and Difference of Aerosol Optical Properties in Columnar and Surface Atmospheres over Shanghai. Atmos. Environ. 2015, 123, 315–326. [Google Scholar] [CrossRef]
  59. Kang, N.; Kumar, K.R.; Hu, K.; Yu, X.; Yin, Y. Long-Term (2002–2014) Evolution and Trend in Collection 5.1 Level-2 Aerosol Products Derived from the MODIS and MISR Sensors over the Chinese Yangtze River Delta. Atmos. Res. 2016, 181, 29–43. [Google Scholar] [CrossRef]
  60. Green, M.; Kondragunta, S.; Ciren, P.; Xu, C. Comparison of GOES and MODIS Aerosol Optical Depth (AOD) to Aerosol Robotic Network (AERONET) AOD and IMPROVE PM2.5 Mass at Bondville, Illinois. J. Air Waste Manag. Assoc. 2009, 59, 1082–1091. [Google Scholar] [CrossRef]
  61. Jin, J.; Liu, S.; Wang, L.; Wu, S.; Zhao, W. Fractional Vegetation Cover and Spatiotemporal Variations of PM2.5 Concentrations in the Beijing-Tianjin-Hebei Region of China. Atmosphere 2022, 13, 1850. [Google Scholar] [CrossRef]
  62. Qi, L.; Zheng, H.; Ding, D.; Ye, D.; Wang, S. Effects of Meteorology Changes on Inter-Annual Variations of Aerosol Optical Depth and Surface PM2.5 in China—Implications for PM2.5 Remote Sensing. Remote Sens. 2022, 14, 2762. [Google Scholar] [CrossRef]
Figure 1. The population density in China and Huaihai Economic Zone.
Atmosphere 14 00822 g001
Figure 2. The trend consistency test of AVHRR (a) and MODIS (b) with AERONET AOD data, and the correlation validation of AVHRR (c) and MODIS (d) with AERONET AOD data.
Atmosphere 14 00822 g002
Figure 3. The trend consistency test of monthly AOD data between AVHRR and MODIS.
Atmosphere 14 00822 g003
Figure 4. The annual spatial distribution of AOD from 1982 to 2021 over Huaihai Economic Zone.
Atmosphere 14 00822 g004aAtmosphere 14 00822 g004b
Figure 5. The seasonal spatial distribution of MODIS AOD over Huaihai Economic Zone from 1982 to 2021.
Atmosphere 14 00822 g005
Figure 6. The mean of seasonal and annual AOD of ten cities in Huaihai Economic Zone during 1982–2021.
Atmosphere 14 00822 g006
Figure 7. Statistics of mean and standard deviation of AOD in Huaihai Economic Zone during 1982–2021.
Atmosphere 14 00822 g007
Figure 8. Statistics of seasonal mean of AOD in Huaihai Economic Zone from 1982 to 2021.
Atmosphere 14 00822 g008
Figure 9. Statistics of monthly mean of AOD in Huaihai Economic Zone from 1982 to 2021.
Atmosphere 14 00822 g009
Figure 10. The statistics of PM2.5 exceeding standard rate in each quarter of Huaihai Economic Zone from 2015 to 2021.
Atmosphere 14 00822 g010
Figure 11. The statistics of PM2.5 exceeding standard rate in each month of Huaihai Economic Zone from 2015 to 2021.
Atmosphere 14 00822 g011
Figure 12. Annual AOD, AQI, and PM2.5 concentrations in Huaihai Economic Zone from 2015 to 2021.
Atmosphere 14 00822 g012
Table 1. The statistics of AQI annual average, PM2.5 concentration annual average, the number of days when the number of stations with PM2.5 concentration exceeding the standard accounted for more than 30%, and PM2.5 annual exceedance rate for Huaihai Economic Zone from 2015 to 2021.
YearAQIPM2.5 (μg/m3)Days over the Limit (d)Rate of PM2.5 Exceeds the Standard
2015116.9482.3723647.03%
2016107.6774.2117338.49%
2017103.4269.6116436.60%
201895.5162.4813329.68%
201993.5360.6213529.79%
202082.9953.3610923.71%
202179.7747.0710020.10%
Disclaimer/Publisher’s Note: The statements, opinions and data contained in all publications are solely those of the individual author(s) and contributor(s) and not of MDPI and/or the editor(s). MDPI and/or the editor(s) disclaim responsibility for any injury to people or property resulting from any ideas, methods, instructions or products referred to in the content.