1. Introduction
Drought is one of the natural disasters that does great harm to human beings [
1,
2,
3], and its recurring and long-lasting nature causes serious environmental, social, and economic disasters worldwide. With global warming [
4], economic losses due to drought amount to billions of dollars and affect more than two billion people every year [
5,
6], which is far more than the losses caused by other natural disasters. Sixty percent of China’s regions are prone to drought, especially in the last three decades when droughts have become more frequent. Shanxi Province is located in the upstream of the Yellow River in North China, a typical arid and semi-arid region where most areas are severely affected by drought, with only a few areas experiencing mild droughts. In recent years, due to the rapid development of the local economy and the fragile ecological environment, extreme weather has occurred frequently, leading to noticeable warming and drying of the climate. Shanxi Province has a typical Southeast Asian monsoon climate and is far from the ocean, with uneven precipitation mainly concentrated in summer and autumn, resulting in frequent extreme weather events. In recent years, the frequency of extreme weather events in Shanxi Province has been increasing, with drought being particularly prominent, causing serious impacts on agriculture, the economy, and even people’s livelihoods. Therefore, studying drought in Shanxi Province can help us understand the patterns of drought occurrence, and provide guidance and reference for agricultural production in drought-prone areas. It can also provide valuable insights for the government to propose disaster prevention and mitigation measures, playing a crucial role in safeguarding food security.
Traditional drought monitoring relies heavily on meteorological data collected from monitoring stations, which provides high accuracy but has certain limitations. Firstly, site data is sparse and unevenly distributed, making it challenging to obtain continuous spatial coverage with a certain lag in data acquisition. Secondly, traditional monitoring requires a significant amount of human and material resources, and the scope of application is small. With the advancement of remote sensing technology [
7,
8], the challenges associated with drought research have been addressed to a large extent. It is recorded that drought research has been carried out since 1861 based on precipitation. However, due to the intricate nature of the causes of drought and its susceptibility to human activities, researchers have frequently used the drought index as a means of describing this phenomenon. Palmer [
9,
10] developed the Palmer Drought Index (PDSI), a widely used drought index that is based on the relationship between water supply and demand, but the selection of its parameters was somewhat territorial. To address this issue, Wells [
11] proposed the self-calibrated Palmer Drought Severity Index (sc-PDSI), which is based on the same principles as the PDSI but uses a self-calibration technique to standardize the parameters across different regions. This makes the sc-PDSI a more reliable and consistent measure of drought severity that can be used worldwide. Mckee et al. [
12] proposed the Standardized Precipitation Index (SPI), which calculates the cumulative probability density function of precipitation based on precipitation information to access drought conditions. Carlson et al. [
13] proposed the Vegetation Supply Water Index (VSWI), a composite index of drought conditions with a good response to drought conditions throughout the growing season. The Crop Water Stress Index (CWSI) proposed by Jackson et al. [
14] is based on the heat balance principle and can reflect certain vegetation soil moisture conditions. Sandholt et al. [
15] proposed the Temperature Vegetation Dryness Index (TVDI) based on the relationship between surface temperature and vegetation index. Wang Pengxin et al. [
16] proposed the Vegetation Temperature Condition Index(VTCI) based on the scatter plot of NDVI and LST with a triangular regional distribution.
Using meteorological station data to calculate drought index is convenient, and the data is easily accessible. However, the observation data is greatly influenced by the relocation and uneven distribution of meteorological observation stations, which limits the monitoring of drought. Therefore, drought indices based on remote sensing monitoring data are used to quantitatively characterize the drought situation in Shanxi Province. The MODIS is a remote sensing satellite sensor used to obtain surface information worldwide, including vegetation coverage, land surface temperature, and other parameters. Drought research based on MODIS products has the characteristics of global coverage, high resolution, comprehensive multiple parameters, and timely data updates. CWSI, VSWI, and TVDI are not easily affected by other non-drought factors, are easy to calculate, their data is easily accessible, and they have been widely applied. To reveal the drought characteristics of Shanxi Province, this research utilizes the evapotranspiration products, vegetation indices, and surface temperature data provided by MODIS sensors. These data are used to calculate CWSI, VSWI, and TVDI, respectively. The research assesses the variability of each drought index on the drought monitoring ability of Shanxi Province from different perspectives, and conducts correlation analysis with the Palmer drought index to select the most suitable index. Finally, based on the optimized drought index, the spatiotemporal variation characteristics of drought in Shanxi Province from 2001 to 2020 were analyzed, providing a model for agricultural production and drought prevention in the region.
2. Materials and Methods
2.1. Overview of the Study Area
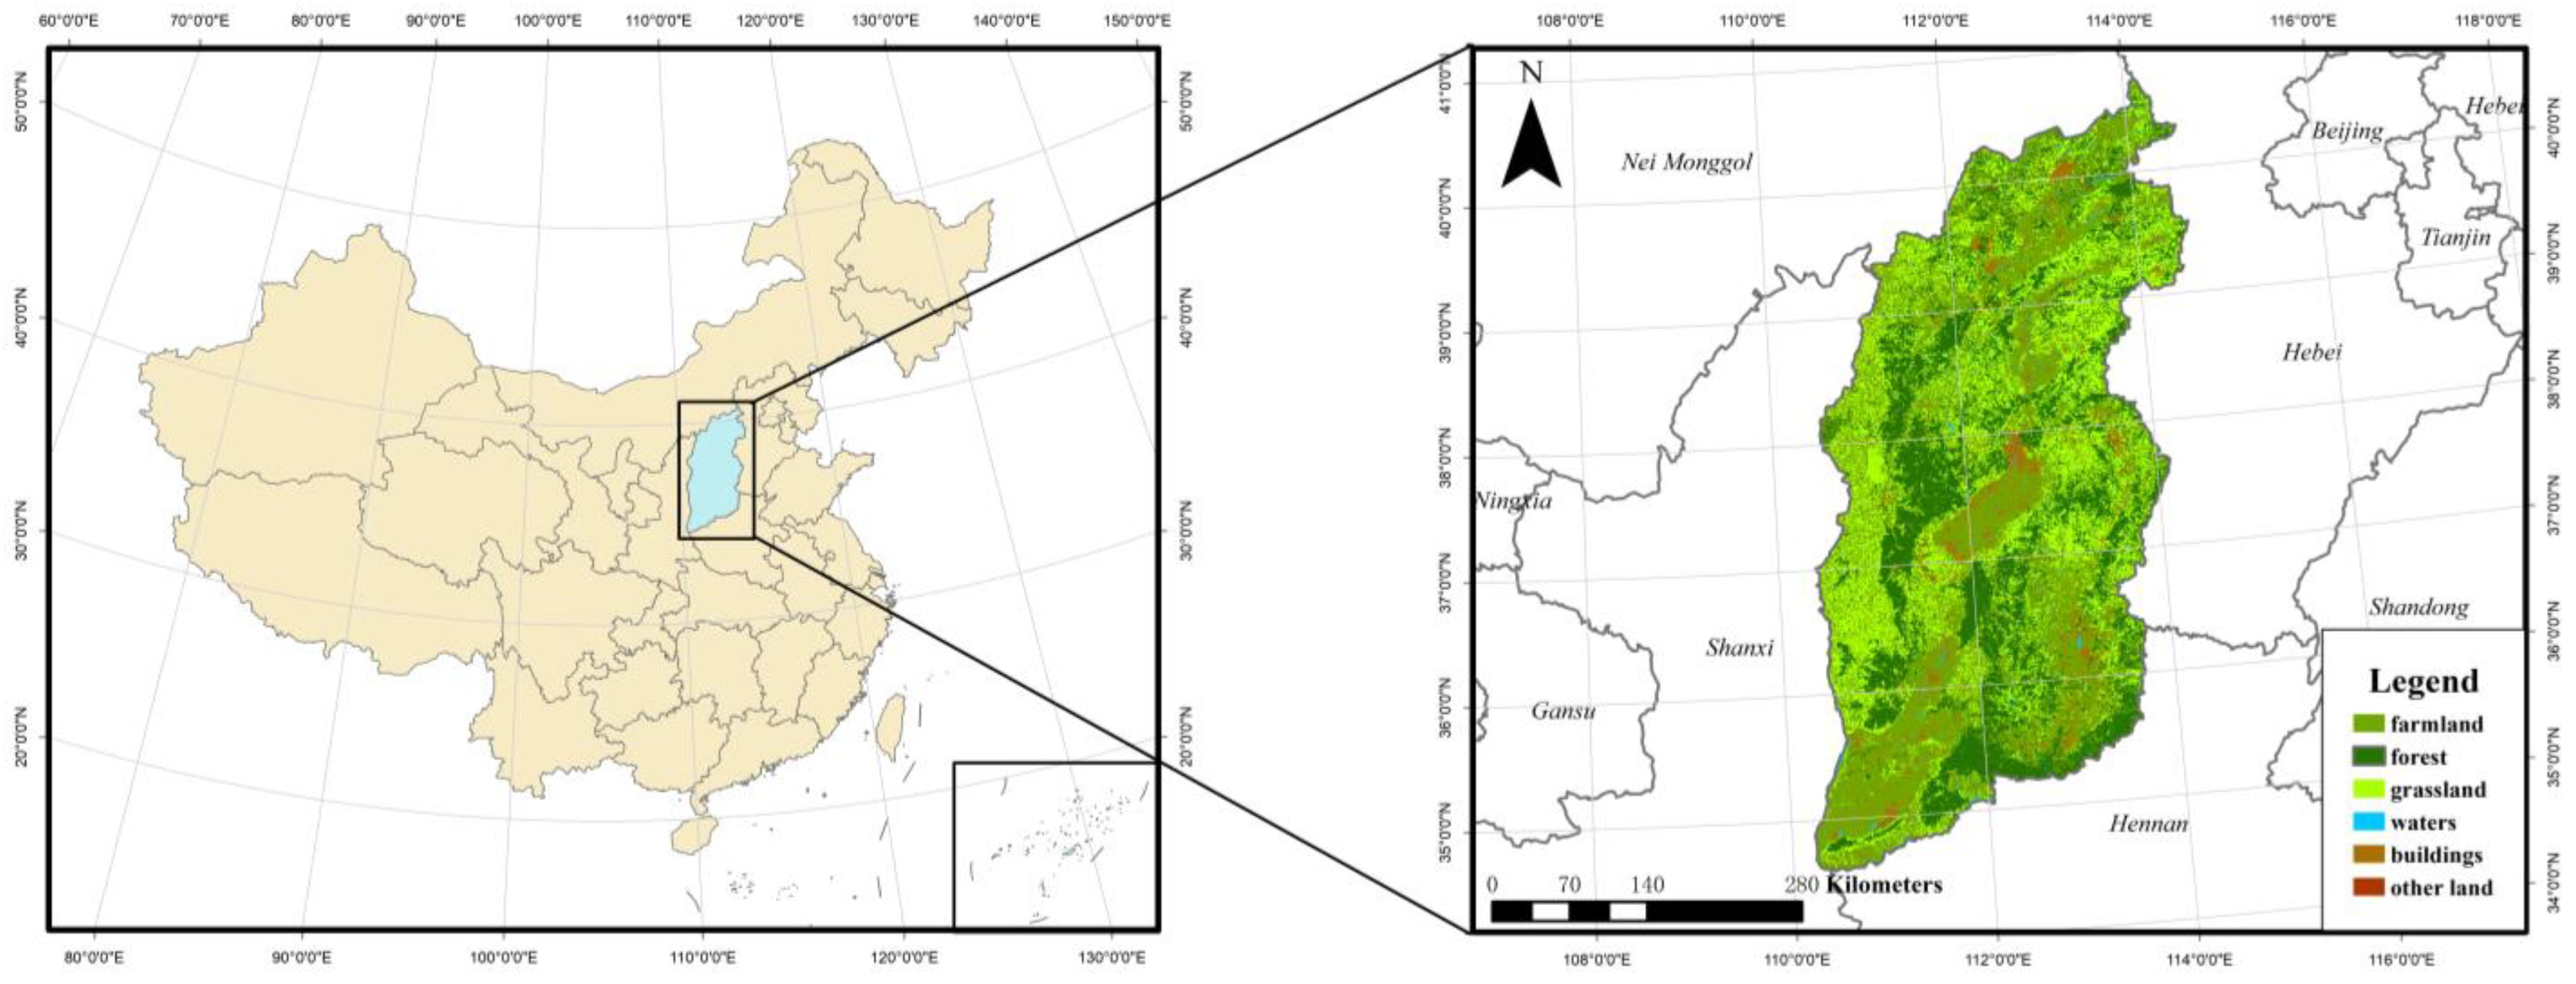
Shanxi Province is located in the northwestern region of China, positioned between 34°34′–40°44′ N and 110°14′–114°33′ E, in the upper reaches of the Yellow River, with a total area of 156,700 km
2 (
Figure 1). It borders Hebei to the east, Inner Mongolia to the north, Shanxi to the west, and Henan to the south. Shanxi Province is a typical mountainous plateau covered by loess. Its topography is characterized by high elevations in the northeast and lower elevations in the southwest, with undulating terrain, rivers, and valleys. The province’s landforms are complex and diverse, comprising hills, mountains, plains, and other types of landscapes. Shanxi Province is located in the eastern mid-latitude inland region of Asia and Europe, and belongs to the semi-arid-semi-humid region. The winters are long and cold, with dry weather prevailing, while the summers are longer in the south and shorter in the north, with concentrated precipitation. The province enjoys abundant sunshine and heat resources, but its weather can be quite unpredictable and sometimes disastrous.
2.2. Data Sources and Research Methods
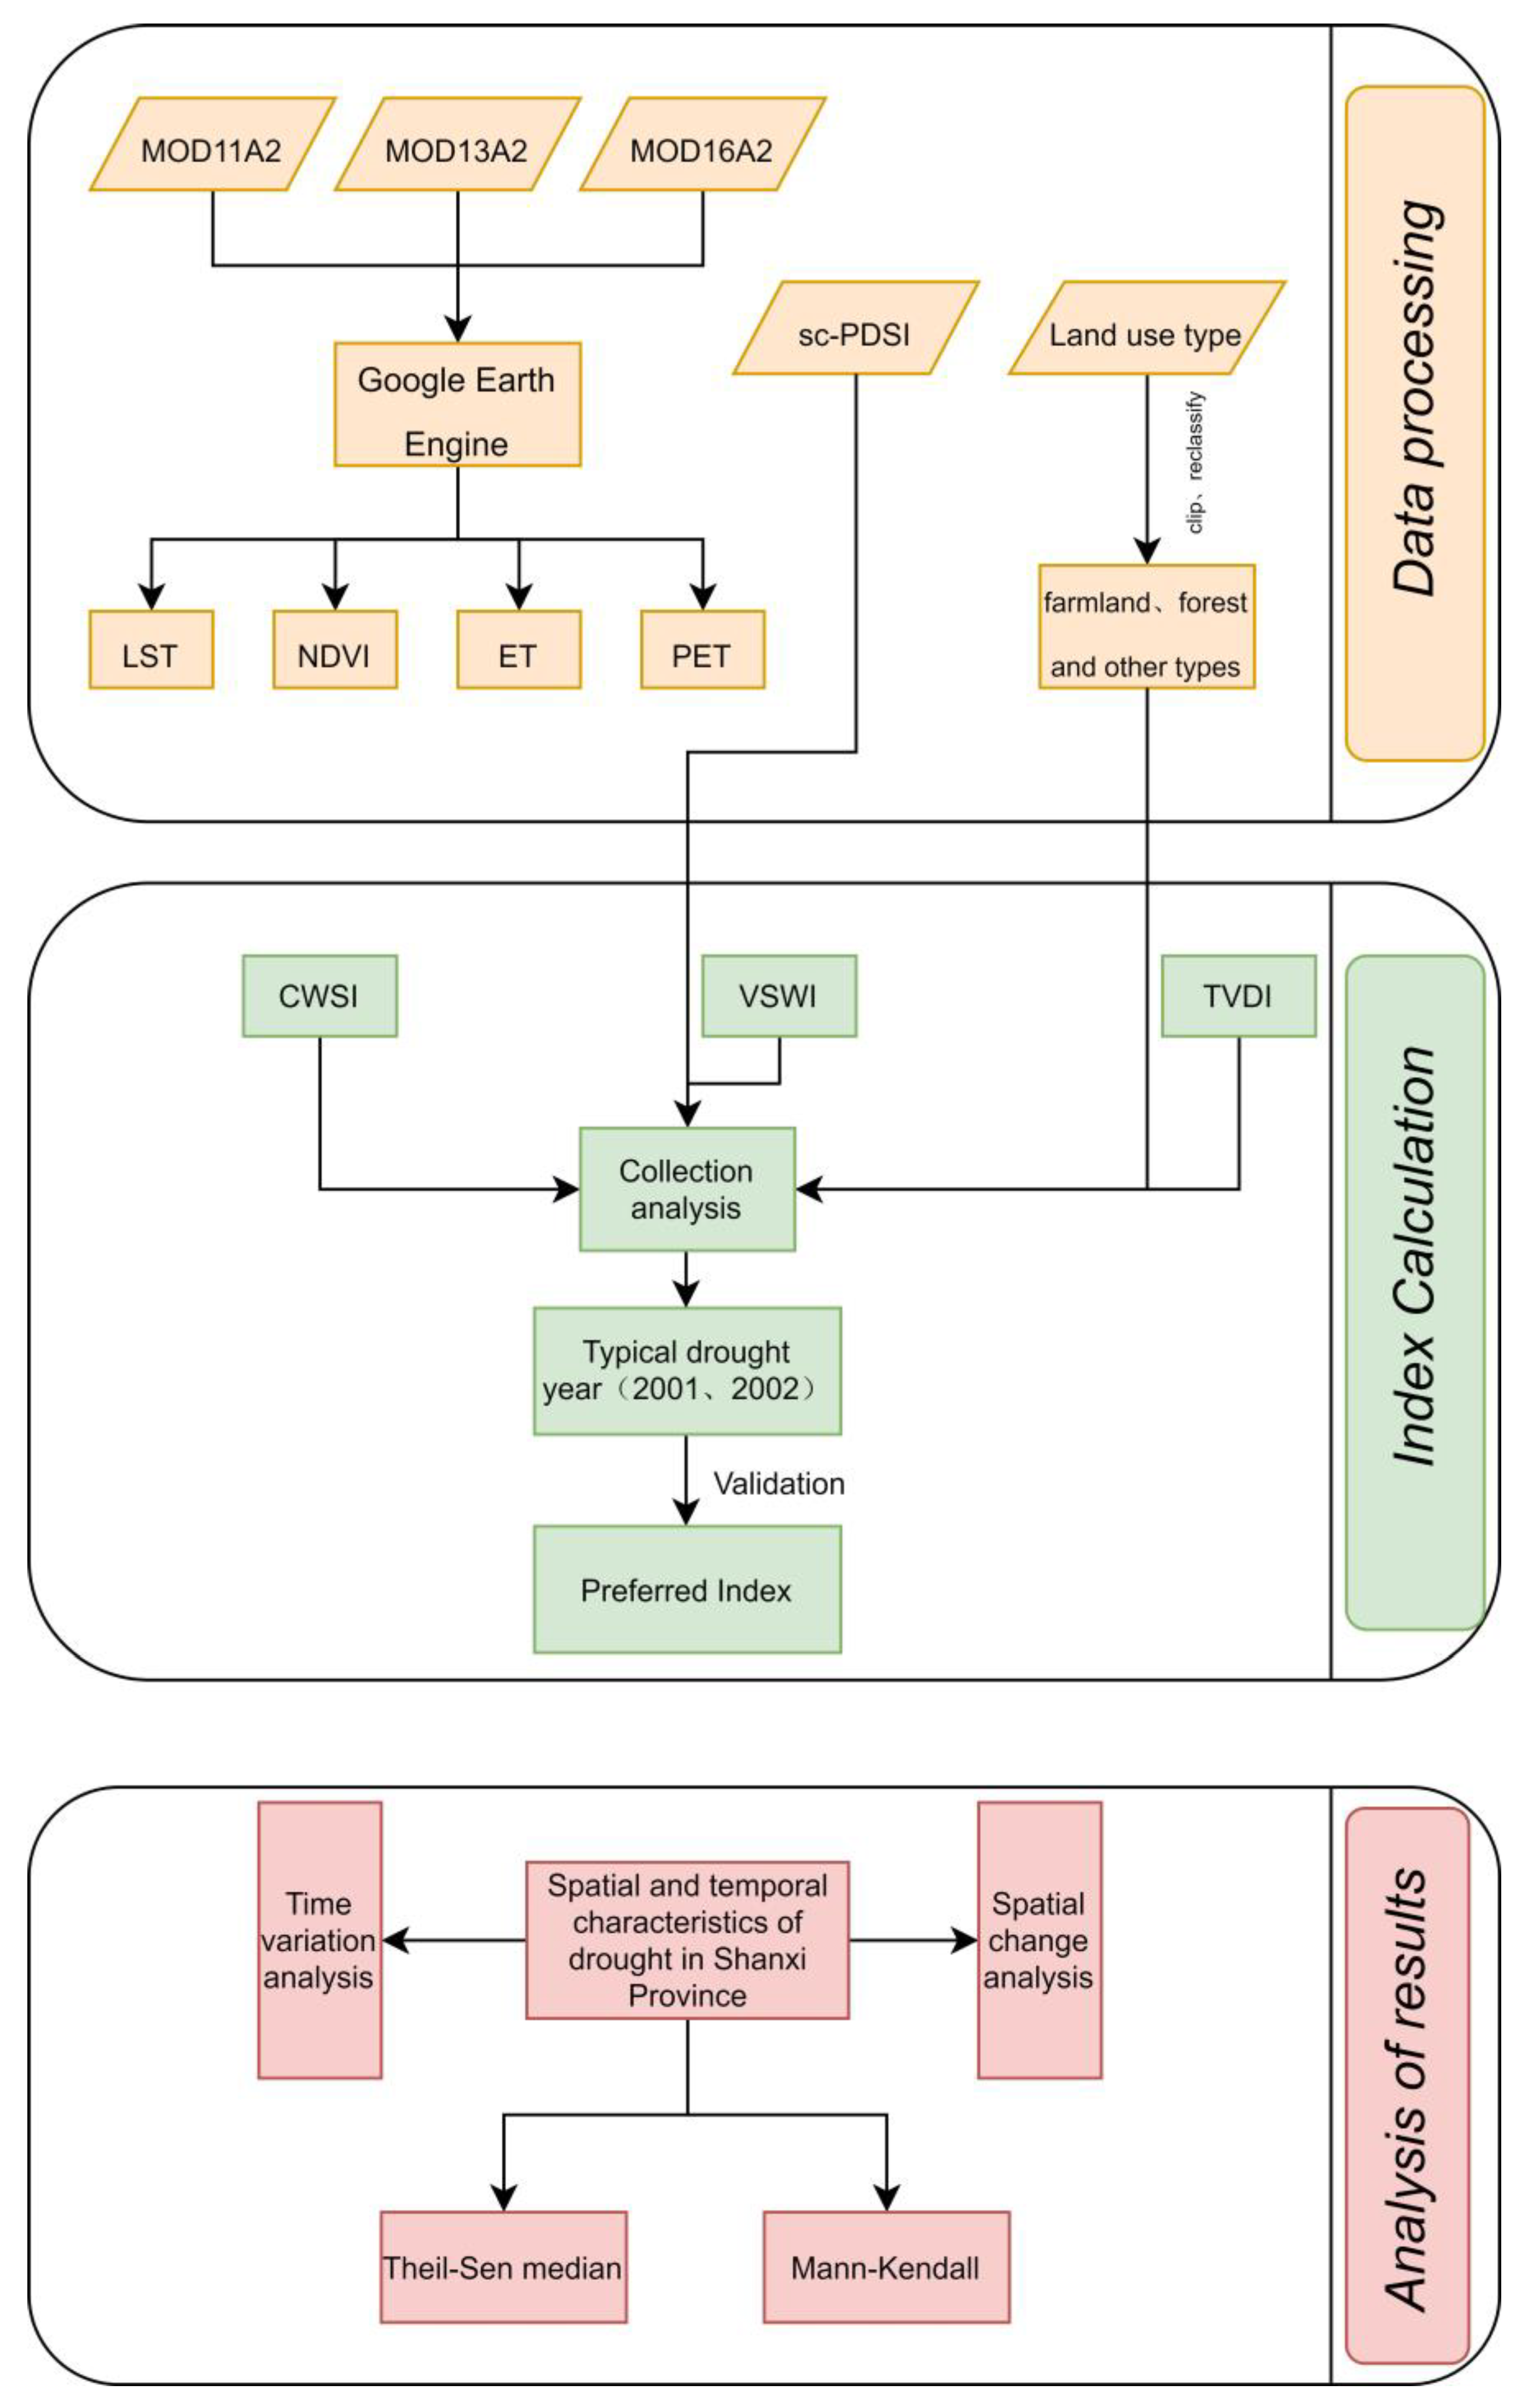
This article mainly applies RS and GIS technologies, based on MODIS digital data and sc-PDSI data, to analyze the spatiotemporal pattern of drought in the study area, under the premise of model verification. The technology roadmap illustrated in
Figure 2 is shown below:
2.2.1. Data Sources
The study uses evapotranspiration products, vegetation index, and surface temperature data from the MODIS sensor to calculate CWSI, VSWI, and TVDI, respectively. The images were obtained from NASA (
https://ladsweb.modaps.eosdis.nasa.gov/ accessed on 1 October 2022).The 2001–2020 surface temperature (LST) was obtained from the NASA MOD11A2 sensor; the Normalized Difference Vegetation Index (NDVI) from the MOD13A1 sensor [
17]; and the actual evapotranspiration (ET) and potential evapotranspiration (PET) from the MOD16A2 sensor. The sc-PDSI data from January to December of 2001–2020 are derived from climate research (
https://crudata.uea.ac.uk/ accessed on 30 October 2022); land type data in Shanxi Province were obtained from the number of land types at 1 km resolution provided by the Resource and Environmental Science and Data Centre of the Chinese Academy of Sciences (
http://www.resdc.cn/ accessed on 15 November 2022), which can be reclassified to obtain forest, grassland, and cropland types.A description of the relevant data is shown in
Table 1:
2.2.2. Research Methods
- (1)
CWSI
Remote sensing methods for soil moisture estimation typically provide information only on the soil surface, which may not accurately reflect the moisture levels at the root level of crops. To obtain more accurate measurements, it is necessary to measure the canopy temperature of vegetation and calculate the Crop Water Stress Index (CWSI). The CWSI is based on the principle of energy balance and monitors drought conditions in real time by considering soil moisture and evapotranspiration from farmland. In 1981, Idso et al. [
18] proposed the CWSI based on the empirical relationship between canopy temperature and air vapor pressure deficit. Later, Jackson et al. [
19] based their theoretical interpretation on the canopy energy balance and proposed the calculation of the CWSI, which they defined as [
20,
21]:
where
ET is the actual evapotranspiration and
PET is the potential evapotranspiration. The value of
CWSI ranges from 0 to 1, with smaller values indicating wetter conditions and larger values indicating drier conditions.
- (2)
VSWI
The VSWI uses the ratio of vegetation index to surface temperature as an indicator of the extent of vegetation exposure to drought, and provides a better understanding of the drought condition in areas with high vegetation cover and strong vegetation transpiration [
22,
23]. Under normal conditions when crop water supply is adequate, the crop canopy temperature stays within a certain range. If there is a drought and the crop water supply is insufficient, the vegetation index from satellite remote sensing will decrease and at the same time the crop canopy temperature will increase. The VSWI drought monitoring model uses the Normalized Difference Vegetation Index (NDVI) and Channel 4 remote sensing bright temperature as factors, and is defined as [
24]:
where
NDVI is the Normalized Difference Vegetation Index, and
Tc is the canopy temperature of vegetation. Since it is difficult to obtain the canopy temperature, LST is used to replace it. The
VSWI takes on a value between 0 and 1, with smaller values indicating a drier region, and larger values indicating a more humid region.
- (3)
TVDI
In their study of soil moisture, Sandholt et al. [
25] found a number of contours in the characteristic space of the normalized vegetation index and the surface temperature, based on which the TVDI was proposed. The defining equation is [
26]:
where
refers to Land Surface Temperature,
and
represent the minimum and maximum values of LST corresponding to a certain
NDVI value.
a1,
a2 and
b1,
b2 are the fitting coefficients for dry and wet edges. TVDI has a value between 0 and 1; a smaller TVDI value indicates a more humid region, while a larger value indicates a drier region.
- (4)
sc-PDSI
The Palmer Drought Severity Index (PDSI), developed by Palmer in 1956, is a widely used measure of accumulated deviation of surface moisture supply and demand on land. It incorporates the effects of temperature on precipitation and can accurately reflect the impact of climate on drought. However, its applications in analyzing drought in different spatial areas have limitations, and it may not be suitable for evaluating drought in diverse regions. To address these limitations, the self-calibrated PDSI (sc-PDSI) has been developed. The sc-PDSI dynamically calculates the monthly PDSI value and replaces the empirical constant of the original location. In this article, the sc-PDSI is used to analyze its correlation with different drought indices and to select the most suitable drought index for the study area. The findings of this study will help to enhance the accuracy of drought monitoring and prediction in the region.
- (5)
Other methods
The Pearson correlation coefficient is widely used to measure the degree of correlation between two variables. In order to test the drought monitoring ability of different remote sensing indices, the correlation index R between the three indices and sc-PDSI is analyzed, which represents the difference ratio between the different indices and the Pearson correlation coefficient, reflecting the dispersion degree of the drought index itself [
27,
28,
29]. Overall, the correlation analysis between drought indices and sc-PDSI can help to identify which indices are most effective in monitoring drought conditions, and can provide valuable information for drought management and mitigation efforts.
The Theil-sen Median method and the Mann—Kendall (MK): The Theil-sen Median method is a robust non-parametric statistical trend calculation method [
30]. This method has high computational efficiency and is insensitive to measurement errors and outliers. It is often used in trend analysis of long time series data. The MK trend test [
31] is a non-parametric test for analyzing trends in time series [
32,
33]. It is essentially a non-parametric test that does not require the sample to follow a specific distribution and is not disturbed by a few outliers, but also has a wide detection range, a high degree of quantification, and a simple calculation process. Sen trend analysis and MK testing are often combined for analysis. First, the Sen trend value is calculated, and then the MK method is used to determine the significance of the trend. In this study, the Sen trend is used to analyze the trend of drought intensity in Shanxi Province, and the MK method is used to test the significance of the trend.
3. Results and Analysis
3.1. Validation of Integrated Drought Monitoring Models
3.1.1. Correlation Analysis
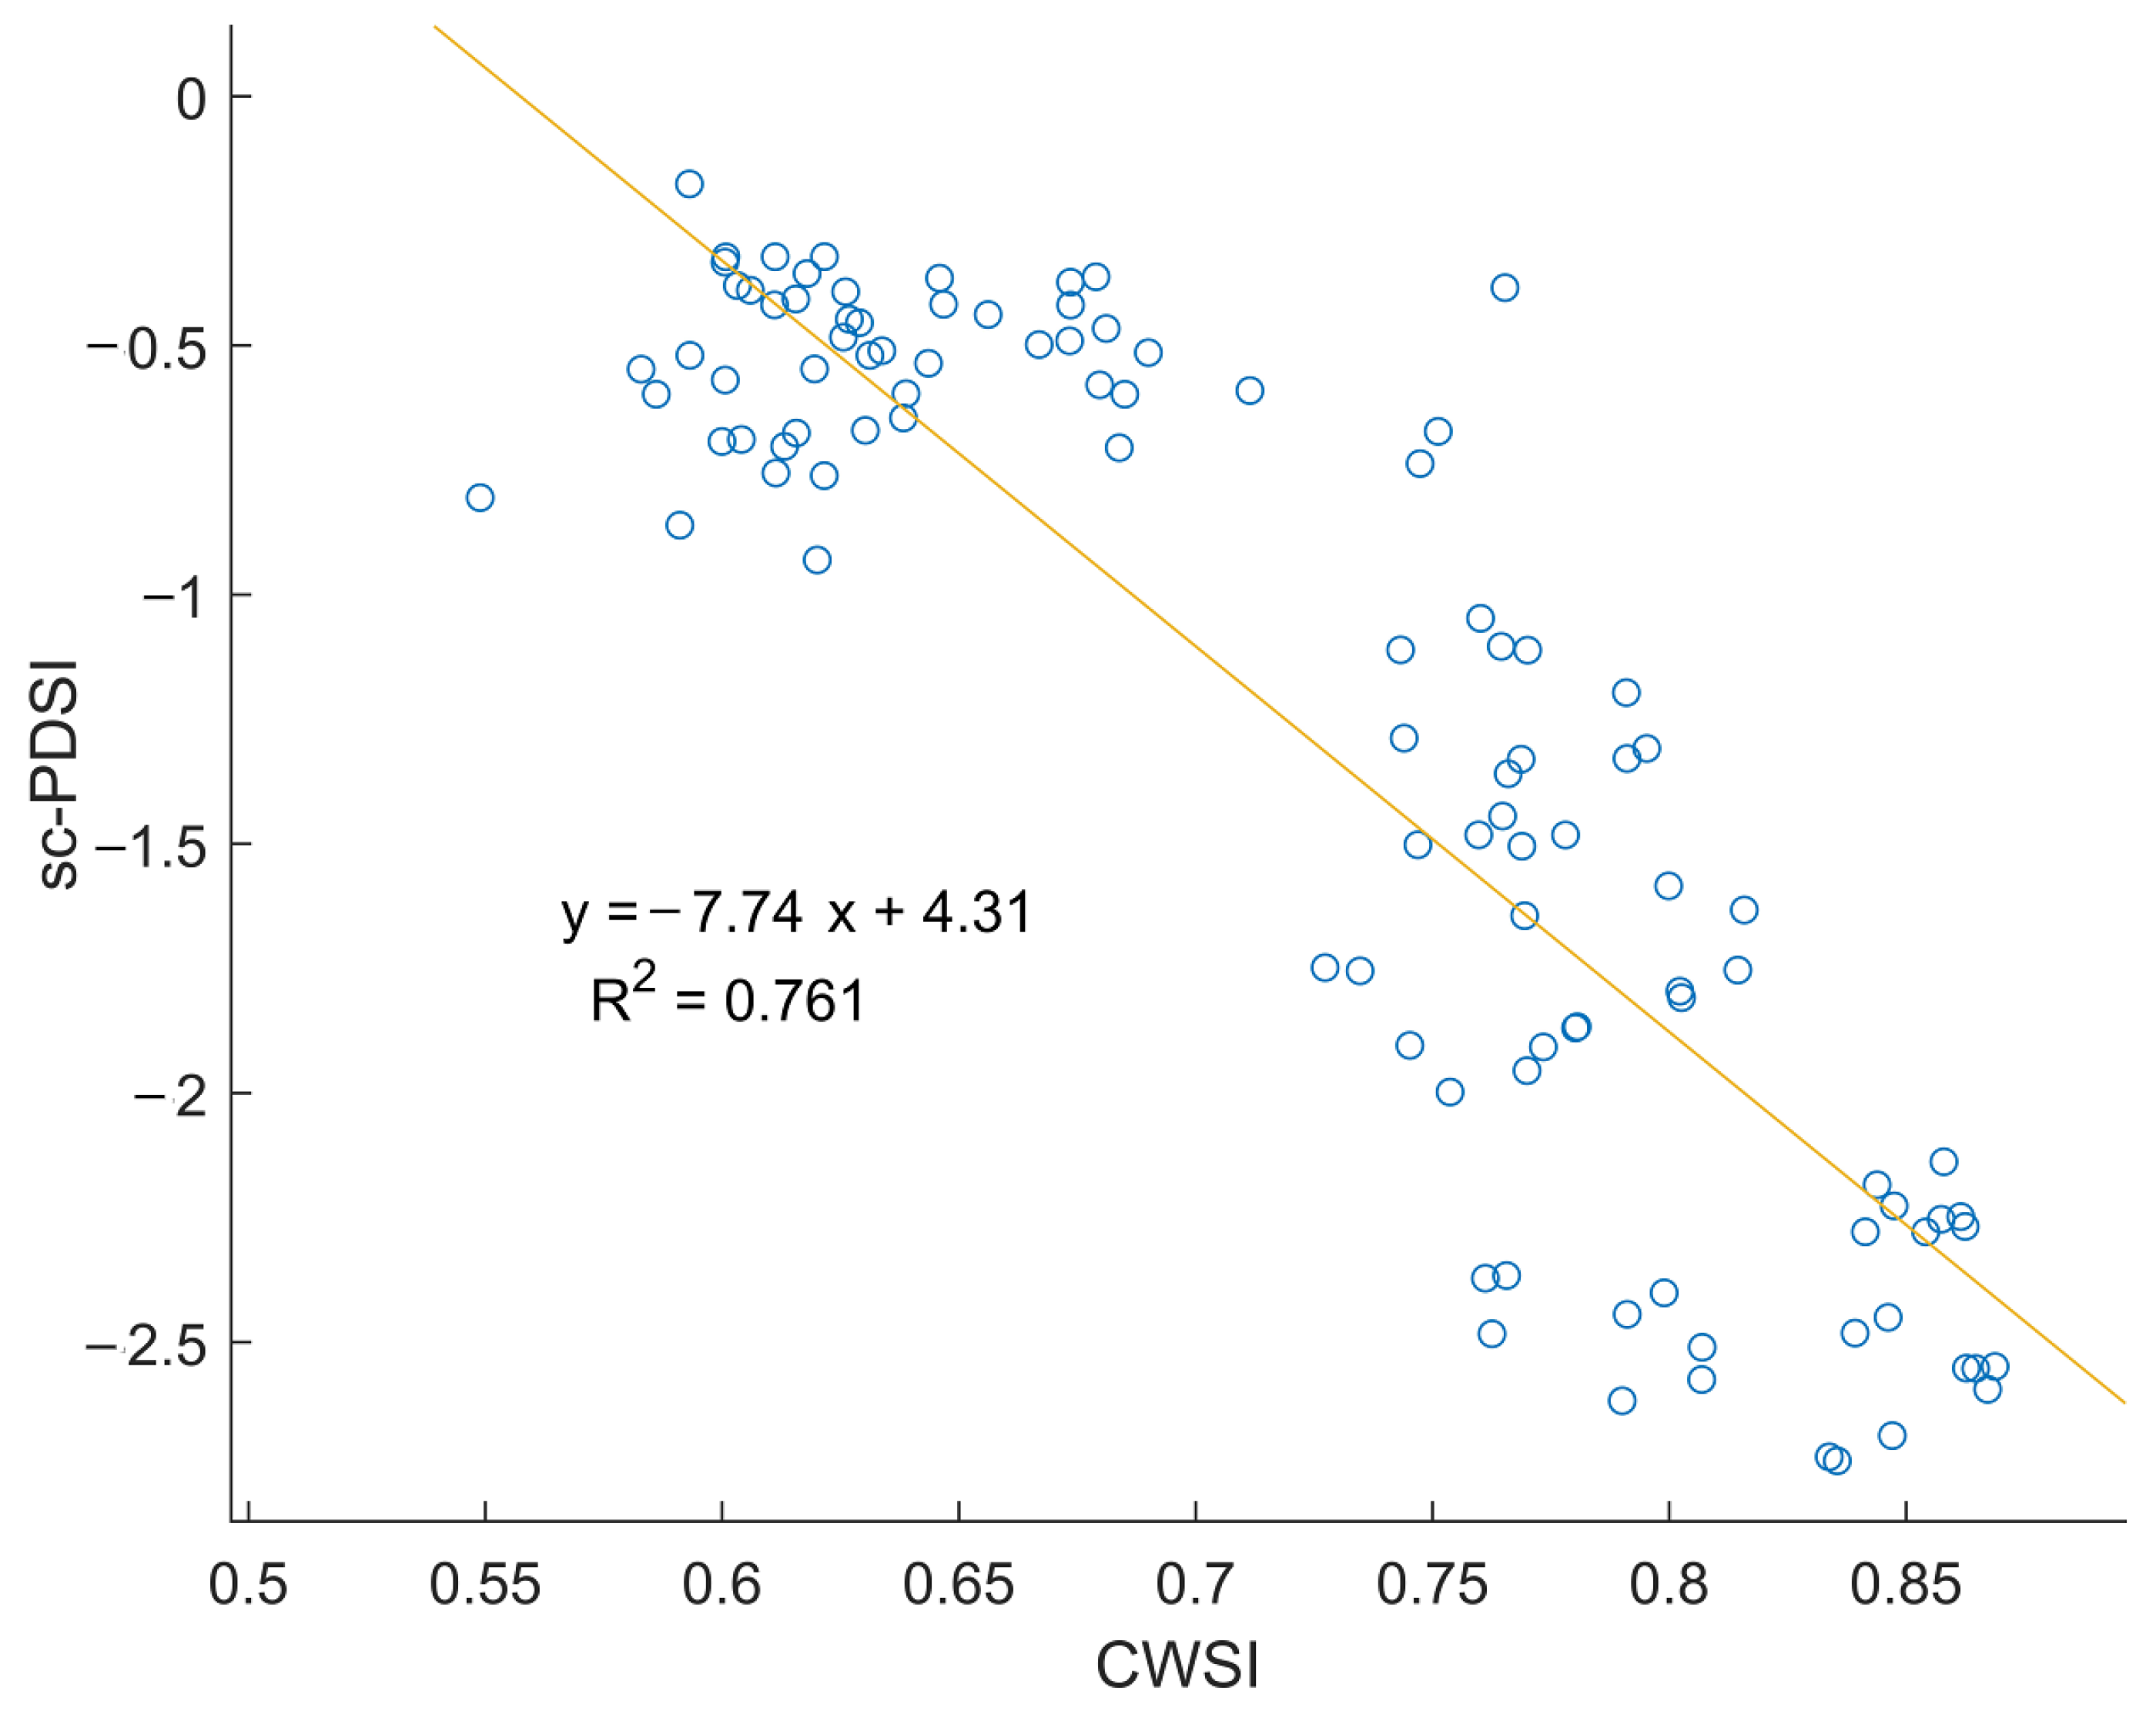
Using the above method, three indices are calculated. To verify the accuracy of the three remote sensing drought indices, Pearson correlation coefficient analysis is performed between the three indices and sc-PDSI data (
Figure 3). Through statistical analysis, the correlation coefficients of CWSI, VSWI, and TVDI are −0.54, 0.35, and −0.16, respectively. Results show that overall CWSI and TVDI are negatively correlated with sc-PDSI, that is, the larger the CWSI and TVDI, the smaller the sc-PDSI and the drier the study area. VSWI is positively correlated with sc-PDSI, that is, the larger the VSWI, the larger the PDSI and the wetter the study area. The correlation between CWSI and sc-PDSI passed the significance test with a
p value of less than 0.05 in most regions., indicating that CWSI is more sensitive to interannual changes in drought in the study area.
The monitoring results of droughts may differ in different land use types due to factors such as vegetation coverage, soil type, and terrain. Generally, urban areas are characterized by extensive impervious surfaces, which reduce the amount of water that can infiltrate into the soil. This can result in increased runoff and decreased soil moisture, making urban areas more susceptible to drought. Farmland typically has lower vegetation cover and higher evapotranspiration rates than natural land, which can result in lower soil moisture levels and increased susceptibility to drought. Grassland typically has lower evapotranspiration rates than forests, but higher rates than agricultural land. Overall, it is important to understand the characteristics of different land use types in order to assess their vulnerability to drought and develop effective drought mitigation strategies. For different land use types (as shown in
Table 2), the higher the Pearson correlation coefficient, the better the fit and the more applicable the index. The correlation coefficients of CWSI are relatively high for different land use types, including farmland, forest, and grassland. Among them, the fitting degree of grassland is the highest, with a mean correlation coefficient of −0.55, which passed the significance test with
p < 0.05. This is much higher than the other two index models. Through comprehensive analysis, it is concluded that CWSI has a greater advantage in drought monitoring and simulation in Shanxi Province.
3.1.2. Verification of Typical Drought Events
To further validate the accuracy of CWSI drought monitoring, it combines with typical drought events for verification. According to the Statistical Yearbook of Shanxi Province, between 1997 and 2002 Shanxi Province suffered from severe drought, which was caused by global warming, reduced precipitation, and a sharp decrease in water coming from rivers. From historical statistics, Shanxi Province suffers from a drought every 2.6 years, causing serious impacts on industries, agriculture, and other aspects. During the years 2001 and 2002, Shanxi Province experienced a relatively severe drought, where the maximum value of CWSI was 0.97 in 2001 (
Figure 4a) and 0.96 in 2002 (
Figure 4b); and its annual average values of CWSI were 0.85 and 0.82, respectively, which are the maximum values during the study period, further indicating the accuracy of CWSI in monitoring drought in Shanxi Province.
3.2. Drought Classification
The above correlation analysis shows that the CWSI index is more applicable in the study area than the other two indices. Therefore, the CWSI is selected to analyze the spatial and temporal characteristics of drought in the study area. However, before the analysis, the drought class criteria need to be classified. For this purpose, the research uses the sc-PDSI, and the CWSI value at the corresponding location for a one-dimensional linear regression analysis (
Figure 5). During the study period, most of the sc-PDSI in Shanxi Province range from −3 to 1. Thus, the drought classes are classified into four levels according to the sc-PDSI criteria for classifying drought, while sample points are selected according to the area share of different land types in Shanxi Province; and one-dimensional linear regression is performed to obtain the classification thresholds of CWSI corresponding to different classes (
Table 3).
3.3. Temporal Variation Characteristics of Drought
According to the interannual variation and cumulative anomaly of CWSI in Shanxi Province (
Figure 6), the fluctuation range of CWSI has been small over the years, with a decreasing trend. The CWSI fluctuates between 0.71 and 0.85, with a multi-year average of 0.76, the maximum value in 2001 (0.85) and the minimum value in 2016 and 2018 (0.71). In 2001, the highest CWSI values are due to less rainfall, weaker actual evapotranspiration and stronger potential evapotranspiration, which led to higher CWSI values and more severe drought. In 2016 and 2018, the lowest CWSI values were due to abundant rainfall, lower temperatures, weaker actual evapotranspiration and stronger potential evapotranspiration, which led to lower CWSI values and less severe drought [
34,
35].
This study builds on previous research and identifies a turning point interval when the cumulative anomaly value is considered stable, i.e., when the trend change does not pass a significance test with p < 0.05. From the cumulative distance level values of CWSI during 2001–2020, it can be observed that the cumulative distance level values of CWSI show a significant increasing trend from 2001 to 2011, and start to decrease after the cumulative distance level reaches the highest value in 2011. This indicates that 2011 was a turning point from drought to wet conditions in the study area.
3.4. Spatial Variation Characteristics of Drought
Figure 7 displays the spatial distribution of the annual average CWSI and its corresponding drought level in Shanxi Province. The average CWSI value for many years is between 0.71 and 0.85, and there is a noticeable spatial heterogeneity. The CWSI shows that the northwest is larger than the southeast, which means that the drought in the northwest is relatively severe, while the drought in the southeast is relatively mild. Multiple urban areas, including Datong City, Shuozhou City, Xinzhou City, and Taiyuan City have high CWSI values, indicating that drought is severe in these areas. In contrast, Jincheng City, Changzhi City, and other cities have lower CWSI values, indicating slight drought conditions. According to the drought grade map, Shanxi Province as a whole presents moderate drought, with severe drought regions mainly concentrated in the west of Shanxi Province, namely, Shuozhou City, Xinzhou City, and Luliang City. Moderate drought mainly concentrates in the southeast of Shanxi Province, namely, Jinzhong City and Changzhi City; it rarely distributes in drought-free areas. Mild drought accounts for 12% of the total area; moderate drought accounts for 62% of the total area; severe drought accounts for 25% of the whole area. In a comprehensive analysis, the percentages of the area occupied by drought levels in the study area in descending order: moderate drought > severe drought > mild drought > no drought.
According to the statistical interannual variation of the average annual Crop Water Stress Index in each city of Shanxi Province(
Figure 8), it can be observed that fluctuations in 11 cities are not too significant, and the overall trend of each city is consistent with that of the province. The average value of CWSI in each city in the past 20 years is ranked from highest to lowest as follows: Shuozhou City (0.811), Datong City (0.793), Taiyuan City (0.776), Luliang City (0.774), Xinzhou City (0.772), Jinzhong City (0.755), Yangquan City (0.753), Linfen City (0.751), Yuncheng City (0.745), Changzhi City (0.742), and Jincheng City (0.722). Shuozhou City has the largest average CWSI of 0.811 over the past 20 years, indicating severe drought conditions. Jincheng City has the smallest average crop water deficit index at 0.722, indicating a relatively lower risk of drought.. The CWSI in Shuozhou City fluctuates between 0.72 and 0.82, with a multi-year average of 0.811, which is a severe drought; the rest of the urban areas, Datong City and Taiyuan City, have a multi-year average CWSI of less than 0.81, which is a moderate drought. The high CWSI in Shuozhou, Datong, and Taiyuan is mainly due to low precipitation and high evaporation, resulting in a relatively high risk of drought.
3.5. Drought Change Characteristics of Different Land Use Types
Different land use types will directly affect the growth of vegetation, as well as the change in evapotranspiration. Starting from different land use types, the characteristics of drought change are analyzed.
The interannual variation characteristics of drought conditions in different land use types in Shanxi Province from 2001 to 2020 are shown in
Figure 9. In terms of interannual variation in annual average CWSI, the annual average CWSI for each land use type is, in descending order, buildings > unused land > farmland > grassland > forest. The CWSI of buildings fluctuates between 0.76 and 0.86, with severe drought in most years; the CWSI of other land fluctuates between 0.76 and 0.86, with moderate drought in most years; the CWSI of farmland fluctuates between 0.72 and 0.86, with moderate drought in most years; the CWSI of grassland fluctuates from 0.72 to 0.86, and most years it shows moderate drought; and the CWSI of the forest fluctuates between 0.72 and 0.86, with moderate drought in most years. Surface drought is mainly related to a number of factors, such as land cover type, geographical location, and climatic precipitation. The vegetation cover on building sites is generally low, and the risk of drought is high due to high temperatures and rapid water loss caused by the heat island effect. Conversely, forests are less at risk of drought, as they are generally located at higher altitudes, have abundant precipitation and a better ability to hold water, and their actual evapotranspiration is higher, making them relatively more resistant to drought. Most of the farmland is artificially vegetated and cultivated with crops such as rice, wheat, maize, and oilseed rape. The risk of drought on cultivated land is high because the harvesting of crops causes the annual mean ET to become smaller, resulting in larger CWSI values.
3.6. Temporal and Spatial Evolution of Drought in Shanxi Province
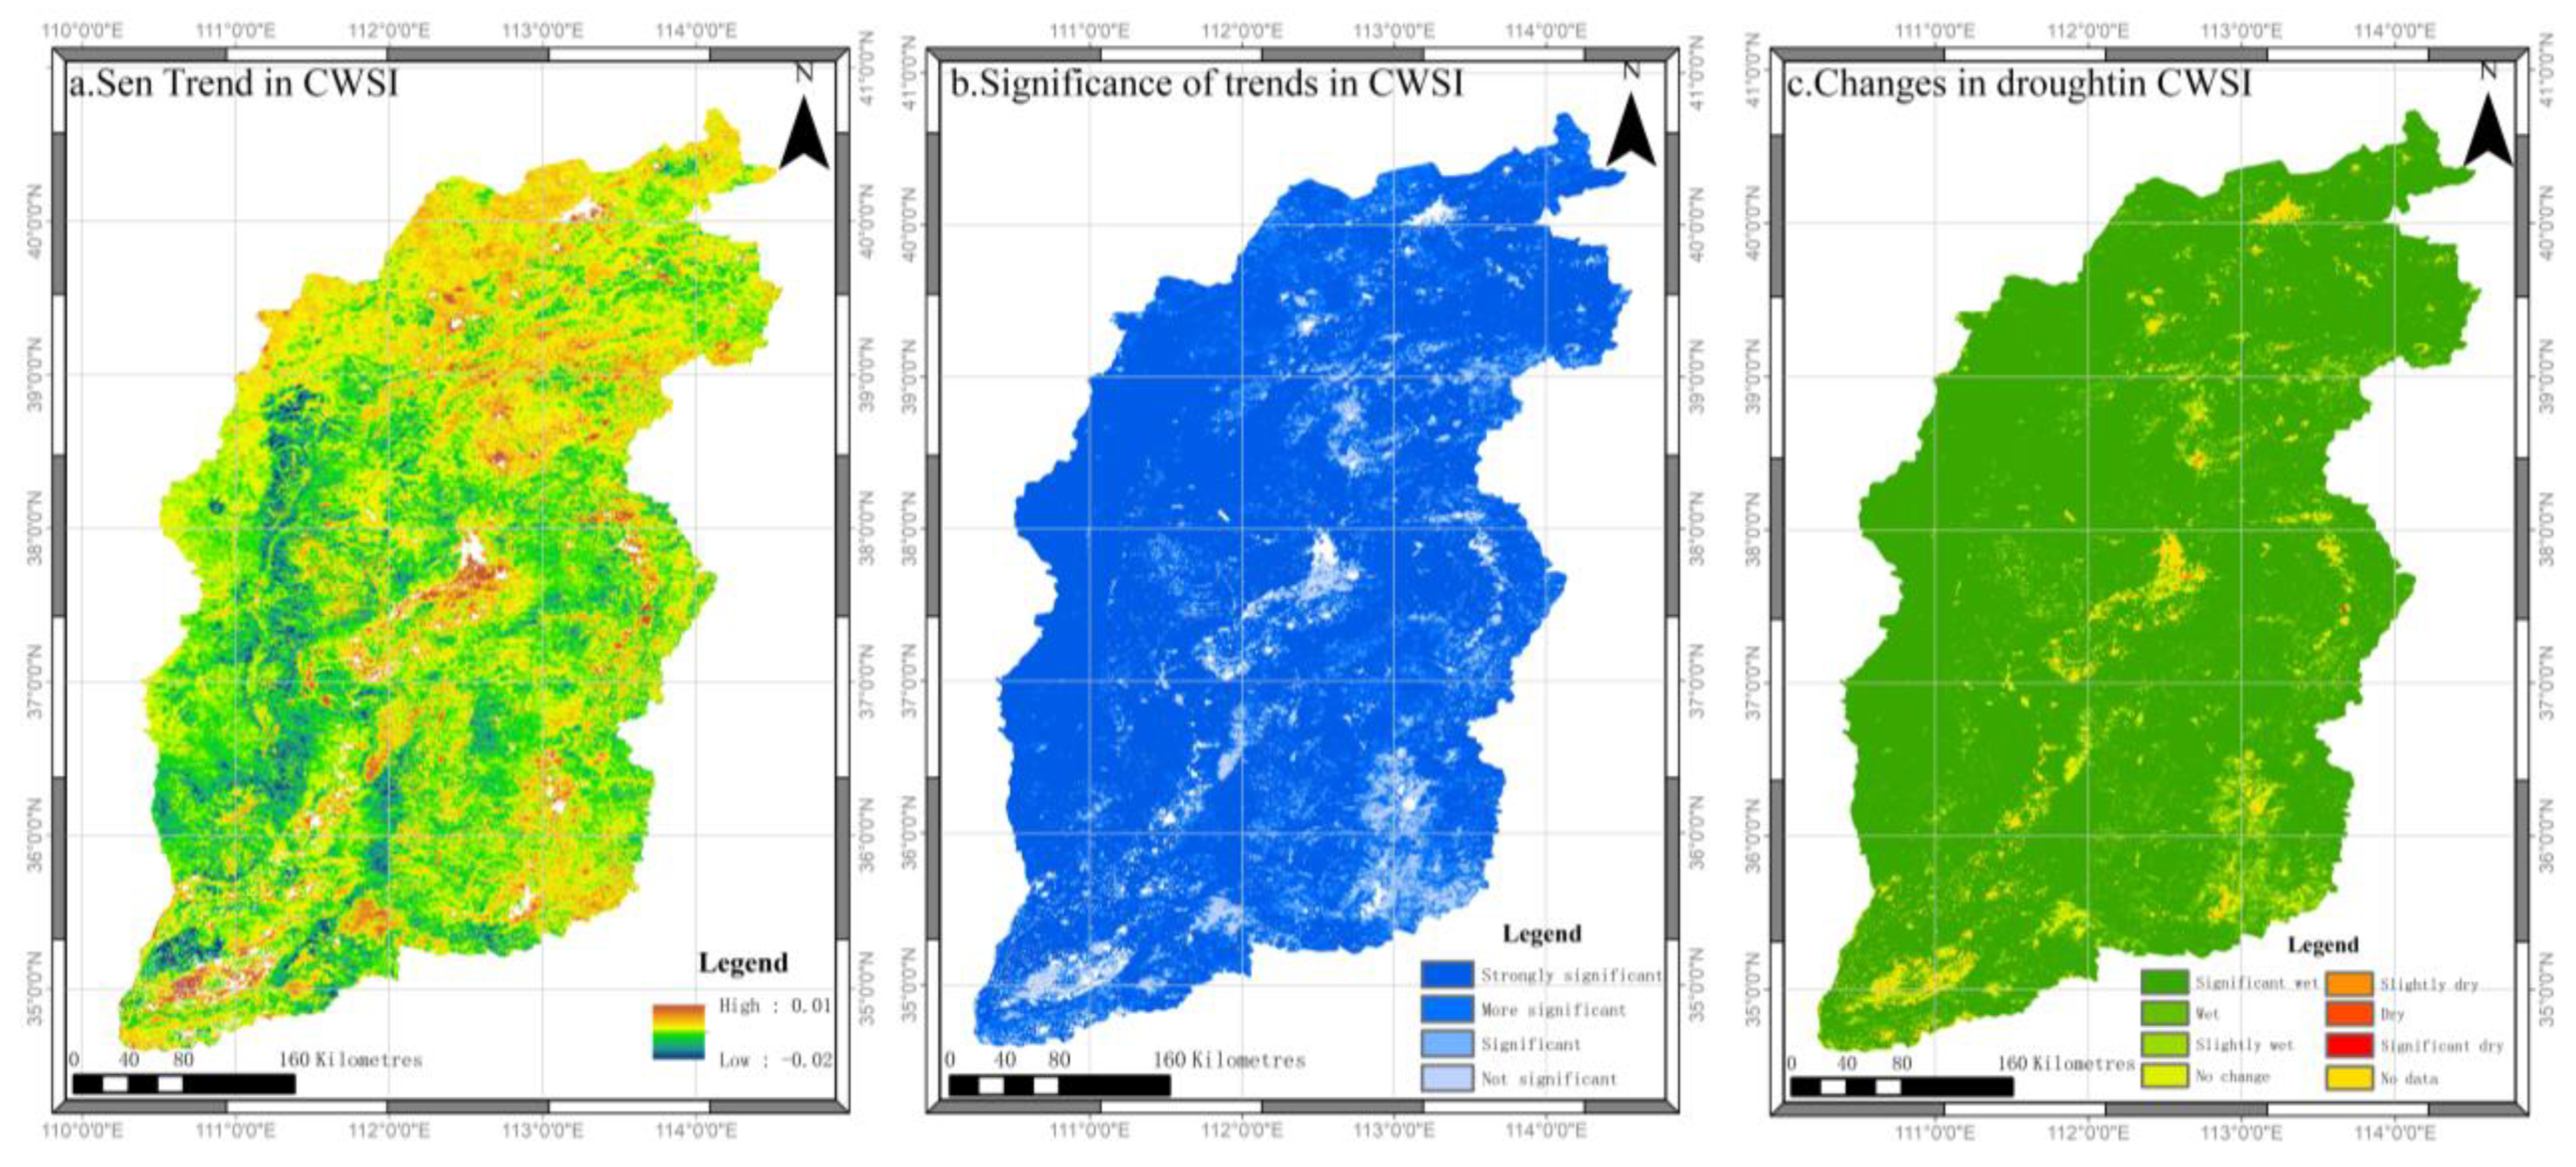
Sen slope estimates are used to calculate trend values and are usually used in con- junction with MK non-parametric test. In this study, the spatiotemporal change analysis method combining the Sen trend and the MK test is used to calculate the rate of change of Shanxi Province from 2001 to 2020 image by image; the slope of change image values greater than 0 indicated an increasing trend of the element, and less than 0 showed a decreasing trend. The spatial trends of CWSI in Shanxi Province and the spatial distribution of its significance are obtained as shown below (
Figure 10a,b). Then, according to
Table 4, the Sen trend analysis and MK test results are overlayed to obtain a detailed drought change map in Shanxi Province (
Figure 10c).
From the figure, it can be seen that the change rate of CWSI is between −0.02 and 0.01. During the study period, the change rate of CWSI is mostly negative, indicating a decreasing trend in drought, and the overall spatial distribution shows that the drought alleviation degree in the south is greater than that in the north, while the drought in the north is severe. It is evident from the figure that about 87% of the total images are significantly wetted, while approximately 6% of the total images are wetted. Overall, the trend of wetter images accounts for around 94% of the total images, while the trend of drier images accounts for only about 0.1% of the total images. Therefore, a comprehensive analysis of the data suggests that the drought trend in the study area is generally becoming wetter, indicating that the overall drought condition in Shanxi Province has been continuously improving from 2001 to 2020, and the degree of drought in most areas has been alleviated.
4. Discussion
In recent years, several studies have investigated the spatiotemporal characteristics of drought in Shanxi Province using long-term meteorological observation data. However, the accuracy of these studies is affected by the limited number of observation stations, and their uneven distribution across the province. To overcome this limitation, the research uses MODIS data as the basis for drought research. MODIS data has a better temporal and spatial resolution [
36] and is less affected by weather, making it widely used for calculating drought indices [
37,
38]. The research results indicate that CWSI is more suitable for drought monitoring in the study area, followed by VSWI. The MOD16 evapotranspiration data used by CWSI is derived from the Mu [
39] Improved algorithm. The CWSI algorithm takes the transpiration of plants as the main pathway for water and energy exchange between plants and the environment. Then, the transpiration of plants is compared with the temperature and humidity of the surrounding environment to calculate the corresponding saturation vapor pressure of crop surface transpiration, which is used to obtain the CWSI index. CWSI can be used for real-time monitoring of crop water status, and to promptly detect and diagnose the degree of water stress that crops are subjected to, in order to take corresponding irrigation measures. CWSI can also combine historical data and meteorological forecast data for drought prediction to prevent and respond to drought risks in advance. CWSI can accurately detect the degree of crop water stress, provide highly accurate information, better describe soil moisture information, and its results are very easy to interpret and understand. Therefore, CWSI has a greater advantage in regional drought monitoring. TVDI evaluates the degree of soil drought using temperature and vegetation information. Although TVDI has some advantages in drought monitoring, its application is susceptible to weather conditions. It can only assess the degree of surface soil drought and cannot evaluate water evaporation. Therefore, it cannot reflect the water content inside the soil and crops very well.
According to the research results, the long-term average of CWSI is 0.76, and most areas in the region are considered arid. This is in good agreement with the research results of scholars such as Ma Zice and Li Lihong, once again verifying the applicability of CWSI in the study area. The drought is more severe in the northwestern part of the study area. Due to the combined effects of precipitation, temperature, and other factors [
40], CWSI in Shuozhou City, located in the northwest direction, fluctuates between 0.72 and 0.82, with a long-term average of 0.811, which belongs to the severe drought category. The drought is relatively mild in the southeastern part of the study area. The southeastern part has generally lower elevations, and the drought intensity in these areas is relatively low. Overall, the monitoring results of CWSI indicate that the spatial and temporal evolution trend of drought in the study area is generally improving. This is mainly due to the fact that the Shanxi provincial government has taken a series of measures, such as building reservoirs, diverting water, and implementing soil and water conservation to increase the water resources in the region and improve the ecological environment.
In recent years, frequent droughts have occurred in Shanxi Province, causing serious economic and social impacts and affecting people’s daily lives. Through scientific research, we can improve our understanding of drought phenomena and provide scientific basis for drought prevention and management in Shanxi Province. Research results can help relevant departments in Shanxi Province grasp the patterns of recent drought occurrences, develop more scientific and reasonable drought defense mechanisms, and adopt effective drought response measures. At the same time, research results can also provide important scientific support for agricultural production and water resources management in Shanxi Province. In summary, scientific research can provide important support for drought prevention and management, agricultural production, and water resources management in Shanxi Province, and contribute to its economic and social development.
This study constructed three drought indices and conducted a correlation analysis with the Palmer Drought Severity Index to select the most suitable drought index for analyzing the characteristics of drought changes in Shanxi Province. The study used multi-source remote sensing data for drought monitoring and simulation research, and although the overall monitoring effect was good, there were still some limitations in this study. Only considering ET and PET has certain limitations, and drought is an extremely complex natural phenomenon. Therefore, it is recommended to further consider the impact of factors such as vegetation phenology changes, temperature, precipitation, and human activities on drought.
5. Conclusions
This article calculates three drought indices based on ET, PET, NDVI, and LST data, respectively. The calculated results are correlated with the Palmer Drought Severity Index and validated with typical drought events in Shanxi Province to screen for a more suitable drought index for the study area, the CWSI. On this basis, the distribution of drought in Shanxi Province in the past 20 years is inverted, and the spatiotemporal variation characteristics of drought are analyzed. The following conclusions are drawn:
(1) The study has found that among the three drought indices (CWSI, VSWI, and TVDI) studied, CWSI is more effective in reflecting drought conditions in Shanxi Province. This conclusion is based on the comparison of the relationship between these indices and the sc-PDSI. The study has shown that the correlation between CWSI and sc-PDSI is stronger than that of the other two indices, indicating that CWSI is more closely related to the actual drought conditions in the study area. Therefore, the CWSI is a more suitable index for monitoring and assessing drought in Shanxi Province.
(2) The temporal variation of drought in the study area: From 2001 to 2020, the average value of CWSI varied between 0.71 and 0.85, with an overall 20-year average of 0.76. The highest value was recorded in 2001 at 0.85, while the lowest values were observed in 2016 and 2018 at 0.71. The year 2011 was the turning point where the drought conditions started to shift towards wetter conditions.
(3) Spatial distribution pattern of drought in the study area: From 2001 to 2020, the overall drought in Shanxi province presented a “north dry and south wet” pattern, with significant spatial variability. The majority of the province was located in drought-prone areas, with the largest area experiencing moderate drought. In general, the northwest region was slightly more severe, specifically in the western areas of Shuozhou, Xinzhou, and Luliang. Moderate drought was mainly concentrated in the southeast of Shanxi province, specifically in Jinzhong and Changzhi. Areas without drought were rare. The areas of each drought level in descending order were moderate drought, severe drought, mild drought, and no drought.
(4) Land use types have a significant impact on the growth and distribution of vegetation, as well as on the changes in evapotranspiration in a region. In general, the severity of drought is closely related to land use type, with different land use types exhibiting different levels of vulnerability to drought. The research results indicate that in Shanxi Province, the drought severity of different land use types is in the following order: buildings, unused land, farmland, grassland, and forest.
(5) The overall trend of drought in the study area is improving, with most of the area experiencing relief from drought. Overall, the trend towards becoming wetter accounts for about 94% of the total area, while the trend towards becoming drier accounts for about 0.1% of the total area.


