Abstract
In 2019–2020, an array weather radar (AWR) network consisting of seven X-band phased-array radars (PARs), with a detection spatial resolution of 30 m and a temporal resolution of 30 s, was built in the city of Foshan in China’s Guangdong Province. The detection time deviation in the same space is within 5 s. Through variational data assimilation, the three-dimensional wind field inside the storm can be obtained. This study selected instances of hail, thunderstorms, strong winds, and short-duration heavy precipitation in 2020 to conduct a detailed analysis. The results show the following: (1) The fine detection ability enables phased-array radars to detect the complete evolution process of convective storms, including development, strengthening, and weakening, providing a useful reference for judging the future variation trends of convective storms. (2) Through evolutionary analysis of the three-dimensional wind field, the dynamic mechanisms of storm strengthening and weakening could be obtained, which could serve as a reference to predict the development of storms. The gust wind index and convection index calculated based on the three-dimensional wind field could provide advanced warning for nowcasting. When the gust wind index was greater than 263, the probability of gale-force wind (above 17.0 m/s) was determined to be high. Moreover, the warning could be provided 10–20 min in advance. A convection index greater than 35 and the presence of concentrated contour lines were found to be conducive to the strengthening and formation of a convection, and the warning could be provided 20 min in advance. These results show that the application of PAR can provide important technical support for nowcasting severe convective weather.
1. Introduction
The weather radar is the most effective means of monitoring and giving early warning of sudden hazardous weather events. Over the past 60 years, weather radar monitoring networks have advanced significantly, and have played a vital role in monitoring and warning of hazardous weather events, yielding significant social, economic, and ecological benefits. The development of weather radar technology can be broadly divided into four stages: analogue weather radar (1960s–1980s), digital weather radar (1970s–1980s), the new generation of Doppler weather radar (1990s), and phased-array weather radar (2000s). China has been transitioning from Doppler weather radar to phased-array weather radar. Doppler weather radar can effectively monitor regional hazardous weather events such as typhoons and rainstorms. However, its ability to monitor small- and medium-scale severe convective weather events such as tornadoes, hail, and short-term heavy precipitation remains somewhat limited due to factors such as radar resolution, station network density, technical systems, and business observation mode [1,2]. With its advantage of high spatiotemporal resolution, phased-array weather radar has been applied in the United States and other countries since 2000 [1,2,3,4]. In 2007–2008, the United States conducted field tests on tornadoes, super convection cells, and squall lines using the one-dimensional phased-array X-band weather radar (MWR-05XP). The tests indicated that the scanning speed of the phased-array radar was far higher than that of the new-generation Doppler weather radar, with comparable data quality. The two-dimensional phased-array radar was found to detect rapidly changing weather systems more accurately than the Doppler weather radar. China has been transitioning from Doppler weather radar to phased-array weather radar, with relevant research and development on phased-array weather radar technology having been carried out in recent years [4,5,6,7]. In 2007, the Chinese Academy of Meteorological Sciences collaborated with the 14th Institute of China Electronics Technology Group Corporation to transform military phased-array radar and develop the first domestic S-band one-dimensional active phased-array weather radar. In 2009, the Chinese Academy of Meteorological Sciences and Sun Create Electronics Co., Ltd. collaborated to develop a vehicle-mounted X-band phased-array weather radar. In 2017, the Meteorological Observation Centre of China Meteorological Administration and Hunan Eastone Washon Technology Co., Ltd. jointly used three X-band phased-array receiving and transmitting subarrays to form a networked weather radar, and conducted observation tests at Changsha Airport [8,9,10]. In 2015, Naruida Technology Co., Ltd. (Zhuhai, China) developed a dual-polarization X-band phased-array weather radar, and began observation tests in Guangzhou in May 2018 [11]. In summary, China’s phased-array radar has entered the operational application phase.
Liu Liping, Yu Minghui, Cheng Yuanhui, and others [12,13,14,15] conducted an application analysis of phased-array radar in comparison with Doppler weather radar. They pointed out that the spatiotemporal resolution of the detected data with phased-array weather radar is far higher than that with a mechanical scanning radar. Moreover, the fine observation mode data of X-band phased-array radar reveal the triggering, development, and evolution process of convection, offering new detection facts that are not available with new-generation Doppler weather radar and C-band dual-polarization radar. In areas covered by dual-polarization (or multi-Doppler) weather radars, three-dimensional wind fields can be obtained through the three-dimensional variational data assimilation (3DVAR) method. In 2009, Shapiro et al. [16] introduced the Taylor frozen turbulence hypothesis into the 3DVAR inversion algorithm, which works well in small- and medium-scale weather systems with moderate intensity and slow movement. In 2011, Potvin et al. [17] added the vertical vorticity equation as a constraint in the optimisation algorithm to significantly improve the accuracy of vertical velocity retrieval through advection correction and internal evolution. Furthermore, they also found that the shorter the radar scanning times, the better the retrieval results. In 2012, Potvin et al. [18] compared the performance difference between the 3DVAR retrieval technology and previous wind field retrieval technology [16] using simulated and real data, and pointed out that 3DVAR performed well in the retrieval of high-altitude winds. From 2019 to 2020, Foshan City of Guangdong Province completed the construction of seven X-band phased-array weather radars with a spacing of 25–30 km between radars, providing the best observation field for the retrieval of three-dimensional wind fields. During the flood season of 2020, these radars were used to observe several large-scale severe convective weather events in Foshan City, yielding optimal results.
The achievements of the meteorological departments in studying phased-array radar as the future of networked radar can be summarized in two points. (1) Phased-array weather radar offers a significant advantage in temporal resolution compared with WSR-88D, and is vital for expanding the national radar network to capture small-scale severe weather events and improve disaster prevention and early-warning capabilities. (2) The application of phased-array weather radar in the national weather radar network is technically and operationally feasible. Given these two points, the construction and application of phased-array radar is expected to become a research trend for networked weather radar in China.
This paper proceeds as follows. Section 2 gives basic information on the PAR network in Foshan, Guangdong Province. Section 3 introduces the three-dimensional wind retrieval algorithm and tests its reliability. Section 3 also defines the gust wind index and convection index based on the calculated three-dimensional wind field and elaborates on their physical meaning. Section 4 provides analyses of selected hail, thunderstorms, gales, and short-term heavy precipitation events that occurred within the effective detection range of the PAR in 2020 for radar detection characteristics, the evolution of three-dimensional winds, and the application of the two indices. Finally, this paper concludes by summarising the advantages of using fine PAWR detection and the three-dimensional wind field for the detection of severe convection, aiming to provide a reference for applying PAR to severe convection detection and to guide nowcasting and early-warning services.
2. The PAR Network in Foshan
Figure 1 shows the phased-array weather radar network in Foshan City, Guangdong Province. The network has a radar interval of 25–30 km and an equilateral triangle layout. There are five equilateral triangles. Subarrays are deployed at the vertices of the triangles. The central area of Foshan, which is prone to strong convection, is covered jointly by two or more radars, with a temporal resolution of 30 s and a range resolution of 30 m. To reduce the time difference of data detection, the entrance angle-based grouping synchronous scanning method is used. In the area covered by three radars, the maximum time difference of data detection is approximately one-sixth the body scan time. The maximum detection time deviation is less than 5 s in the same spatial location in the area. The layout and scanning method of phased-array radars ensure that more accurate three-dimensional (3D) wind field detection data can be jointly acquired in an area covered by two or more radars. This may permit 3D wind field studies.
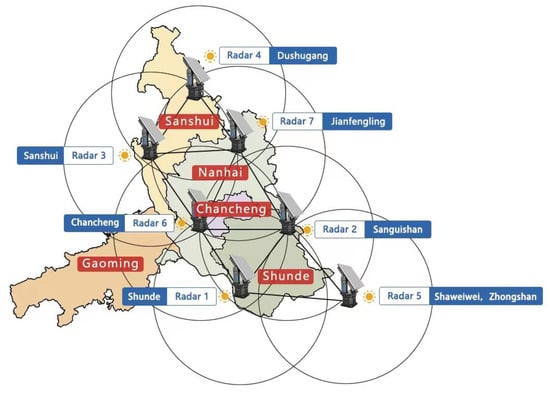
Figure 1.
Layout of the phased-array weather radar (PAWR) system in Foshan. The circles are the maximum detection radii of the radars (30 km).
Table 1 shows the main technical indicators of the PAR in Foshan. The radars use digital multibeam, software-based signal processing and other technologies and have high resolution, a fast scanning speed, and a flexible detection mode, and they exhibit coordination between multiple radars. The frequency is 9.3–9.5 GHz, the transmit power is ≥320 W, the spatial resolution is 30 m, and the detection distance is up to 60 km. When the wide-transmission and narrow-receiving mode is used, the pitch angle coverage is 0–72°, which can better observe medium- and small-scale severe convection. Multiple PARs can be synchronised to form an array radar. The maximum detection time deviation at the same spatial position is less than 5 s, and the three-dimensional wind of the storm is obtained through 3DVAR in the area covered by two or more radars. The spatial resolution of the products provided by the AWR is 100 m × 100 m × 100 m, and the maximum height is 20 km. With distributed multitask parallel processing, the product update frequency is 30 s. The spatial resolution of the retrieved wind data is 200 m × 200 m × 200 m, with a maximum height of 15 km and a temporal resolution of 2 min.

Table 1.
Main technical indicators of Foshan phased-array weather radar.
3. Three-Dimensional Wind Algorithm and Testing
3.1. Three-Dimensional Wind Retrieval Algorithm
For three-dimensional wind retrieval, the 3DVAR algorithm proposed by Shapiro et al. [16] and Potvin et al. was used [17,18]. This method is based on the radial velocities of two or more radars and is constrained by the atmospheric physical properties of the fluid field in the covered area. The three initial components of wind, , are descended from 0 using the conjugate gradient method to obtain the optimal value of , which satisfies the given conditions. The algorithm improves the accuracy of the wind. In particular, the vertical velocity is greatly improved compared with that shown with traditional methods. The cost function is defined as follows:
where is the observed radial velocity constraint, is the mass conservation constraint, and is the spatial smoothing constraint. The calculation of each constraint is the same as that based on Li et al. [10] and Potvin et al. [17]. The weight of each equation is assigned based on error estimation. Currently, the weights used in PAR operations in Foshan are as follows: Co = 1 for the observation constraint; Cm = 1500 for the mass conservation constraint; and Cs = 0.01 for the spatial smoothing constraint.
A wind profiler radar is a tool for wind detection. To verify the effect of three-dimensional wind retrieval, in this study, two wind profile radars located within the effective detection range of phased-array radar were selected to test their detection data. The wind profile radars have a horizontal wind speed resolution of 0.1 m/s, horizontal wind direction resolution of 0.1°, and operating frequency of 1330 MHz. The time period of 20:00–22:30 (UTC+8, similarly hereafter) on 21 May 2020 was used for validity checking (Figure 2). The meteorological process transitioned from convective precipitation to stratiform precipitation, and the rain cloud passed through two wind profiler radar stations in Sanshui District and Shunde District of Foshan. It can be seen from Figure 2a–d that the speed and direction of the horizontal wind retrieved at different heights in different stages of precipitation were consistent with those detected by the wind profiler radar and the differences were reasonable. Figure 2e shows that the trend in precipitation changes over 5 min intervals at the automatic weather stations near the wind profiler stations. Figure 2f shows the wind speed differences between the horizontal wind speed detected by the wind profiler radar and the retrieved horizontal wind speed. The wind speed differences at 1–3 km were mostly within 3 m/s. For precipitation changes greater than 3 mm, the differences were large, especially above 3 km, when they were greater than 5 m/s. It can be seen that heavier precipitation results in a larger difference between the retrieved and detected wind speeds. This is consistent with conclusions from previous research, which found that during heavy precipitation, wind profiler radar detection can be subject to interference by various echo signals such as rainfall, clouds, and ice crystal particles, resulting in a decrease in measurement accuracy, thereby generating results that vary significantly from the retrieved wind speed [19,20,21]. Therefore, it is reasonable and credible to use the three-dimensional wind obtained using 3DVAR for weather analysis.
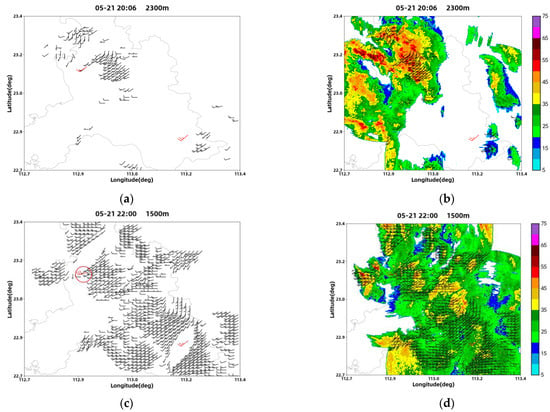
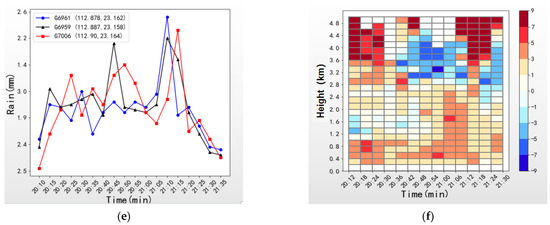
Figure 2.
Comparison of retrieved wind (black wind barbs) and wind profiler radar wind (red wind barbs): (a) At 20:06 on 21 May 2020 at a height of 2300 m; (b) At 20:06 on 21 May 2020 at a height of 2300 m superimposed on reflectivity factor intensity; (c) At 22:00 on 21 May 2020 at a height of 1500 m; (d) At 22:00 on 21 May 2020 at a height of 1500 m superimposed on reflectivity factor intensity; (e) Rainfall evolution of automatic weather station near the wind profiler stations at 20:10–21:35; (f) The difference between the wind speed detected by the wind profiler radar and the retrieved wind speed at 20:10–21:35; units: m/s.
3.2. Gust Wind Index
Strong ground-level winds in thunderstorms are often due to mid-level airflow sinking to the ground. Based on the three-dimensional wind field obtained by the AWR, the GUST_WIND_INDEX (GWI) is defined as the wind speed from the ground through an altitude of 6 km, in which the downdraft flow can create a severe gust at the surface. Therefore, vertical integration of the wind speed corresponding to the downward flow from 0 to 6 km was conducted to obtain a GWI product with a spatial resolution of 200 m × 200 m and a temporal resolution of 2 min. A higher GWI indicates a greater possibility of strong winds in the corresponding area. The calculation formula is as follows:
where is the vertical velocity of the downward flow (absolute value); n = 0, N = 6 indicates that the integration is from ground level to 6 km above ground.
represents the magnitude of full wind speed.
3.3. Convection Index
Based on the three-dimensional wind field obtained by the AWR, the CONVECTION_INDEX (CI) is defined as the vertical integration of the vertical vorticity of the upward flow within a height of 0–3 km. A high CI can appear in a mature strong convective cell, indicating that the convective cell will maintain its strength or strengthen; it can also appear in front of or to the right of the convective cell, indicating that there is a high possibility that a convection will be formed or will strengthen in the region. The calculation formula is as follows:
where is the positive vertical velocity of the upward flow; n = 0, N = 3 indicates that the integration is from ground level to 3 km above ground level.
4. Radar Detection Characteristics of Severe Convection Weather
4.1. Hail
4.1.1. Weather Conditions
Due to a high-altitude trough, a shear line, and a cold front, there was heavy rain in Foshan from 15:00 to 19:00 on 27 March 2020 and hail for approximately 10 min in Huangqi, Shaxi, and Henggang in Dali Town, Nanhai District, Foshan. The maximum diameter of the hail was 2 cm. During the hail, the 0 °C and −20 °C altitudes were 3.8 km and 7.1 km, respectively.
4.1.2. Analysis of PAWR Detection
Analysing the composite reflectivity retrieval from the AWR, it can be seen that at approximately 17:00 (Beijing time), a strong thunderstorm cloud cluster developed in Xinan Subdistrict of Sanshui District and moved east-southeast, which successively affected the towns and subdistricts of Danzao, Shishan, and Dali in Nanhai District. The thunderstorm cloud reflectivity factor was 45–50 dBZ, and the development height was 6–7 km, which mainly brought short-duration heavy precipitation and gales of gale force (above 17.0 m/s) (the same below). The thunderstorm cloud developed rapidly after moving to Dali Town at 17:50. Owing to the scanning data of the PAR, which quickly updates every 30 s and has full vertical coverage of 0–90°, the complete development process of the hailstorm was clearly detected. Figure 3 shows the reflectivity factor and the zonal profile of the retrieved wind along the storm centre (23.07° N). It can be seen that the reflectivity increased to 55 dBZ within 10 min, from 17:50 to 18:00. The echo top was high, above 10 km, and the 50 dBZ echo expanded to a height above the −20 °C layer (7.1 km). The vertical structure of the storm showed a bounded weak echo region (BWER) at a height of 2–4 km, and a strong echo overhang at a height of 4–8 km. From an analysis of the three-dimensional wind retrieval, it can be seen that as the hail cloud developed and matured, the strong echo core was accompanied by a strong upward flow. It can be seen that during the hail, the radar detection showed typical hail characteristics, including high-hanging strong echoes, a reflectivity of 50 dB vertically extending to above the −20℃ isotherm, a low-level BWER and mid- to high-level echo overhang, and strong gradients in low-level reflectivity.
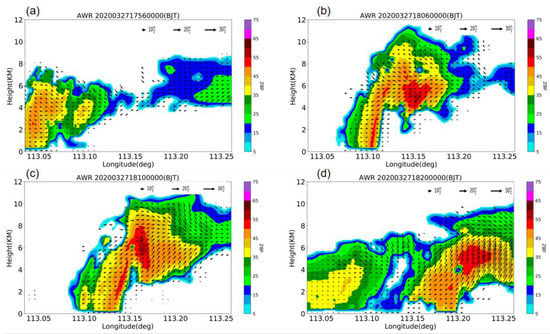
Figure 3.
Vertical structure of the hail cloud detected by phased-array radar (PAR) at 17:56–18:20 on 27 March 2020 (section along 23.07° N) ((a) 17:56, (b) 18:06, (c) 18:10, and (d) 18:20 (Beijing time)).
The hail detection algorithm of Yu et al. [22] was used to calculate the vertical integrated liquid (VIL), the probability of severe hail (POSH), and the maximum estimated hail size (MEHS) of the thunderstorm cloud. It can be seen from Figure 4 that the trends in VIL, POSH, and MEHS were very consistent, and the hail indices continued to increase for the 15 min before the occurrence of hail (17:45–18:00). When hail occurred at 18:00, the POSH was greater than 50%, the MEHS was 3 cm, and the VIL was greater than 35 kg m−2. At 18:10, each index reached its peak, with a VIL close to 40 kg·m−2 and an MEHS of 3.0–3.5 cm. It can be seen that the peak times of the hail indices coincided with the time and size of the hail. When the hail ended, the indices dropped sharply. The hail cloud rapidly developed over 25 min, and then weakened within 10 min. The PAR detected the typical vertical structure, such as echo overhang of the hail cloud 2 min before the beginning of the hail, and the hail indices continued to increase 15 min before the hail occurred. The PAR detected the entire process of the strengthening and weakening of the convective storm. The continuous retrieval of the high time–frequency (30 s) hail indices during the three stages of the hail cloud could be used to detect the entire process of the rapid changes in the hail cloud. The characteristics of the vertical section of the convective storm were combined with the hail indices and VIL evolution to comprehensively evaluate the probability of hail occurrence; this made it easier to distinguish between ordinary storms and hailstorms, and thus, they could be used by forecasters as early-warning indicators.
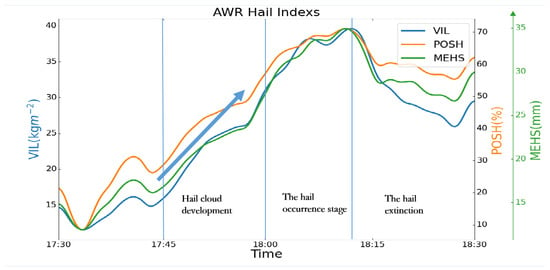
Figure 4.
Vertical integrated liquid (VIL), probability of severe hail (POSH), and maximum estimated hail size (MEHS) detected by phased-array radar (PAR) at 17:30–18:30 on 27 March 2020 (The arrow indicates the rising development of hail index).
4.2. Thunderstorm and Gale
Due to the southwest airflow, shear line, and weak cold air, from 14:00 to 15:00 on 10 May 2020, Chancheng District and Shunde District of Foshan from northwest to southeast had strong thunderstorms appearing, and gale-force wind As seen from the evolution of the convective storm detected by the PAR, this thunderstorm-and-gale process had a high development altitude, with the echo top close to 18 km, and the 55 dBZ echo expanded to 16 km. The storm moved rapidly, reaching 50 km/h. In the following sections, the dynamic mechanisms of the GWI and CI are analysed based on AWR.
4.2.1. Gust Wind Index Analysis
Figure 5 shows the live observation at the automatic weather station when short-duration heavy precipitation and a gale-force wind occurred in Shunde District, Foshan. The figure shows the 5 min precipitation levels (green dots) and the instantaneous (30 s) wind direction and speed. At 14:30 (Figure 5a), the heavy rainfall was mainly concentrated in Chancheng District, north of Shunde District; downstream of the heavy rainfall area, gale-force wind occurred in Shunde District. At 14:45 (Figure 5b), the main rainfall moved to Shunde District. With the heavy rainfall area as the centre, many gale-force wind appeared around the location. From the correspondence between rainfall retrieval and gale location data, it can be seen that the main reason for gale formation was the near-surface outflow caused by precipitation.
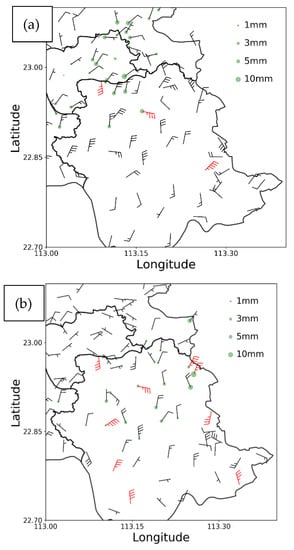
Figure 5.
Five-minute rainfall and instantaneous wind direction and speed at the ground-level automatic station at 14:30–14:50 on 10 May 2020 (red wind barbs indicate gale force above 17.0 m/s; a full-length barb indicates 4 m/s); (a) 14:30 (b) 14:45.
Figure 6 shows the evolution of the GWI superimposed on the evolution of gale-force wind over the next 20 min. From 14:00 to 14:10, the strong echo was still mainly in Chancheng District, north of Shunde District (Figure 6). As seen from Figure 6, the centre of the high GWI (≥263) was in the central and northern part of Shunde District, and the areas with gale-force and above-gale winds over the next 20 min were near the centre of high GWI areas or in high-gradient areas of the GWI. From 14:20 to 14:30, the high GWI areas moved from northwest to southeast with a severe convective echo, forming a high GWI area around the strong convective cell. Correspondingly, gale-force and above-gale winds occurred in the Shunde area in the next 20 min. It can be seen that the high GWI area spatially coincided with the locations of gales, indicating that the GWI based on the AWR was able to nowcast strong wind relatively well. A higher GWI indicates a higher possibility of gales, with warnings 10–20 min in advance.
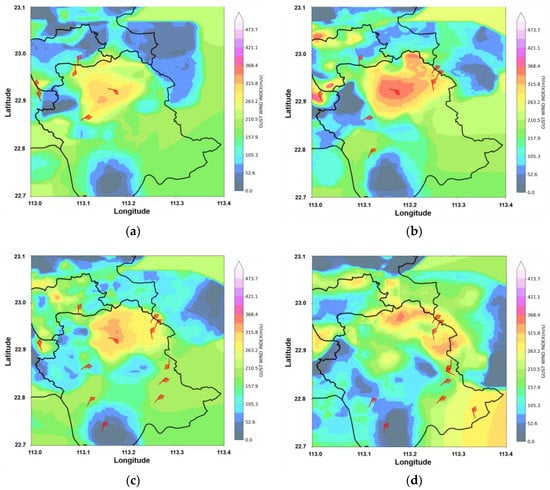
Figure 6.
Gust wind index (coloured) at 14:00–14:30 on 10 May 2020 superimposed on predicted gale force above 17.0 m/s over the next 20 min (red wind barbs) ((a) 14:00, (b) 14:10, (c) 14: 20, and (d) 14:30).
4.2.2. Convection Index Analysis
Figure 7 shows the evolution of composite reflectivity intensity and the CI during this severe convection process. The black dotted ellipse and the black solid ellipse provide a comparison of the development of convective storms at the same location 20 min apart. The areas with a high CI (≥35) or where the contour lines were concentrated were the areas where convection strengthened over the next 20 min, and the direction of concentrated contour lines was consistent with the development and strengthening of the convective storm. It can be seen that the CI could effectively predict the area where the convection would strengthen in the future, as much as 20 min in advance.
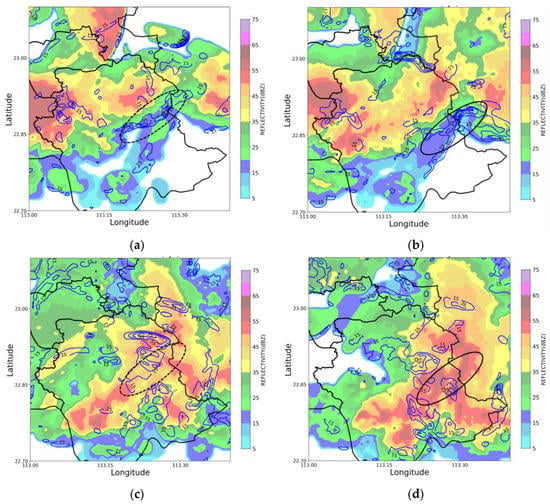
Figure 7.
Evolution of composite reflectivity (colour diagram, unit: dBZ) and convection index (contours, unit: 10−3·s) ((a) 14:36, (b) 14:42, (c) 14:56, and (d) 15:02). (Black dashed ellipses and black solid ellipses are the development of convection storms before and after 20min at the same position).
4.2.3. Dynamic Mechanism of Storm Evolution
To further study the dynamic mechanism of storm strengthening and the interaction between storms, a zonal section (22.9° N) was taken along the centre of the storm, as shown in Figure 8. It can be seen from Figure 9 that the left and right storms were connected in the wind field, as the outflow of the downward flow at the bottom of the storm on the right became the inflow of the storm on the left, forming a cycle where the storm on the right continuously provided energy to the one on the left. The storm on the left developed and strengthened and stimulated a new convection in the middle troposphere (at the altitude of the 0 °C layer). The new convection continued to gain energy from the storm on the left and continued to strengthen. At the same time, the storm on the left gradually weakened, creating a replacement process of old and new storms. This dynamic mechanism enables storms to continuously be replaced as they move forward so that the storm can spread downstream and strengthen.
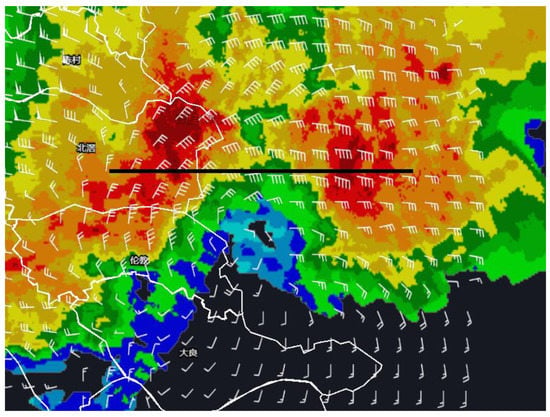
Figure 8.
Schematic diagram of the vertical profile of the storm interaction (along 22.9° N) (The wind rod is the wind retrieval by the AWR. The Chinese names in the figure are place names respectively: Wucun, Beijiao, Lunjiao and Daliang).
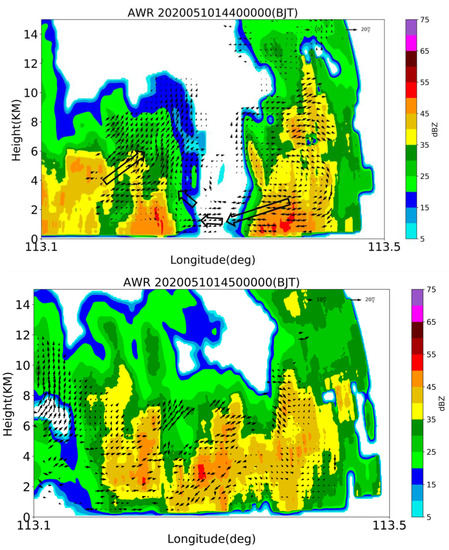
Figure 9.
Zonal profile of the reflectivity factor and vertical velocity along the centre of the storm at 14:40–14:50 on 10 May 2020 (The small solid arrow is the internal air flow of the storm inversion, and the large hollow arrow is the direction of the air flow).
4.3. Local Heavy Precipitation
Due to the influence of warm and humid airflow from the south, short-term heavy rain with rainfall intensity ≥ 18 mm occurred in Xinan Street of Sanshui District, Dali Town of Nanhai District, and Shishan Town in Foshan City from 16:30 to 17:30 on 4 September 2020. Local wind gusts of level 7 (15.5 m/s) occurred in some areas of Dali Town around 17:00. As shown in Figure 10a, there were three independent developing mesoscale convective systems (MCS): A, B, and C. The convective storms mainly developed and disappeared in situ and did not propagate significantly. The three developmental stages of the convective storms, namely the initiation, mature, and decay stages, were completed within 40 min. Taking convective storm B as an example, the period of 16:30–16:45 was the initiation stage of the storm (Figure 10b), which had a horizontal diameter of approximately 11 km and a vertical height of around 10 km. As can be observed from the vertical profile of the three-dimensional wind field, updrafts and downdrafts converged within the range of 2–5 km inside the MCS, and the thickness of the reflectivity factor core (≥55 dBZ) developed over approximately 6 km. The period of 16:45–17:00 was the mature stage of the storm (figure omitted), and the MCS storm scale further strengthened, with a vertical height exceeding 12 km. The period of 17:00–17:20 was the decay stage of the storm (Figure 10c). The reflectivity factor core of the MCS decreased significantly, and the storm intensity weakened rapidly. The convective storm had a high rainfall efficiency overall, with the intensity of convective storm B exceeding 20 mm within 15 min.
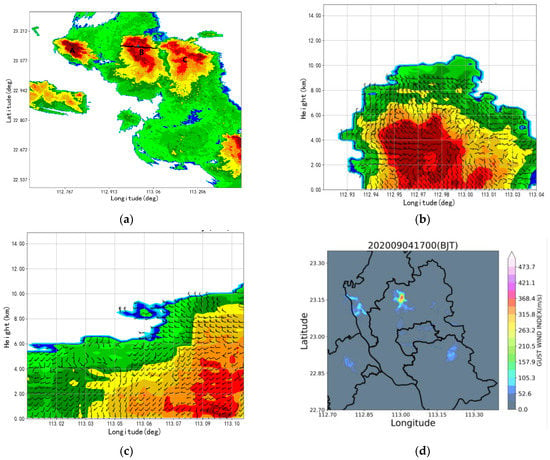
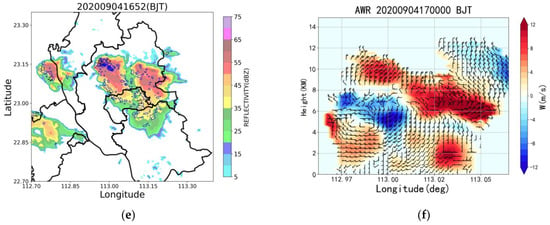
Figure 10.
The radar analysis data for 4 September 2020: (a) Reflectivity factor map at 17:00; (b) Vertical profile of the reflectivity factor of the MCS (B) development stage at 16:50 along the black line shown in (a); (c) Vertical profiles of the reflector factor and the horizontal wind field during the extinction phase at 17:20; (d) GUST_WIND_INDEX (GWI) at 17:00; (e) Reflectivity factor and convection index at 16:52; (f) Three-dimensional wind field and vertical velocity field of convective storm B at 17:00 (a full-length barb indicates 4 m/s).
4.3.1. Early-Warning Index Analysis
Figure 10d,e show the GWI and CI calculated based on the three-dimensional wind field. Figure 10d shows the GWI of three storms in the mature period (17:00). It can be seen that the GWI of A and C were relatively low (<150), which indicates a low probability of strong winds. The actual situation showed that only local rainstorms occurred from these two storms. For storm B, from 16:46 to 17:00 (Figure 10d), the GWI increased to above 263. The actual situation showed that there was a gale-force wind in Dali Water Conservancy at approximately 17:00, which means that the GWI was effective as an early warning. In terms of the CI (Figure 10c), it can be seen that for the three convection cells, the areas with a high CI and concentrated contour lines were located inside the storm body, which is different from the case described in Section 4.2.1, where the area with concentrated contour lines was located downstream of the storm movement. This is an indication that a severe convective storm would strengthen in situ. The CI was between 15 and 35 during the storm development and maturity stages; in the withering stage, the CI decreased significantly to below 15, and the area with concentrated contour lines disappeared.
4.3.2. Analysis of the Evolution Process of a Convective Storm
A vertical section of convective storm B was used to analyse its characteristics at different stages, as well as the dynamic mechanism of its evolution. The convective storm was in the rapid development stage at 16:30, and its interior was controlled by a strong upward flow, with an upward velocity greater than 12 m/s, and the velocity increased with altitude. At 17:00 (Figure 10f), the storm entered the maturity stage, in which upward and downward flows coexisted. During this stage, rainfall reached 8 mm in 5 min. As rainfall intensified, the drag effect of rainwater particles formed a strong downward flow, which then expanded vertically and horizontally. The storm was controlled by the downdraft, at which point precipitation expanded to the entire convective cloud. When the source of warm and humid air was cut off by the cold pool extending to the ground, the convection cell gradually withered. Through an analysis of the PAR three-dimensional wind field and early-warning indices, it can be seen that there is no dynamic mechanism of interaction or mutual transmission between individual local storms. The areas with high CI and concentrated contour lines are located inside the storm body, and the increase in the GWI could serve as an early warning for moderate-to-severe gales (above grade 7).
5. Case Test for Indices
Two brief periods of heavy rainfall, thunderstorms, and wind that occurred within the easy detection range of phased-array radars in 2021 were selected to test the effects of the related indices.
Figure 11 shows the evolution (including formation and disappearance) of a convective storm during a brief heavy rainfall (hourly rainfall 50 mm) that occurred in Foshan on 31 July 2021, as well as the early-warning effect of the convective index. The contour lines show the variation of the convective index at regular 10 min intervals from 17:30 to 18:00. The contour planes show the development of the convective storm in the next 10 min. In the development and maintenance stages (a and b), the high-value area of the convective index (>35) and the contour line dense zone coincide with the high-value area of the reflection factor in the next 10 min. In the disappearing stage (c and d), the convective index decreases overall, the contour line dense zone disappears, and there is no obvious high-value area. Hence, we can conclude that the convective index has a significant early-warning effect on the formation and disappearance of storms.
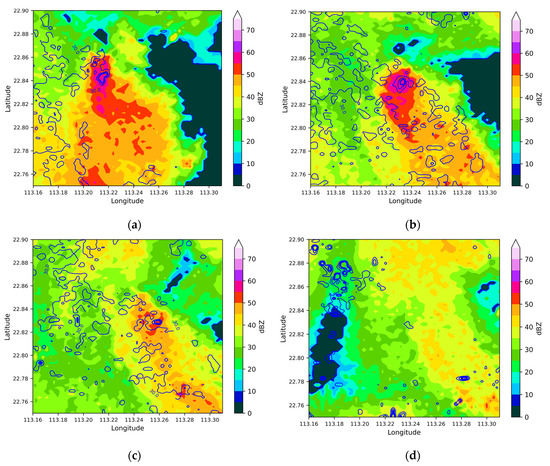
Figure 11.
Evolution of the convective index (contour line) ((a) 17:30, (b) 17:40, (c) 17:50, and (d) 18:00) and intensity of reflection factor in the next 10 min (choroplethic map) ((a) 17:40, (b) 17:50, (c) 18:00, and (d) 18:10).
Figure 12 shows the early-warning effect of the wind index in a windy process in Foshan City that occurred on 7 August 2021. The contour planes show the wind index at regular intervals of 10 min from 17:30 to 18:00. The wind shafts display the automatic observatory data in the next 10 min. During the transit of the wind, the storm followed the high-level steering wind to move westwards, and the area near the low-level strong convection formed a high-value area of the wind index. Evidently, the high values of the wind speed in the next 10 min observed by the automatic observatory highly coincided with the high-value area of the wind index.
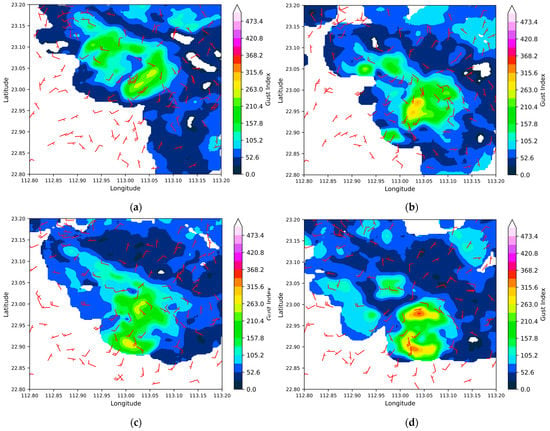
Figure 12.
Contrast effect of the wind index (choroplethic map) and automatic observatory wind vector (wind shaft) ((a) 17:40, (b) 17:50, (c) 18:00, and (d) 18:10).
6. Conclusions
After the establishment of the PAWR network at Foshan in China’s Guangdong Province in 2019–2020, multiple severe convective weather events that occurred in Foshan in 2020 were well detected. Based on the three-dimensional wind field obtained using the AWR, this paper has introduced a gust wind index and a convection index. Using selected instances of hail, thunderstorms, gales, and short-duration heavy precipitation, this study involves in-depth analysis of the structure of storm development and the evolving characteristics of the early-warning indices. The main conclusions are as follows.
- Hail clouds develop rapidly and descend within 10 min. The PAR detected the typical vertical structure of hail clouds 2 min before the start of hail. Hail indices continued to increase 15 min prior. The PAR detected the entire process of a hail cloud developing, strengthening, and then weakening, which could provide accurate detection facts for the formation and disappearance of hail and the development of and changes to the vertical structure.
- PAR has the advantage of high spatiotemporal resolution, which can locally detect the three-dimensional structure of severe convective weather processes that develop and wither rapidly in advance. The three-dimensional wind field obtained based on the 3DVAR retrieval algorithm can be used to obtain the internal interactions and dynamic mechanisms of the storm earlier and more accurately, which makes it an excellent reference to predict the future development of storms.
- The early-warning indices calculated based on the three-dimensional wind field can provide advance warning for nowcasting. When the GWI is greater than 263, the probability of gale-force wind is great. When the GWI is less than 150, the probability of gales is low. A CI greater than 35 and the presence of concentrated contour lines are conducive to the strengthening and formation of a convection. Although the two new early-warning indices based on the three-dimensional wind field retrieved from AWR discussed in this study worked relatively well for the cases in Foshan, more examples are needed to verify and improve the algorithm.
This study examines and discusses the phased-array radar detection characteristics of hail, thunderstorms, strong winds, and short-term heavy precipitation instances. Based on the three-dimensional wind field, the convective enhancement index and surface gale warning index were calculated, with good forecasting outcomes achieved for several cases in Foshan. However, owing to the small number of cases, more verifications of the early-warning effect, business applications, case verifications, and improved algorithms are required.
Author Contributions
Conceptualization, C.L. and H.T.; methodology, C.L.; software, G.W.; validation, C.L.; formal analysis, P.C.; investigation, Y.L.; resources, C.L.; data curation, C.L.; writing—original draft preparation, C.L. and P.C.; writing—review and editing, C.L. and H.T.; visualization, J.H.; supervision, H.T.; project administration, Foshan Tornado Research Centre and Foshan Meteorological Service. All authors have read and agreed to the published version of the manuscript.
Funding
This research was funded by “Key scientific research projects of Guangdong Meteorological Bureau (GRMC2022Z03)”.
Institutional Review Board Statement
This study did not require ethical approval.
Informed Consent Statement
This study did not involve humans.
Data Availability Statement
This study no new data were created.
Conflicts of Interest
The authors declare no conflict of interest.
References
- Liu, L.; Hu, Z.; Wu, C. Development and Application of Dual Linear Polarization Radar and Phased-array Radar. Adv. Meteorol. Sci. Technol. 2016, 6, 28–33. (In Chinese) [Google Scholar]
- He, J.; Zeng, Q.; Wang, H.; Shi, Z. Advances in Radar Detection of Tornadoes. J. Chengdu Univ. Inf. Technol. 2018, 33, 477–489. (In Chinese) [Google Scholar]
- Junyent, F.; Chandrasekar, V.; McLaughlin, D.; Insanic, E.; Bharadwaj, N. The CASA integrated project networked radar system. J. Atmos. Ocean. Technol. 2010, 27, 61–78. [Google Scholar] [CrossRef]
- McLaughlin, D.J.; Chandrasekar, V.; Droegemeier, K.; Frasier, S.J.; Kurose, J.; Junyent, F.; Philips, B.; Cruz-Pol, S.; Colom, J. Distributed Collaborative Adaptive Sensing (DCAS) for Improved Detection, Understanding, and Prediction of Atmospheric Hazards. In Proceedings of the Ninth Symposium on Integrated Observing and Assimilation Systems for the Atmosphere, Oceans, and Land Surface, 13 January 2005; American Meteorological Society: Boston, MA, USA. Available online: https://ams.confex.com/ams/Annual2005/techprogram/paper_87890.htm (accessed on 12 November 2022).
- Liu, L.; Wu, L.; Wu, C.; Wang, X.; Chen, X.; Cao, J.; Zhuang, W. Field experiment on convective precipitation by X-band phased-array radar and preliminary results. Chin. J. Atmos. Sci. 2014, 38, 1079–1094. (In Chinese) [Google Scholar]
- Liu, L.; Wu, C.; Wang, X.; Ge, R. Test and calibration methods for X-band active phased-array weather radar. J. Appl. Meteorol. Sci. 2015, 26, 129–140. (In Chinese) [Google Scholar]
- Wu, C.; Liu, L.P.; Wu, H.T. Measurement bias and mosaics analysis for X band Doppler radars. J. Plateau Meteorol. 2016, 35, 823–833. (In Chinese) [Google Scholar]
- Li, S.T.; Chen, H.B.; Ma, S.Q.; Li, Z.M.; Xing, F.H.; Che, Y.F. Preliminary results of adaptive and collaborative observations by a networked weather radar system in Nanjing. J. Meteorol. Sci. Technol. 2016, 245, 517–527. (In Chinese) [Google Scholar]
- Ma, S.Q.; Chen, H.B.; Wang, G.R.; Zhen, X.Q.; Xu, X.P.; Li, S.T. Design and initial implementation of array weather radar. J. Appl. Meteorol. Sci. 2019, 30, 1–12. (In Chinese) [Google Scholar]
- Ye, K.; Yang, L.; Ma, S.Q.; Zhen, X.Q.; Sun, J.Y. Research on high-resolution intensity field fusion method of array weather. Meteorol. Mon. 2020, 46, 1065–1073. (In Chinese) [Google Scholar]
- Li, Y.; Ma, S.; Yang, L.; Zhen, X.; Qiao, D. Wind Verification of Array Weather Radar at Changsha Airport. J. Appl. Meteorol. Sci. 2020, 31, 681–693. (In Chinese) [Google Scholar]
- Wang, B.L.; Liang, B.; Fu, P.L. Analysis of the Guangzhou Phased Array Weather Radar Network Website. Guangdong Meteorol. 2019, 41, 47–51. (In Chinese) [Google Scholar]
- Wu, C.; Liu, L.P.; Wang, X.D.; Fan, H.; Liu, Q. The measurement influence of reflectivity factor caused by scanning mode from phased array radar. J. Appl. Meteorol. Sci. 2014, 25, 406–414. (In Chinese) [Google Scholar]
- Yu, M.H.; Liu, L.P.; Wu, C.; Xiao, Y.J. Analysis of severe convective process in South China on 3 June 2016 using phased-array and dual-polarisation radar. Meteorol. Mon. 2019, 45, 330–344. (In Chinese) [Google Scholar]
- Cheng, Y.H.; Fu, P.L.; Hu, D.M.; Bao, X.J.; Zhang, Y.; Li, H.W.; Huang, H. The Guangzhou Phased-Array Radar Networking Scheme Set-up and Observation Test. Meteorol. Mon. 2020, 46, 823–836. [Google Scholar]
- Shapiro, A.; Potvin, C.K.; Gao, J. Use of a vertical vorticity equation in variational dual-Doppler wind analysis. J. Atmos. Ocean. Technol. 2009, 26, 2089–2106. [Google Scholar] [CrossRef]
- Potvin, C.K.; Shapiro, A.; Xue, M. Impact of a vertical vorticity with real and simulated supercell data. J. Atmos. Ocean. Technol. 2011, 29, 32–49. [Google Scholar] [CrossRef]
- Potvin, C.K.; Betten, D.; Wicker, L.J.; Elmore, K.L.; Biggerstaff, M.I. 3DVAR versus Traditional Dual-Doppler Wind Retrievals of a Simulated Supercell Thunderstorm. Mon. Weather. Rev. 2012, 140, 3487–3494. [Google Scholar] [CrossRef]
- Deng, C.; Ruan, Z.; Wei, M.; Ge, R.S. The Evaluation of Wind Measurement Accuracy by Wind Profile Radar. J. Appl. Meteorol. Sci. 2012, 23, 13–23. (In Chinese) [Google Scholar]
- Li, H.; Cao, J.; Qi, M.; Zhu, L.; Wang, M. Application of Vertical Wind Profile from Doppler Radar to the Forecast of Heavy Precipitation in Yunnan. Plateau Meteorol. 2012, 31, 1739–1745. (In Chinese) [Google Scholar]
- Wang, Y.; Wang, H.; Liu, L. Performance evaluation of 3-dimensional variation assimilation retrieval of wind of a squall line event in southern China. Torrential Rain Disasters 2014, 33, 305–312. (In Chinese) [Google Scholar]
- Yu, X.; Yao, X.; Xiong, Y.; Zhou, X.; Wu, H.; Deng, B.; Song, Y. Doppler Weather Radar Principles and Business Applications; Meteorological Press: Beijing, China, 2006; pp. 199–207. (In Chinese) [Google Scholar]
Disclaimer/Publisher’s Note: The statements, opinions and data contained in all publications are solely those of the individual author(s) and contributor(s) and not of MDPI and/or the editor(s). MDPI and/or the editor(s) disclaim responsibility for any injury to people or property resulting from any ideas, methods, instructions or products referred to in the content. |
© 2023 by the authors. Licensee MDPI, Basel, Switzerland. This article is an open access article distributed under the terms and conditions of the Creative Commons Attribution (CC BY) license (https://creativecommons.org/licenses/by/4.0/).