Article

Paleo-Atmospheric Precipitation Recharged to Groundwater in Middle-Latitude Deserts of Northern China

Key Laboratory of Water Cycle and Related Land Surface Processes, Institute of Geographic Sciences and Natural Resources Research, Chinese Academy of Sciences, Beijing 100101, China
Atmosphere 2023, 14(5), 774; https://doi.org/10.3390/atmos14050774
Submission received: 21 March 2023 / Revised: 19 April 2023 / Accepted: 21 April 2023 / Published: 24 April 2023
(This article belongs to the Special Issue Interactions between Climate and Desertification)

Abstract

:
It is a difficult and hot issue in the hydrological studies of arid areas to choose suitable methods to evaluate the recharge of atmospheric precipitation to groundwater and its response to climate change in desert areas. This study reviews the theories and problems of vadose (unsaturated)-zone tracing methods selected by predecessors in hydrological studies and takes the deserts in middle latitudes of northern China as an example to extract decadal, centennial, and millennian information of atmospheric precipitation to groundwater recharge on a regional scale since the late Holocene. The fluctuations of atmospheric precipitation and chronological sequences of desert unsaturated zone were estimated by using the chlorine mass balance (CMB) theory. It indicates that the Badain Jaran Desert in the central Alashan Plateau and the surrounding Gobi deserts have experienced fluctuations of groundwater recharge on a centennial scale during the late Holocene period from about 700 to 2000 years ago. Multiple CMB profile records can identify four periods of relative wetness (1330–1430, 1500–1620, 1700–1780, and 1950–1990) and three periods of relative drought (1430–1500, 1620–1700, and 1900–1950) over the past millennium. These records are consistent with other paleoclimatic records in the northern margin of the Qinghai-Tibet Plateau, and relatively correspond to those in the eastern part of China. This indicates that groundwater recharge in the Alashan Plateau broadly reflects the degree of climatic variability in northwest China over the centennial scale and may be affected by the changes in the intensity of the East Asian summer monsoon. The estimated average recharge rate of precipitation in the Alashan Plateau in the last millennium is about 1.3~2.6 mm/a, which brings new geological evidence for understanding the source of groundwater recharge in the region but is quite different from other environmental records. It should be noted that there are uncertainties in the CMB records of the vadose zone profiles, mainly due to the assumption of atmospheric Cl input in the CMB estimation and the selection of the homogeneous vadose profile (piston flow). This study suggests that this uncertainty and its error should be extensively tested in the future by comparing deterministic data (such as regional reference stations) with large-scale random atmospheric Cl input backgrounds.

1. Introduction

As for the paleoclimate evolution in the arid regions of northern China, lots of climate proxies have been used to obtain geological records of atmospheric precipitation changes over the past millennium, such as ice cores [1,2,3], tree rings [4,5,6,7,8,9,10,11,12,13,14,15,16], lacustrine deposits [17,18,19,20,21,22,23,24], aeolian deposits [25], and historical literatures [26,27]. However, although these paleoclimate records have some recognizable commonalities, they largely show the spatial complexity of changing trends of water vapor on a local scale. This may be mainly attributed to the interaction between different climate systems in northern China, such as the East Asian monsoon, the westerly cyclone wind zone (the westerlies) in the northern Hemisphere (NH), the northern continental airmass (polar airmass), and the topographic effect of the Tibetan Plateau uplift onto the atmospheric circulation field in the NH [28]. Therefore, to accurately understand the spatio-temporal scale of climatic and hydrological changes in northwestern China, it is necessary to expand the geographical coverage of these paleoclimate records.
Currently, with the extreme climatic events and their environmental effects brought about by global warming, one of our common concerns is what is the range of changes in paleo-atmospheric humidity observed in geological records in the background of the climatically hydrothermal gradients in northern China (Figure 1 upper), from the Qinghai-Tibet Plateau (high cold regions) to the middle-latitude arid regions (such as the Alashan deserts)? How does the regional hydrological system respond? The Alashan Plateau is located in the northeast of the Qinghai-Tibet Plateau and close to the current northern boundaries of the East Asian monsoon [29]. Previous studies have obtained the changes of atmospheric precipitation in the region on a time scale of 1000 to 10,000 years based on lacustrine sedimentary records and geomorphological evidence. The results show that the large-scale changes of climate are approximately synchronized with the surrounding areas in time, such as the last glacial wet period (about 30 ± 4 ka B.P.) [30,31,32,33] and the humidity suitable period of the Holocene (about 10,000~6000 a B.P.) [18,30,34,35,36]. However, because these regions are at the edge of monsoons, the short-term fluctuations in climate change caused by the intermittent intensification or weakening of the East Asian monsoon may have greater hydrological effects on the local scale than on the interval scale [33,37]. This view requires a large amount of high-resolution local evidence to conduct comprehensive and global comparative studies. Understanding of the impact of changes in climate, tectonic, or human activity on the regional hydrological conditions and groundwater recharge over geological and historical periods is still weak and inconsistent [38,39]. Some scholars argue that groundwater in the Gobi desert areas in China may be recharged by modern precipitation [40], while others hold that it comes from ancient precipitation during the ice ages [41]. Therefore, in order to solve these problems involving chronology, it is necessary to understand the information of hydroclimatic changes in northern China from different spatiotemporal scales. Under the pressure of current population, socio-economic growth, and ecological protection, the acquisition of paleo-atmospheric moisture information is of great significance for understanding the trend of hydroclimatic changes in northern China and for developing sustainable water resources management.
In recent years, many scholars have carried out research on paleohydrology, climate, and groundwater recharge in the desert areas of the Alashan Plateau in northern China and its surrounding areas in response to these issues [5,17,18,25,27,28,30,32,34,35,36,39,40,42,43,44,45,46,47,48,49,50,51,52,53,54,55,56,57,58,59,60]. For example, in the dune fields of the Badain Jaran Desert, the paleo-recharge history of deep soil water and the related history of atmospheric precipitation driven by climate change were reconstructed [41,43,44,46,51,52,53,54,61]. Some high-resolution data of local short-scale climate change were obtained (as shown in Table 1). These studies are mainly based on the data, such as soluble salt content, hydrogeochemical composition, and isotopic signals of sedimentary profiles of deep (non-root layer) aeration zones in some dune fields, which are used as semi-quantitative proxies for atmospheric precipitation (direct recharge) to obtain evidence of soil water recharge and climate change. However, there is still a lack of comprehensive comparison and evaluation of these research cases from different areas. Based on these research cases and data, this paper attempts to (1) comprehensively obtain the records of potential recharge history of groundwater and their spatiotemporal differences in the Alashan desert regions and (2) compare the observed values of relevant climate proxies in neighboring regions to assess the spatial variability of atmospheric precipitation and related environmental issues in different regions.

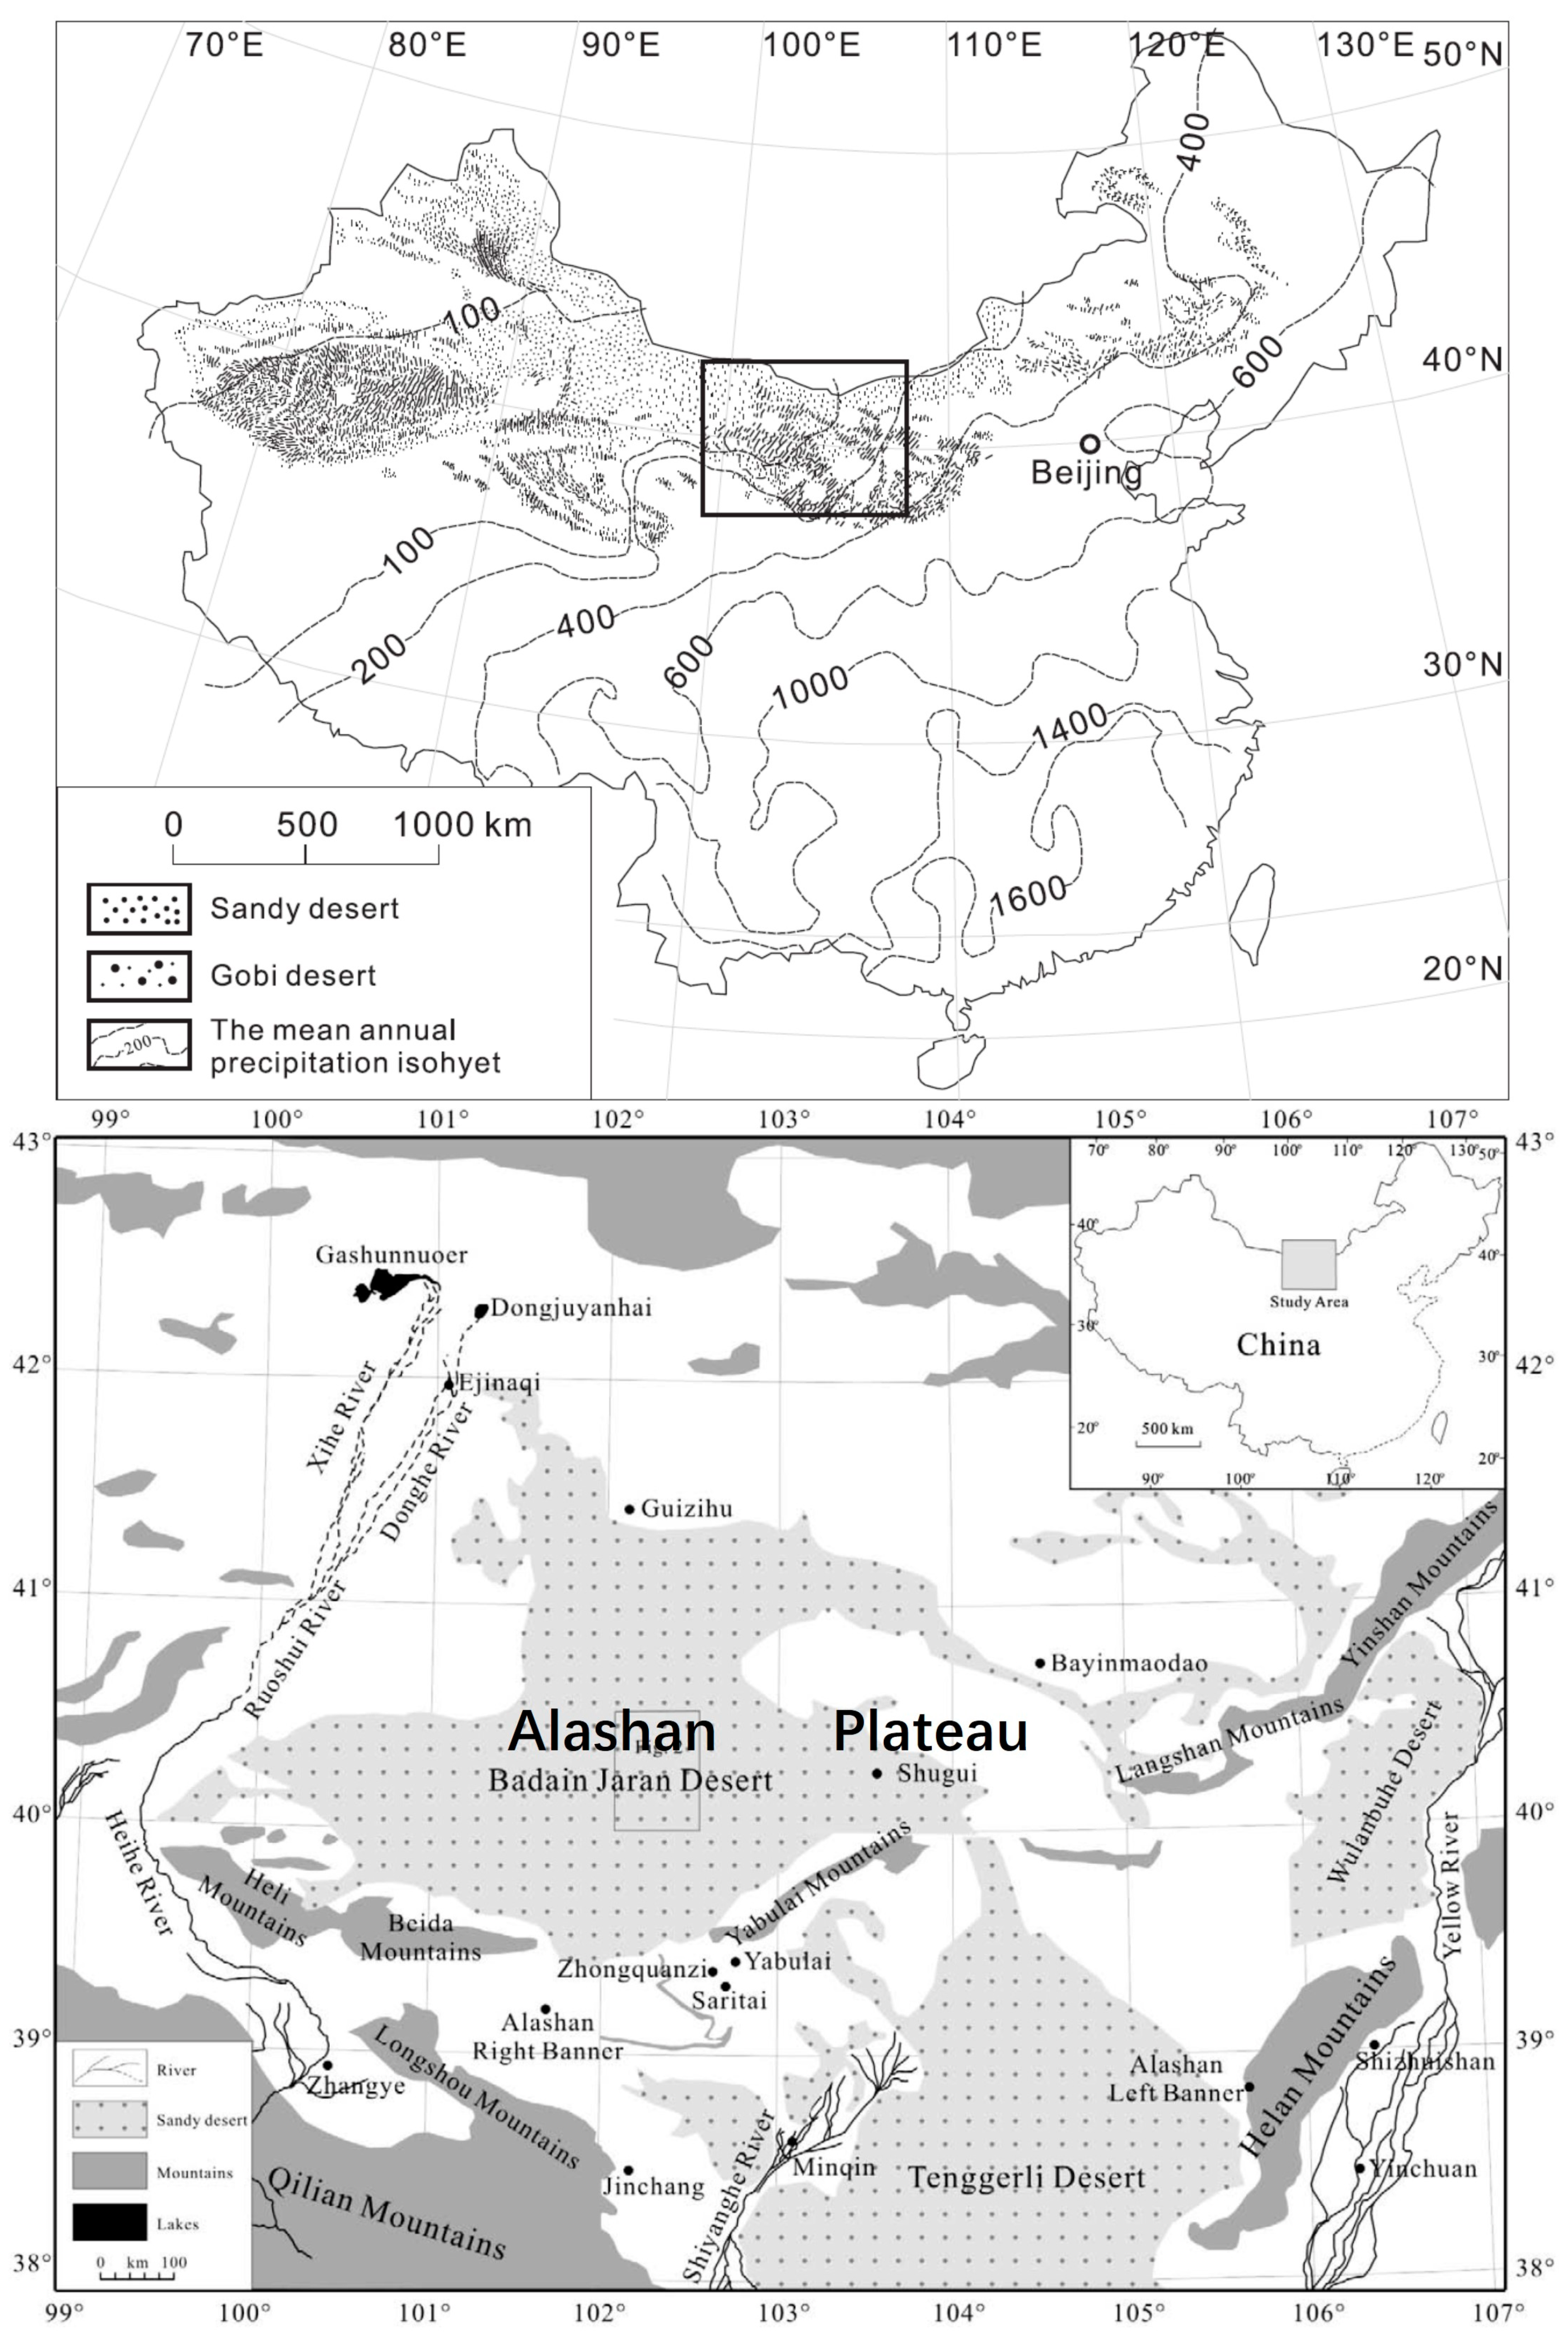
2. Regional Backgrounds

The Alashan Plateau is located in the middle latitudes of northern China (Figure 1) and is widely developed with sand deserts, Gobi deserts, and middle to low mountains landscapes. It includes three large sand deserts, namely the Badain Jaran (Badanjilin) Desert in the central, the Tenggeli (Tengger) Desert in the southeast, and the Wulanbuhe (Ulanbuhe) Desert in the northeast. The Badain Jaran Desert, between 39°20′–41°30′ N and 100°–104 °E with an area of 49,000 km2, is the third largest sand desert in China [48]. It has the world’s tallest dunes and a large number of permanent lakes with interdune lowlands, surrounded by the Heishantou Mountains in the south (highest elevation 1963 m), the Yabulai Mountains in the southeast (highest elevation 1957 m), the Gurinai ancient lake basin in the west, and the Guaizihu wetland in the north (about 900~1000 m). The elevation of the Badain Jaran Desert ranges from 1500 m in the southeast to 900 m in the northwest, forming a NW-SE hydraulic gradient. The desert landforms are mainly affected by wind forces, and diverse types of aeolian dunes are widely developed, with an average height of 200~300 m and the maximum height of 460 m in the southeast [48]. The interdune lowlands contain a large number of leaky lakes, mainly distributed in the southeast of the desert, without surface runoff, and the area and salinity of different lakes vary greatly [30]. There are several weather stations in human settlements on the edge of the desert, such as Zhongquanzi Station. The monthly average temperature in the region is between −10 °C in January and 25 °C in July. The annual average temperature is 7.7 °C in the south and 8.2 °C in the northwest. The annual average precipitation ranges from about 120 mm in the south to 40 mm in the north, mainly occurring from July to September. This pattern of hydroclimatic synchronization indicates that the water vapor in the desert is mainly derived from the East Asian summer monsoon, but the amount of water is only sufficient to support the development of sporadic vegetation on the dunes. At the southern edge of the dune field, aeolian sand is underlain by semi-consolidated sandstones and conglomerates, whose ages are presumed to be in the Early Pleistocene [48]. Mountains on the edge of the desert are mainly composed of the Jurassic, the Cretaceous, and the Tertiary rocks [62]. The sedimentology and geological structure of the underlying rocks at the bottom of the dune is largely unknown at present, except for the exposure of granite remnants covered by aeolian sand in some places [48].

3. Theoretical Basis of Research Methods

Currently, the groundwater resources widely developed and utilized worldwide may be recharged under different climatic conditions [63,64,65,66]. It is of great significance to understand the origin, evolution, and recharge mechanisms of these groundwater resources. Compared with humid regions, arid regions (especially desert areas) have relatively simple types of water resources (mainly groundwater) and are extremely sensitive to climate change. Studies have shown that short-term climate fluctuations since the late Quaternary and historical periods may have influenced the water recharge process into the arid aquifers [39,67]. However, in arid and semi-arid regions, it is difficult to estimate groundwater recharge by using traditional hydrological methods such as the water balance method and tracer method. This is due to the following reasons: Firstly, precipitation and evapotranspiration are nearly balanced in arid and semi-arid regions, leading to a sensitive response of groundwater recharge to even small changes in its control factors [64,68]. In addition, under the surface mixed layer, both the solute in the liquid phase and the water with isotopic markers in the vapor and liquid phases will undergo diffusion and dispersion due to the presence of vegetation or soil heterogeneity, thus erasing the signals of initial recharge sources (such as atmospheric precipitation) [64,68,69,70,71,72]. Therefore, how to choose effective methods to trace groundwater recharge in arid areas is a hot and difficult topic in hydrological research.
In recent years, it has been found that in the desert areas without surface runoff, both the soluble salt and isotopic curves of soil water moving along the depth of unsaturated zone in a near-piston flow pattern, a one-dimensional vertical uniform flow without evapotranspiration and anhydrous salt cycle, can explain the recharge process of soil water, and have a good correspondence with the regional precipitation processes. If the recharge rate of soil water is greater than 20 mm/a, the information of climate events with a short duration of 4~5 years can be preserved in these unsaturated zones for more than 50 years. If the recharge rate of soil water is greater than about 2 mm/a and the unsaturated zone is thick enough, long-term (centennial- and millennial-scale) climate fluctuation information may be stored for more than 1000 to 10,000 years [64,68,71,73,74,75,76].

3.1. Aerated/Vadose Zone and Chlorine Tracer

Vadose zones and chlorine tracers are the archives of groundwater recharge history and environmental changes. The aerated zone, also known as the groundwater unsaturated zone, is a part of the generalized groundwater system. It refers to a geological medium in which rock, soil, water-soluble salt, and air coexist below the surface and above the water table. In arid regions, only a small portion of atmospheric precipitation can penetrate the surface deeply enough to reach the groundwater table and become groundwater recharge. Due to the strong regional evaporation–precipitation ratio (the ratio of evaporation to precipitation), most of the atmospheric precipitation will be evaporated (re-entered into the atmosphere) when it reaches or approaches the surface. Even if it seeps into the ground, the transpiration of plant roots will remove it from the ground. However, water that penetrates below the evapotranspiration layer (active mixing zone or root layer) will no longer be affected by evapotranspiration, and this water is called potential recharge water. In arid areas, potential recharge events occur infrequently (intermittently) and are only associated with temporary heavy rainfall or rainstorm events (greater than the regional potential evapotranspiration capacity) [64,71,77]. Unless climate disturbances alter the energy balance in the unsaturated zone, this potential recharge water, driven by a balance between matrix forces (capillary forces) and gravity, will continue to infiltrate downward at a certain rate and eventually become recharge water once it reaches the groundwater level. It should be noted that both liquid and gaseous water in the unsaturated zone do not necessarily move vertically downward. They also flow upward in response to the energy gradients, but the rate is usually very small (<0.1 mm/a [78,79,80]), which is within the negligible measurement error range.
Although some of the water entering the vadose zone is removed by evapotranspiration, solutes (soluble salt) in the water are retained and enriched. The inert elements or compounds in the solutes can be used as tracers to indicate the concentration of these salts, provided that the chemical behavior of the tracer is stable in the vadose zone and no other sources (external sources) are present. From a geochemical perspective, Cl may be a suitable tracer element with conservative chemical behavior in the surface environment, because it is difficult to be replaced in chemical reactions such as reduction–oxidation and solute complexation, and it is not easy to be adsorbed by clay minerals, volatilized, or precipitated (due to high water solubility). It is rare in surrounding rock (solid phase source) but widely present in atmospheric precipitation (liquid phase source) [81]. Studies have shown that the ion Cl has been applied to the vadose zone studies based on the characteristics of its input from certain geological sources (e.g., evaporites, marine salts, or terrestrial formations) and of being retained in a low-porosity, relatively closed sedimentary environment without loss [82,83]. Therefore, if there is no solid source Cl input in a profile and the sediment is low in permeability and relatively closed, then the profile can be used for tracing research based on certain assumptions. One of the assumptions is that all Cl in soil water is atmospheric in origin and it migrates with soil water through the unsaturated zone at the same rate.
Based on this, hydrogeologists have established a Cl equilibrium equation for the unsaturated zone, which can be expressed as:
PCP = RCR
Equation (1) is also known as the chlorine mass balance equation (CMB equation). In Formula (1), P is the average atmospheric precipitation rate (L/T) during the profile recording period, CP is the average chlorine content (M/L3) in the precipitation (input) during the recording period, and CR is the Cl content (M/L3) in the potential recharge water [77]. PCP represents the total amount of atmospheric Cl input, which must be corrected if there is Cl from any other non-rainfall source. In particular, dry deposition of Cl input has been shown by aeolian sand studies to account for more than 50% of Cl input in some desert areas [84,85,86]. Equation (1) has an obvious assumption: the recharge rate R is linearly correlated (inversely proportional) to the soil water CR. That is, the equation indicates a mass balance in a quasi-steady (non-dynamic) form, with many parameters expressed in terms of constants (e.g., P and CP). Since the details of the Cl input process of atmospheric precipitation and its spatiotemporal changes are often difficult to obtain in arid and desert areas, people have to follow this simple assumption. Hydrogeologists have also focused on this problem. For example, Gina and Murphy [87] have proposed a more comprehensive formula that can be applied to situations regarding the occurrence of transient precipitation, evapotranspiration, or Cl deposition, but these input parameters are required to be known.
The assumption of the CMB equation shows that not all vadose zone profiles can be applied to this theory. In short, there are three limiting factors: (1) Dispersion and diffusion in the soil always tends to erase the input signals in the aquifer [64]. (2) Water flow in the active root layer usually preferentially selects root channels (preferred flow paths) to flow, causing lateral migration and diffusion of the water. Water and solute near the surface also move upward in response to evaporation and transpiration (especially the plant hydraulic lifting effect in arid and semi-arid climate environments), leading to the absorption of solute by plants and re-precipitation on the soil surface, and resulting in the recycling and mixing of water and salt [69,88]. (3) The change of solute concentration in the vadose zone is not only controlled by atmospheric precipitation recharge and climate change, but also may be caused by a variety of reasons related to the inputs of some non-atmospheric salts, such as the in-situ weathering products of soil and rock minerals, the salt input from nearby dry salt lakes (solid sources), and the diffusion of groundwater salt extracted by capillary lifting water near the groundwater table [75]. Therefore, it is a premise to avoid the influence of the above factors in the application of the CMB equation.
Studies have found that in a relatively homogeneous media [77,89], such as sand dunes [90] and fine-particle carbonate or volcanic ash strata [91], the movement of water is approximately in a form of piston flow, which can avoid the effects of dispersion and diffusion. In field work, the selection of unsaturated strata away from vegetation is a key point to avoid the influence of vegetation root layer and evapotranspiration layer. It has been found that the water flow under the root layer of sand dunes is generally close to the form of piston flow and is less affected by evaporation [90]. Therefore, sand dunes have become a good stratum for tracer study. The capillary rising effect of groundwater ions can be avoided by choosing a sufficiently thick profile of the unsaturated zone (such as tall sand dunes) away from groundwater. In addition, to determine the non-atmospheric source of chlorine in the profile, it is necessary to keep away from the influence of dry salt lakes in desert areas. Identifying the relative contributions of dry and wet deposition in modern dust soluble salts and their sources based on regional background values or baseline meteorological station data [86] can help to determine the non-atmospheric sources of unsaturated zone chlorine.
If the texture conditions of the vadose zone are relatively uniform, such as sand or silt, the water flow below the surface mixing zone will generally be very close to a form of piston flow, namely one-dimensional vertical infiltration, where younger water uniformly displaces (replaces) older water downwards [92]. In this case, the vertical fluctuations (ups and down) in the chemical composition of the pore water can be seen as an indicator of atmospheric conditions during recharge. The age of the profile can be dated by comparing the cumulation of Cl from the surface to a given depth at a certain Cl input rate, i.e.,
t = 1 P C P 0 Z i θ z C r z d z
In Equation (2), t represents the residence time, θ represents volumetric water content, z represents depth [74], and other parameters are the same as Equation (1). Equation (2) is also known as the Chlorine Accumulation Chronology Model (CAA) and is essentially a piston flow model. It can be seen that this chronological scale does not require the measurement of physical water head or water potential in any soil, nor does it require the measurement of absolute ages of the nail layer (such as the chlorine convex) in the profile. However, it is clear that the latter is conducive to the testing and constraint of the CAA chronology scales.
The temporal resolution of the unsaturated zone records depends on the density of vertical sample collection in the profile but may also be constrained by the residence time of the solute signals. The diffusion and dispersion of soil water have a negative impact on climate signals over time. This rate of influence may depend on factors such as the degree of solute change, water vapor content, recharge rate, and characteristics of solid substances in unsaturated zone [64,68,80]. It has been estimated that the duration of a 20-year climatic event (i.e., a complete solute peak or valley) can be preserved for about 100 years at a recharge rate of 10 mm/a, while under a recharge rate of 100 mm/a with a volumetric water content of 5% (V/V, percentage ratio between volume and volume), it may be 1000 years [64,68,80]. However, Ginn and Murphy [87] argue that this model may overestimate the degree of water mixing in unsaturated zones at low water content. They have conducted a series of field and experimental studies and found that mixing is not significant in deep unsaturated zones with low water content and low clay content (in sandy layer) [87]. The limitations of this approach are also discussed by Edmunds and Tyler [76].

3.2. Research Progress

The study of groundwater unsaturated zones as paleoclimate information archive has a history of more than 40 years in hydrology literatures. Early works carried out in the Cyprus region of the Mediterranean [93] provided the first case to explain the history of groundwater recharge using an unsaturated zone profile, demonstrating a good temporal correspondence between Cl recharge and atmospheric precipitation [94,95]. These studies also show that the signals of piston flow in unsaturated zones can be preserved. This finding was verified in a number of subsequent studies, which confirmed its reliability by using the peak of the nuclear explosion pulse as an independent timer at different places [50,96,97].
Currently, studies on paleoenvironmental records of unsaturated zones have been carried out in a wide range of global climatic and geographical environments around the world [70,98,99,100,101,102,103]. Most of them use Cl as a tracer. Other tracers such as 36Cl and Br have also been used to further constrain the input function of Cl [104], or to use 3H, δ2H, δ18O, NO3, etc., to provide complementary environmental proxies [101,103]. In the study of the Yucca Mountain area in the southwestern United States, the environmental records of the unsaturated zone have extended the time scale far into the Pleistocene period [74]. In these existing studies, some of the unsaturated zone archives can be compared well with other environmental monitoring data in the region and are closely correlated with some climate proxy indicators. For example, the Cl environment archives reconstructed from the Cyprus profile can be well correlated with the multi-year mean annual precipitation recorded over 30 years by the regional instrument measurement [94]. The environmental records reconstructed from profiles in northern Senegal, Africa, correspond well with the runoff records of the Senegal River from 1900 to 1990, and have a good correlation with the water level records of Chad Lake reconstructed by other proxy methods over 500 years [105]. It should be emphasized that the unsaturated zone records at one site point seem to reflect regional (not just local) long-term precipitation records, just as the runoff variation of the Senegal River cannot be a result of precipitation only locally (but across the entire basin). This implies that the environmental record of unsaturated zone is an integrated or comprehensive record, which may be a regional environmental alternative proxy to a greater extent.
In recent years, international scholars have found that the unsaturated zone profiles of the Badain Jaran, Tenggeli, and other deserts on the Alashan Plateau in northern China can also be used for paleoclimate reconstruction. For example, Ma et al. [43,46], Ma and Edmunds [51], and Gates et al. [52,53,54] found that there was also a corresponding relationship between the environmental records of unsaturated zone in the Badain Jaran Desert and the net accumulation rate of the Guriya ice core. Gates et al. [52] conducted studies on several unsaturated zone profiles (18) in different areas of the Badain Jaran Desert (Table 1) and found that there was commonality in the recharge history of groundwater in different areas of the desert, which may reflect the regional climate driver.

4. Data Sources

On the basis of previous studies, this study collects and collates research cases and their effective data on unsaturated zones carried out in recent years on the Alashan Plateau and its surrounding areas (such as the Badain Jaran Desert, the Hexi Corridor, the Shiyang River Basin, the Maowusu Desert, and the northern part of the Loess Plateau). Some data are shown in Table 1. The specific methods of obtaining unsaturated zone profiles and sample analysis in the field for these cases can be briefly introduced in the study of Gates et al. [52,53]. Unsaturated zone profiles with varying thickness (6~30 m) were drilled on some large dunes (shady or sunny slopes) near interdune lakes (such as Sayinwusu Lake, Badan Lake, Baoertelegai Lake, etc.) in the southeast of the Badain Jaran Desert in the central part of the Alashan Plateau. The elevation, topography, slope shape, height from the lake surface (used to determine the groundwater level), vegetation type and coverage (used to determine the root layer), and possible human activities (external sources) of the profile locations were marked. The profile samples were collected using a hollow rod manual auger with a replaceable aluminum rod. Approximately 500 g of each bulk sample was collected, with different sampling intervals of about 0.13~1.00 m. The sample was immediately sealed with a polyethylene bag to prevent moisture evaporation. The extraction of soil moisture from unsaturated zone was performed by mixing 50 g of a water-containing sub-sample with 30 mL deionized water (3:5 water to soil ratio), then centrifuging and filtering the suspension out by a 0.45 μ filter membrane. The major anion contents of the filtrate were analyzed using ion chromatography, and the soil moisture content was measured by gravimetry after being dried at 110 °C for 24 h.
Among the data cited in this paper, there are a total of 30 unsaturated zone profiles from the hinterland of the Badain Jaran Desert. There are nine unsaturated zone profiles from the surrounding areas of the Badain Jaran Desert, including one in the Maowusu Sandy Land, three in the Tenggeli Desert, and five in the Loess Plateau. The geographical location, average water content, Cl content, chronological scale, and average recharge rate of each profile are shown in Table 1 and its accompanying literature.

5. Analytical Results

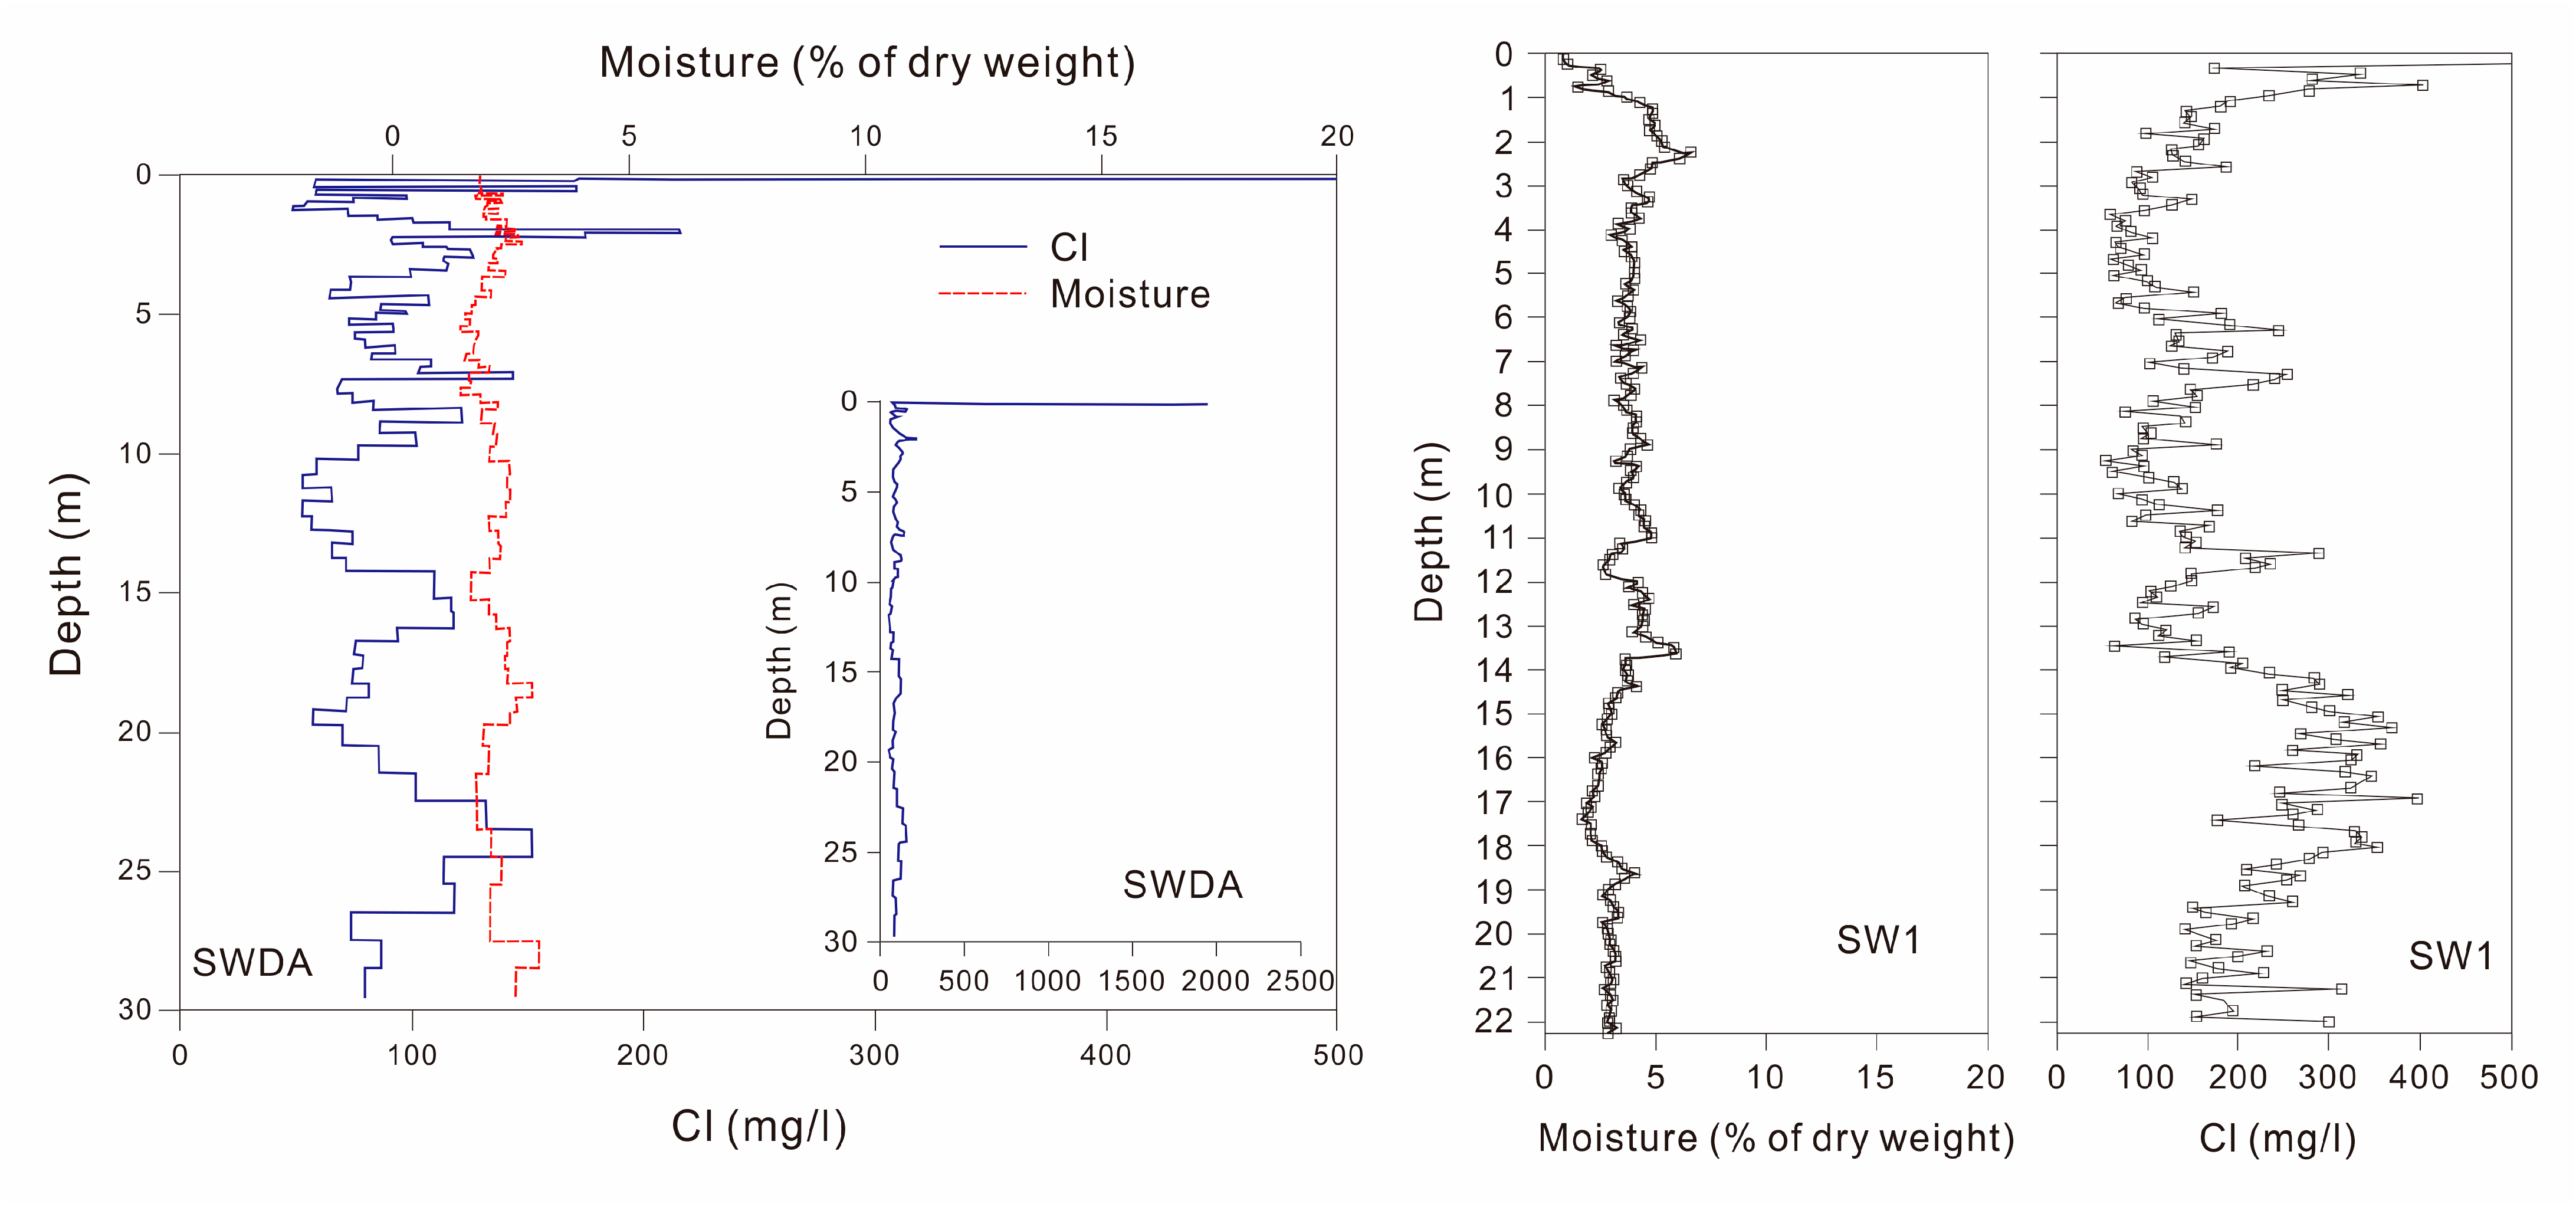
5.1. General Characteristics of Desert Unsaturated Zone Profiles

It can be seen from Table 1 that although these unsaturated zone profiles are taken from different regions, the recharge rates estimated based on the CMB equation are similar in the range of magnitude values. Due to the large number of profiles and for the sake of simplicity, SWDA (30 m thick with a recharge history of about 700 years) [53], SW1 (22.5 m thick with a recharge history of about 1200 years) [51], BYBS (30 m thick with a recharge history of about 2050 years) [44], and other profiles in the southeast of the Badain Jaran Desert are selected as the representatives for discussion.
In the Badain Jaran Desert, the unsaturated zone is composed of unconsolidated Quaternary sediments, which also constitutes the sand dunes in the Badain Jaran Desert. The mean grain size of these sand particles is about 0.22 mm with a bimodal size distribution [42]. The unsaturated zone is generally low in moisture content (1% to 5% dry weight, Table 1 and Figure 2). In most parts of the dune field, a clearly identifiable wet soil layer occurs at a depth of about 20 to 40 cm below the surface. In the SWDA profile (Figure 2), for example, there is a higher water content (4.9%) near the surface, which may be attributed to local rainfall before sampling. At this section, the wet soil layer penetrated downward for 45 mm, and the dry soil layer below it (45 mm to 300 mm, dry weight 0.58%) represented the water content of the soil layer that was not affected by the wet rainfall soil surface. The water content below 300 mm of the profile was relatively consistent, with an average water content of 2.1% (standard deviation of 0.33%). The Cl content across the profile ranged from 1938 mg/L near the surface peak to a lower 49 mg/L (Figure 2), with an average content of 91 mg/L below 300 mm. The peak value of Cl (1526 mg/m2) appeared in the 45–300 mm section, indicating that Cl has been significantly enriched by surface evaporation. The second highest Cl content in the profile (215 mg/L) occurs at 2.0 m blew the surface, while other Cl peaks occur at about 7.6 m, 16.8 m, and 25.5 m.
It is worth mentioning that the Cl peak (chlorine convex) near the surface is widespread in unsaturated zone profiles under arid and semi-arid environments, which have been found in many parts of the world [70,99,104,106]. In the arid regions of the southwest of the United States, the near surface chlorine bulge is very large, which is interpreted as having accumulated since the early Holocene and not recharged since then [70,104]. These unsaturated zone profiles in the Badain Jaran Desert all show very low Cl accumulation levels (Table 1). Gates et al. [52] speculated that the accumulation time of Cl corresponding to most Cl peaks should be between 20 and 200 years. However, due to their proximity to the surface, it is not possible to rule out the effects of bypass flow or evapotranspiration (recirculation or mixing), and their usefulness as indicators of time is uncertain. However, the fact that Cl accumulation is low in all unsaturated zone profiles suggests that the recharge events (related to summer rainstorm) rarely occur under modern conditions in the study area.

5.2. Calculation of Steady-State Parameters and Estimation of Average Recharge Rate of the Vadose Zone

In the existing studies of the Badain Jaran Desert, the average recharge rate recorded in the unsaturated zone profile was calculated based on Equation (1). This equation firstly needs to estimate the average Cl input rate of regional atmospheric precipitation. Due to the lack of meteorological stations to record precipitation within the Badain Jaran Desert, the multi-year average precipitation records in the study area can only be obtained from several meteorological stations in the surrounding areas of the desert. Research on meteorological data shows that from the northern margin of the Qinghai-Tibet Plateau to the Alashan Plateau, there is an overall trend of increasing drought (decreasing precipitation) from the south (Hexi Corridor) to the north (Altay Great Gobi) [51,53]. The Zhongquanzi Meteorological Station (39.1° E, 102.7° N) is the closest meteorological station to the study area (about 20 km in the southeast), which is probably the most representative of the meteorological conditions in the southeast of the Badain Jaran Desert. The annual average precipitation at this station was 84 mm/a during the period from 1956 to 1999 (Figure 3). The wettest year (181 mm in 1978) received six times as much precipitation as the driest year (30 mm in 1965), with a total standard deviation of 33 mm/year, which proves that the interannual precipitation in the desert has a high variability.
The multi-year records of the chemical composition of atmospheric precipitation are rare in most areas of China, and even blank in many areas. However, even if long period records can be obtained in one region, it is difficult to translate to other regions because of the high spatiotemporal variability of these precipitation parameters. Goni et al. [107] found that in the Sahel region of Africa, the content of solutes in precipitation tends to decrease after the rainy season, which is attributed to the decreasing contribution of local dust sources over time. Ma and Edmunds [51] estimated that the average Cl content of rainfall in the Badain Jaran Desert was 1.5 mg/L. These data are calculated based on the average precipitation of Zhongquanzi Station in 2001~2002 and a heavy rainstorm event (about 50 mm) in 1999, which represents the Cl content of main precipitation events in these years. This estimated value is close to the average Cl content (1.7 mg/L) in the precipitation of three suburban stations near Xi’An (34°14′ N, 108°57′ E) [108], which is the closest to the study area in distance and is the longest monitoring data available at present. Therefore, many researchers [43,44,46,51,52,53,54,61] have taken 1.5 mg/L as the most suitable input value of Cl content for atmospheric precipitation in the southeastern Badain Jaran Desert, and believe that this estimated value should include Cl input contributed by dry deposition, as it is based on the test values obtained from the bulk samples of water, which tend to combine with the input of dry deposition.
Based on these Cl input values, an average recharge rate of precipitation in the SWDA profile was calculated as 1.35 mm/a (Table 1) and an average Cl content of the recharge water below the mixed layer (chlorine convex) in the unsaturated zone was calculated as 93 mg/L. This recharge rate value of 1.35 mm/a only accounts for about 1% of the annual average precipitation, which is similar to some estimates of the southeastern Badain Jaran Desert, such as 0.95 mm/a [51], 0.91 mm/a [44], 1.26~1.33 mm/a [43,51], 0.81~1.11 mm/a [61], and 1.1~2.16 mm/a [52], but slightly higher than some estimates of the northeastern Badain Jaran Desert, such as 0.21~0.059 mm/a [46].

6. Discussion

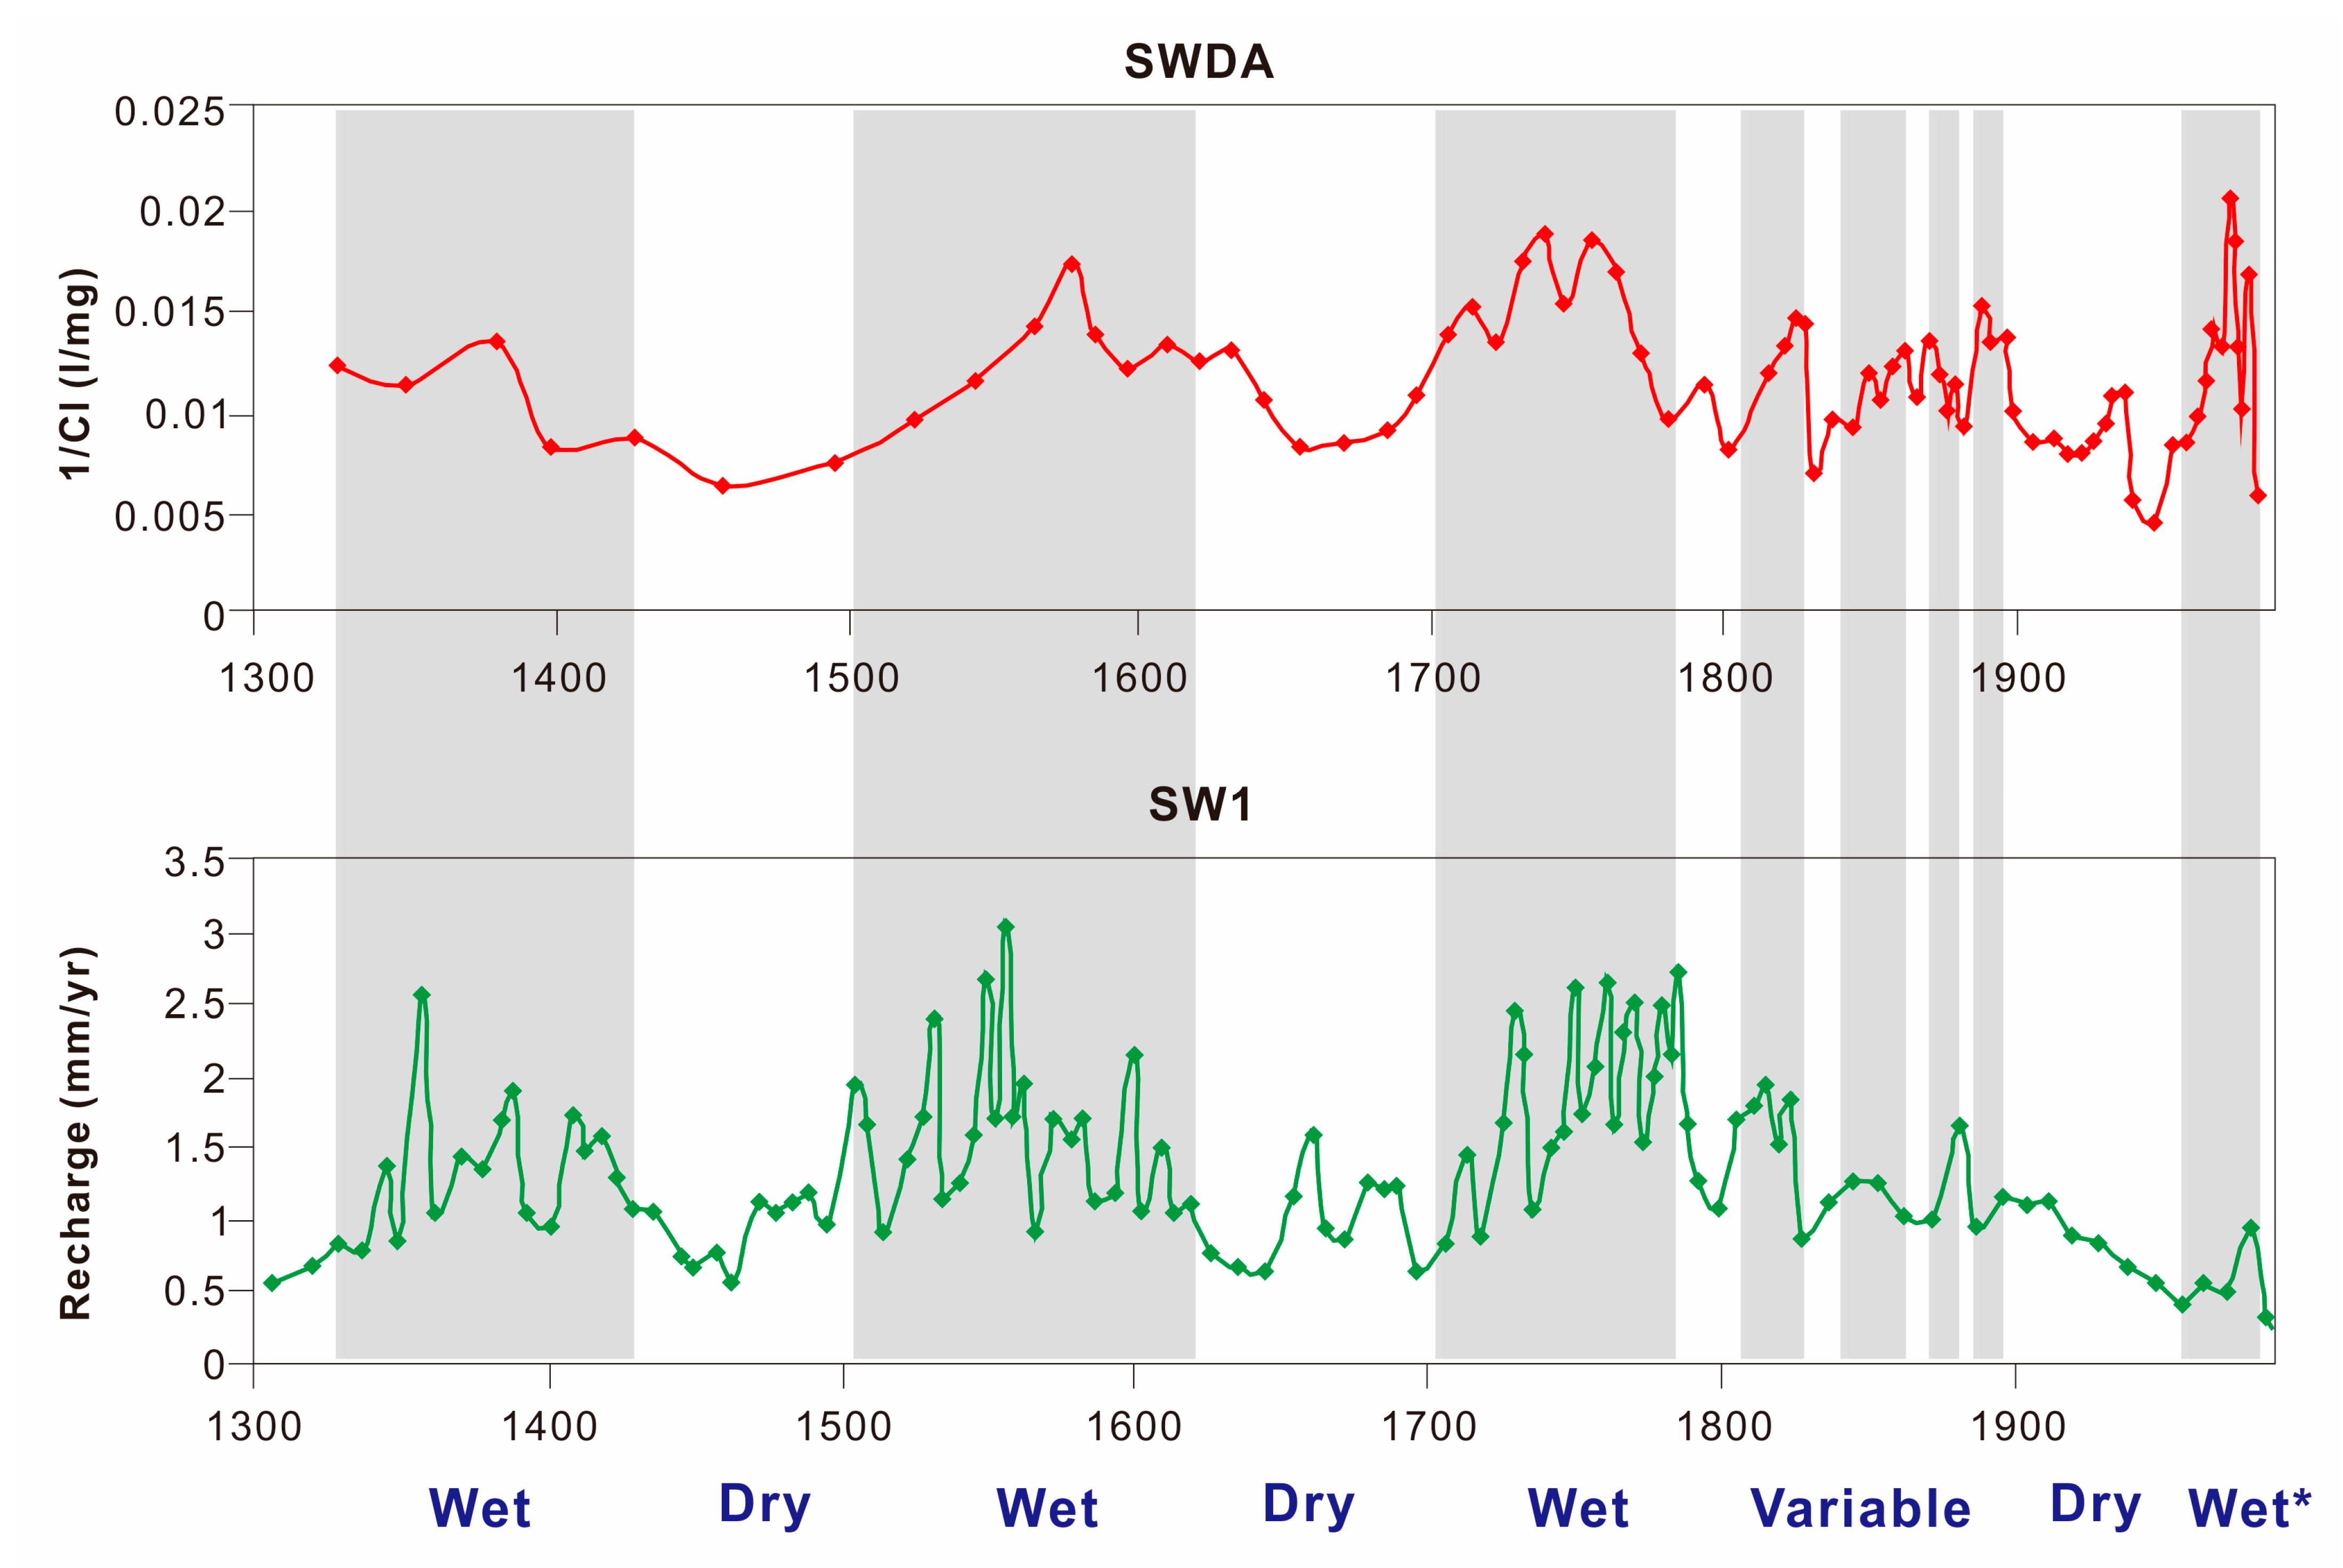
6.1. Chronological Sequence of Unsaturated Zone Profile and Its Environmental Indication

The Cl input values of atmospheric precipitation estimated above are also used by researchers in Equation (2) to establish the chronology of these unsaturated zone profiles. For example, based on the total Cl accumulation time in the SWDA profile, Gates et al. [53] and Ma and Edmunds [51] provided the recharge history of the Badain Jaran Desert over a time scale of about 700 years and 1200 years, respectively (Figure 4 and Table 1).
It was found that when the Cl content in the profile is proportional to the recharge rate of atmospheric precipitation, the reciprocal of the Cl content value (i.e., 1/Cl) (Figure 4) can be used as an indicator of the change of relative humidity over time [52,53,54]. Using this reciprocal value curve, several periods of high recharge rate can be found in the SWDA profile, such as 1510~1640 AD, 1700~1775 AD, 1820~1830 AD, 1880~1900 AD, and most of the period from 1964 to the present. Other periods, such as 1640~1710 AD, 1780~1820 AD, and 1890~1960 AD, were less recharged. The overall fluctuation trend of this curve is common in most unsaturated zone profiles of the Badain Jaran Desert. For example, comparing the SWDA and SW1 profiles (Figure 4, recorded around 1300 a) [51], the curve peaks that occurred in 1350~1400 AD, 1500~1600 AD, 1700~1800 AD, and about 1900 are consistent on SW1 and SWDA profiles. The variation trend from 1800 to 1950 can also be seen in some relatively short unsaturated zone profile records in the southeastern Badain Jaran Desert, especially in the SWSA05-16 and SWSC05-10 profiles (Table 1) [52]. However, there are also differences in the records between the period from 1950 AD to 1990 AD, showing relative humidity in the SWDA, BA1, and SA profiles, but relative aridity in the SW1 and BA2 profiles. In the 700 years of recharge history in the SWDA and SW1 profiles (Figure 4), there are four periods of higher recharge and three periods of lower recharge on a centennial scale. During the period from 1785 AD to 1890 AD, the curves of the two profiles occurred with fluctuations on a short-term time scale. These short-term fluctuations can be grouped together and classified as variable periods. However, during the period from 1950 to 1990, there was significant inconsistency between the two profiles. The SWDA profile can be classified as a high recharge period, while the SW1 and other profiles show a low recharge period.

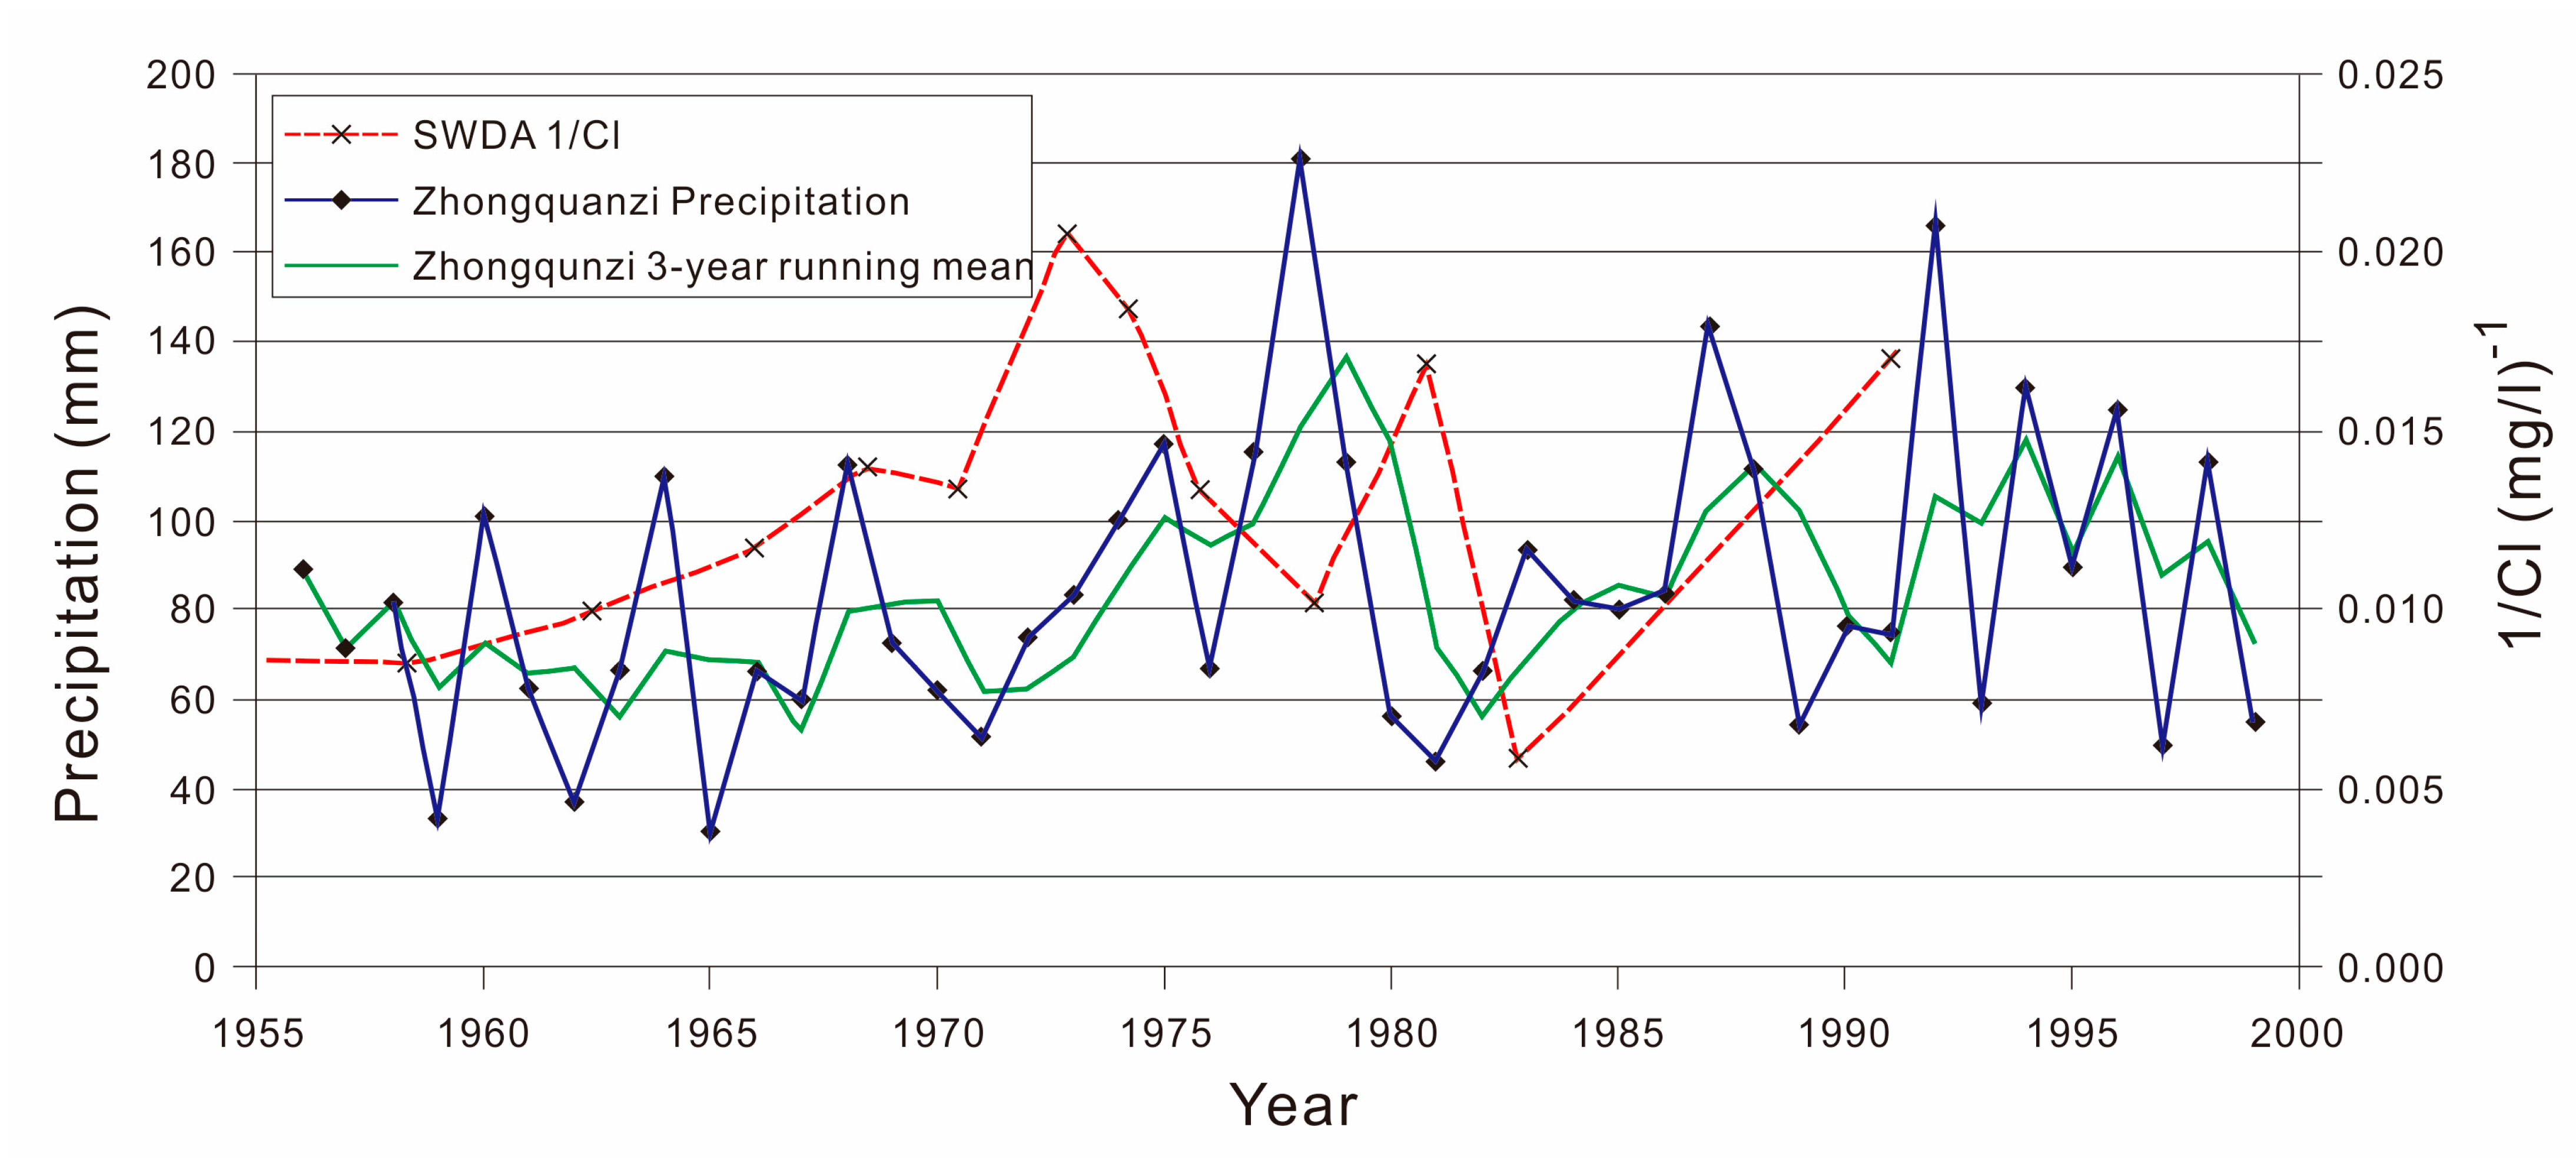
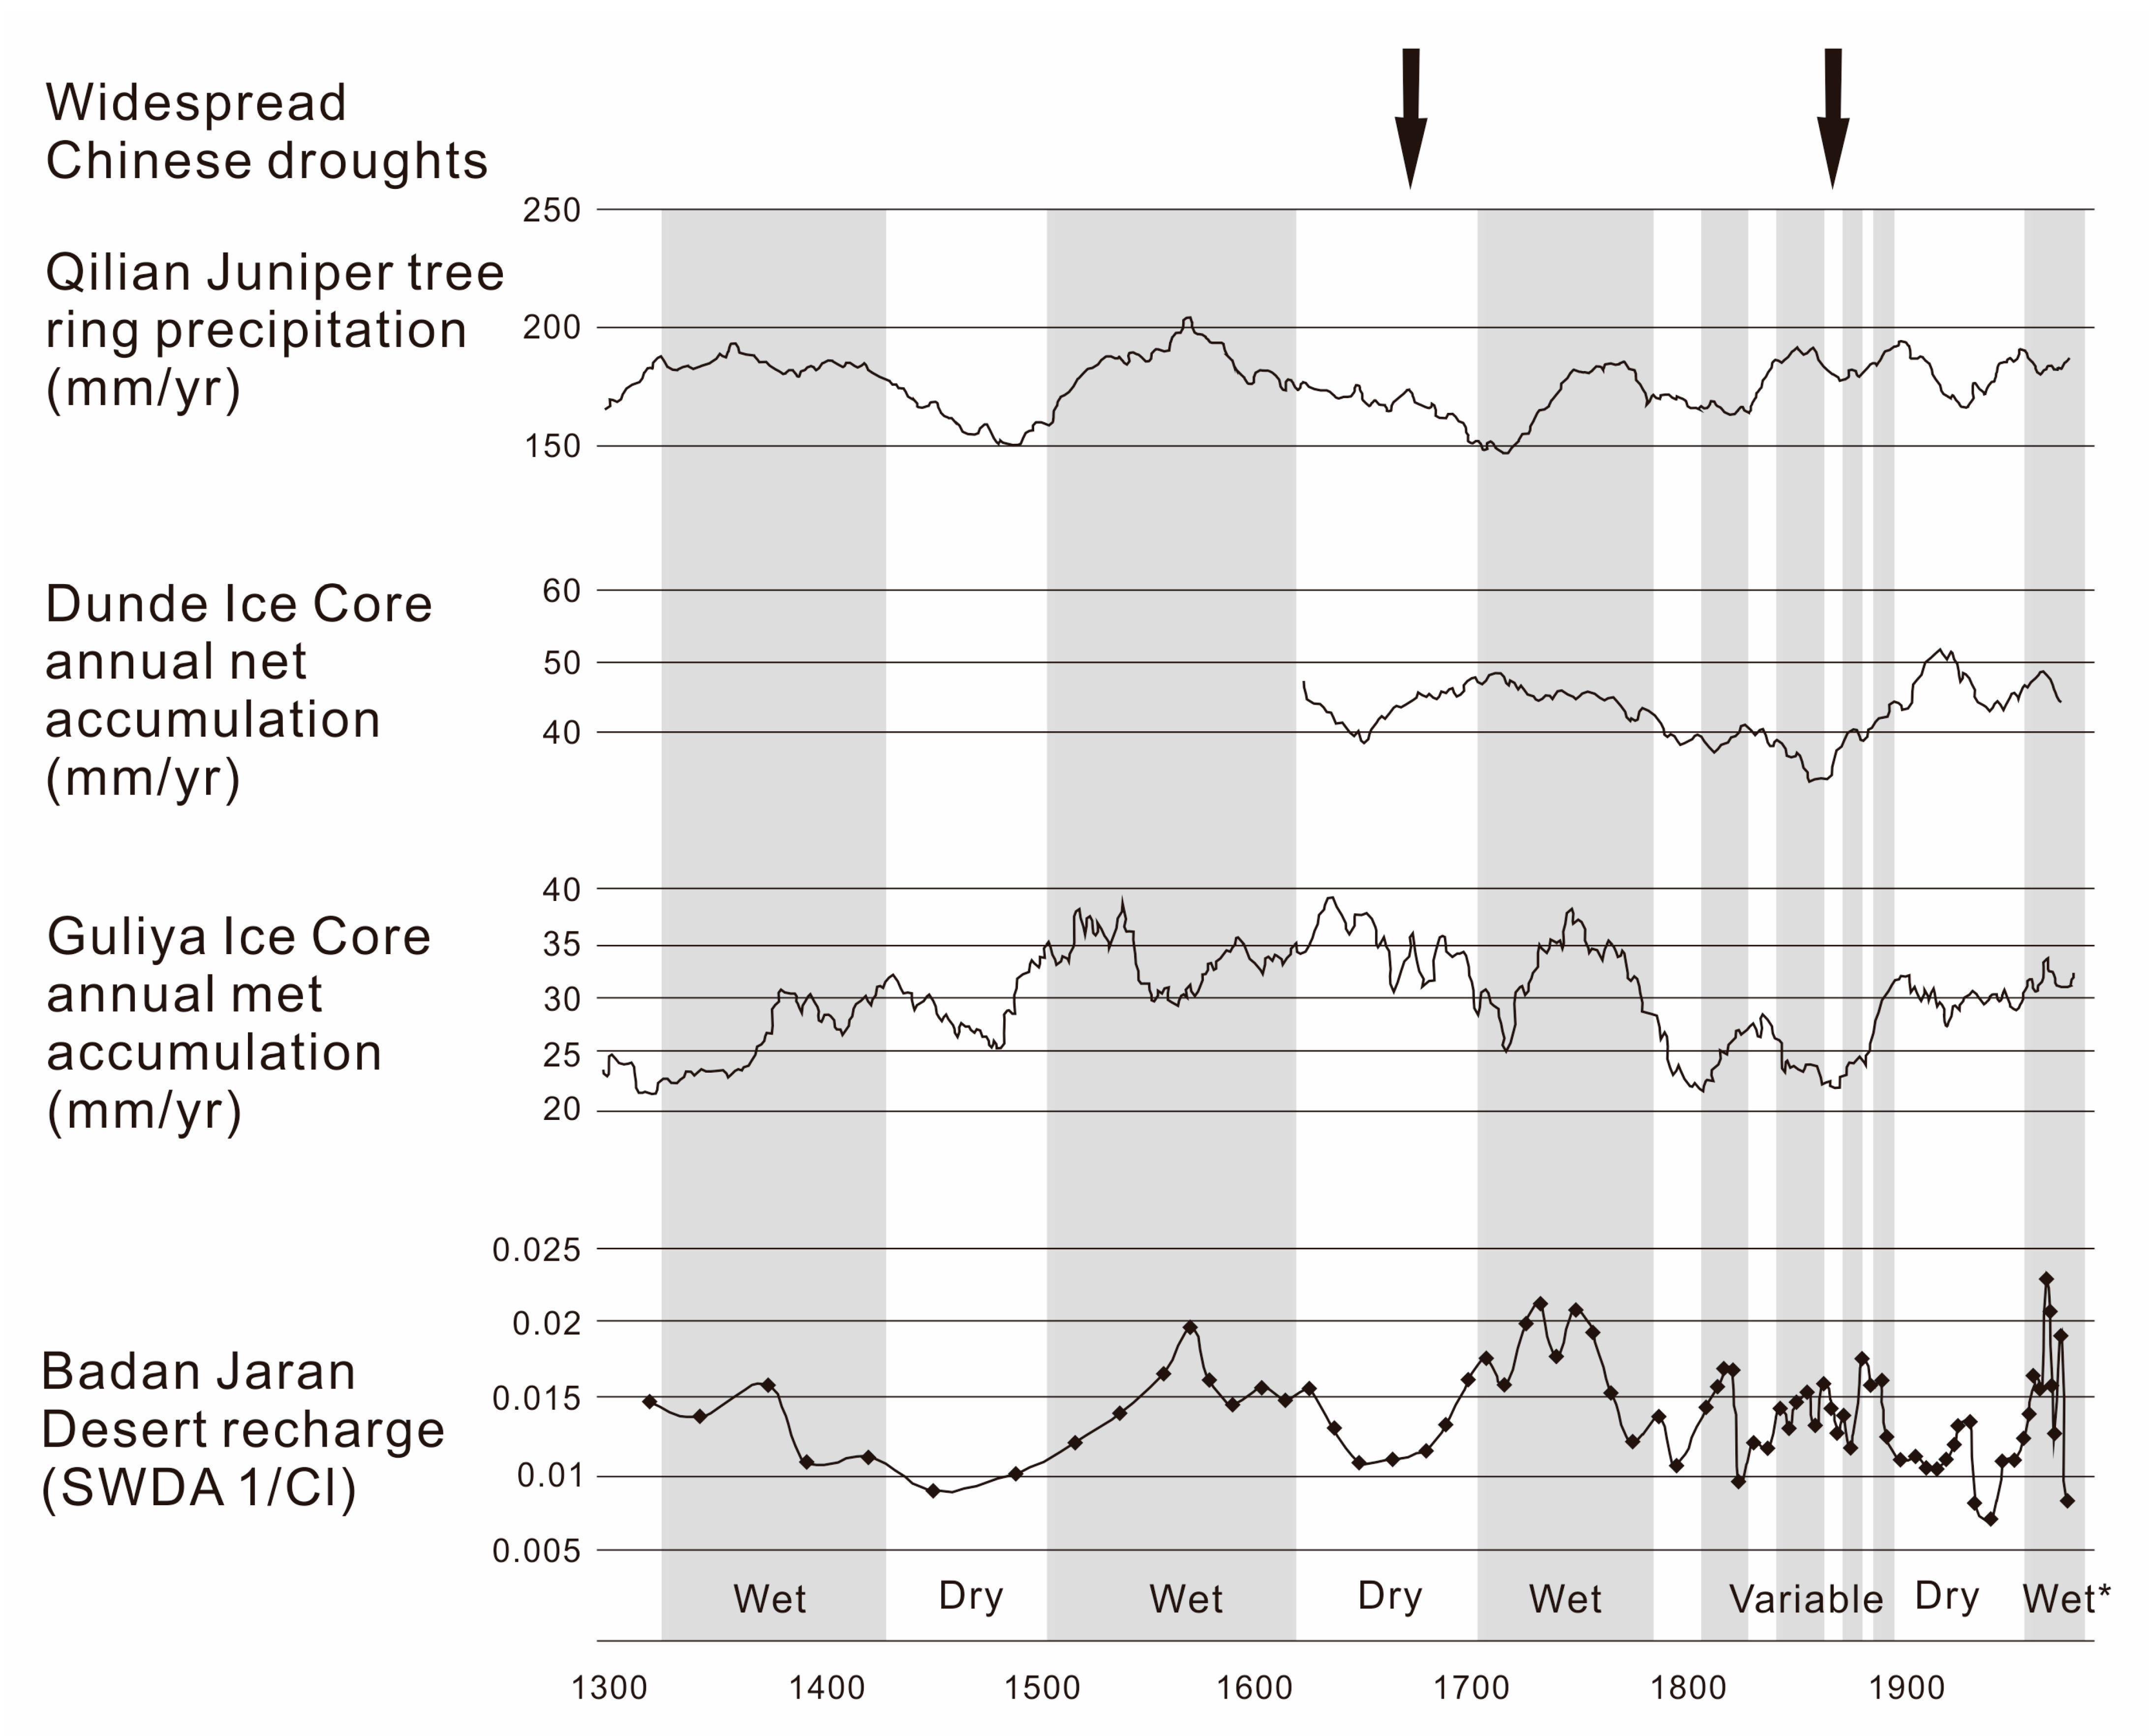
6.2. Comparison between Unsaturated Zone and Other Proxy Records

In recent years, studies have been carried out to reconstruct the high-resolution paleoenvironmental change in the Qinghai-Tibet Plateau and its northern margin areas based on ice cores, tree rings, and lake sediments [1,2,3,4,5,6,7,8,9,10,11,12,13,14,15,16,17,18,19,20,21,22,23,24]. These paleoclimate records from different proxies provide materials for environmental comparison between different regions.
Many scholars [46,51,53] have compared the unsaturated zone records from the Badain Jaran Desert with the cypress tree ring records from the Dulan area (Qilian Mountains) in the northeastern margin of the Qinghai-Tibet Plateau [4] and found that there was a good similarity between the two records on the time scales of decades to centuries (Figure 5). In the records of these two different proxies, the wettest periods occurred around 1380, 1580, 1750, and 1830~1900 AD. The SWDA profile and tree ring records indicate that the periods since 1950 have been wetter than average. This modern humid period is particularly evident in tree ring records, and the low-frequency changes in tree rings preserved during the period show that the width of tree rings are very stable and standard [109]. The peak values of tree ring records over the past 700 years represent periods of relative wetness, which correspond well to the 1/Cl peak values in the SWDA profile (Figure 5). In addition, the two also correspond well during relatively dry periods, with some exceptions. For example, the period during 1700~1730 was relatively dry in the tree ring records but relatively wet in the unsaturated zone records (Figure 5). Overall, the cross-correlation coefficient between the tree ring records (30-year moving average) and the SWDA profile record in the Qilian Mountains is greater than 0.26 over this nearly 700-year span (1324~1992 AD).
In addition, some scholars compared the records of the unsaturated zone of the Badain Jaran Desert with the ice core records of the northern Qinghai-Tibet Plateau [1,2,3] and found that there was no significant correlation between the two, although there were some parallels between these curves (Figure 5). The geographical locations of the Guliya and Dunde ice cores are both far away from the Badain Jaran Desert (2000 km and 500 km, respectively). However, since 1750 AD, the records of the desert unsaturated zone still reflect the overall characteristics of fluctuations described by the Guliya and Dunde ice cores. The Guliya ice core records match better with the unsaturated zone records in certain periods, such as 1900~1950 AD. In contrast, between about 1600 AD (the end of the Dunde ice core glacier accumulation record) and 1750 AD, the unsaturated zone records were better reflected in the Dunde ice core, both reflecting a relatively dry period around 1650.
The fluctuation of carbonate δ18O values in lase sediments can be used as a proxy for regional evaporation/precipitation ratio in lake environments [17,20,21,22,23,24]. Ma and Edmunds [51] and Gates et al. [53] compared the records of unsaturated zone of the Badain Jaran Desert with the high-resolution lake sediment records (such as the Qinghai Lake core) in the northern margin of the Qinghai-Tibet Plateau [17], and found that from 1300 AD to the present, the δ18O curves of carbonate in the fine-grained sediments from the Qinghai Lake also reflect the fluctuation pattern on a centennial scale similar to those of the Badain Jaran Desert.
In the Badain Jaran Desert, Herzschuh et al. [19] drilled a high-resolution lake core in the Baoertelegai Lake with a time span of 160 years. Currently, it is one of the few different climate proxies from the hinterland of the Badain Jaran Desert with a similar temporal resolution to the unsaturated zone records and thus can be used for comparison between them. However, after comparing the records of the SWDA, SW1, and SWSA05–16 profiles with the lake core records, Gates et al. [53] found that there were significant differences between the two records. For example, the wet period recorded in the core of the Baoertelegai Lake is not consistent with the wet period recorded in the unsaturated zone, and in many periods the two are even inversely correlated. The reason for this inconsistency is unclear.
Similarities can also be found by comparing the unsaturated zone records of the Badain Jaran Desert with the historical records of some regions in eastern China [26,110,111]. For example, the centennial-scale fluctuations recorded in the SWDA profile are remarkably similar to the humidity/dryness index fluctuations recorded in Beijing since 1450 AD based on atmospheric precipitation documents [111]. In the past 500 years, many districts and counties in China were affected by drought during two periods (1600~1650 AD and 1800~1820 AD) [26,110]. This corresponds to the low recharge period of the unsaturated zone records of the Badain Jaran Desert. During these periods, most of areas in China were under a relatively cold and dry climate, which was related to the weakening of the East Asian summer monsoon (EASM). The correspondence between the two indicates that the atmospheric precipitation recharge to the unsaturated zone of the Alashan Plateau is also driven by the monsoon changes to a large extent.
To sum up, there is a good correspondence between the recharge of atmospheric precipitation to the Badain Jaran Desert and the atmospheric precipitation reconstructed in the wetter areas of the northern Tibetan Plateau in China, indicating that the climate fluctuations on a centennial scale have occurred in the wide region from the northern margin of the Tibetan Plateau to the Alashan Plateau, and have crossed the climatic gradient in these regions. If we assume that the relationship between atmospheric precipitation and soil water recharge in the desert areas is linear and we can ignore the mixing effects of the unsaturated zone (conservative estimating), then the maximum and minimum precipitation in the past 700 to 2000 years in the Alashan Plateau and the northern margin of the Tibetan Plateau is likely to be about 150 mm/a (1975~1978 AD and 1731~1738 AD) and about 30 mm/a (1941~1947 AD), respectively.
From the perspective of the northern hemisphere (NH) scale, the studies of unsaturated zone in the Alashan Plateau in the middle latitudes of northern China have shown a close relationship between atmospheric precipitation (climate) and soil water recharge, but this is quite different from the southwest of the United States (also a mid-latitude desert of NH). Studies from the southwestern United States have shown that the unsaturated zone recharge is not sensitive to precipitation changes associated with the El Niño Southern Oscillation (ENSO) [112]. Some scholars argue that this may be caused by the large-scale expansion of regional vegetation in response to the increase of precipitation, which affects the direct recharge of the unsaturated zone [112,113]. However, in research cases from other arid and semi-arid regions around the world (such as northern Africa) [94,105], the recharge rates of unsaturated zone also respond to major fluctuations of the regional precipitation. In the cases from the Alashan Plateau, low carbon content (organic matter content) on the surface, high geomorphic stability, and intensity of wind and sand activity may inhibit the high response of vegetation to precipitation changes [53].

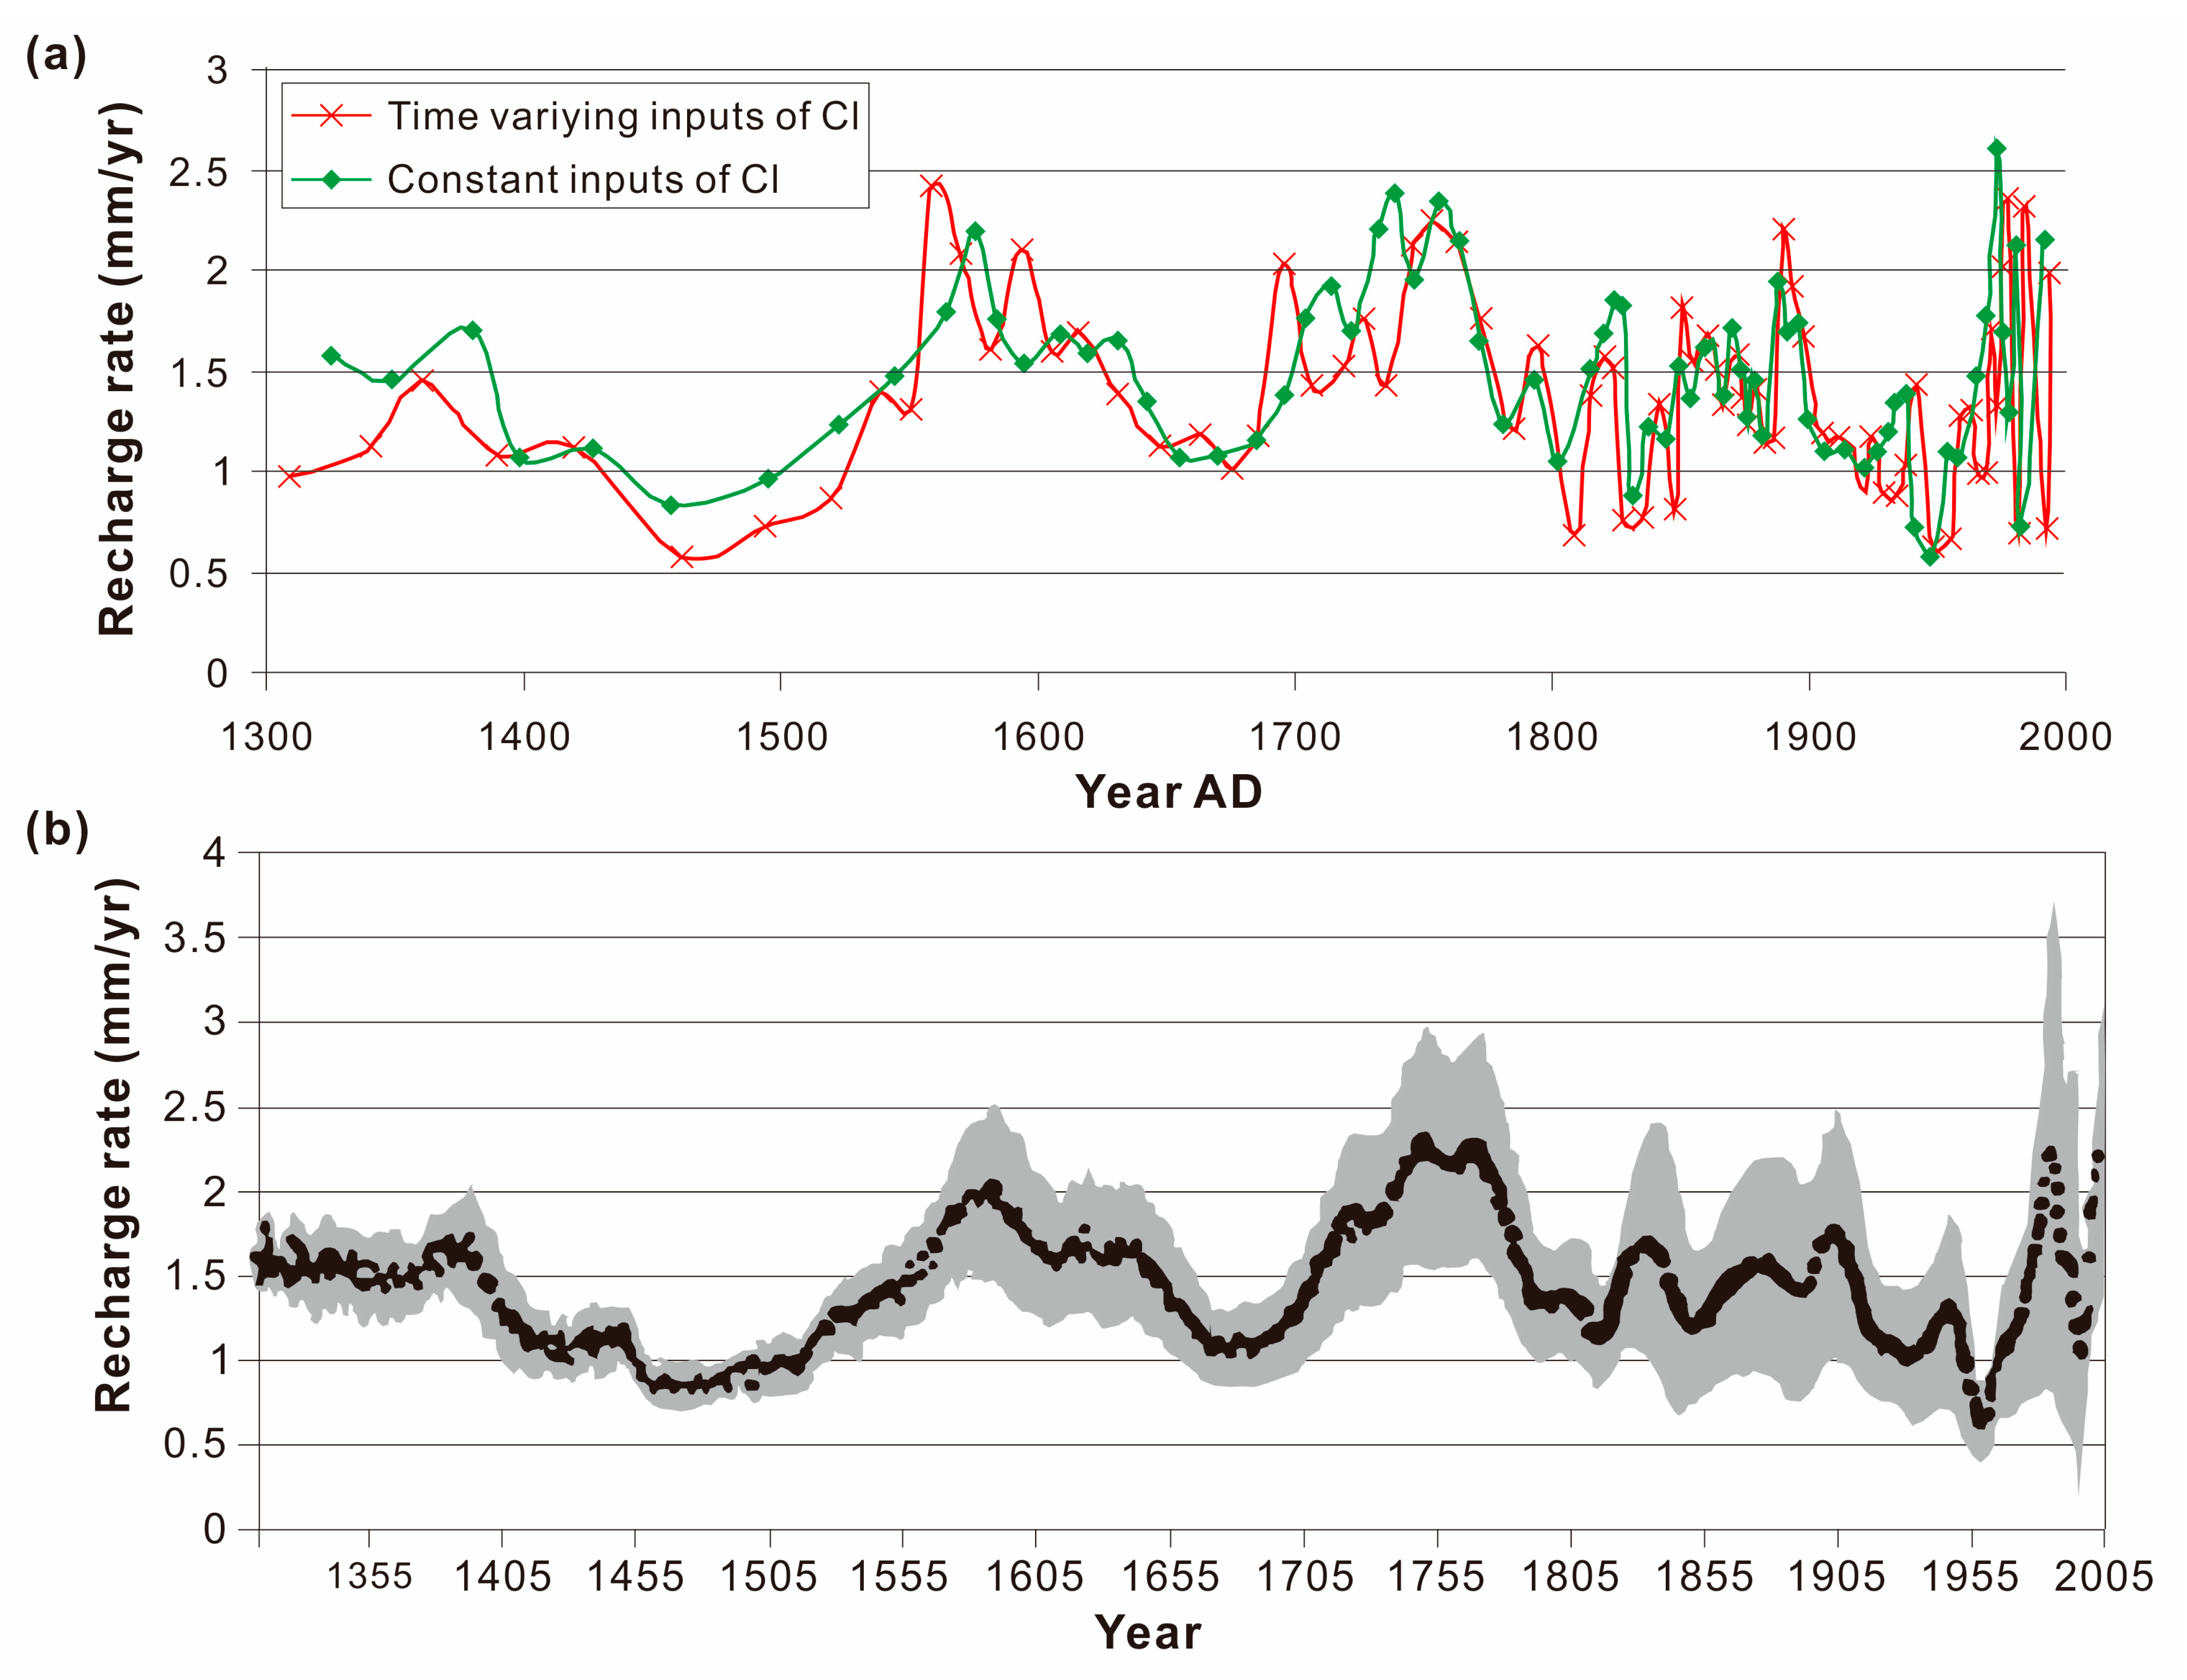
6.3. Uncertainty of Atmospheric Precipitation Recharge Records in Unsaturated Zones

Although the CMB theory has formulaic constraints on groundwater recharge, it is not so simple to quantitatively infer the recharge history from the Cl in the unsaturated zone, which has uncertainties.
On the one hand, estimation of the two parameters of recharge age and recharge rate relies on the assumption of modern atmospheric Cl input fluxes and uses them as constants to characterize their historical changes. The calculated recharge rate and ages will be very sensitive to specific Cl input fluxes. From Equation (1), it can be seen that the percentage error of the atmospheric Cl input flux is equally transmitted to the percentage error of the age data at a ratio of 1:1. It is impossible to assume that the atmospheric Cl input rate is constant and does not change over time in an actual natural environment. Therefore, this constant assumption can provide more accurate estimates of average recharge over a long-term period for regions with stable precipitation. However, in arid regions with high interannual variability of precipitation (as shown by the precipitation records from the Zhongquanzi Meteorological Station), there is a lot of errors in estimating the historical curve of recharge based on this assumption rather than the average recharge value of the period. However, Equation (1) is still frequently used at present because of the general lack of historical atmospheric deposition data in arid regions. For example, records of meteorological stations that can directly record historical changes of regional atmospheric precipitation are often very short, and only some parts of the world can exceed 100 years [114], and they are not yet in arid areas.
Therefore, to estimate the changes of paleo-atmospheric precipitation in desert areas by using the Cl mass balance equation, it is necessary to check the uncertainty of the estimated results, that is, to test the sensitivity of the estimated results to the change of atmospheric Cl input. Some hydrogeologists have simulated and compared the estimated results of the SWDA profile using three different Cl input assumption models [53]. The three models they adopted all ignore the potential effects of mixing, so the reconstructed recharge changes can be seen as conservative estimates of actual variability. In model 1, the atmospheric Cl input is constant, so the recharge history is a quasi-steady state case. In model 2, it is assumed that the atmospheric Cl input varies over time, which can be estimated based on the paleoclimate data reconstructed using other climate proxies. For example, Gates et al. [53] selected tree ring records [4] in the Dulan area of the Qilian Mountains to drive atmospheric Cl input. This is based on the fact that there is a good correlation between the 1/Cl record of the SWDA profile and the tree ring record, and both indexes are closely related to the availability of soil water. Model 2 is actually calculated by using the generalized chlorine mass balance model [87]. Model 3 is to randomly estimate the uncertainty of the Cl input equation and to evaluate the statistical significance of time-varying fluctuations.
The differences of the Cl input assumptions on recharge results between model 1 and model 2 were compared (Figure 6a). The most significant difference between the two models was the change in the peak shape, followed by the amplitude of the peak and the drift of some chronological data points, with a difference of up to 20 years at some depths. The difference between the two simulation results was obvious in the early stage of the profile records (near the base of the profile), but the two simulation results were consistent in the overall trend of the fluctuations (Figure 6a). The average precipitation in model 2 is lower than that in model 1, so the average recharge rate in model 2 is slightly higher than that in model 1 (+0.08 mm/a).
Simulation III (Figure 6b) is constituted by a Monte Carlo function between the Cl input variable and the recharge history variable derived from it, where the recharge history is calculated based on the precipitation records from the Zhongquanzi Meteorological Station. Because the uncertainty of the Cl input affects both the age and amount of the recharge, the traditional error propagation technique is chosen for calculation in simulation III, and the assumption is (1) the annual Cl precipitation is linearly correlated with the annual precipitation and (2) the interannual precipitation variability (standard deviation of observed values) from 1956 to the present also represents the interannual precipitation variability of the entire profile record history (700 years). The number of Monte Carlo iterations selected in simulation III is n = 5000, which means that each sample will reproduce the results of simulation 1 very approximately. The results of simulation 3 show that within the range of 2 times the standard deviation of the SWDA profile recharge amount, the uncertainty of the estimated recharge is within the expected range of the time-varying Cl deposition amount (Figure 6b). Although higher resolution (e.g., 10-year scale) recharge fluctuation on the profile curve cannot be identified within the range of two-fold deviation, the difference between the main humid (curve peak) and dry (curve valley) periods on centennial scales is still evident over the period from 1300 AD to the present.

6.4. A Controversial Issue: The Sources of Groundwater in the Alashan Plateau

This paper discusses the general recharge process of groundwater from atmospheric precipitation, which essentially involves the source of groundwater. Due to the complex geological landforms and the diversity of ecological landscape units in northern China, there are still many disputes over the recharge of groundwater in these regions, especially in the Alashan Plateau deserts. The core issues of them are the water sources of the interdune lakes and the reasons for the long-term stability of tall dune mountains, both of which involve the question whether the groundwater recharges the interdune lakes or not. Currently, opinions about it are still varied.
Yang and Williams [30] believed that “the direct recharge of local atmospheric precipitation” was the main source of groundwater based on the ionic chemical similarity between the lake water and shallow groundwater in the Badain Jaran Desert. Research by Jäkel [42] found that the shape of sand dunes in tall sand mountains can lead to the increase and storage of precipitation infiltration, especially the impact of the winter precipitation on groundwater recharge. This view of “winter precipitation + sand dune storage → groundwater” is consistent with the conclusion of [30]. However, Hofmann [115] speculated that there may be two independent groundwater flow systems in the Badain Jaran Desert, one of which relies on the direct recharge of atmospheric precipitation, and the other comes from external water sources outside the dune land. Chen et al. [40], based on the similarity and convergent evolution of H, O, and other stable isotope compositions between the precipitation in the northern margin of the Tibetan Plateau and groundwater in the Alashan Plateau, believed that snowmelt water (remote water source) from the Qilian Mountains in the northeast of the Tibetan Plateau may have recharged to groundwater in the Badain Jaran Desert through a series of interconnected deep fault strata and fault systems between the northern margin of the Tibetan Plateau and the Alashan Plateau over a period of about 30 years (modern recharge process). Although this assumption by Chen et al. [40] has not been supported by feasible evidence, the view of “remote water source + modern recharge” holds that groundwater in the Badain Jaran Desert is sustainable and therefore can be a new option for local water use planning. Recently, based on the tracer test of artificial precipitation infiltration (the maximum infiltration depth of 59 mm precipitation is only 46 mm), Chen et al. [116] thought that the precipitation in the Badain Jaran and Tenggeli Deserts of the Alashan Plateau could hardly penetrate into groundwater through the sand layer, so they speculated that atmospheric precipitation was not the source of groundwater recharge. Instead, groundwater moves upward in the form of membrane water (condensed water) and is a source of recharge for springs, wells, lakes, and soil water. Moreover, Ma and Edmunds [51] believed that the groundwater source of the Badain Jaran Desert may be related to the ancient water in the Yabulai Mountains on the eastern edge of the desert, which was aged older than 20 ka B.P. and formed during the last cold wet interglacial period, so the groundwater in the desert is not sustainable. Many unsaturated zone studies based on the chlorine mass balance theory have speculated that the average recharge rate of atmospheric precipitation (rainstorm or heavy precipitation) to the desert is only about 1.3~2.6 mm/a (1.7% of the atmospheric precipitation rate) in the last millennium [53], or 0.95~1.33 mm/a [51], 1.4 mm/a [52], 0.21~0.59 mm/a [46], etc. (Table 1). These values are considered to be too low compared to regional precipitation or evapotranspiration potential, so atmospheric precipitation (even heavy precipitation) should not be a main source of groundwater recharge in the desert. However, recently, Yang et al. [48] used the improved Penman formula and the meteorological data of the desert edge areas from 1961 to 2001 to systematically estimate the annual average evaporation of lake surface and dune slope (land surface) of the Badain Jaran Desert. The results showed that the annual average evaporation in the southeast region of the desert was about 1040 mm on the lake surface and only about 100 mm on the land surface, both of which were significantly lower than the evaporation estimated in the previous literature (about 4000 mm) [40]. Based on water balance, Yang et al. [48] argue that the recharge rate of atmospheric precipitation to groundwater is at least about 5 mm/a, that is, more than 5% of modern precipitation recharged to groundwater through the huge reservoir of sand mountains. This estimate appears to be much higher than the unsaturated zone recharge rate presented in Table 1.
The above digital evidence from different research perspectives is contradictory with each other, and can be generally summarized into five viewpoints, namely, the local winter atmospheric precipitation recharge, the modern recharge of remote water source from the Qinghai-Tibet Plateau, the reverse recharge of condensate water, the residual water from the ice age, and the precipitation infiltration recharge from the Yabulai Mountains. These views undoubtedly deepen people’s understanding of the complexity of groundwater recharge in the Alashan Plateau, but it is still difficult to determine whether it is ancient water or modern water recharge. One of the key reasons for the divergence of recharge sources lies in the lack of understanding and age identification of soil water movement mechanism in the unsaturated zone. Due to the significant topographic changes in the region, high dune mountains and interdune lakes are closely distributed, namely the products of arid and humid environments coexist. This contradictory phenomenon is a coupling result of compound systems in different scales with complex causes. The different results of these studies are inevitably limited by a certain multiplicity of environmental proxies at different spatial scales. Precise chronological data of water samples from different aquifers in different regions are needed to widely determine whether there are other sources of groundwater recharge. Such cases are still rare in and around the Alashan Plateau, and the widely used isotopic tracer evidence is often uncertain here. For example, on the one hand, because the isotopic ages of groundwater in different regions is generally multisolvable, such as the radioactive age based on 14C, which is often influenced by the old carbon effect (or hard water effect, carbon pool effect) and has significant errors (older) [117,118,119], and the measured tritium values in some regions are far lower than the theoretical values [45,61], it indicates that the groundwater isotopic signals in these areas are variable and both the recharge source and recharge history are not homogeneous in these regions. On the other hand, a single isotopic indicator has different values in different cases, which increases the difficulty of judgment. For example, the δ18O and δD values of lake water in the Boertaolegai Lake in the southeast of the Badain Jaran Desert have different analytical results by 5.9% and −13.9% [48], and 7.0% and 5% [51], respectively. Obviously, to solve these problems, we need to use more standardized environmental proxies to study the long-term process of water cycling and their precise response to climate change in the arid regions over time (especially since the Holocene).
Current paleoenvironmental records from different regions show that the Holocene hydroclimatic processes are also very complex and unstable in the arid northwest China, as the details of these records are quite contradictory to each other [33]. For example, it has been suggested that the arid regions of central Asia in the middle latitudes have been relatively dry since the middle Holocene (past 6000 a) [120]. In the Alashan Plateau, the sedimentary records from the southern and northern distal lakes of the Badain Jaran Desert also maintain that the middle Holocene was arid [121,122,123], but the studies from the high lakeshore of the interdune inside the desert prove that the middle Holocene was relatively humid [30,48]. There is also an obvious uncertainty here, that is, the sedimentary changes of the inland distal lake may be driven by climate change, or by the dynamic changes of the water flow into the lake (hydrological changes caused by tectonic changes, river diversion, etc.). Therefore, the Badain Jaran Desert lakes can be controlled not only by the local climate, but also by the strong impact of regional geological structure on the groundwater flow field.
In general, it is feasible to estimate climate change and groundwater recharge at different spatial scales by using the environmental records from the quasi-homogeneous unsaturated zone in the Alashan Plateau, as it has comparability with other climate proxies. However, different climate proxies often have different limitations and multiplicities when reconstructing the paleoclimate in arid areas, requiring multi-scale studies on the mechanism of land-surface processes in specific environments and the transformation functions of different climate proxies to test their availability.
The study of groundwater recharge using unsaturated zone profile records is a new method in hydrological research, which has been widely applied at present, but it is subject to certain uncertainties due to the limitation of many assumptions. In addition to the above assumptions regarding the input of atmospheric dry and wet deposition Cl in the chlorine mass balance estimation, there is also the problem of the selection of a homogeneous vadose zone (piston flow profile). On the one hand, the piston flow model is a completely idealized horizontal or plug flow, which does not exist in the actual environment, although it can be applied in the quasi-mean structural formations [71]. Secondly, the soluble salts in aeolian sediments will be affected by the wind sorting process (particle size effect) and enriched in local particle sizes [86,124,125], so it is necessary to quantify this effect on aeolian sediment profiles (such as sand dunes) and correct the final results. This study suggests that this uncertainty should be widely tested in the future by comparing deterministic data (e.g., regional reference stations) with random atmospheric Cl input background values and estimating the source of soluble salts [86]. It also needs to provide constraints on the structural homogeneity of soil unsaturated zone, the relative importance of advection and diffusion transport mechanisms of water, and the “chlorine convex profile” in characteristic periods, obtaining the sedimentological, hydraulic, and geochemical evidence. In addition, the proportion of soil and water used to extract soluble salts from the unsaturated zone and ensure the washing out of the total salt content needs further deliberation. In the case studies cited in Table 1, the soluble salt Cl in the unsaturated zone is almost all extracted based on a ratio of water to soil ratio at 3:5 (30 g water mixed with 50 g sand). It has been proved that a 5:1 water to soil ratio (50 g water to 10 g sand) may be an effective method for extracting total salts [86].

7. Conclusions

This paper reviews the tracing methods and theories selected by predecessors in relevant studies, comprehensively analyzes the effective information of groundwater recharge and related paleoclimatic dry and humidity changes in the Alashan Plateau based on existing research cases, and makes a comprehensive comparison and evaluation of the existing studies. It has been shown that there are evident fluctuations of groundwater recharge with time-varying patterns in the Badain Jaran Desert over the past 700~2000 years at centennial scales. However, these records have uncertainties, mainly derived from the assumption of atmospheric Cl solute input. These uncertainties were simulated by comparing three different Cl solute input scenarios, and the recharge history of Cl in the unsaturated zone was compared with other climatic records from ice cores, tree rings, lacustrine sediments, instrumental meteorological records, and historical documents. It was found that there was extensive correspondence between the unsaturated zone records and the climatic proxies records from other parts of northwest China. It indicates that the trend of climate change on a centennial scale continues to cross the humidity gradient in these regions. Moreover, the changes of climate humidity have also caused temporal changes of groundwater recharge in the desert. In general, these unsaturated zones have only obtained a low rate of paleo-atmospheric precipitation recharge, and the impact on the entire shallow aquifer (Quaternary) groundwater system in the region is difficult to assess at present. However, these shallow aquifers support the ecological landscapes such as oases and lakes on the Alashan Plateau. Therefore, although the variation of atmospheric precipitation recharge recorded in the unsaturated zone may not necessarily have a significant effect on regional groundwater resources, it is of great significance as an indicator of climate fluctuation, reflecting not only the large-scale changes in paleo-humidity in the hinterland, but also the impact from the oceanic monsoon system. Although the environmental indicators recorded in unsaturated zones differ significantly between the Alashan Plateau and other environmental records of surrounding areas, and their inherent uncertainties can affect their quantitative interpretation of the environment and climate, this method has potential contributions to paleoenvironmental studies worldwide. In the future, improving the chlorine mass balance theory on both temporal and spatial scales and strengthening the monitoring process of atmospheric deposition in arid areas will promote the effectiveness and utilization of this method in the hydroclimatic study in desert landscapes.

Funding

This work was financially supported by the Third Xinjiang Scientific Expedition Program (2021XJKK0803), the National Natural Science Foundation of China (No. 41930640), and the Project of the Second Comprehensive Scientific Investigation on the Qinghai–Tibet Plateau (2019QZKK1003).

Institutional Review Board Statement

Not applicable.

Informed Consent Statement

Not applicable.

Data Availability Statement

The author confirms that the data supporting the findings of this study are available within the article and the related references cited.

Acknowledgments

Thanks are also extended to Xiaoping Yang and other scholars for their academic discussions with the author and their selfless help with the author’s research work.

Conflicts of Interest

The author declare no conflict of interest.

References

  1. Yao, T.; Thompson, L. Trends and features of climatic changes in the past 5000 years recorded by the Dunde ice core. Ann. Glaciol. 1991, 16, 21–24. [Google Scholar]
  2. Thompson, L.; Mosley-Thompson, E.; Davis, M.E.; Lin, P.; Dai, J.; Bolzan, J.; Yao, T. A 1000 year climatic icecore record from the Guliya ice cap, China: Its relationship to global climate variability. Ann. Glaciol. 1995, 21, 175–181. [Google Scholar] [CrossRef]
  3. Thompson, L.O.; Yao, T.; Davis, M.E.; Henderson, K.A.; Mosley-Thompson, E.; Lin, P.N.; Beer, J.; Synal, H.A. Tropical climate instability: The last glacial cycle from a Qinghai-Tibet ice core. Science 1997, 276, 1821–1825. [Google Scholar] [CrossRef]
  4. Sheppard, P.R.; Tarasov, P.E.; Graumlich, L.J.; Heussner, K.U.; Wagner, M.; Österle, H.; Thompson, L.G. Annual precipitation since 515 BC reconstructed from living and fossil juniper growth of northeastern Qinghai Province, China. Clim. Dyn. 2004, 23, 869–881. [Google Scholar] [CrossRef]
  5. Shao, X.; Huang, L.; Liu, H.; Liang, E.Y.; Fang, X.Q.; Wang, L.L. Reconstruction of precipitation variation from tree rings in recent 1000 years in Delingha, Qinghai. Sci. China (Ser. D) 2005, 48, 939–949. [Google Scholar] [CrossRef]
  6. Liu, H.B.; Shao, X.M.; Huang, L.; Liang, E.Y.; Fang, X.; Wang, L. Statistical characteristics of annual precipitation variation during the past 1000 years in Delingha, Qinghai Province, China. Quat. Sci. 2005, 25, 176–183. [Google Scholar]
  7. Huang, L.; Shao, X.M. Precipitation variation in Delingha, Qinghai and solar activity since last 400 years. Quat. Sci. 2005, 25, 184–192. [Google Scholar]
  8. Liya, J.; Ningsheng, Q.; Xiaohua, G. Series of spring maximum temperature in Southern Qinghai Plateau and analysis of its variations during the last 450 years. Quat. Sci. 2005, 25, 193–201. [Google Scholar]
  9. Liya, J.; Ningsheng, Q.; Xiaohua, G. A 3500-year master tree-ring dating chronology from the northeastern part of the Qaidam Basin. Quat. Sci. 2007, 27, 477–485. [Google Scholar]
  10. Gou, X.H.; Yang, M.X.; Peng, J.F.; Zhang, Y.; Chen, T.; Hou, Z. Maximum temperature reconstruction for Animaqing Mountains over past 830 years based on tree-ring records. Quat. Sci. 2006, 26, 991–998. [Google Scholar]
  11. Wang, Y.; Ma, Y.; Lu, R.; Sang, Y.L.; Meng, H.W.; Hua, F.C.; Man, Z.H. Reconstruction of mean temperatures of January to August since A.D.1895 based on tree ring data in the eastern part of the Qilian Mountains. Quat. Sci. 2009, 29, 905–912. [Google Scholar]
  12. Bao, Y. Spatial and temporal patterns of climate variations over the Tibetan Plateau during the period 1300–2010. Quat. Sci. 2012, 32, 81–94. [Google Scholar]
  13. Yu, L.; Qiufang, C.; Huiming, S. Seasonal and spatial representativeness of the tree-ring based 2485-year annual mean temperature reconstruction in the northeastern Tibetan Plateau. Quat. Sci. 2013, 33, 108–114. [Google Scholar]
  14. Zhang, T.W.; Liu, Y.; Yuan, Y.J.; Wei, W.S.; Yu, S.L.; Chen, F. Tree ring based mean maximum temperature reconstruction for the Gongnaisi region on the southern slopeof the central Tienshan mountain, China since AD 1777. Quat. Sci. 2011, 31, 1011–1021. [Google Scholar]
  15. Wenshou, W.; Feng, C. Tree-ring reconstruction of annual total runoff for the Ürümqi River on the northern slope of Tien Shan Mountains. Quat. Sci. 2013, 33, 501–510. [Google Scholar]
  16. Shi, X.; Qin, N.; Liu, H.; Wang, Q.; Feng, S.; Liu, Y. Surface heating field intensity change over Tibetan Plateau recorded Qinghai Zhiduo tree rings since 1374 A.D. Quat. Sci. 2013, 33, 115–125. [Google Scholar]
  17. Zhang, J.; Jin, M.; Chen, F.; Battarbee, R.W.; Henderson, A.C.G. High-resolution precipitation variations in the northeast Tibetan Plateau over the last 800 years documented by sediment cores of Qinghai Lake. Chin. Sci. Bull. 2003, 48, 1451–1456. [Google Scholar] [CrossRef]
  18. Zhang, H.C.; Peng, J.L.; Ma, Y.Z.; Chen, G.J.; Feng, Z.D.; Li, B.; Fan, H.; Chang, F.; Lei, G.; Wünnemann, B. Late Quaternary palaeolake levels in Tengger Desert. Palaeogeogr. Palaeoclimatol. Palaeoecol. 2004, 211, 45–58. [Google Scholar] [CrossRef]
  19. Herzschuh, U.; Kürschner, H.; Battarbee, R.; Holmes, J. Desert plant pollen production and a 160-year record of vegetation and climate change on the Alashan Plateau, NW China. Veg. Hist. Archaeobot. 2006, 15, 181–190. [Google Scholar] [CrossRef]
  20. Ji, S.; Enlou, Z. Records from lakes sediments of the Qinghai Lake to Mirror climatic and environmental changes of the past about 1000 years. Quat. Sci. 2001, 21, 508–513. [Google Scholar]
  21. Liping, Z. Cold/warm fluctuations of the last 1300 years reflected by environmental magnetism in the Chen Co area, Southern Tibet. Quat. Sci. 2001, 21, 520–527. [Google Scholar]
  22. Jibin, X.; Wei, Z. Holocene climate change recorded by lacustrine sediments in Barkol Lake and its regional comparison. Quat. Sci. 2008, 28, 610–620. [Google Scholar]
  23. Wangning, L.W.; Liming, X. Oxygen isotopic compositions of carbonates of modern surface lacustrine sediments and their affecting factors in Tibet Plateau. Quat. Sci. 2008, 28, 591–600. [Google Scholar]
  24. Cao, J.; Zhang, J.W.; Zhang, C.J.; Chen, F. Environmental changes during the past 800 years recorded in lake sediments from Hala Lake on the Northern Tibetan Plateau. Quat. Sci. 2007, 27, 100–107. [Google Scholar]
  25. Yang, X. Landscape evolution and precipitation changes in the Badain Jaran Desert during the last 30,000 years. Chin. Sci. Bull. 2000, 45, 1042–1047. [Google Scholar] [CrossRef]
  26. Zhang, J.; Crowley, T.J. Historical climate records in China and reconstruction of past climates. J. Clim. 1989, 2, 833–849. [Google Scholar] [CrossRef]
  27. Gong, G.; Hameed, S. The variation of moisture conditions in China during the last 2000 years. Int. J. Climatol. 1991, 11, 271–283. [Google Scholar] [CrossRef]
  28. Feng, Z.; An, C.; Wang, H. Holocene climatic and environmental changes in the arid and semi-arid areas of China: A review. Holocene 2006, 16, 119–130. [Google Scholar] [CrossRef]
  29. Ding, Y.; Chan, J.C.L. The East Asian summer monsoon: An overview. Meteorol. Atmos. Phys. 2005, 89, 117–142. [Google Scholar]
  30. Yang, X.; Williams, M.A.J. The ion chemistry of lakes and late Holocene desiccation in the Badain Jaran Desert, Inner Mongolia, China. Catena 2003, 51, 45–60. [Google Scholar] [CrossRef]
  31. Xiaoping, Y.; Tunsheng, L. Palaeoenvironments in desert regions of northwest China around 30 ka B.P. Quat. Sci. 2003, 23, 25–30. [Google Scholar]
  32. Yang, X.; Rost, K.T.; Lehmkuhl, F.; Zhenda, Z.; Dodson, J. The evolution of dry lands in Northern China and in the Republic of Mongolia since the Last Glacial Maximum. Quat. Int. 2004, 118–119, 69–85. [Google Scholar] [CrossRef]
  33. Yang, X.; Scuderi, L.A. Hydrological and climatic changes in deserts of China since the Late Pleistocene. Quat. Res. 2010, 73, 1–9. [Google Scholar] [CrossRef]
  34. Shi, Q.; Chen, F.H.; Zhu, Y.; Madsen, D. Lake evolution of the terminal area of Shiyang River drainage in arid China since the last glaciation. Quat. Int. 2002, 93–94, 31–34. [Google Scholar] [CrossRef]
  35. An, C.; Feng, Z.; Barton, L. Dry or humid? Mid Holocene humidity changes in arid and semi-arid China. Quat. Sci. Rev. 2006, 25, 351–361. [Google Scholar] [CrossRef]
  36. Gao, Q.; Tao, Z.; Li, B.; Jin, H.; Zou, X.; Zhang, Y.; Dong, G. Palaeomonsoon variability in the southern fringe of the Badain Jaran Desert, China, since 130 ka BP. Earth Surf. Process. Landf. 2006, 31, 265–283. [Google Scholar] [CrossRef]
  37. Yang, X.; Scuderi, L.; Paillou, P.; Liu, Z.; Li, H.; Ren, X. Quaternary environmental changes in the drylands of China—A critical review. Quat. Sci. Rev. 2011, 30, 3219–3233. [Google Scholar] [CrossRef]
  38. Zongyu, C.; Jixiang, Q.; Jianming, X.; Jiaming, X.; Hao, Y.; Yunju, N. Paleoclimatic interpretation of the past 30 ka from isotopic studies of the deep confined aquifer of the North China plain. Appl. Geochem. 2003, 18, 997–1009. [Google Scholar] [CrossRef]
  39. Edmunds, W.M.; Ma, J.; Aeschbach-Hertig, W. Groundwater recharge history and hydrogeochemical evolution in the Minqin Basin, north west China. Appl. Geochem. 2006, 21, 2148–2170. [Google Scholar] [CrossRef]
  40. Chen, J.S.; Li, L.; Wang, J.Y.; Barry, D.A.; Sheng, X.F.; Gu, W.Z.; Zhao, X.; Chen, L. Groundwater maintains dune landscape. Nature 2004, 432, 459–460. [Google Scholar] [CrossRef]
  41. Ma, J.; Ding, Z.; Edmunds, W.M.; Gates, J.B.; Huang, T. Limits or recharge of groundwater from Tibetan Plateau to the Gobi Desert, implications for water management in the mountain front. J. Hydrol. 2009, 364, 128–141. [Google Scholar] [CrossRef]
  42. Jäkel, D. The importance of dunes for groundwater recharge and storage in China. Z. Geomorphol. Neues Funde Suppl. 2002, 126, 131–146. [Google Scholar]
  43. Ma, J.; Li, D.; Zhang, J.; Edmunds, W.M.; Prudhomme, C. Groundwater recharge and climatic change during the last 1000 years from unsaturated zone of SE Badain Jaran Desert. Chin. Sci. Bull. 2003, 48, 1469–1474. [Google Scholar] [CrossRef]
  44. Ma, J.; Edmunds, W.M.; He, J.; Jia, B. A 2000 year geochemical record of palaeoclimate and hydrology derived from dune sand moisture. Palaeogeogr. Palaeoclimatol. Palaeoecol. 2009, 276, 38–46. [Google Scholar] [CrossRef]
  45. Ma, J.; Pan, F.; Chen, L.; Edmunds, W.M.; Ding, Z.; He, J.; Zhou, K.; Huang, T. Isotopic and geochemical evidence of recharge sources and water quality in the Quaternary aquifer beneath Jinchang City, NW China. Appl. Geochem. 2010, 25, 996–1007. [Google Scholar] [CrossRef]
  46. Ma, J.; Wang, Y.; Zhao, Y.; Jin, X.; Ning, N.; Edmunds, W.M.; Zhou, X. Spatial distribution of chloride and nitrate within an unsaturated dune sand of a cold-arid desert: Implications for paleoenvironmental records. Catena 2012, 96, 68–75. [Google Scholar] [CrossRef]
  47. Ma, J.; He, J.; Qi, S.; Zhu, G.; Zhao, W.; Edmunds, W.M.; Zhao, Y. Groundwater recharge and evolution in the Dunhuang Basin, Northwestern China. Appl. Geochem. 2013, 28, 19–31. [Google Scholar] [CrossRef]
  48. Yang, X.; Ma, N.; Dong, J.; Zhu, B.; Xu, B.; Ma, Z.; Liu, J. Recharge to the inter-dune lakes and Holocene climatic changes in the Badain Jaran Desert, western China. Quat. Res. 2010, 73, 10–19. [Google Scholar] [CrossRef]
  49. Chen, Z.; Nie, Z.; Zhang, G.; Wan, L.; Shen, J. Environmental isotopic study on the recharge and residence time of groundwater in the Heihe River Basin, Northwestern China. Hydrogeol. J. 2006, 14, 1635–1651. [Google Scholar] [CrossRef]
  50. Lin, R.; Wei, K. Tritium profiles of pore water in the Chinese loess unsaturated zone: Implications for estimation of groundwater recharge. J. Hydrol. 2006, 328, 192–199. [Google Scholar] [CrossRef]
  51. Ma, J.; Edmunds, W.M. Groundwater and lake evolution in the Badain Jaran desert ecosystem, Inner Mongolia. Hydrogeol. J. 2006, 14, 1231–1243. [Google Scholar] [CrossRef]
  52. Gates, J.B.; Edmunds, W.M.; Ma, J.; Scanlon, B.R. Estimating groundwater recharge in a cold desert environment in Northern China using chloride. Hydrogeol. J. 2008, 16, 893–910. [Google Scholar] [CrossRef]
  53. Gates, J.B.; Edmunds, W.M.; Ma, J.; Sheppard, P.R. A 700-year history of groundwater recharge in the drylands of NW China. Holocene 2008, 18, 1045–1054. [Google Scholar] [CrossRef]
  54. Gates, J.B.; Edmunds, W.M.; Darling, W.G.; Ma, J.; Pang, Z.; Young, A.A. Conceptual model of recharge to southeastern Badain Jaran Desert groundwater and lakes from environmental tracers. Appl. Geochem. 2008, 23, 3519–3534. [Google Scholar] [CrossRef]
  55. Huang, T.; Pang, Z. Estimating groundwater recharge following land-use change using chloride mass balance of soil profiles: A case study at Guyuan and Xifeng in the Loess Plateau of China. Hydrogeol. J. 2011, 19, 177–186. [Google Scholar] [CrossRef]
  56. Huang, T.; Pang, Z.; Edmunds, W.M. Soil profile evolution following land-use change: Implications for groundwater quantity and quality. Hydrol. Process. 2013, 27, 1238–1252. [Google Scholar] [CrossRef]
  57. Yang, X. Water chemistry of the lakes in the Badain Jaran Desert and their Holocene evolutions. Quat. Sci. 2002, 22, 97–104. [Google Scholar]
  58. Nina, M.; Xiaoping, Y. Environmental isotopes and ion chemistry in the Badain Jaran Desert, Inner Mongolia and their implications. Quat. Sci. 2008, 28, 702–711. [Google Scholar]
  59. Feng, H.; Lu, H.Y.; Yi, S.W.; Zeng, L.; Qiu, Z.M.; Cui, M.C. The border changes of the deserts/sand field in the East Asian monsoon marginal region during Last Glacial Maximum and Holocene Optimum. Quat. Sci. 2013, 33, 252–259. [Google Scholar]
  60. Yu, K.; Lu, H.; Lehmkuhl, F. A preliminary quantitative paleoclimate reconstruction of the Last Glacial Maximum and Holocene Optimum in dune fields of Northern China. Quat. Sci. 2013, 33, 293–302. [Google Scholar]
  61. Ma, J.Z.; Ding, Z.; Gates, J.B.; Su, Y. Chloride and the environmental isotopes as the indicators of the groundwater recharge in the Gobi Desert, Northwest China. Environ. Geol. 2008, 55, 1407–1419. [Google Scholar] [CrossRef]
  62. Ma, L. Geological Atlas of China; Geological Press: Beijing, China, 2002. [Google Scholar]
  63. Winograd, I.J.; Robertson, F.N. Deep oxygenated groundwater: Anomaly or common occurrence? Science 1982, 216, 1227–1230. [Google Scholar] [CrossRef] [PubMed]
  64. Cook, P.G.; Edmunds, W.M.; Gaye, C.B. Estimating paleorecharge and paleoclimate from unsaturated zone profiles. Water Resour. Res. 1992, 28, 2721–2731. [Google Scholar] [CrossRef]
  65. Beyerle, U.; Rueedi, J.; Leuenberger, M.; Aeschbach-Hertig, W.; Peeters, F.; Kipfer, R.; Dodo, A. Evidence for periods of wetter and cooler climate in the Sahel between 6 and 40 kyr BP derived from groundwater. Geophys. Res. Lett. 2003, 30, 1173. [Google Scholar] [CrossRef]
  66. Edmunds, W.M.; Guendouz, A.H.; Mamou, A.; Moulla, A.; Shand, P.; Zouari, K. Groundwater evolution in the Continental Intercalaire aquifer of Southern Algeria and Tunisia: Trace element and isotopic indicators. Appl. Geochem. 2003, 18, 805–822. [Google Scholar] [CrossRef]
  67. Ma, J.; Wang, X.; Edmunds, W.M. The characteristics of groundwater resources and their changes under the impacts of human activity in the arid North-West China—A case study of the Shiyang River Basin. J. Arid. Environ. 2005, 61, 277–295. [Google Scholar] [CrossRef]
  68. Scanlon, B.R.; Tyler, S.W.; Wierenga, P.J. Hydrologic issues in arid, unsaturated systems and implication for contaminant transport. Rev. Geophys. 1997, 35, 461–490. [Google Scholar] [CrossRef]
  69. Allison, G.B.; Hughes, M.W. The use of natural tracers as indicators of soil-water movement in a temperate semi-arid region. J. Hydrol. 1983, 60, 157–173. [Google Scholar] [CrossRef]
  70. Scanlon, B.R. Evaluation of moisture flux from chloride data in desert soils. J. Hydrol. 1991, 128, 137–156. [Google Scholar] [CrossRef]
  71. Scanlon, B.R.; Healy, R.W.; Cook, P.G. Choosing appropriate techniques for quantifying groundwater recharge. Hydrogeol. J. 2002, 10, 18–39. [Google Scholar] [CrossRef]
  72. Ng GH, C.; McLaughlin, D.; Entekhabi, D.; Scanlon, B. Using data assimilation to identify diffuse recharge mechanisms from chemical and physical data in the unsaturated zone. Water Resour. Res. 2009, 45, W09409. [Google Scholar] [CrossRef]
  73. Allison, G.B.; Stone, W.J.; Hughes, M.W. Recharge in karst and dune elements of a semi-arid landscape as indicated by natural isotopes and chloride. J. Hydrol. 1985, 76, 1–25. [Google Scholar] [CrossRef]
  74. Tyler, S.W.; Chapman, J.B.; Conrad, S.H.; Hammermeister, D.P.; Blout, D.O.; Miller, J.J.; Sully, M.J.; Ginanni, J.M. Soil-water flux in the southern Great Basin, United States: Temporal and spatial variations over the last 120,000 years. Water Resour. Res. 1996, 32, 1481–1499. [Google Scholar] [CrossRef]
  75. Scanlon, B.R. Uncertainties in estimating water fluxes and residence times using environmental tracers in an arid unsaturated zone. Water Resour. Res. 2000, 36, 395–409. [Google Scholar] [CrossRef]
  76. Edmunds, W.M.; Tyler, S.W. Unsaturated zone as archives of past climates: Toward a new proxy for continental regions. Hydrogeol. J. 2002, 10, 216–228. [Google Scholar] [CrossRef]
  77. Allison, G.B.; Hughes, M.W. The use of environmental chloride and tritium to estimate total recharge to an unconfined aquifer. Austrian J. Soil Res. 1978, 16, 181–195. [Google Scholar] [CrossRef]
  78. Ross, B. A conceptual model of deep unsaturated zones with negligible recharge. Water Resour. Res. 1984, 20, 1627–1629. [Google Scholar] [CrossRef]
  79. Walvoord, M.A.; Plummer, M.A.; Phillips, F.M.; Wolfsberg, A.V. Deep arid system hydrodynamics 1. Equilibrium states and response times in thick desert vadose zones. Water Resour. Res. 2002, 38, 1308. [Google Scholar] [CrossRef]
  80. Scanlon, B.R.; Keese, K.; Reedy, R.C.; Simunek, J.; Andraski, B.J. Variations in flow and transport in thick desert vadose zones in response to paleoclimatic forcing (0–90 kyr): Field measurements, modeling, and uncertainties. Water Resour. Res. 2003, 39, 1179. [Google Scholar] [CrossRef]
  81. Hem, J.D. Study and Interpretation of the Chemical Characteristics of Natural Water; US Geological Survey Water Supply: New York, NY, USA, 1985.
  82. Feth, J.H. Chloride in Natural Continental Water—A Review; US Geological Survey Water Supply: New York, NY, USA, 1981.
  83. Lehmann, B.E.; Love, A.; Purtschert, R.; Collon, P.; Loosli, H.H.; Kutschera, W.; Beyerle, U.; Aeschbach, W.; Kipfer, R.; Frape, S.K.; et al. A comparison of groundwater dating with 81Kr, 36Cl and 4He in four wells of the Great Artesian Basin, Australia. Earth Planet. Sci. Lett. 2003, 211, 237–250. [Google Scholar] [CrossRef]
  84. Dettinger, M.D. Reconnaissance estimates of natural recharge to desert basins in Nevada, USA., by using chloride balance calculations. J. Hydrol. 1989, 106, 55–78. [Google Scholar] [CrossRef]
  85. Selaolo, E.; Gieske, A.; Beekman, H. Chloride Deposition and Recharge Rates for Shallow Groundwater Basins in Botswana. In National Conference Publication; Institute of Engineers: Barton, Australia, 1994; pp. 501–506. [Google Scholar]
  86. Zhu, B.; Yang, X. The origin and distribution of soluble salts in the sand seas of northern China. Geomorphology 2010, 123, 232–242. [Google Scholar] [CrossRef]
  87. Ginn, T.R.; Murphy, E.M. A transient flux model for convection infiltration: Forward and inverse solution for chloride mass balance studies. Water Resour. Res. 1997, 33, 2065–2079. [Google Scholar] [CrossRef]
  88. Phillips, F.M.; Mattick, J.L.; Duval, T.A.; Elmore, D.; Kubik, P.W. Chlorine 36 and tritium from nuclear weapons fallout as tracers for long-term liquid and vapor movement in desert soils. Water Resour. Res. 1988, 24, 1877–1891. [Google Scholar] [CrossRef]
  89. Sukhija, B.S.; Shah, C.R. Conformity of groundwater recharge rate by tritium method and mathematical modeling. J. Hydrol. 1976, 30, 167–178. [Google Scholar] [CrossRef]
  90. Dincer, T.; AI-Mugrin, A.; Zimmerman, U. Study of the infiltration and recharge through the sand dunes in arid zones with special reference to the stable isotopes and thermonuclear tritium. J. Hydrol. 1974, 23, 79–109. [Google Scholar] [CrossRef]
  91. Smith, B.D.; Wearn, P.L.; Richards, H.J.; Rowe, P.C. Water Movement in the Unsaturated Zone of High and Low Permeability Strata by Measuring Natural Tritium; Isotope and Hydrology Processes Symposium: Vienna, Austria, 1970; pp. 73–87. [Google Scholar]
  92. Zimmermann, U.; Munnich, K.O.; Roether, W. Downward movement of soil moisture traced by means of hydrogen isotopes. Geophys. Monogr. Am. Geophys. Union 1967, 11, 28–36. [Google Scholar]
  93. Eriksson, E.; Khunakasem, V. Chloride concentration in groundwater, recharge rate and rate of deposition of chloride in the Israel Coastal Plain. J. Hydrol. 1969, 7, 178–197. [Google Scholar] [CrossRef]
  94. Edmunds, W.M.; Walton, N.R.G. A geochemical and isotopic approach to recharge evaluation in semi-arid zones, past and present. In Arid Zone Hydrology, Investigations with Isotope Techniques; International Atomic Energy Agency: Vienna, Austria, 1980; pp. 47–68. [Google Scholar]
  95. Kitching, R.; Edmunds, W.M.; Shearer, T.R.; Walton, R.G.; Jacovides, J. Assessment of recharge to aquifers. Hydrol. Sci. Bull. 1980, 25, 217–235. [Google Scholar] [CrossRef]
  96. Nativ, R.; Eilan, A.; Ofer, D.; Geyh, M. Water recharge and solute transport through the vadose zone of fractured chalk under desert conditions. Water Resour. Res. 1995, 31, 253–261. [Google Scholar] [CrossRef]
  97. Gaye, C.B.; Edmunds, W.M. Groundwater recharge estimation using chloride, stable isotopes and tritium profiles in the sands of northwestern Senegal. Environ. Geol. 1996, 27, 246–251. [Google Scholar] [CrossRef]
  98. Jolly, I.D.; Cook, P.G.; Allison, G.B.; Hughes, M.W. Simultaneous water and solute movement through an unsaturated soil following an increase in recharge. J. Hydrol. 1989, 111, 391–396. [Google Scholar] [CrossRef]
  99. Edmunds, W.M.; Gaye, C.B. Estimating the spatial variability of groundwater recharge in the Sahel using chloride. J. Hydrol. 1994, 156, 47–59. [Google Scholar] [CrossRef]
  100. Bromley, J.; Edmunds, W.M.; Fellman, E.; Brouwer, J.; Gaze, S.R.; Sudlow, J.; Taupin, J.D. Estimation of rainfall inputs and direct recharge to the deep unsaturated zone of southern Niger using the chloride profile method. J. Hydrol. 1997, 188–189, 139–154. [Google Scholar] [CrossRef]
  101. De Vries, J.J.; Selaolo, E.T.; Beekman, H.E. Groundwater recharge in the Kalahari, with reference to paleo-hydrologic conditions. J. Hydrol. 2000, 238, 110–123. [Google Scholar] [CrossRef]
  102. Joshi, B.; Maule, C. Simple analytical models for interpretation of environmental tracer profiles in the vadose zone. Hydrol. Process. 2000, 14, 1503–1521. [Google Scholar] [CrossRef]
  103. Walvoord, M.A.; Phillips, F.M.; Stonestrom, D.A.; Evans, R.D.; Hartsough, P.C.; Newman, B.D.; Striegl, R.G. A reservoir of nitrate beneath desert soils. Science 2003, 302, 1021–1024. [Google Scholar] [CrossRef]
  104. Phillips, F.M. Environmental tracers for water movement in desert soils of the American Southwest. Soil Sci. Soc. Am. J. 1994, 58, 14–24. [Google Scholar] [CrossRef]
  105. Edmunds, W.M.; Gaye, C.B.; Fontes, J.C. A record of climatic and environmental change contained in the interstitial waters from the unsaturated zone of northern Senegal. In International Symposium on Isotope Techniques in Water Resources Development; International Atomic Energy Agency: Vienna, Austria, 1992. [Google Scholar]
  106. Stone, W.J. Paleohydrologic implications of some deep soil water chloride profiles, Murray Basin, South Australia. J. Hydrol. 1992, 132, 201–223. [Google Scholar] [CrossRef]
  107. Goni, I.B.; Fellman, E.; Edmunds, W.M. Rainfall geochemistry in the Sahel region of northern Nigeria. Atmos. Environ. 2001, 35, 4331–4339. [Google Scholar] [CrossRef]
  108. EANET, Network Center for 2006 EANET Data on the Acid Deposition in the East Asian Region in 2006. Acid Deposition Monitoring Network in East Asia. Available online: http://www.eanet.cc/ (accessed on 1 June 2007).
  109. Sheppard, P.; Holmes, R.; Graumlich, L. The ‘many fragments curse’: A special case of the segment length curse. Tree-Ring Bull. 1997, 54, 1–9. [Google Scholar]
  110. SMAC (State Meteorological Administration of China). Annals of 510 Years’ Precipitation Record in China; The Meteorological Research Institute: Tsukuba, Japan, 1981; p. 216.
  111. Hameed, S.; Yeh, W.M.; Li, M.T.; Cess, R.D.; Wang, W.C. An analysis of periodicities in the 1470–1974 Beijing precipitation record. Geophys. Res. Lett. 1983, 10, 436–439. [Google Scholar] [CrossRef]
  112. Scanlon, B.R.; Keese, K.E.; Flint, A.L.; Flint, L.E.; Gaye, C.B.; Edmunds, W.M.; Simmers, I. Global synthesis of groundwater recharge in semiarid and arid regions. Hydrol. Process. 2006, 20, 3335–3370. [Google Scholar] [CrossRef]
  113. Lotsch, A.; Friedl, M.A.; Anderson, B.T.; Tucker, C.J. Coupled vegetation–precipitation variability observed from satellite and climate records. Geophys. Res. Lett. 2003, 30, 1774. [Google Scholar] [CrossRef]
  114. IPCC. Climate Change 2007—The Physical Science Basis. Contribution of Working Group II to the Fourth Assessment Report of the Intergovernment Panel on Climate Change; Cambridge University Press: Cambridge, UK; New York, NY, USA, 2007. [Google Scholar]
  115. Hofmann, J. Geoökologische Untersuchungen der Gewässer im Südosten der Badain Jaran Wüste [Geoecological studies of the waters of the southeastern Badain Jaran Desert]. Berl. Geogr. Abhandl 1999, 64, 1–247. [Google Scholar]
  116. Jiansheng, C.; Xixi, C.; Ting, W. Isotopes tracer research of wet sand layer water souces in Alxa Desert. Adv. Water Sci. 2014, 25, 196–206. [Google Scholar]
  117. Deevey, E.S.; Cross, M.S.; Hutchinson, G.E. The natural 14C contents of materials from hard-water lakes. Proc. Natl. Acad. Sci. USA 1954, 40, 285–288. [Google Scholar] [CrossRef]
  118. Liu, Z.; Yang, X.; Zhu, B. Reinterpretation of the chronological data of palaeo-environmental records in the Badain Jaran Desert and reconstruction of the Holocene climatic changes. Quat. Sci. 2010, 30, 925–933. [Google Scholar]
  119. Hou, J.; William, J.; Andrea, D.; Liu, Z. Geochronological limitations for interpreting the paleoclimatic history of the Tibetan Plateau. Quat. Sci. 2012, 32, 441–453. [Google Scholar]
  120. Lauterbach, S.; Witt, R.; Plessen, B.; Dulski, P.; Prasad, S.; Mingram, J.; Gleixner, G.; Hettler-Riedel, S.; Stebich, M. Bernhard Schnetger Climatic imprint of the mid-latitude westerlies in the central Tian Shan of Kyrgyzstan and teleconnections to North Atlantic climate variability during the last 6000 years. Holocene 2014, 24, 970–984. [Google Scholar] [CrossRef]
  121. Chen, F.; Wu, W.; Holmes, J.A.; Madsen, D.B.; Zhu, Y.; Jin, M.; Oviatt, C.G. A mid-Holocene drought interval as evidenced by lake desiccation in the Alashan Plateau, Inner Mongolia, China. Chin. Sci. Bull. 2003, 48, 1401–1410. [Google Scholar] [CrossRef]
  122. Chen, F.; Yu, Z.; Yang, M.; Ito, E.; Wang, S.; Madsen, D.B.; Huang, X.; Zhao, Y.; Sato, T.; Birks, H.J.B. Holocene moisture evolution in arid central Asia and its out-of-phase relationship with Asian monsoon history. Quat. Sci. Rev. 2008, 27, 351–364. [Google Scholar] [CrossRef]
  123. Hartmann, K.; Wünnemann, B. Hydrological changes and Holocene climate variations in NW China, inferred from lake sediments of Juyanze palaeolake by factor analyses. Quat. Int. 2009, 194, 28–44. [Google Scholar] [CrossRef]
  124. Zhu, B.; Yang, X.; Liu, Z.; Rioual, P.; Li, C.; Xiong, H. Geochemical compositions of soluble salts in aeolian sands from the Taklamakan and Badanjilin deserts in Northern China, and their influencing factors and environmental implications. Environ. Earth Sci. 2012, 66, 337–353. [Google Scholar] [CrossRef]
  125. Zhu, B.; Yang, X.; Rioual, P.; Liu, Z.; Li, C.; Xiong, H. Compositions of soluble salts in aeolian sands from sandy deserts of Northern China and their environmental implications. Quat. Sci. 2011, 31, 1029–1044. [Google Scholar]
Figure 1. Distribution map of sandy deserts and the precipitation gradient in northern China (upper map) and brief geomorphological map of the Alashan Plateau (nether map).
Atmosphere 14 00774 g001
Figure 2. Distribution of Cl and water content with depth in the SWDA and SW1 profiles in the Badain Jaran Desert (the plot of the SWDA profile was modified from [53], and the SW1 was modified from [51]).
Atmosphere 14 00774 g002
Figure 3. Atmospheric precipitation recorded at the Zhongquanzi Meteorological Station from 1955 to 2000 and the 1/Cl curve recorded in the SWDA profile (modified from [51,53]).
Atmosphere 14 00774 g003
Figure 4. The recharge histories of unsaturated profiles between the SWDA profile (modified from [53]) and the SW1 profile (modified from [51]) in the Badain Jaran Desert. The gray shaded columns represent several fluctuation events of paleo-atmospheric precipitation on the centennial scale that occur together on two curves, suggesting a relatively wet environment.
Atmosphere 14 00774 g004
Figure 5. Comparison of multi-proxy records of paleoclimate between the Alashan Plateau and the northern margin of the Qinghai-Tibet Plateau (modified from references [51,53]). The tree ring records were cited from [4] and the ice core records were cited from [1,2,3]. The accumulation rate of the ice core shows a moving average of 30 years. The gray shaded columns represent several fluctuation events of paleo-atmospheric precipitation on the centennial scale that occur together on these different proxies’ curves, suggesting a relatively wet environment.
Atmosphere 14 00774 g005
Figure 6. Comparison of recharge rates estimated by constant and time-varying Cl input assumptions (a) and the results of Monte Carlo simulation (b) of the evaluated SWDA recharge rates in the Badain Jaran Desert (modified from reference [53]).
Atmosphere 14 00774 g006
Table 1. Geologic records of dune unsaturated zone in the hinterland and surrounding areas of the Badain Jaran Desert.
Section IDSection PositionElevation/Altitude
(m a.s.l.)
Groundwater Level (m)Depth of Profile (m)Mean Water Content (Dry Weight%)Mean Cl Content (mg L−1)Surface Cl Peak Value (mg m−2)Chronological Dating (a)Mean Recharge Rate (mm a−1)References
Hinterland in the Badain Jaran Desert
SWDASand dunes near Sayinwusu Lake1270~30~302.1%9315266811.35Reference [53]
SW1Sand dunes near Sayinwusu Lake1245/22.53.5168/11850.95Reference [51]
BYBSSand dunes near Bayanor Lake1218/304138/20500.91Reference [44]
BA1Sand dunes near Lake Bortolgoi//7.47.0100.4/5201.33References [43,51]
BA 2Sand dunes near Lake Bortolgoi/0105.9106.2/8121.26References [43,51]
BYGSSand dunes near Wulanji Lake1255/10.51~2589/11480.21Reference [46]
BYDSSand dunes near Wulanji Lake1203/10.51~2213/5720.59Reference [46]
BYESSand dunes near Wulanji Lake1309/10.51~2232/5840.54Reference [46]
BYFSSand dunes near Wulanji Lake1336/71~2267/3650.47Reference [46]
SH1Sand dunes near Lake Suhete/0103.5120/8761.11Reference [61]
SH2Sand dunes near Lake Suhete//204.2127/16601.05Reference [61]
BB1Sand dunes near Badain Jilin Temple//201.9165/10210.81Reference [61]
SWSA05-16Sand dunes near Sayinwusu Lake12190162.41205148~3001.12Reference [52]
SWSC05-10Sand dunes near Sayinwusu Lake122510102.8805190~2001.68Reference [52]
SWSD05-10Sand dunes near Sayinwusu Lake126050101.91117590~1801.2Reference [52]
SWSE05-10Sand dunes near Sayinwusu Lake122310101.5872189~1101.54Reference [52]
SWSF05-10Sand dunes near Sayinwusu Lake123320102.2103N/A~2301.29Reference [52]
BASH05-10Sand dunes near Badan Lake122210102.289699~2301.50Reference [52]
BASI05-08Sand dunes near Badan Lake1209082.8761954/1.76Reference [52]
BASJ05-10Sand dunes near Badan Lake122210102.81649930~2000.82Reference [52]
BASK05-06Sand dunes near Badan Lake1201561.9N/AN/A/N/AReference [52]
BASM05-10Sand dunes near Badan Lake128780102.21115838~2001.20Reference [52]
BASN05-09Sand dunes near Badan Lake12827092.1N/A27,753/N/AReference [52]
BLSO05-07Sand dunes near Lake Bortolgoi1297072.3N/A8105/N/AReference [52]
BLSP05-10Sand dunes near Lake Bortolgoi132035101.96911,306~1301.92Reference [52]
BLSQ05-09Sand dunes near Lake Bortolgoi13203592.39712,729~1601.37Reference [52]
BLST05-10Sand dunes near Lake Bortolgoi13234082.862N/A~1302.16Reference [52]
YTSU05-09Sand dunes near Lake Yindertu12082592.0109N/A~2701.23Reference [52]
NTSV05-10Sand dunes near Noertu Lake12214091.8N/AN/A/N/AReference [52]
NTSW05-10Sand dunes near Lake Yindertu121525102.671N/A~2101.88Reference [52]
Surrounding the Badain Jaran Desert
BeituMinqin Basin in Maowusu Sandy Land// /194//2.17Reference [39]
TG-2North of Tengger Desert//2.82.2273/881.06Reference [41]
TG-3North of Tengger Desert//172.5193/6631.49Reference [41]
WU-1Western edge of Tengger Desert (Wuwei)//13.53117/2132.46Reference [41]
G1Loess Plateau (Ningxia Guyuan)//14.2517.37.7//100Reference [55]
G1-2Loess Plateau (Ningxia Guyuan)//716.28.1/76594Reference [56]
G2-1Loess Plateau (Ningxia Guyuan)//11.2515.213.9///Reference [56]
G2-2Loess Plateau (Ningxia Guyuan)//18.2516.415.4///Reference [56]
G3Loess Plateau (Ningxia Guyuan)//79.589.1///Reference [56]
Disclaimer/Publisher’s Note: The statements, opinions and data contained in all publications are solely those of the individual author(s) and contributor(s) and not of MDPI and/or the editor(s). MDPI and/or the editor(s) disclaim responsibility for any injury to people or property resulting from any ideas, methods, instructions or products referred to in the content.

