Article

Quantifying the Source Attribution of PM10 Measured Downwind of the Oceano Dunes State Vehicular Recreation Area

1
Division of Atmospheric Sciences, Desert Research Institute, Reno, NV 89512, USA
2
San Luis Obispo County Air Pollution Control District, San Luis Obispo, CA 93401, USA
*
Author to whom correspondence should be addressed.
Atmosphere 2023, 14(4), 718; https://doi.org/10.3390/atmos14040718
Submission received: 23 March 2023 / Revised: 11 April 2023 / Accepted: 12 April 2023 / Published: 15 April 2023
(This article belongs to the Section Air Quality)

Abstract

:
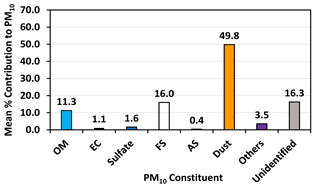
A measurement campaign was undertaken April–October 2021 using PM10 filter samplers to collect 24 h samples downwind of the Oceano Dunes State Vehicular Recreation Area (ODSVRA), an area that allows off-highway driving on its coastal dunes. The PM10 samples were analyzed and these data were used to identify the sources that contributed to the PM10 under varying meteorological conditions. Exposed filters were weighed to calculate mass concentration and analyzed using X-ray fluorescence to quantify elemental composition, ion chromatography to quantify water-soluble ions, and thermal/optical reflectance to quantify organic carbon and elemental carbon in the particulate matter. These speciated data were used to attribute the sources of PM10 for eight days that exceeded the California state 24 h mean PM10 standard and 39 days that were below the standard. The mean attribution of sources for the eight identified exceedance days was mineral dust (43.1%), followed by sea salt (25.0%) and the unidentified category (20.4%). The simultaneous increase in the mineral dust and unidentified categories with increasing levels of PM10 arriving from the direction of the ODSVRA suggests that the unidentified components were unmeasured oxides of minerals and carbonate. This increases the attribution of mineral dust for a mean exceedance day to 63.5%. The source of the mineral dust component of the PM10 is attributable to wind-driven saltation and dust emission processes within the ODSVRA.

1. Introduction

The Oceano Dunes, part of the Callender coastal dune system, in San Luis Obispo County, California (Figure 1), is a known source of fugitive dust emissions [1,2,3,4]. Under conditions of elevated wind speed for westerly winds, exceedances of the US Federal Standard (150 μg m−3) and the State of California Standard (50 μg m−3) for 24 h time-integrated concentrations of particulate matter ≤ 10 μm aerodynamic diameter (PM10) have been observed downwind of the dunes since air-quality monitoring was initiated in 1989. Exceedance of the State of California Standard continues to be observed to the present day (2022), while the Federal Standard has not been exceeded since 2014, according to the San Luis Obispo County Air Pollution Control District (SLOAPCD) records.
This California State Park allows off-highway vehicle (OHV) recreation on approximately 338 ha of the beach and dune landscapes (as of December 2022) while prohibiting OHV activity outside this area to protect sensitive areas and critical habitat for identified endangered species (e.g., Charadrius alexandrinus nivosus, Western Snowy Plover and Sterna antillarum browni, California Least Tern). The primary mechanism for emission of dust into the atmosphere from the ODSVRA’s sandy areas is wind-generated rather than OHV recreation actively lofting dust. For winds > 8 m s−1 with dominant westerly components as measured 10 m above ground level (AGL) within the park, the threshold for sand transport is exceeded, and this is accompanied by dust emissions [1,2,3,4]. Gillies et al. [2] reported, however, that OHV activity augments the dust emission potential of the area designated for such activity, producing more PM10 than would occur if the sand areas were not impacted by vehicle travel.
A Stipulated Order of Abatement (SOA) approved by the SLOAPCD Hearing Board in April 2018 (Case No. 17-01) required the California Department of Parks and Recreation (Parks) to reduce the PM10 attributable to the Oceano Dunes State Vehicular Recreation Area (ODSVRA, i.e., the ODSVRA is the source area) to achieve the state and federal 24 h mean PM10 standards. It also identified that to work toward achieving compliance, Parks should develop a management strategy that reduces the emissions of PM10 attributable to dust emission processes within the ODSVRA riding area by 50% by the end of 2023. The SOA was amended in November 2019 and again in October 2022. As amended, the SOA requires that by the end of 2025, PM10 emissions from the ODSVRA be reduced to those modeled to approximate the conditions that existed in 1939. This was prior to high levels of OHV activity and assumes a higher degree of vegetation cover than at present [5].
Parks implemented a management strategy in 2014 based on using dust-control measures within the ODSVRA to reduce PM10 emissions caused by wind and saltating sand. These measures included increasing the amount of vegetation covering sand dunes and promoting the restoration of a foredune [6,7], which reduced the size of the area from which dust emissions originated as well as modulating the wind energy on and downwind of the control areas [7]. Temporarily installed arrays of sand fences [1] and covering the sand with a layer of straw on designated areas of the dunes have also been emplaced at different times to modify dust emission processes, as they provided immediate suppression of dust emission upon installation. Planted vegetation requires time to reach its full potential to mitigate saltation and dust emission processes as the plants reach maturity and maximize their ability to protect the surface from wind erosion [8].
Although wind-generated dust in the PM10 size range within the ODSVRA is the result of dust emissions driven by saltating sand during periods when the wind creates above-threshold conditions, other sources may also be contributing to the observed PM10 concentrations measured east of the ODSVRA at the SLOAPCD monitoring site identified as the California Department of Forestry and Fire Station (hereafter CDF) (Figure 1). This station is downwind of the ODSVRA during periods of westerly wind that are often observed to be associated with high hourly PM10, which, if sustained for a sufficient length of time, leads to exceedance of the State of California Standard 24 h mean concentration of PM10.
The attribution of the sources of PM10 measured in the study area (Figure 1) has been a focus of measurement efforts of the SLOAPCD. A one-year filter measurement campaign (2004–2005) in the study area showed that during high-PM10 events at the CDF and Mesa2 sites, (1) high northwesterly wind was observed from the dune area; (2) mass concentrations of coarse particles (PM10-2.5) were higher than those of fine particles (PM2.5); and (3) a large fraction of the PM10 was windblown crustal materials [9]. This evidence suggested that dust emissions from the upwind ODSVRA were a major PM10 source in the study area. This conclusion was supported by a follow-up study in this area [10], which also showed that other sources (e.g., a chemical facility or agricultural fields) were not significant contributors to PM10 during high-PM10 events. The SLOAPCD also found that the contribution of quartz alone to the total PM10 mass approached 12.5% on high-PM10 days when winds were predominately from the west [11]; in addition to quartz, ODSVRA dust has been shown to contain significant feldspar and clay components [12]. However, these studies did not analyze the full chemical composition of the PM10, making source attribution less definitive.
A recent study by Lewis et al. [13] argued that the contributions of dust from the ODSVRA to downwind PM2.5 and PM10 are small and dust abatement measures would not improve downwind air quality. Lewis et al. [13] collected filter samples of 6–8 h duration at different times of the day (post-12:00 pm) in 2019–2021. The filters were analyzed for elements with X-ray fluorescence (XRF) and organic functional groups with Fourier-transform infrared (FTIR) spectroscopy. Lewis et al. [13] reported that the mineral dust fraction was 14% (±10%) of the PM10 measured by a Beta Attenuation Monitor (BAM) on high-PM10 days, which were defined as days on which BAM-measured PM10 at the CDF exceeded 140 μg m−3 for one or more reported hours. We note in their study that the PM2.5 and PM10 sampling did not comply with the EPA-designated Federal Reference Method (FRM) or Federal Equivalent Method (FEM), and the gravimetric PM2.5 and PM10 mass concentration had large differences with the FEM BAM concentrations.
Accurate attribution of PM10 is needed to inform Parks of the best management practices that will lead to compliance with the SOA. The results presented by Mejia et al. [4] and Gillies et al. [1,2] suggested that the current Parks management strategy to reduce PM10 contributions through dust-control measures is a prudent approach to reach compliance with the SOA, as measurements and modeling have suggested that high PM10 concentrations observed within the ODSVRA contribute substantially to the PM10 measured downwind of the ODSVRA. According to Lewis et al. [13], however, dust-control measures will not be effective, as their results suggested mineral dust is a minor component of PM10 when the hourly mean concentration observed at the CDF is >140 µg m−3. Resolving the relative attribution of PM10 to its sources as measured at the CDF has implications for Parks to effectively manage the PM10 contributions from the ODSVRA to regional PM10 levels to meet the SOA.
To aid in resolving the uncertainty of the source attribution of PM10 at the CDF monitoring site, a PM10 measurement campaign was undertaken in 2021. Using Federal Reference Method PM10 filter samplers (Thermo Fisher Scientific, Waltham, MA, USA, Partisol® 2025i Sequential Air Samplers), paired, preweighed 47 mm Teflon-membrane and pretreated 47 mm quartz-fiber filters were used to collect 24 h PM10 samples following the US EPA’s one-in-three days sampling schedule from April to October 2021. This period of the year has the greatest probability for exceedances of the state 24 h mean PM10 standard. The exposed filters were weighed to calculate the 24 h mass concentration and analyzed using XRF to quantify the elemental composition (Na to U), ion chromatography to quantify the water-soluble ions, and thermal/optical reflectance to quantify the organic carbon (OC) and the elemental carbon (EC) in the collected particulate matter. Details on the sampling and analytical methods are provided in the Methods Section. Using these speciated data, analyses were undertaken to provide accounting of the source attribution of PM10, with the attribution for days that exceeded the state 24 h mean PM10 standard being of particular interest.
Available data (https://aqs.epa.gov/aqsweb/documents/data_mart_welcome.html (accessed on 3 January 2023) on the temporal record of hourly PM10 and hourly meteorological data at the CDF (i.e., wind speed and wind direction measured at 10 m AGL, 2019–2022) and within the ODSVRA, at a station designated as the S1 tower (Figure 1) (wind speed and wind direction measured at 10 m AGL), were also examined to determine the likelihood of an exceedance of the state 24 h mean PM10 standard when the direction of particle transport was from the ODSVRA toward the CDF.

2. Materials and Methods

2.1. PM10 Sampling and Analyses

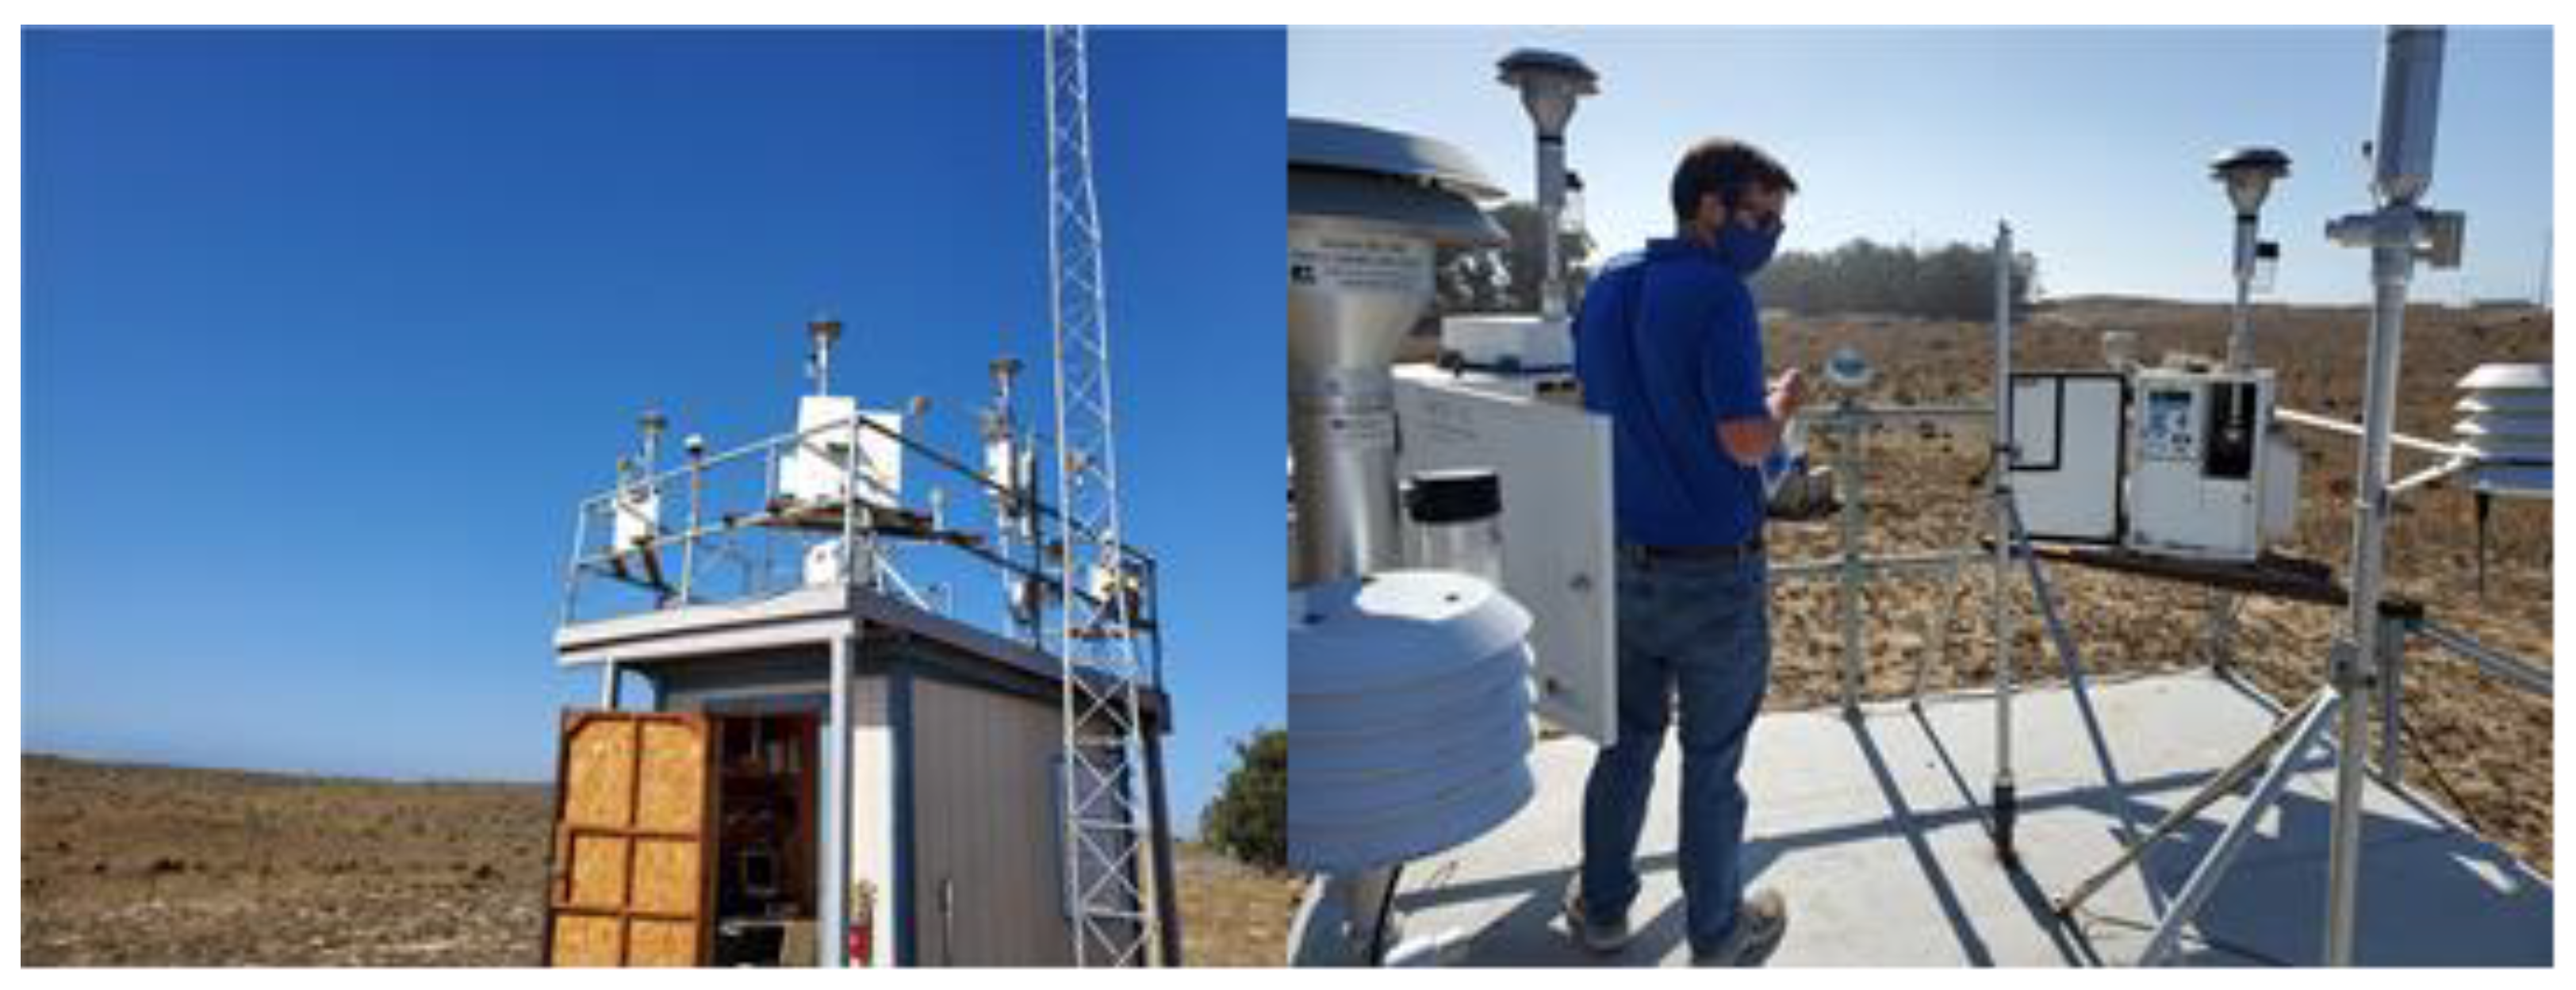
PM10 samples were collected on filters over 24 h periods (midnight to midnight) every three days at the CDF monitoring site between April and October 2021 (Figure 1). Collocated FRM samplers were used to collect PM10 on paired filters for gravimetric-mass and chemical analyses (Figure 2). These analyses were carried out by the Environmental Analysis Facility (EAF) of the Desert Research Institute (DRI), Reno, NV. For quality-assurance purposes, additional samples collected on a 1-in-6 day schedule on 47 mm Teflon-membrane filters were submitted for gravimetric analysis to the South Coast Air Quality Management District (SCAQMD), Diamond Bar, CA. To detect possible sampler bias, the samplers were rotated throughout this study so that Teflon, quartz, and QA samples were collected from each of the samplers. Continuous hourly PM10 measurements were made using a BAM, as described below. All sampler and monitor inlets were located on the roof of the CDF monitoring station and were at least 1 m but no more than 4 m from each other.
Filter-based PM10 samples were collected in accordance with the requirements of US EPA Designation RFPS-1298-127 for PM10 sample collection [14], following the instrument manual and the California Air Resources Board’s Standard Operating Procedure, AQSB SOP 404 [15]. Briefly, preweighed Teflon-membrane and pretreated quartz-fiber filters in cartridges were obtained from the analytical lab and loaded into the sampling instruments in batches. The instruments were fitted with louvered PM10 inlets, as specified in 40 CFR 50, Appendices J and L, and samples were collected at a calibrated flow rate of 16.7 L min−1 for 24 h. After removal from the sampler, exposed filters were stored and transported to the analytical laboratory at 2° to 4 °C. For sample blanks, preweighed filters were obtained from the analytical lab and then stored along with exposed cassettes at 2 to 4 °C, then returned to the lab for analysis without being placed in a sampler.
Continuous hourly PM10 measurements were conducted using a MetOne Instruments BAM 1020 (Grants Pass, Oregon) (Figure 2), which is US EPA-designated FEM EQPM-0798-122 [14]. This instrument was operated in accordance with the US EPA requirements in 40 CFR 58 and its appendices, the SLOAPCD Standard Operating Procedure for the MetOne Instruments BAM 1020 [16], and the instrument manual. For comparison with the gravimetric data, 24 h BAM concentrations were calculated by averaging valid hourly data. For a 24 h mean BAM concentration to be valid, at least 75% of the constituent hourly values were required to be valid.

2.2. Laboratory Chemical Analysis

Detailed laboratory analyses were conducted for each of the PM10 filter samples, including particle mass, elements, ions, carbon fractions, and methanesulfonate, to identify potential source markers and to perform source apportionment [17,18].
The teflon-membrane filters, following exposure and shipping, were equilibrated in a clean room with controlled temperature (21.5 ± 1.5 °C) and relative humidity (RH; 35 ± 5%) before gravimetric analysis to minimize particle volatilization and aerosol-liquid-water bias [19,20]. The filters were weighed before and after sampling using an XP6 microbalance (Mettler Toledo Inc., Columbus, OH, USA) at the DRI or a Sartorius MC5 microbalance (Data Weighing Systems, Inc., Wood Dale, IL, USA) at the SCAQMD, each with a sensitivity of ±1 µg. A radioactive source (500 picocuries of Polonium210) and an electrostatic charge neutralizer were used to eliminate static charge on the filters. A total of 51 elements (from Na to U) were quantified on the Teflon-membrane filters using XRF (PANalytical Model Epsilon 5, Almelo, The Netherlands) [21].
Half of each quartz-fiber filter was extracted in distilled, deionized water (DDW) and analyzed for eight water-soluble ions, including chloride (Cl), nitrate (NO3), sulfate (SO42−), ammonium (NH4+), sodium (Na+), magnesium (Mg2+), potassium (K+), and calcium (Ca2+), via ion chromatography (Dionex ICS 5000+ IC systems, Thermo Scientific, Sunnyvale, CA, USA) [22]. A 0.5 cm2 punch was taken from the other half of each quartz-fiber filter to quantify the OC, the EC, and eight thermal fractions (OC1-OC4, pyrolyzed carbon [OP], and EC1-EC3) following the IMPROVE_A thermal/optical protocol using the DRI Model 2015 Multiwavelength Carbon Analyzer (Magee Scientific, Berkeley, CA) [23,24]. Methanesulfonate (CH3SO3), a marker species for oceanic biogenic materials, was measured using ion chromatography.

2.3. Data Analysis

The three independent 24 h PM10 mass-concentration datasets (i.e., the SLOAPCD’s BAM measurements; the gravimetric-mass concentration from the Teflon membranes, determined by the DRI; and the gravimetric-mass concentration from the Teflon membranes, determined by the SCAQMD) were compared via linear regression, both with and without an intercept term; Deming regression, both with and without an intercept term; and the 90th-percentile upper bound of the coefficient of variation (CVUB). While linear regression assumes that the values of the dependent variable are exactly known, Deming regression is an errors-in-variable model that relaxes this assumption. Deming regression is often used to determine the line of best fit when two variables are measured with errors [25]. Deming regression coefficients were calculated in the R software suite [26] using the “Deming” package [27] and assuming a constant coefficient of variation. The CVUB is the statistic used by the US EPA to evaluate the precision of collocated particulate matter samplers. The CVUB is based on the standard deviation of the percentage differences of mass concentrations from collocated samplers and was calculated according to the procedure in 40 CFR 58, Appendix A, Section 4.2. For low-volume PM10 samplers, such as those used in this study, the EPA’s data quality objective is a CVUB of less than 10%.
The identification of PM10 sources and the estimation of source contributions used a weight-of-evidence approach [18,28]. First, the detailed chemical data were grouped into major constituent groups representing different sources (e.g., sea salt, mineral dust, traffic emissions, and regional/urban background), and their concentrations and contributions to the PM10 were calculated. Next, the wind speed and direction on days exceeding the state 24 h mean PM10 mass-concentration standard (50 µg m−3) were examined to infer the direction of PM10 transport from the source to the receptor (CDF). The combination of windroses, PM10 roses, and PM10 compositions provided weighted evidence of PM10 sources.
Fresh sea salt particles are generated through two main pathways: (1) bubble-bursting when air bubbles entrained by breaking waves rise to the surface and burst to create film and jet drops, and (2) spume drops when the wind shear is sufficiently high to tear water droplets off surface waves [29]. The composition of fresh sea salt is usually considered similar to that of bulk seawater, and the compositions with the highest mass percentages are Cl (55.04%), Na (30.61%), SO42− (7.68%), Mg (3.69%), Ca (1.16%), and K (1.1%) [30]. Once in the air, the spray droplets are transported and dispersed by wind, and chemical reactions with other atmosphere constituents subsequently change their composition. Due to proximity to the ocean, sea salt particles may deposit on beach sands and may be resuspended as fresh or aged sea salt particles along with mineral dust.
One of the main chemical reactions during sea salt aging is chloride depletion, often observed in coastal regions, where particulate chloride is displaced as gas-phase hydrogen chloride (HCl) in atmospheric reactions with nitric and sulfuric acids [31];
HNO3 (g) + NaCl (p) → NaNO3 (p) + HCl (g)
H2SO4 (g) + 2NaCl (p) → Na2SO4 (p) + 2HCl (g)
The degree of chloride depletion can be estimated from the ratios of Cl/Na+ and (Cl + NO3)/Na+.
As Na+ is conservative during sea salt aging, we separated the sea salt Na+ (ssNa+) into fresh sea salt Na+ (fsNa+) and aged sea salt Na+ (asNa+). The fresh sea salt (FS) was calculated as the sum of the measured Cl that had not been displaced, the corresponding fsNa+ had the same Na+/Cl ratio in the seawater, and the sea salt (ss) contributions of Mg2+, K+, Ca2+, and SO42−. As ssMg2+, ssK+, ssCa2+, and ssSO42− do not change with aging, these ions were estimated using their ratios of total measured ssNa+ in typical fresh seawater [30,32,33]. The equation for estimating FS is
FS = fsNa+ + Cl + ssMg2+ + ssK+ + ssCa2+ + ssSO42−
where fsNa+ is estimated as 0.56 × Cl, ssMg2+ as 0.12 × ssNa+, ssK+ as 0.036 × ssNa+, ssCa2+ as 0.038 × ssNa+, and ssSO42− as 0.252 × ssNa+.
The aged sea salt (AS) was estimated by balancing the excess Na+ with NO3 and then with SO42− [34]. The excess Na+ was calculated as the molar equivalent difference between Na+ and Cl [35]. The equation for estimating AS is
AS = asNa+ + asNO3 + asSO42−
where asNa+ = ssNa+ − fsNa+, and asNO3 and asSO42− are calculated by balancing asNa+.
The measured PM10 species were grouped into seven major compositions, including fresh sea salt (FS); aged sea salt (AS); non-sea-salt sulfate (nssSO42−), which was estimated as the total SO42− minus the sea salt SO42− (ssSO42−); mineral dust (MD); elemental carbon (EC); organic matter (OM = OC × multiplier); and other measured species. The sum of these seven composition groups was defined as the reconstructed mass, and the difference between the gravimetric and reconstructed masses was reported as the “unidentified” mass [36].
FS and AS were estimated using Equations (3) and (4), respectively. The MD was estimated as
MD = (3.48 × Si) + (1.63 × nssCa) + (2.42 × Fe) + (1.94 × Ti)
following the modified IMPROVE formula, where the non-sea-salt Ca (nssCa) is the total Ca minus the sea-salt Ca2+ (ssCa2+) in Equation (3) [36,37].
A multiplier of 1.8 was used to convert OC to OM for nonurban aerosols [37,38]. The “Other” category is the sum of other measured ions (e.g., NH4+) and elements (e.g., Br and Ba) without double-counting. The reconstructed mass (RM) was calculated as
RM = OM + EC + nssSO42− + FS + AS + MD + Others

3. Results

3.1. Data Quality Assurance

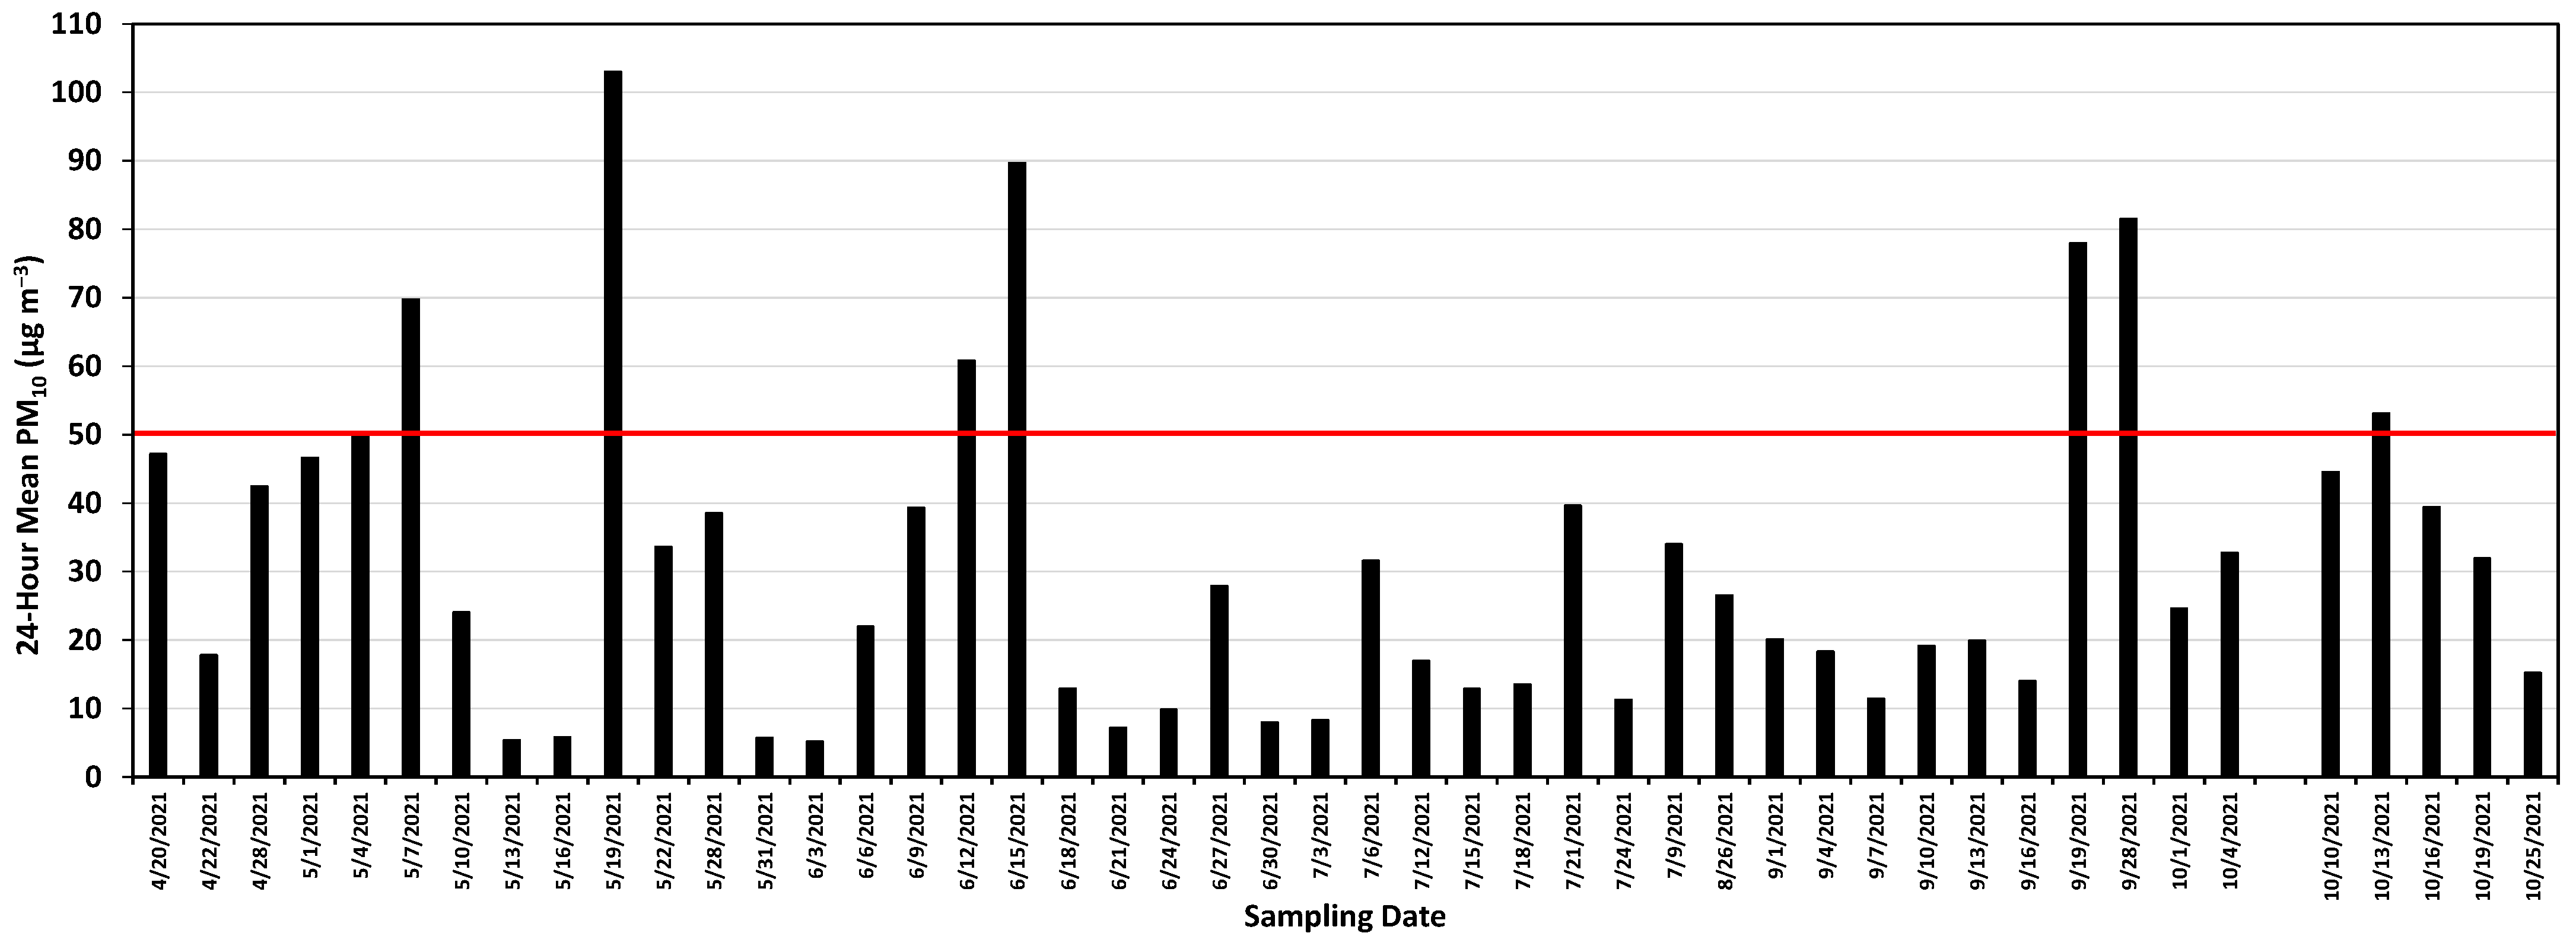
A total of 47 valid 24 h sample pairs were taken between April and October 2021 at the CDF monitoring site (Figure 1 and Figure 2). Of these days (Figure 3), one equaled and eight exceeded the state 24 h mean PM10 mass concentration standard (50 µg m−3) based on the gravimetric measurement of the particle mass and the measured flow volume from the Partisol sampler loaded with Teflon-membrane filters. One sample, from 7 October 2021, was identified as an outlier and removed from further analysis. On that day, the BAM recorded a 24 h average of 25 µg m−3 and the QA sample analyzed by the South Coast AQMD had a mass concentration of 25 µg m−3, while the mass concentration of the sample analyzed by the DRI was 90 µg m−3.
The relations between the 24 h PM10 mass concentrations determined by the various measurements (i.e., BAM and gravimetry performed by the DRI and the SCAQMD) were explored for quality-assurance purposes and for comparison with the results of Lewis et al. [13]. Since gravimetric-mass concentration is determined solely from Teflon-membrane filters, the gravimetric analysis for the sample pair may still have been valid even if a paired quartz-fiber filter were invalid or missing. Thus, there were 47 valid 24 h gravimetric-mass concentrations from the DRI analysis, with corresponding valid BAM concentrations, and 26 from the SCAQMD gravimetric analysis. As noted above, linear regression, Deming regression, and the CVUB were used to compare these datasets. For the regression analyses, the BAM concentrations were treated as the dependent variable and the gravimetric concentrations as the independent variable. The results are summarized in Table 1 and Table 2.
The comparisons in Table 1 and Table 2 show excellent agreement between the gravimetric and BAM measurements, with R2 values greater than 0.98 and slopes near 1:1, giving confidence that the BAM data provided reasonable measurements of hourly and 24 h mean PM10. In comparison of the DRI gravimetric and SLOAPCD BAM concentrations, the linear-regression models—both with and without an intercept—and the Deming model without an intercept all indicated a statistically significant but small bias of 4% to 5%. Nonetheless, with a CVUB of 6.44%, this pair of samplers was well within the EPA’s data quality objective for collocated monitors. In comparison of the SCAQMD gravimetric and SLOAPCD BAM concentrations, none of the regression models or the CVUB indicated a statistically significant difference between the measurements.

3.2. Fresh and Aged Sea Salt

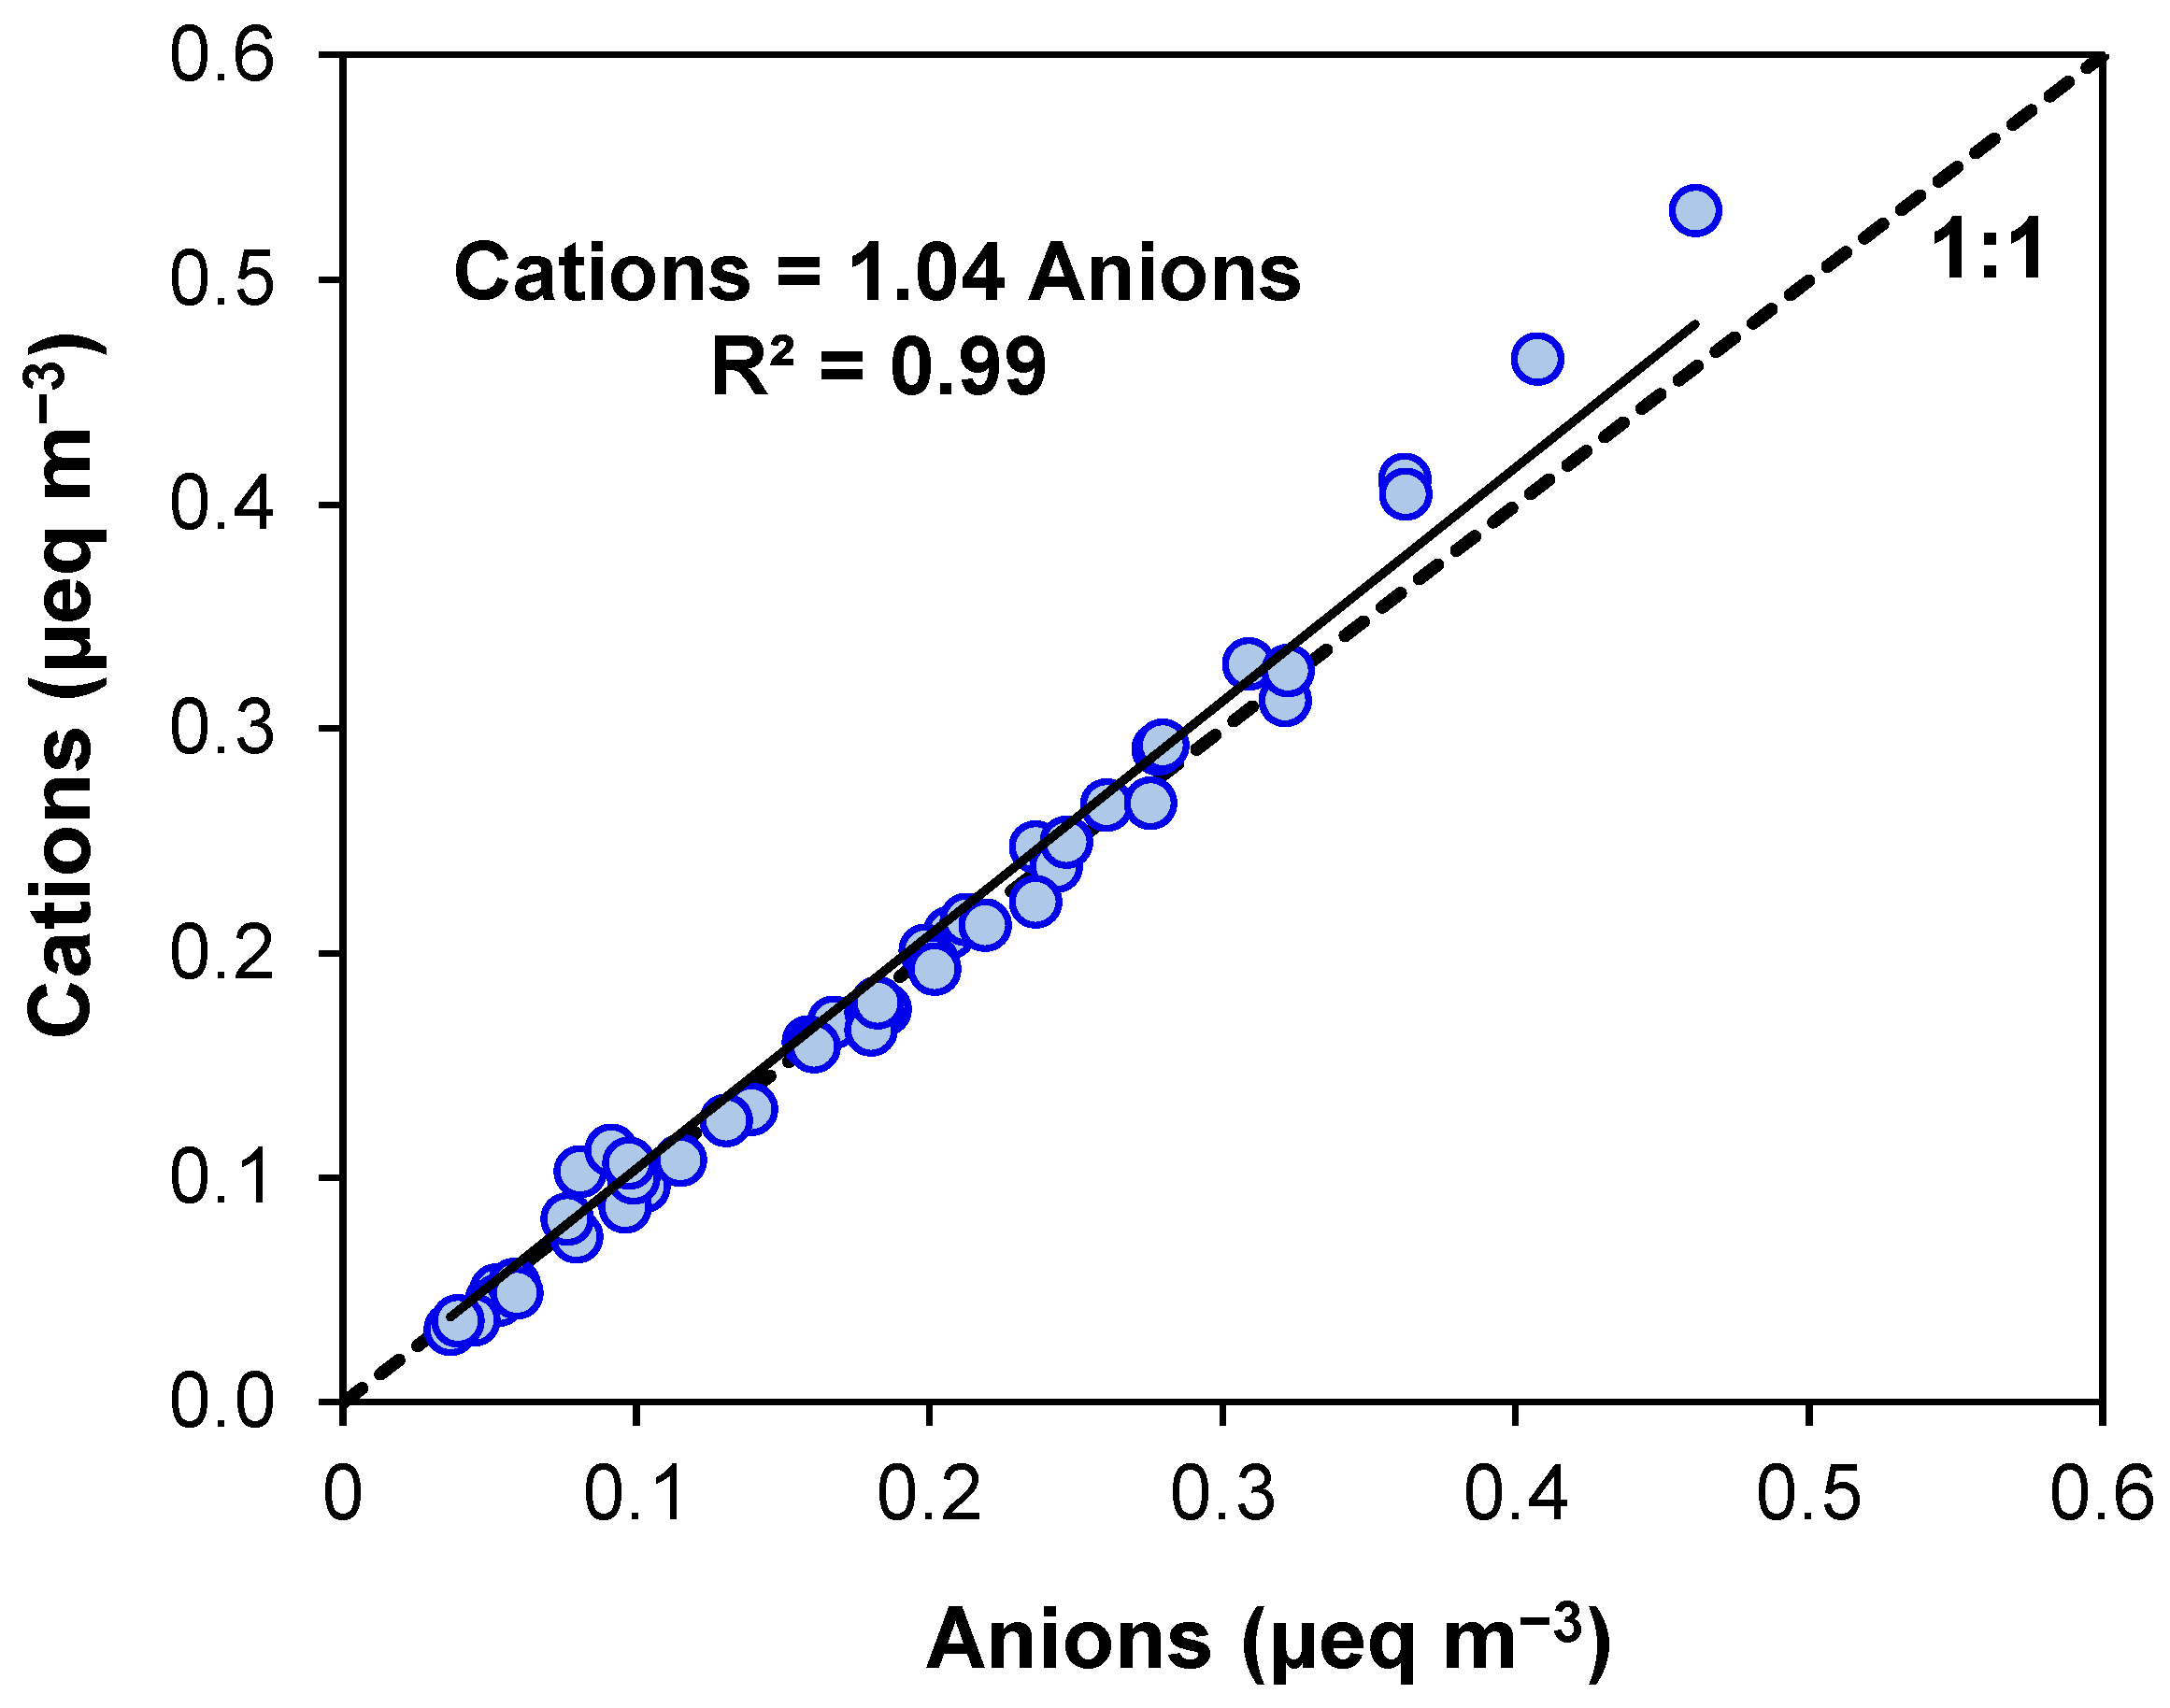
Inorganic ions in this costal environment without major local aerosol sources likely come from sea salt, mineral dust, and the regional/urban background. Figure 4 shows that measured cations are highly correlated with anions (R2 = 0.99) with a regression slope of 1.04, indicating that most ions were measured with high quality and the particles were nearly neutral. The slightly higher-than-unity slope (1.04) is dominated by a few data points with high ion concentrations, which was probably caused by the carbonate (CO32−) that is common in mineral dust but was not analyzed in this study.
Figure 5 shows that both Mg2+ and K+ are highly correlated (R2 ≥ 0.98) with Na+, and the regression slopes are very close to the expected mass concentration ratios (0.12 for Mg2+:Na+ and 0.036 for K+:Na+) in seawater [30]. Therefore, Na+, Mg2+, and K+ mainly originate from fresh sea salt [35]. In contrast, Figure 6 shows that Ca2+ and SO42− exceed the fresh seawater ratios for most samples and their correlations with Na+ are lower than those in Figure 6. The excess Ca2+ and SO42− indicate additional sources, likely minerals (e.g., CaCO3) for the Ca2+ and the regional/urban background for the SO42−. Water-soluble Ca2+ and SO42− can also form from heterogeneous reactions between sulfuric acid (H2SO4) or sulfur dioxide (SO2) and mineral dust [34,39,40].
In the assumption that sea salt was the only source of Na+ and Cl at the monitoring site, typical fresh sea salt particles have a Cl/Na+ mass ratio of 1.8 [30]. Figure 7a shows that at the CDF, the average Cl/Na+ ratio is 1.51: lower than 1.8 for all samples. Therefore, approximately 16% Cl was displaced by stronger acids (e.g., nitric and/or sulfuric acids). Figure 7b shows that most data points are below the 1:1 line, indicating that both NO3 and SO42− were involved in the Cl displacement for most samples.
Figure 8 shows that the AS/FS ratio decreases with the PM10 concentration when the PM10 concentrations are lower than approximately 40 µg m−3, and the ratio remains < 0.2 at higher PM10 concentrations, indicating that FS dominates SS during high-PM10-concentration events.

3.3. PM10 Major Chemical Composition and Mass Reconstruction

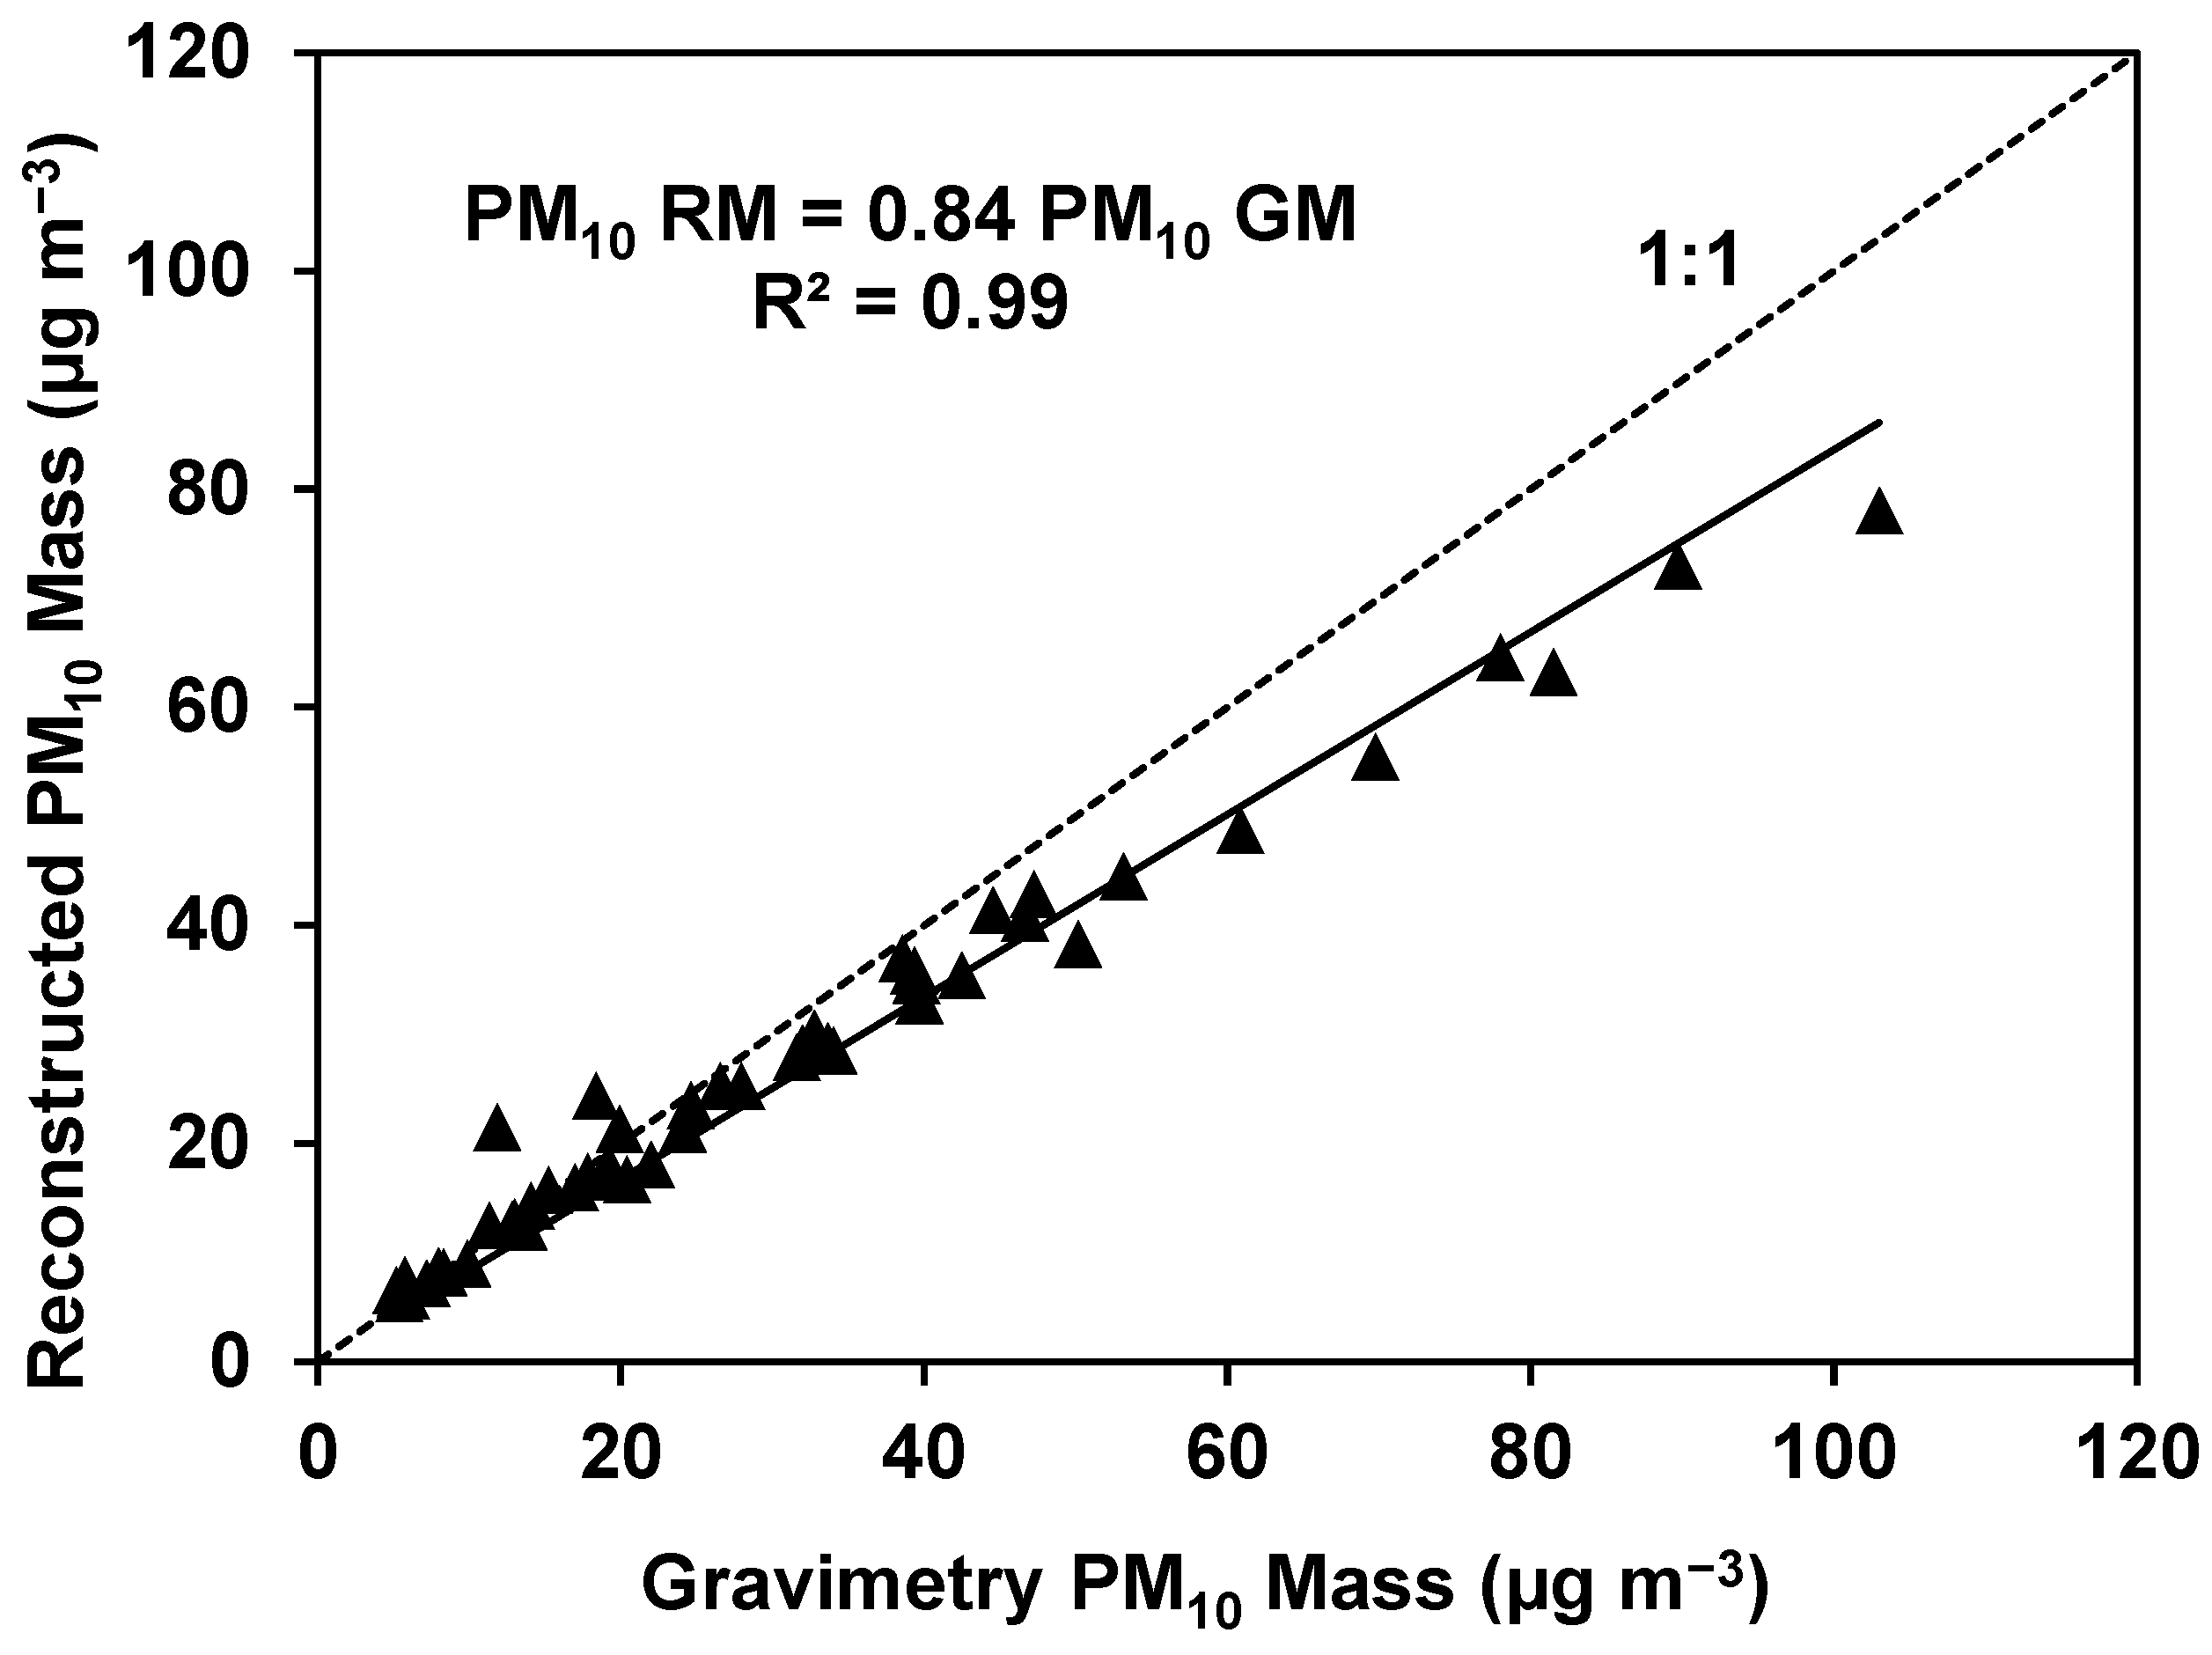
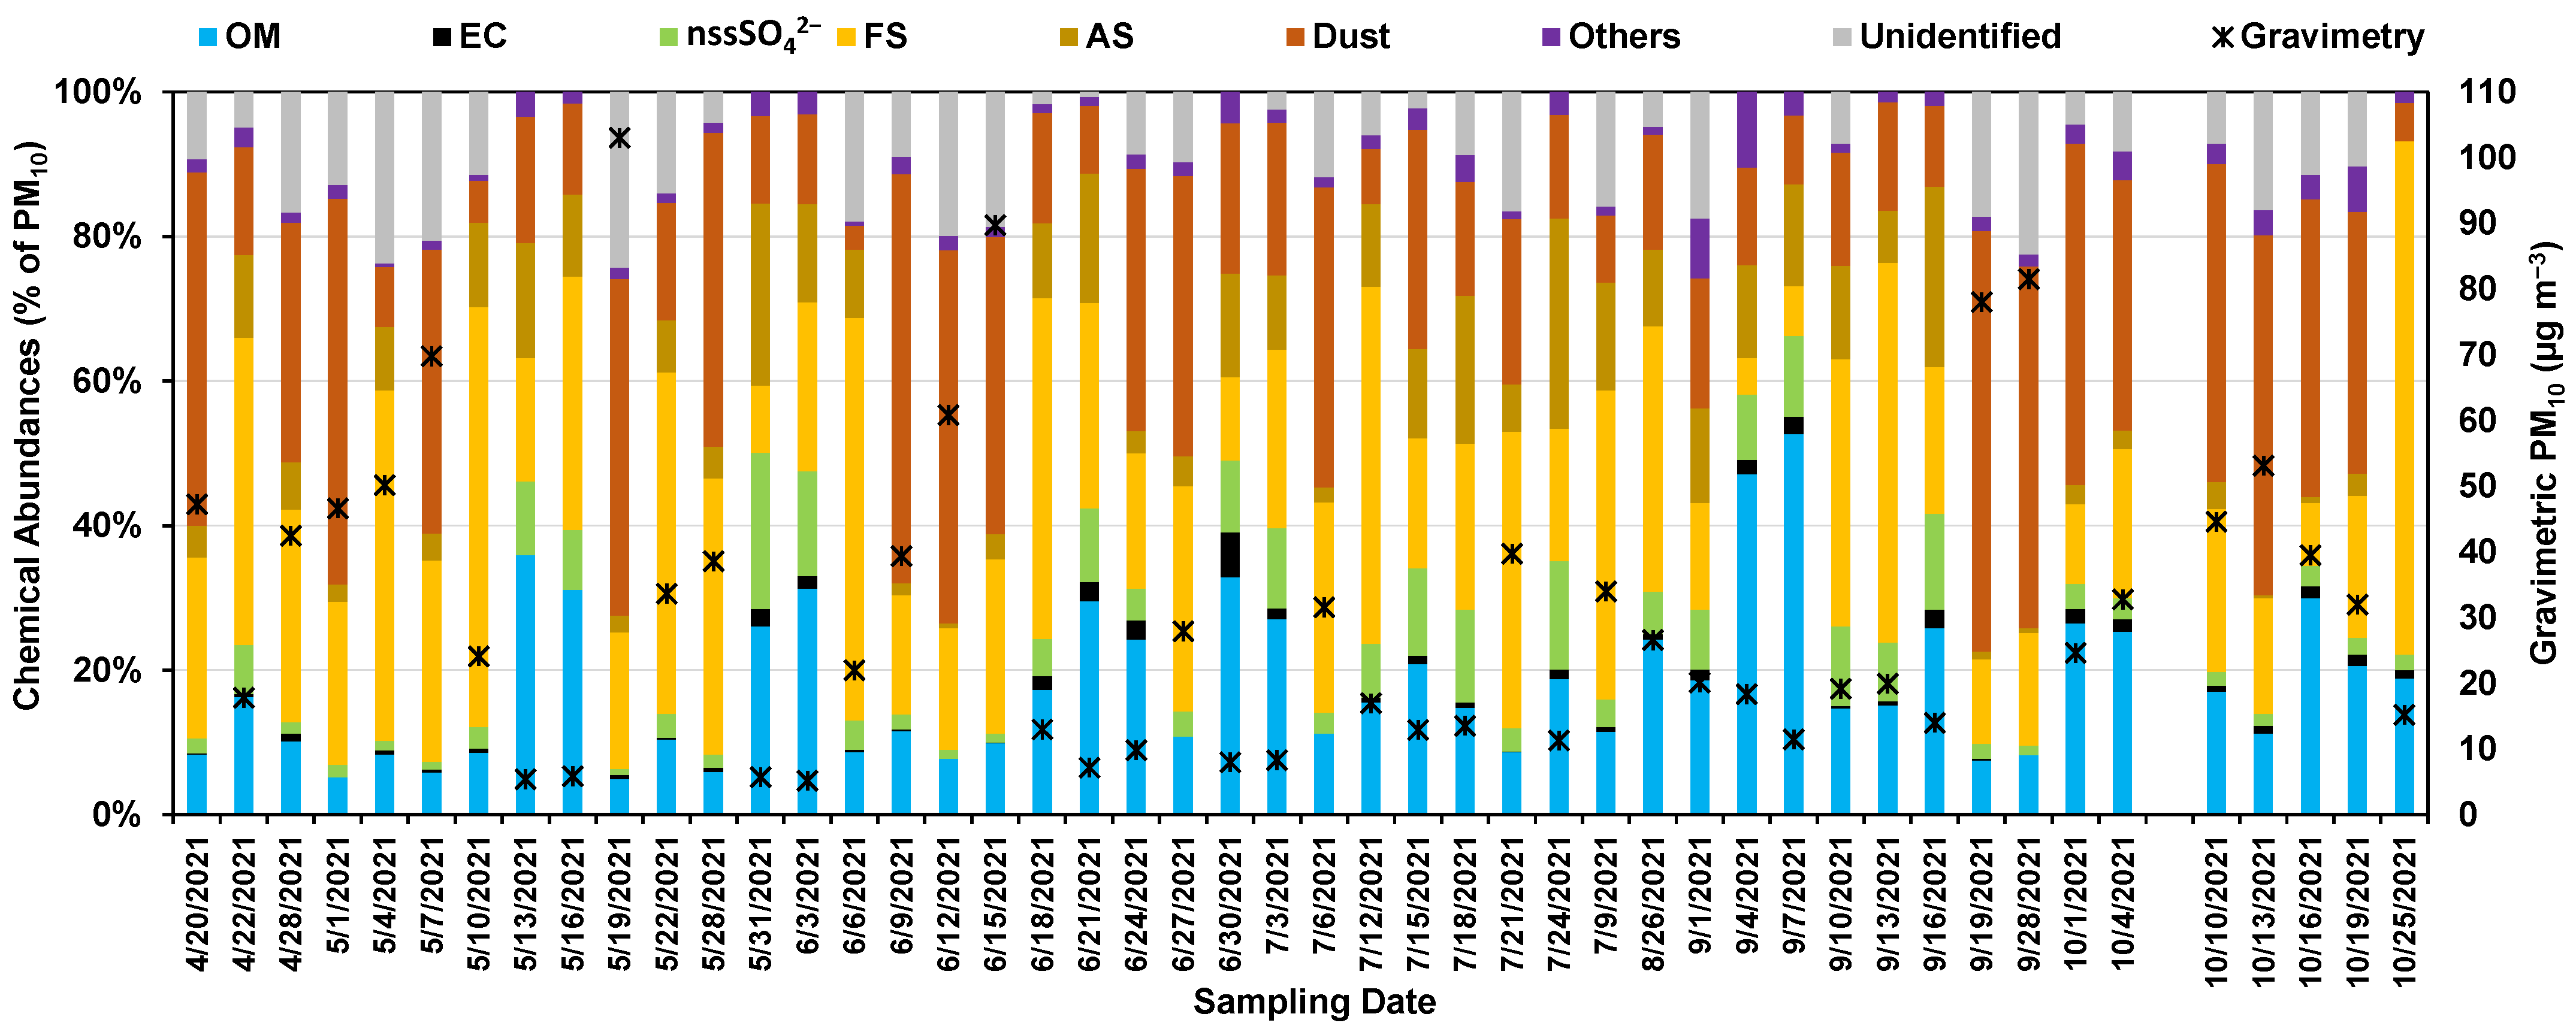
The relation between the mass determined by gravimetric analysis and the reconstructed mass showed a strong correlation (R2 = 0.99), indicating that the gravimetric and chemical measurements were of high accuracy (Figure 9). Since the slope (0.84) of the best-fit linear-regression line was less than unity, it indicated that there were constituents of the PM10 that were not accounted for by those measured in the laboratory analysis or in the mass reconstruction (Equation (6)). The unidentified mass is also shown as the difference between the gravimetric mass (represented by ) and the reconstructed mass (represented by the stacked bar height) in Figure 10. The attribution of the unidentified PM10 mass to a source is described later.
Figure 10 shows that mineral dust and sea salt had high concentrations during the high-PM10 days at the CDF monitoring station, representing influences from saltation-driven dust emissions and ocean sea spray, while OM was a minor contributor. Additionally, the concentrations of tracers for on-road traffic emissions (represented by EC) and regional pollution (represented by nssSO42−, nssNO3, and NH4+ (included in the others category)) were low. The concentration of methanesulfonate (CH3SO3) was <1.2 µg m−3 for all sampling days. The PM10 mass percentages of the chemical constituents in Figure 11 show that while sea salt and mineral dust were the dominant PM10 constituents during high-PM10-concentration days, organics and nssSO42− contributions were higher during lower-PM10-concentration days.

3.4. Source Attribution of PM10 at the CDF

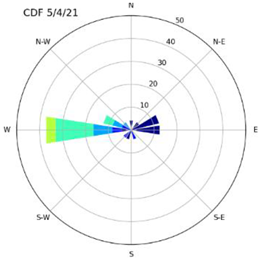
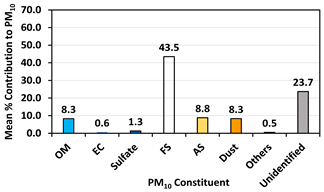
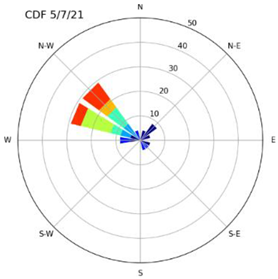
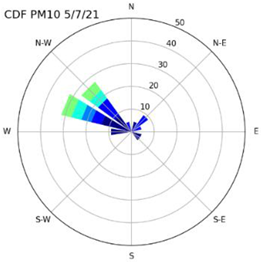
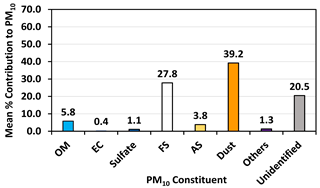
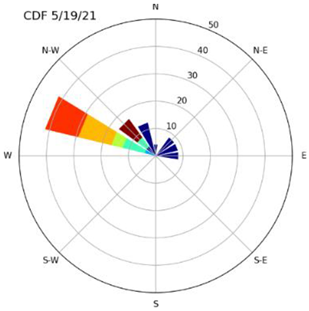
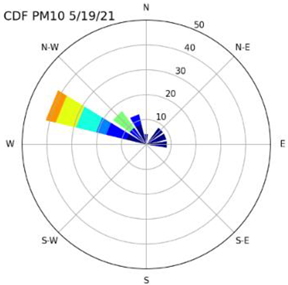
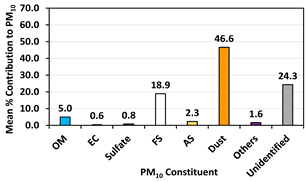
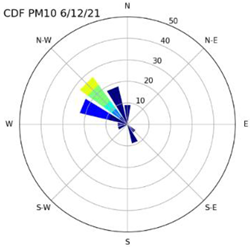
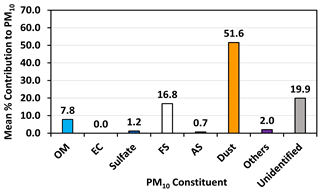
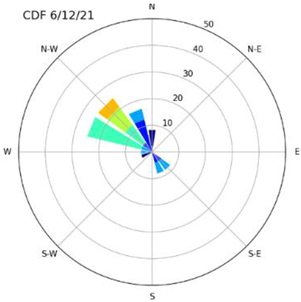
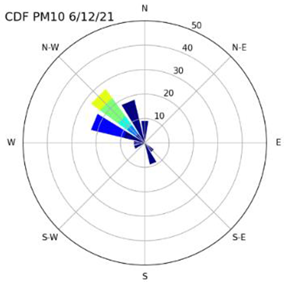
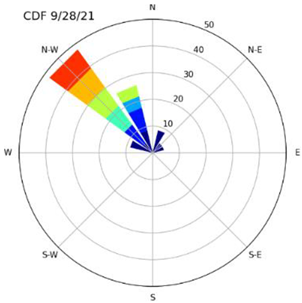
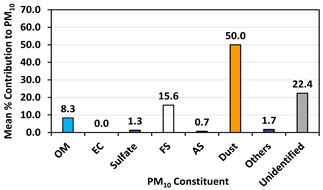
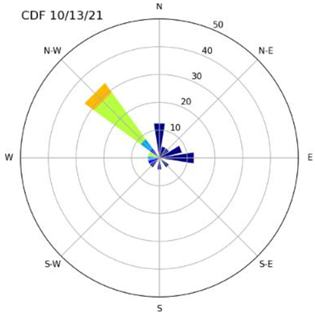
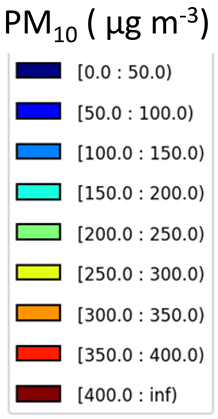
Of critical interest is the understanding of contributions from the direction of the ODSVRA to the PM10 measured at the CDF on the days that exceeded the state 24 h PM10 standard. During the monitoring period, eight exceedance days were identified to define the source attribution (Figure 3). The source attribution for these days was based on the chemical-speciation data and using Equation (3) (FS), Equation (4) (AS), Equation (5) (MD), the OM, the EC, and the non-SS sulfate to estimate the relative contributions to the total reconstructed mass (Equation (6)). Also included in the source attribution was the category “Others” that represented the sum of other measured ions and elements not accounted for in the above categories. For each of the identified exceedance days, the 24 h mean PM10 concentration, the wind rose, the PM10 rose, the source attribution, and the attribution of the PM10 mass based on the hours of transport from the direction of the ODSVRA to the CDF are shown in Table 3. The PM10 roses and attribution of hours when PM10 was being transported to the CDF from the direction of the ODSVRA are based on hourly measurements of wind speed and direction and hourly BAM-measured PM10.

3.4.1. Compiled Source Attribution for Exceedance Days in 2021

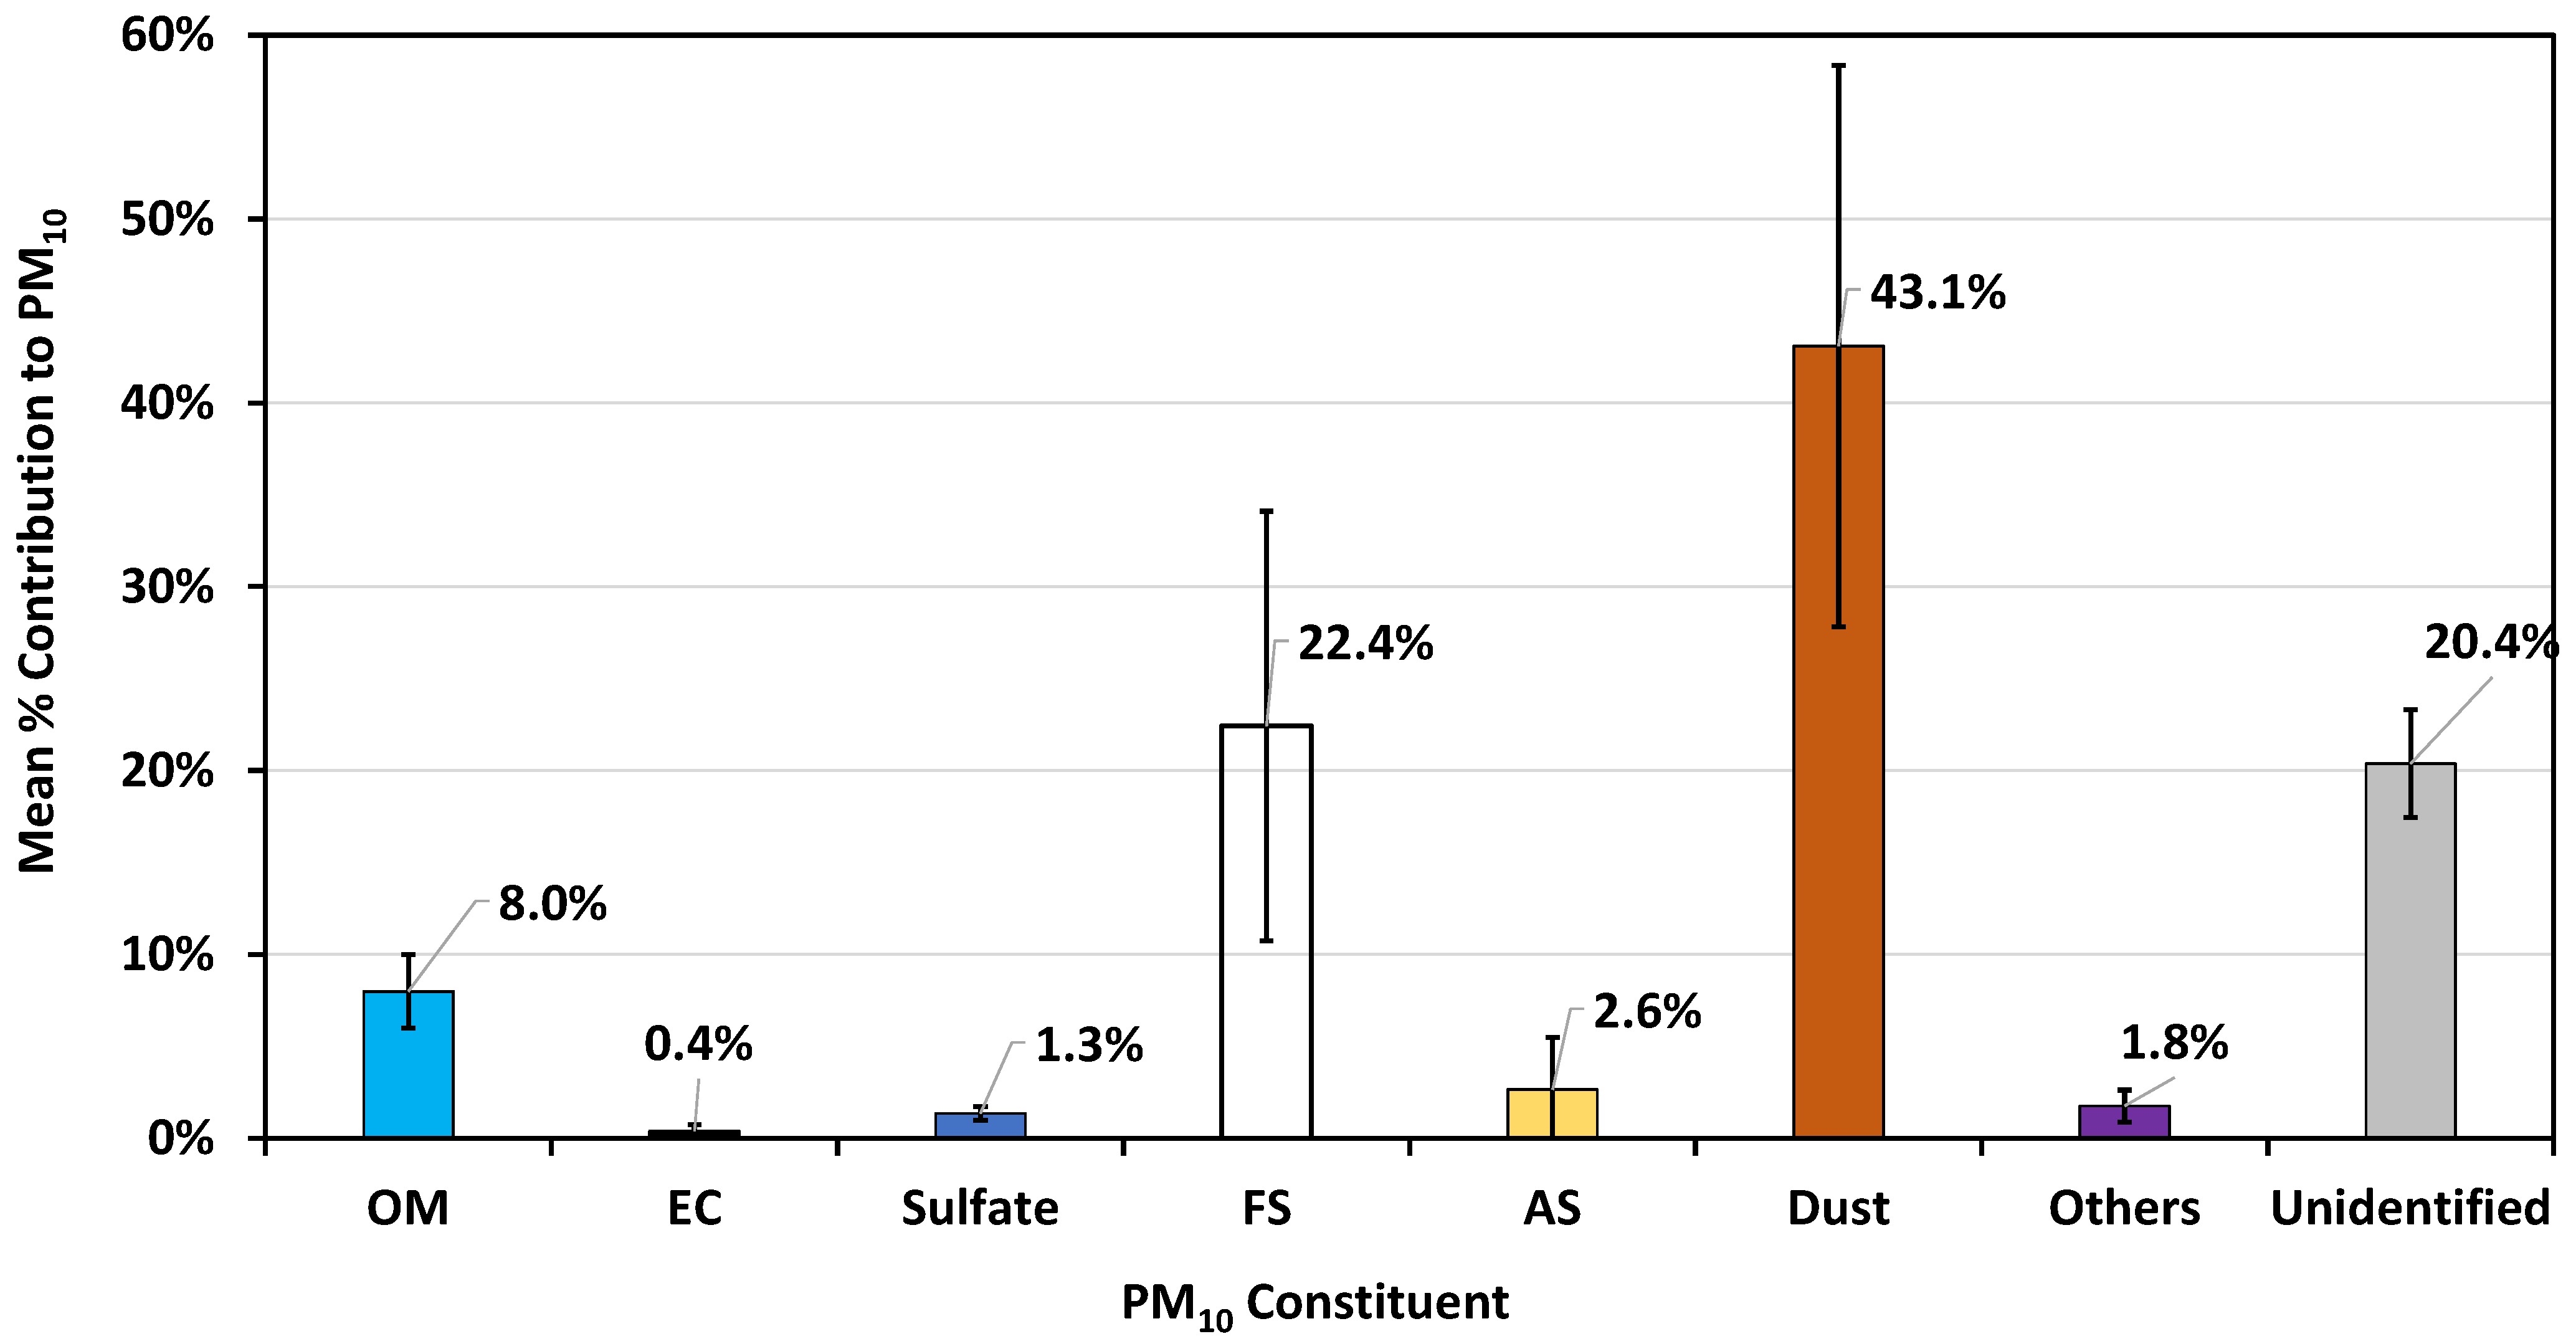
For the exceedance days identified for the period of April–October 2021, for the sources defined for each individual day (excluding 7 October 2021), the composition percentages from each of the bar charts, shown in Table 3, were used to calculate a mean source attribution for the exceedance day. This attribution is presented in Figure 12. The dominant source of the PM10 is MD (43.1% ± 15.3%), followed by SS (22.4% ± 11.7% for FS and 2.6% ± 2.8% for AS) and the unidentified category (20.4% ± 2.9%).

3.4.2. Compiled Source Attribution for Non-Exceedance Days in 2021

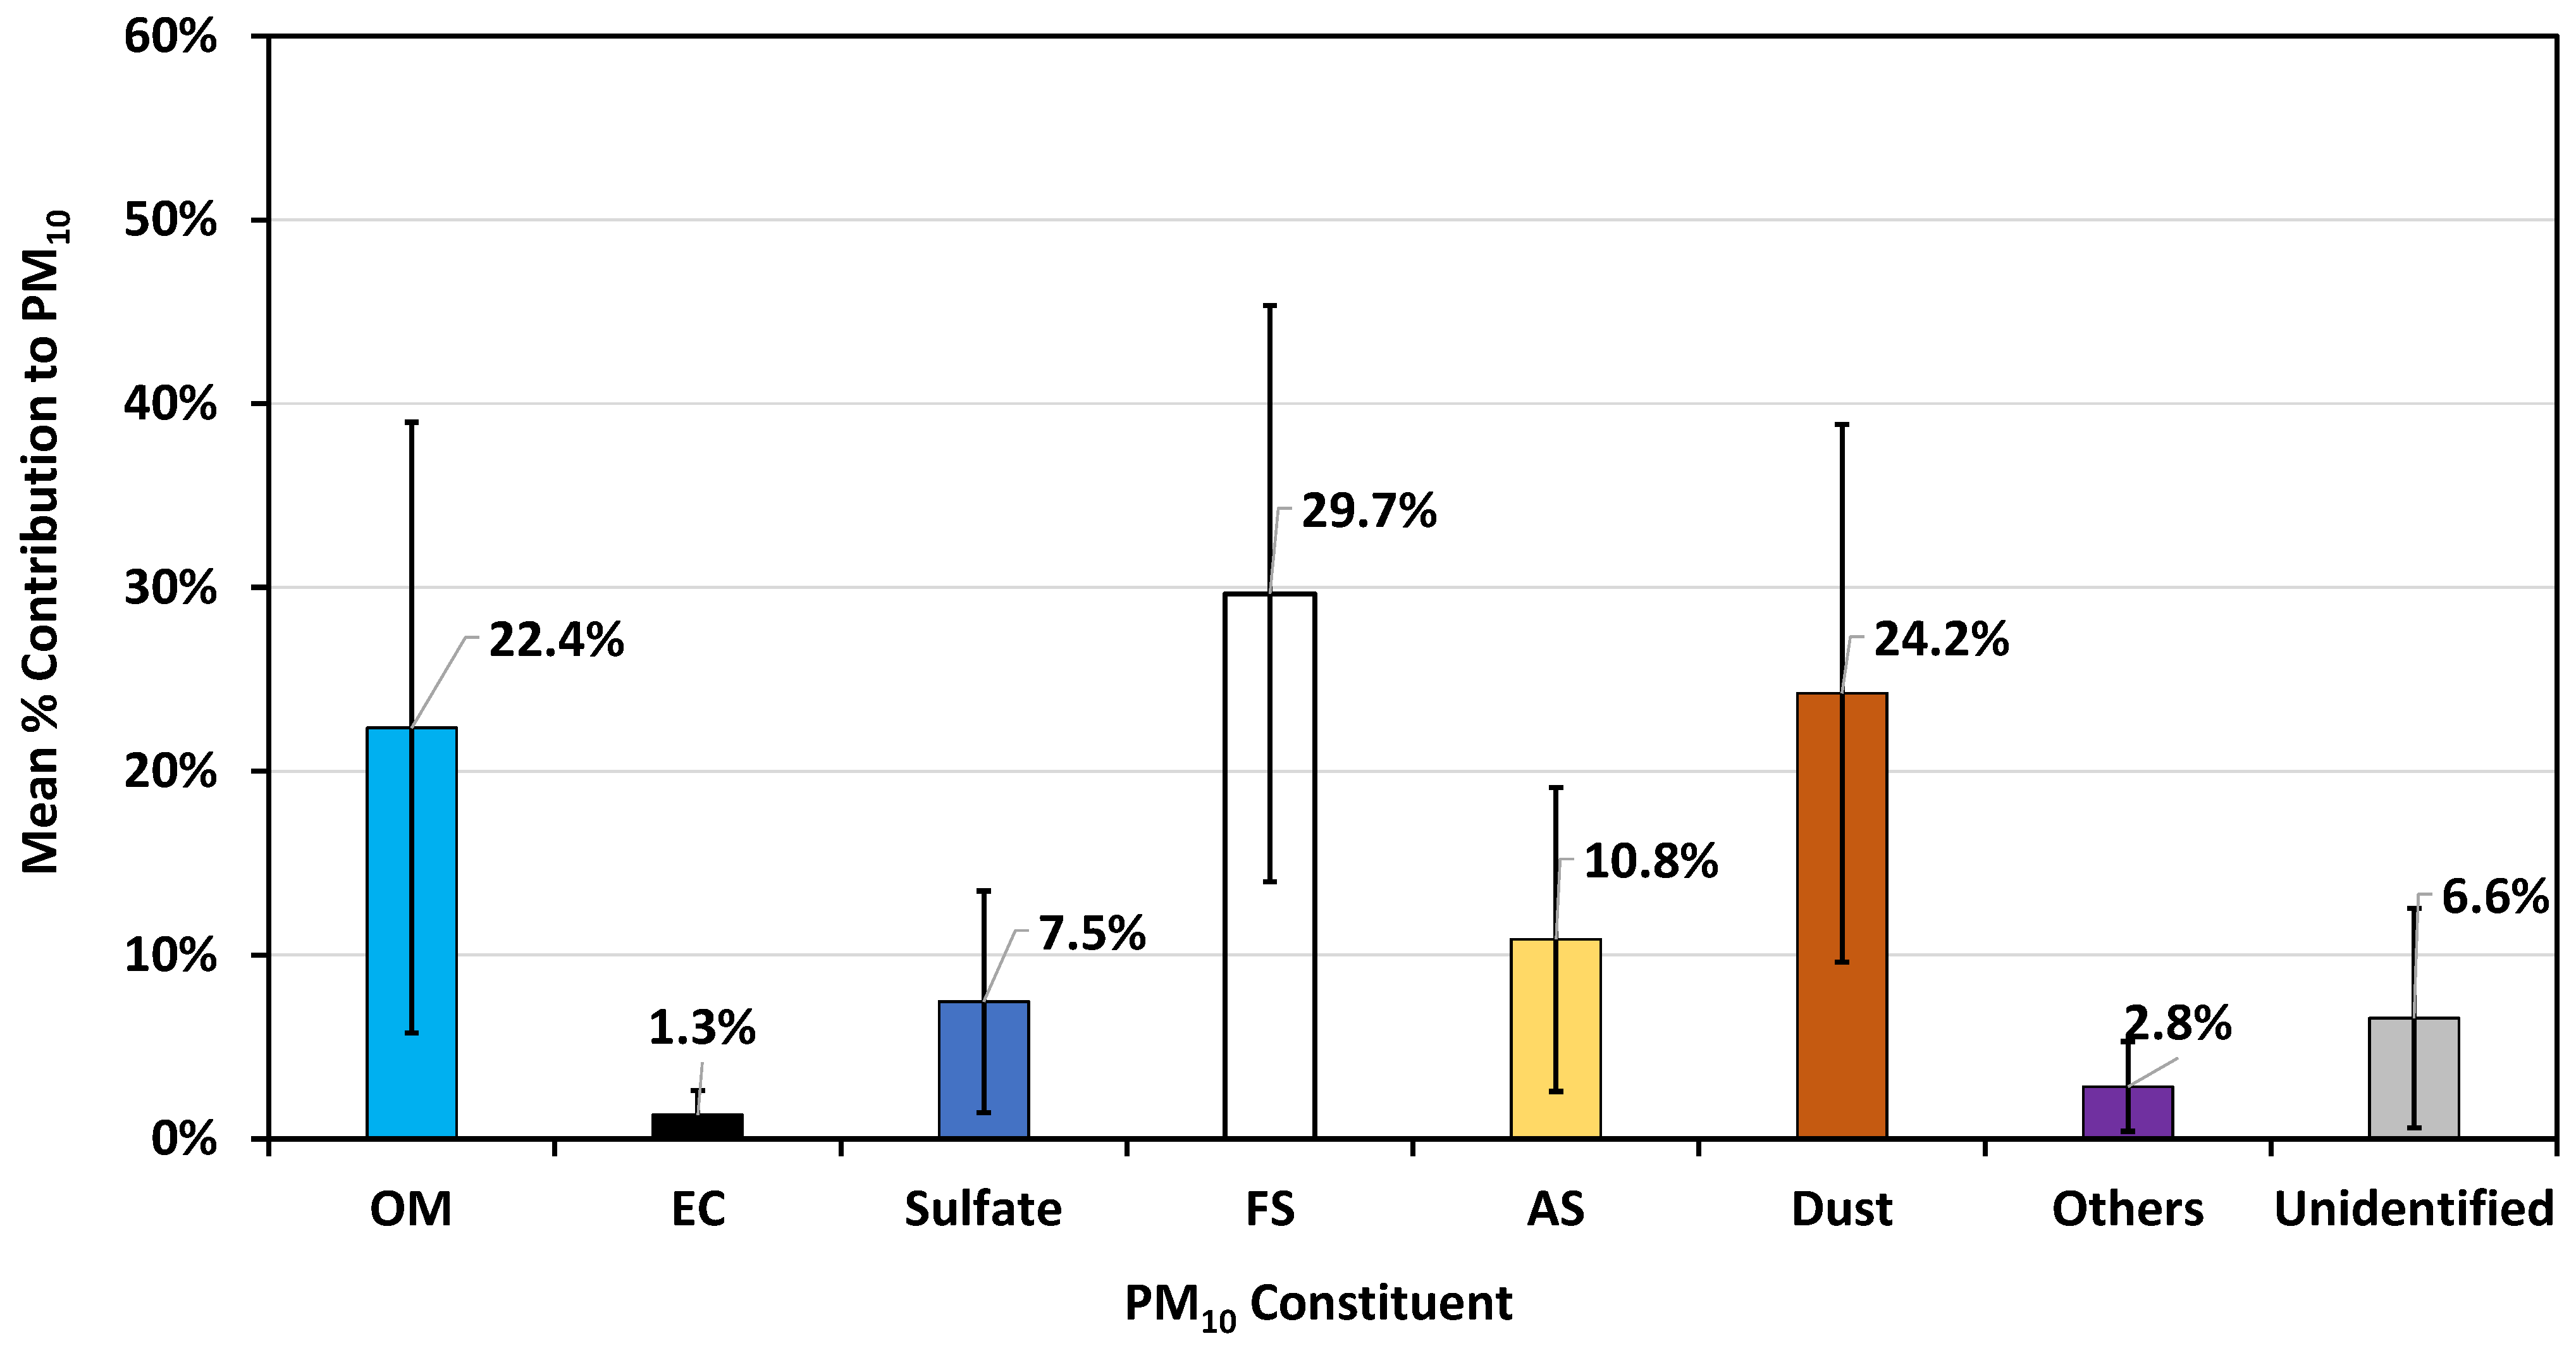
For the non-exceedance days identified for the period of April–October 2021, for the sources defined for each individual day, the composition percentage from each day was used to calculate a mean source attribution for a non-exceedance day. This attribution is presented in Figure 13.
The dominant source of the PM10, as shown in Figure 13, was sea salt (fresh plus aged, 40.5% ± 24.0%), followed by mineral dust (24.2% ± 14.6%), OM (22.4% ± 16.6%), sulfate (7.5% ± 6.0%), others (2.8% ± 2.5%), and unidentified (6.6% ± 6.0%). The contributions from AS on non-exceedance days (10.8% ± 8.3%) were much higher than those on exceedance days (2.6% ± 2.8%), indicating that larger fractions of AS were collected at the CDF on days with a wider range of wind directions and lower wind speeds. The contributions from EC and non-SS nitrate (included in others) remained low, similarly to on the mean exceedance day (Figure 13). Sulfate increased, as more sources were likely in inland areas than areas to the west of the CDF. The source attribution for the mean non-exceedance days represented a day with a lower probability of winds that would entrain sand and emit dust within the ODSVRA, as well as a much greater degree of mixing with a wider range of wind direction.

3.5. Exceedance Days Related to Wind Speed Magnitude, Duration, and Wind Direction Persistence at the CDF and the S1 Tower, 2019–2022

We examined the relation between days that met or exceeded the state 24 h mean PM10 standard (based on averaging hourly PM10 BAM data) and meteorological conditions, principally wind speed, wind direction, and precipitation conditions at the CDF and S1 tower monitoring locations for the period of 2019–2022, to evaluate the conditions that can lead to an exceedance of the state PM10 standard. Based on Gillies et al. [2], we assumed the threshold for saltation within the ODSVRA was associated with a wind speed of 8 m s−1 measured at 10 m AGL at the S1 tower (Figure 1). To account for the wind speed gradient from S1 to the CDF, we examined the correspondence of 10 m AGL wind-speed values at the S1 tower between 7.75 m s−1 and 8.25 m s−1 with the 10 m AGL wind-speed values at the CDF. This distribution had a skewness of −0.099 and an excess kurtosis of −0.57. Based on these moderate values for the third and fourth moments, we chose the mean value of 3.6 m s−1 at the CDF to indicate that it was highly probable that the saltation threshold within the ODSVRA had been achieved.
To isolate the effect of wind, bearing PM10, that had passed over the ODSVRA, we segregated the data based on wind direction ranges of 236–326° to represent the ODSVRA-influenced direction and 327–235° to represent the non-ODSVRA-influenced transport direction. The fractions of the 24 h periods for the wind direction ranges of 236–326°and 327–235° for the 20 days with the highest 24 h mean PM10 values (ordered by total PM10, descending from left to right) in 2019–2022 are shown in Figure 14. Of the total number of exceedances (201) in this period, 153 had >50% of the total daily PM10 associated with the wind direction range of 236–326°. Two of the days in Figure 14, with <50% of their daily PM10 values within the wind direction range of 236–326°, can be linked to regional events: 28 October 2019 was due to particulate matter being transported from the San Joaquin Valley [11] to San Luis Obispo Co., and 14 September 2020 due to wildfire smoke [41].

4. Discussion

4.1. Exceedance Days Related to Wind Speed Magnitude and Duration and Wind Direction Persistence

The wind and PM10 roses shown in Table 3 indicate that for the identified exceedance days from April to October 2021, wind direction and associated elevated PM10 were westerly to northwesterly with respect to the CDF. These days also had periods of time when wind speeds from this directional range exceeded 3.6 m s−1, as measured at the CDF. For the longer period, 2019–2022, it is clear from the wind and PM10 data records that exceedance of the state 24 h PM10 standard had the greatest likelihood of occurring when the wind direction at the CDF was between 236 and 326°, bringing PM10 to the CDF from the direction of the ODSVRA, and that as wind speed increased above 3.6 m s−1, the probability of exceedance increased further.

4.2. Source Attribution on Exceedance Days

The source attributions for the identified exceedance days (Table 3) and the mean attribution from the eight identified days (Figure 12) suggest that the MD component (43.1% ± 15.3%) of the PM10 was the principal source, followed by sea salt (25.0% ± 14.5%), on these days. The vertical flux of mineral dust particles from a source area, based on the physics of the dust emission process [42,43,44], scales nonlinearly with wind shear stress and horizontal saltation flux. Therefore, as wind speed, shear stress, and saltation flux increased, the dust-sized particles, including those in the PM10 size fraction, increased in number and mass concentration rapidly.
The other constituent of PM10 that could increase as wind speed increases is sea salt. The production of sea spray on the open ocean is a function of wave height, wind history, wind shear, and water viscosity [45]. Production of sea spray by breaking waves is due to wind shear (primarily at the wave crest), splashing, and popping of breaker-entrained air bubbles rising to the free surface [46]. In combination, these processes will input more sea spray into the air as the wind speed increases. Upon evaporation of the liquid sea spray droplets, sea salt particles are created and their number and mass concentration in the atmosphere contribute a greater fraction to the overall PM10. The chemical speciation of the sea salt fractions, fresh and aged, does not unambiguously resolve what fraction is directly attributable to sea spray, as sea salt particles could also originate from saltating sand as a result of sea salt particles or sea spray droplets being deposited previously to the sand surfaces. This separation of sea salt contribution in airborne PM10 remains unresolved. If it is predominantly from evaporating sea spray droplets, then the contribution of this source will remain uncontrolled. If, however, a significant fraction of sea-salt PM10 is derived from saltation and resuspension of deposited particles, then dust-control methods that reduce saltation will also reduce the input of sea-salt-particle contributions to downwind PM10 when regional winds in the area are generally west to northwest.
The unidentified constituent of 20.4% (±2.9%) cannot be unambiguously resolved due to three analytical challenges. The first challenge is to account for the mass of PM10 that is related to the presence of the oxide and carbonate components of the minerals that were not resolved by XRF or the other analytical methods. The second challenge is finding the accurate multiplier to convert OC to OM. A multiplier of 1.8, representative of nonurban aerosols, is used in Equation (6) [37,38]. Multiplier values ranging from 1.2 for fresh engine exhaust to 2.2 for aged aerosols sampled in remote areas have been reported [36]. Using a multiplier of 2.2 instead of 1.8 would reduce the unidentified fraction to 18.6% (±3.2%). Due to the small difference, a less-extreme multiplier of 1.8 was used. The third challenge is to measure particle-bound water content. The filters were weighed at 21.5 (±1.5) °C and 35% (±5%) RH. This RH is lower than the efflorescence RHs of the main salt forms NaCl (43%), NaNO3 (40%), and Na2SO4 (55%) [47]; therefore, the salt particles were likely in a dry state. However, McInnes et al. [48] observed that water made up 9% of submicron marine aerosol mass when weighted at 35% RH. Additionally, minerals often exist in hydrated phases, including water in crystal structures [49]. Currently, there are no standard ways to accurately determine mineral compositions or particle-bound water content in aerosol samples.
We note that the unidentified fraction (20.4% ± 2.9% of PM10) from this study is much lower than that reported by Lewis et al. [13], i.e., 69% (±18%) for all samples and 82% (±14%) for designated high-PM10 days. Lewis et al. [13] speculated that ammonium nitrate, semivolatile organic compounds, and aerosol water were major contributors to their unidentified mass because these were not measured. Figure 7b shows that for these samples, most NO3 is associated with Na+, not NH4+. The sums of the NH4+ and the NO3 were 1.4% (±1.2%) and 5.2% (±3.4%) of PM10 on exceedance and non-exceedance days, respectively, showing that NH4NO3 is a much smaller contributor to PM10 than speculated by Lewis et al. [13]. Unfortunately, Lewis et al. [13] did not measure carbon or ions, and their data cannot be subjected to a quality check between the reconstructed and gravimetric masses, as shown in Figure 9. Their differences between the gravimetric and BAM data were much larger than those shown in Table 1 and Table 2, indicating potential errors in their filter collection.
Lewis et al. [13] found only a moderate correlation (R2 = 0.71) between their gravimetric-PM10-mass concentrations and the BAM PM10 measurements made simultaneously, a few meters away. They also reported a significant bias between the datasets, with a slope and an intercept of 0.54 and 5.3 µg m−3, respectively, for the linear regression of their gravimetric-mass concentrations in the BAM measurements. This indicates that at higher PM10 levels, their gravimetric measurements tended to be much less than the BAM measurements. In contrast, we found high correlations and low biases between our collocated gravimetric and BAM measurements (Table 1 and Table 2) of PM10. Lewis et al. [13] attributed the bias they observed to unmeasured semivolatile species—including ammonium nitrate, organic material, and water—that they assumed were lost from their gravimetric samples prior to analysis. This explanation is unlikely, as we did not observe this bias in our measurements, and furthermore, measured ammonium nitrate was found to be only a minor contributor to PM10 in our samples, along with relatively low contributions from carbonaceous particulate-matter constituents.
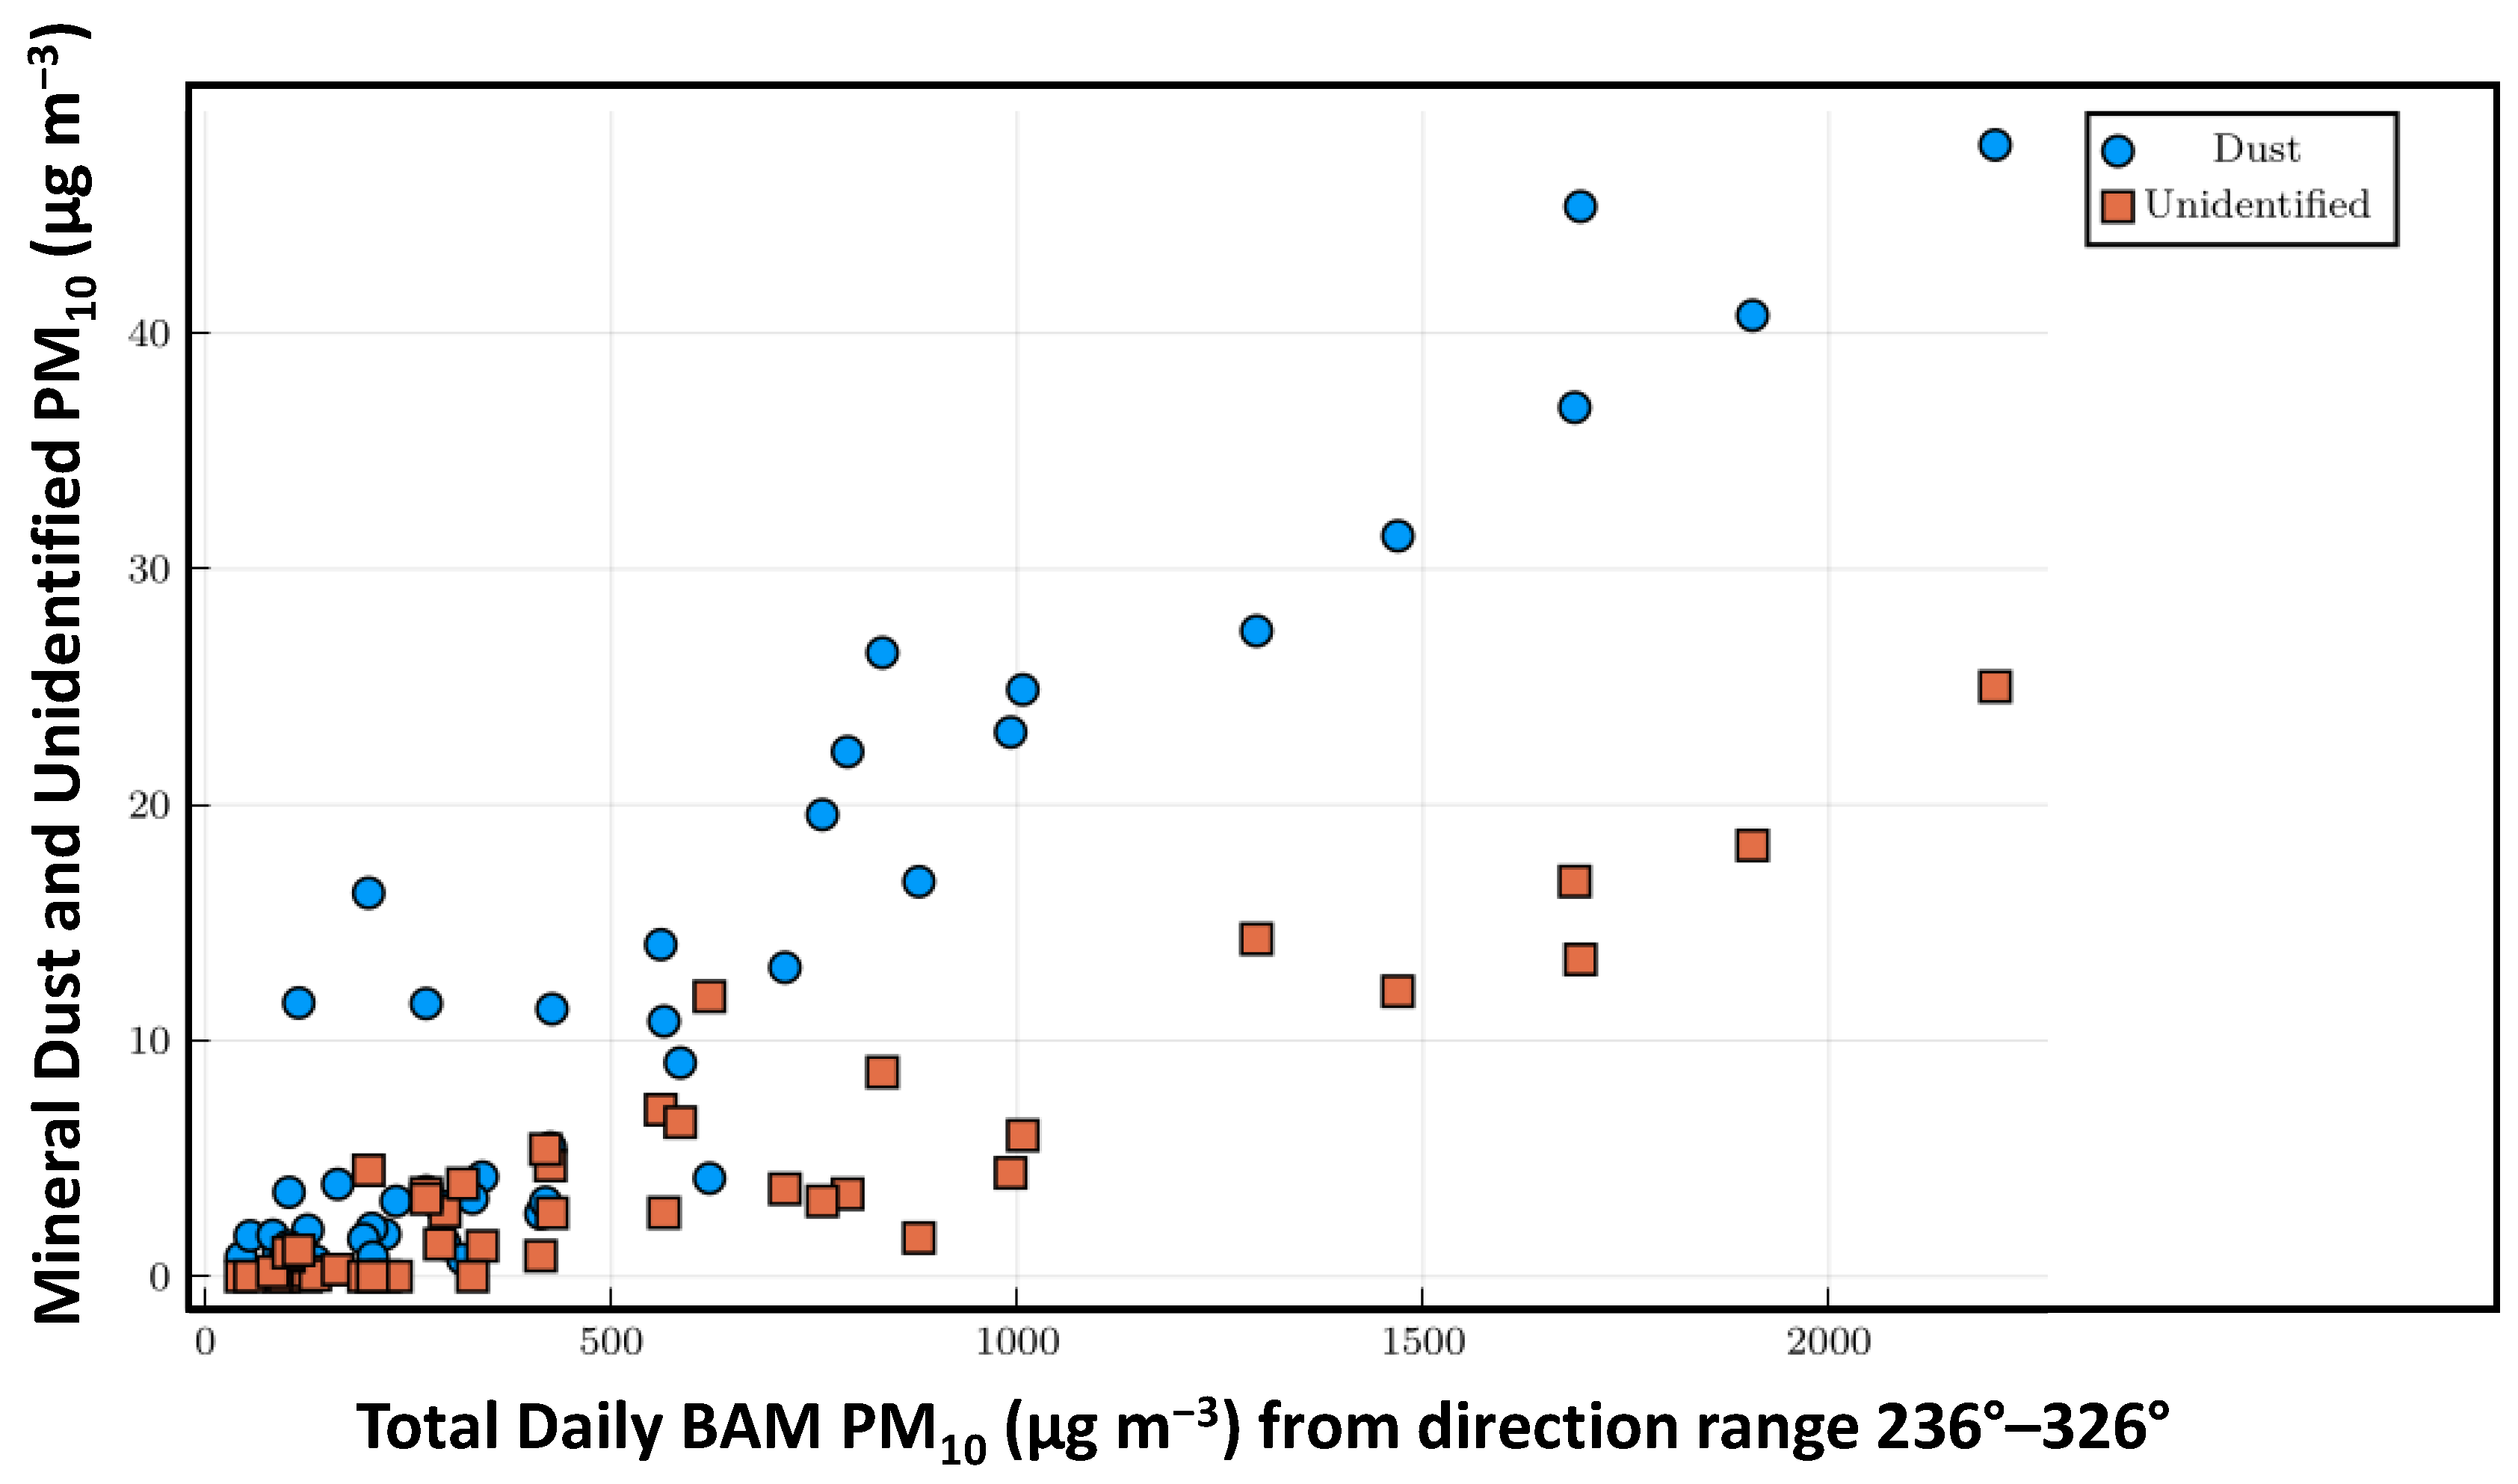
It is more likely that most of the unidentified mass represents the oxide components of the quartz and feldspar minerals common to the sands and of the carbonate minerals and/or the hydrated water in the clay minerals of the Oceano Dunes, as well as less-common minerals and their associated oxides. Equation (5) is a simplification for resolving very generalized mineral dust that was developed for rural sites in the IMPROVE network and cannot be made specific to a geographic area [50]. We arrived at the conclusion that the unidentified mass was largely oxide-associated and potentially some carbonate, as the wind and PM10 roses (Table 3) indicated that transport to the CDF for the identified exceedance days was dominated by periods when the wind direction was from the ODSVRA and the ocean. Our conclusion is further supported by the relation shown in Figure 15, which shows that the MD and unidentified PM10 concentrations increase as a function of the total 24 h PM10 measured with the BAM at the CDF when the wind direction range at the CDF is between 236 and 326°. That they increase as a function of increasing total PM10 for the same directional range supports that they are linked with the same source, i.e., saltation-driven dust emissions.
Assuming, as we suggest, that the unidentified component represents uncharacterized components of mineral-dust PM10 particles (i.e., the oxide components of the mineral particles), the range of attribution of MD to PM10 mass concentration on a generalized exceedance day (Figure 12) in April–October 2021 would be 45.3–81.7%, with sea salt accounting for a range between 10.5% and 39.5%.
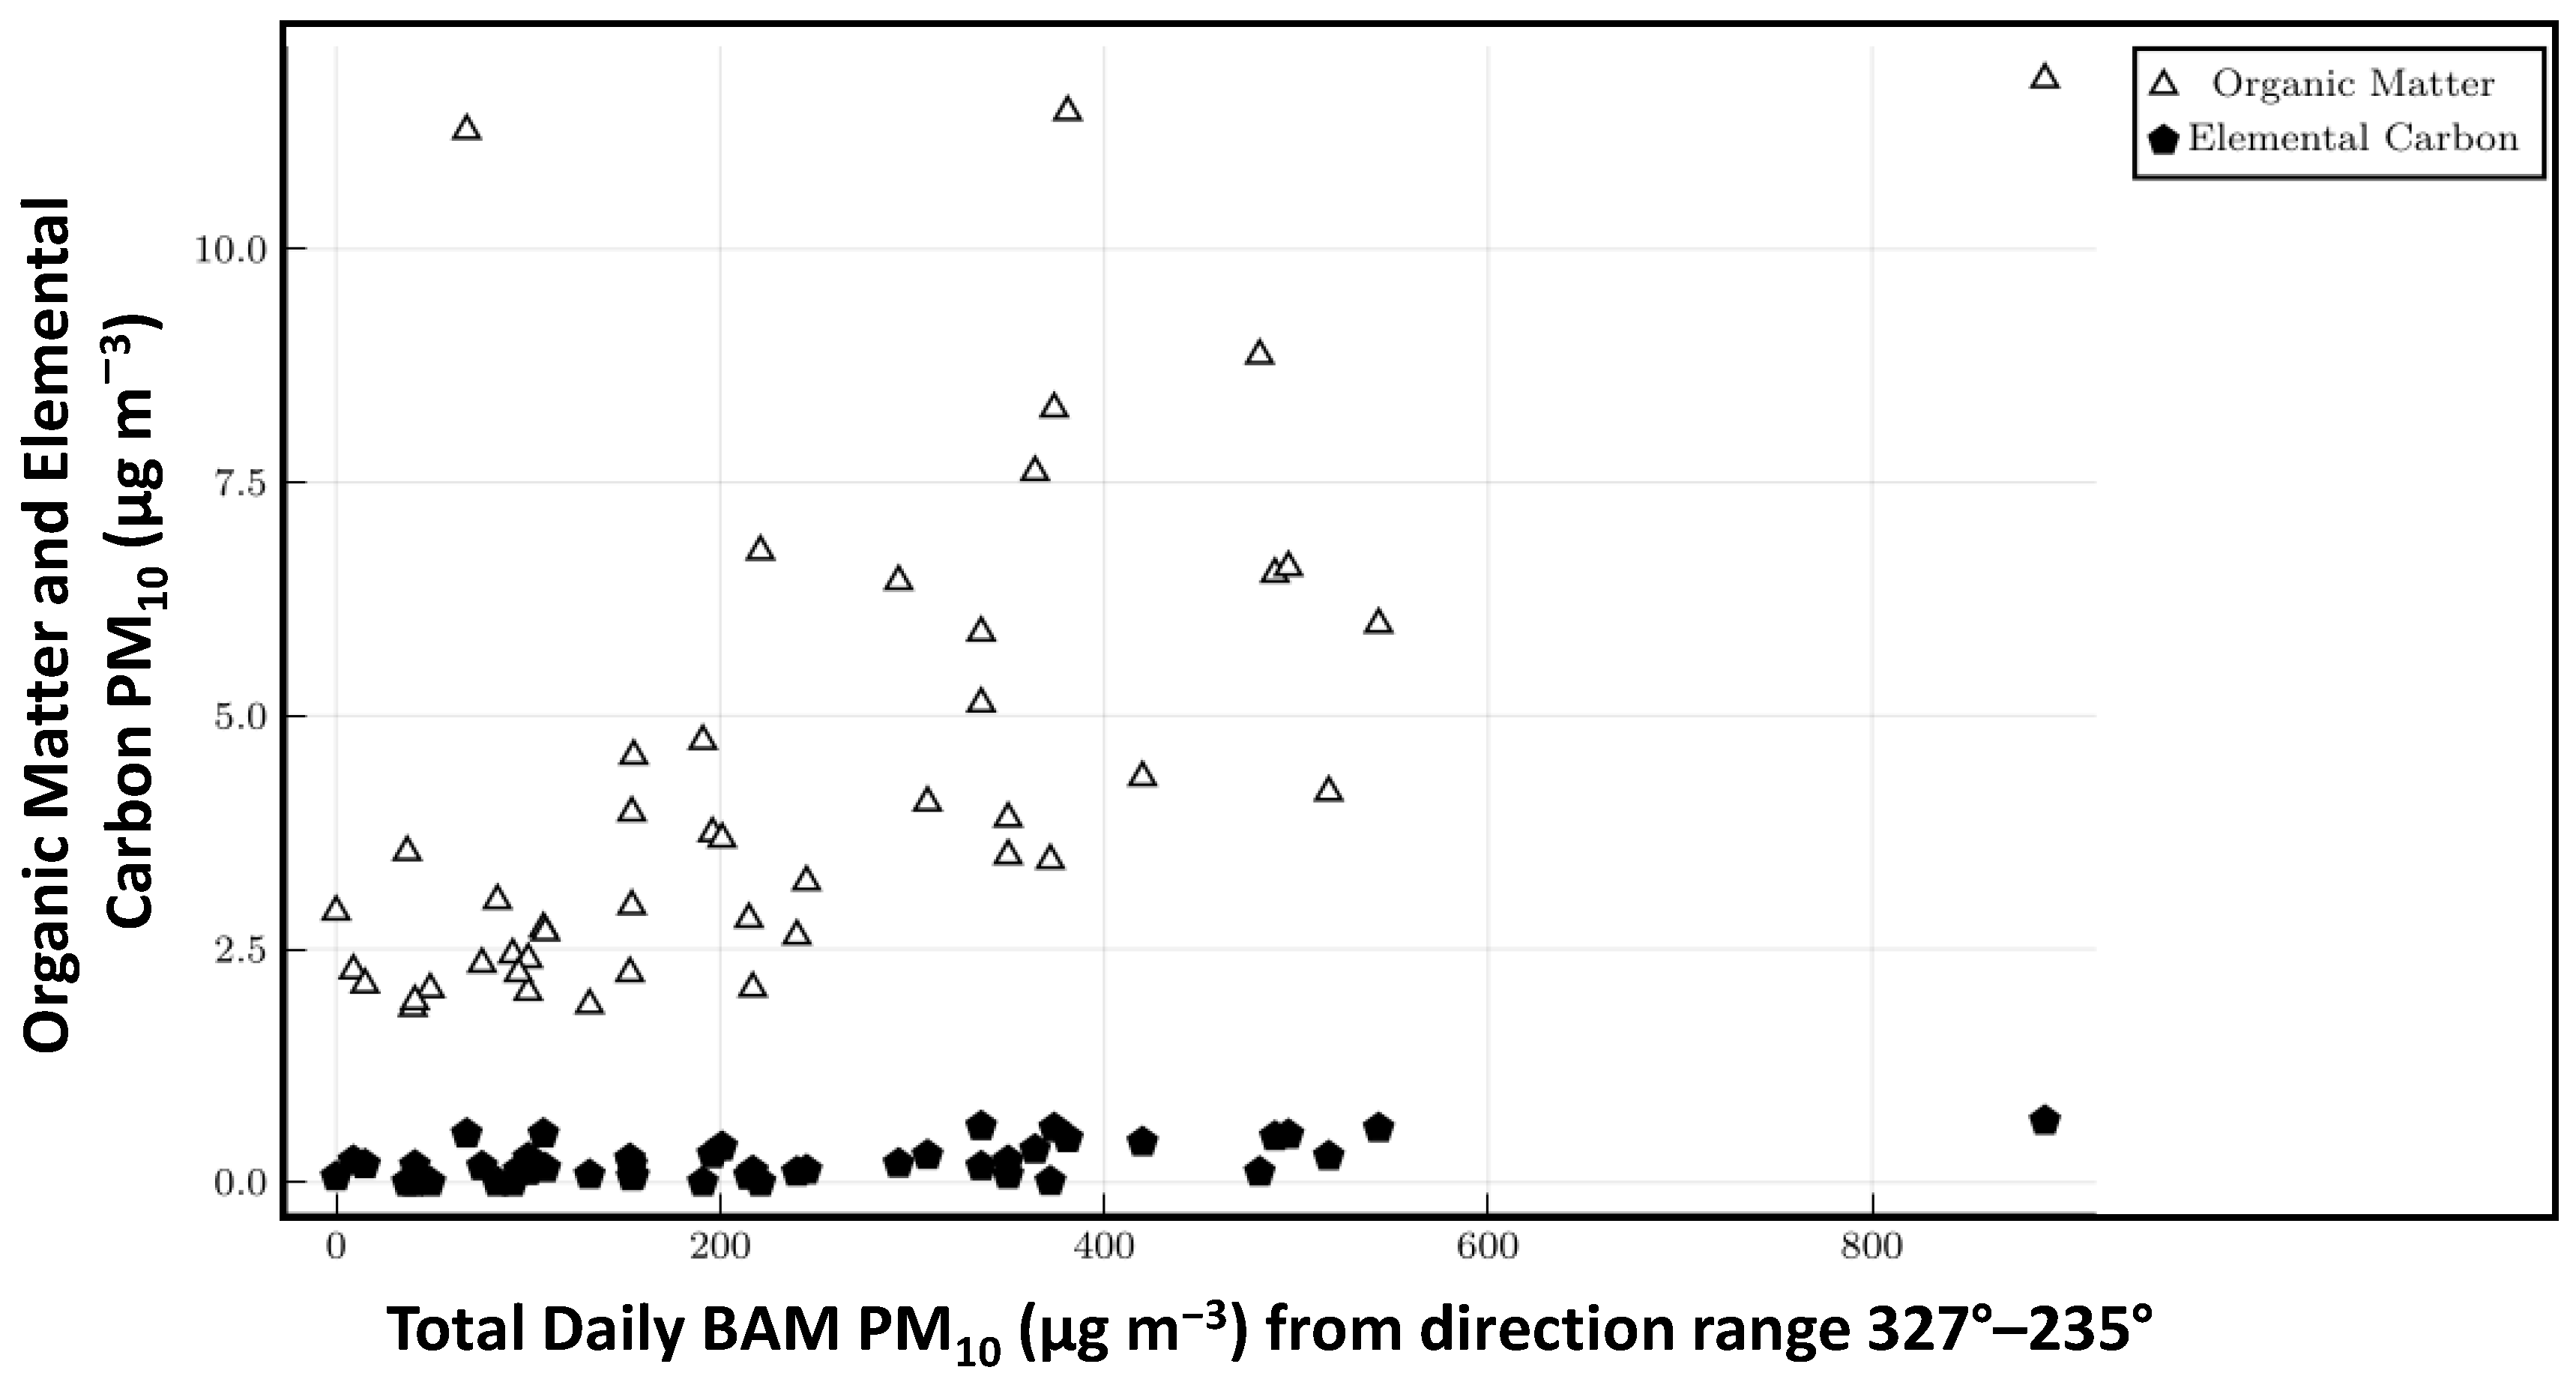
As the OM and EC components were quite low on the exceedance days, there was no indication of combustion processes as a significant contributor. Other significant PM10 sources between the CDF and the ODSVRA, for the semivolatile particles speculated by Lewis et al. [13], are implausible under the associated wind conditions, as upwind of the CDF is mainly open vegetation-covered areas until the eastern edge of the Oceano Dunes is reached. The presence of a significant source of semivolatile particles would have been accounted for in the quantification of the OM component, but an 8.0% attribution of OM in the PM10, as found in this analysis, suggests that significant contributions from semivolatile particles is unlikely. To further support this argument, Figure 16 shows the relation between the OM (which includes semivolatile species), the EC and the total 24 h PM10 as measured with the BAM at the CDF when the wind direction range was 327–235° (i.e., not from the direction of the ODSVRA) for all the valid sample days.
Under these conditions, the EC was relatively invariant while the OM generally increased with increasing total PM10, suggesting that the OM composition of the PM10 increased when transport to the CDF was not from the direction of the ODSVRA and there were greater contributions from combustion sources of particulate matter.
The other constituents of the PM10 (Figure 11), i.e., EC, OM, nitrate, and sulfate, were generated by sources that do not increase their emission strength as a function of increasing wind speed, as was the case for mineral dust emissions and sea salt. Under higher wind speeds, the PM10 from these sources would be more efficiently dispersed, which would lower their concentration and contribution to the total PM10 during a 24 h period if the winds were westerly.

4.3. Source Attribution for Non-Exceedance Days in 2021

The non-exceedance-day source attribution does not provide much useful information in terms of air-quality management with respect to the PM10 originating from the ODSVRA and reflects more the regional attribution of sources when MD is not actively being emitted in the ODSVRA under conditions of elevated wind speeds for westerly winds. The unidentified fraction (6.6% ± 6.0%) on the mean non-exceedance day was much lower than on the mean exceedance day (20.4% ± 2.9%), supporting our inference that a large portion of the unidentified fractions is likely related to mineral dust (i.e., oxides and/or carbonate and hydrated water in minerals), which had much higher concentrations on exceedance than non-exceedance days.

5. Conclusions

On days when the 24 h PM10 concentration equaled or exceeded the State of California Standard of 50 µg m−3 at the CDF monitoring station, mineral dust was a consequential contributor. For eight exceedance days between May and October 2021, mineral dust contribution ranged between 8.3% and 58.2%, with a mean-exceedance-day attribution of 43.1% (±15.3%). Assuming most of the unidentified mass represents the oxide components of the various minerals in the Oceano Dune sands, the mean-exceedance-day contribution of mineral dust increased to 63.5% (±18.2%). The source of this component of the PM10 is attributable to the wind-driven saltation and dust-emission processes within the ODSVRA. Exceedance days, as measured at the CDF, are most likely to occur when dust-laden air is transported from the direction of the ODSVRA to the CDF monitoring station. Over a three-year period, 2019–2022, >50% of exceedance days occurred when winds were from the direction range of 236–326°, with wind speed ≥ 3.6 m s−1 measured at the CDF, which likely corresponds with above threshold wind speed conditions for saltation and dust emissions as measured within the ODSVRA at the S1 tower.
Based on the results presented, the mitigative actions taken by California State Parks to reduce dust emissions are wholly justifiable as a management strategy to achieve the requirement of the Stipulated Order of Abatement of lowering PM10 to achieve the stated air-quality objective. Mineral dust was the largest contributor to the PM10 on days that exceeded the state standard for PM10 during the observation period, and controlling dust emission is the only viable strategy, as the other sources, particularly if the significant contribution of sea salt (25.1% ± 14.5%) is predominantly generated by wind and wave actions, cannot be controlled through an intervention strategy. If NaCl is also being derived from saltation and dust emissions, suppression of saltation via the methods being used within the ODSVRA is also the appropriate means to lower this PM10 constituent originating from the park.

Author Contributions

Conceptualization, K.A.T. and J.A.G.; methodology, K.A.T., D.A.C., X.W., S.K. and J.A.G.; validation, K.A.T., X.W. and S.K.; formal analysis, K.A.T., X.W., E.F.-C. and J.A.G.; writing—original draft preparation, X.W. and J.A.G.; writing—review and editing, K.A.T., X.W., J.A.G. and E.F.-C. All authors have read and agreed to the published version of the manuscript.

Funding

This research was funded by the California Department of Parks and Recreation, Contract C1953001 to DRI.

Institutional Review Board Statement

Not applicable.

Informed Consent Statement

Not applicable.

Data Availability Statement

Data are available from the DRI following a request to California State Parks, Off-Highway Motor Vehicle Recreation Division, 715 P Street, Sacramento, CA 95814.

Acknowledgments

We would like to acknowledge the support of C. Gibbons (SLOAPCD), who supported the field measurement campaign, and the intellectual contributions from E. Withycombe (California Air Resources Board, retired). T. Carmona of Parks provided the map. We also gratefully acknowledge the support provided by California State Park Project Managers R. Glick and J. O’Brien to carry out this work. The material is courtesy of California State Parks, 2022.

Conflicts of Interest

The authors declare no conflict of interest. The funders had no role in the design of this study; in the collection, analyses, or interpretation of data; in the writing of this manuscript; or in the decision to publish the results.

References

  1. Gillies, J.A.; Etyemezian, V.; Nikolich, G.; Glick, R.; Rowland, P.; Pesce, T.; Skinner, M. Effectiveness of an array of porous fences to reduce sand flux: Oceano Dunes, Oceano CA. J. Wind. Eng. Ind. Aerodyn. 2017, 168, 247–259. [Google Scholar] [CrossRef]
  2. Gillies, J.A.; Furtak-Cole, E.; Nikolich, G.; Etyemezian, V. The role of off-highway vehicle activity in augmenting dust emissions at the Oceano Dunes State Vehicular Recreation Area, Oceano, CA. Atmos. Environ. X 2022, 13, 100146. [Google Scholar] [CrossRef]
  3. Huang, Y.; Kok, J.F.; Martin, R.L.; Swet, N.; Katra, I.; Gill, T.E.; Reynolds, R.L.; Freire, L.S. Fine dust emissions from active sands at coastal Oceano Dunes, California. Atmos. Chem. Phys. 2019, 19, 2947–2964. [Google Scholar] [CrossRef] [Green Version]
  4. Mejia, J.F.; Gillies, J.A.; Etyemezian, V.; Glick, R. A very-high resolution (20 m) measurement-based dust emissions and dispersion modeling approach for the Oceano Dunes, California. Atmos. Environ. 2019, 218, 116977. [Google Scholar] [CrossRef]
  5. Swet, N.; Hilgendorf, Z.; Walker, I. UCSB Historical Vegetation Cover Change Analysis (1930–2020) within the Oceano Dunes SVRA 2022. Available online: https://ohv.parks.ca.gov/pages/1140/files/Memo%20Scientific%20Basis%20for%20Possible%20Revision%20of%20the%20Stipulated%20Order%20of%20Abatement%20(SOA).pdf (accessed on 3 January 2023).
  6. Walker, I.J.; Hilgendorf, Z.; Gillies, J.A.; Turner, C.M.; Furtak-Cole, E.; Nikolich, G. Assessing performance of a “nature-based” foredune restoration project, Oceano Dunes, California, USA. Earth Surf. Process. Landf. 2022, 48, 143–162. [Google Scholar] [CrossRef]
  7. Furtak-Cole, E.; Gillies, J.A.; Hilgendorf, Z.; Walker, I.J.; Nikolich, G. Simulation of flow and shear stress distribution on the Oceano Dunes, implications for saltation and dust emissions. Environ. Fluid Mech. 2022, 22, 1399–1420. [Google Scholar] [CrossRef]
  8. Wolfe, S.A.; Nickling, W.G. The protective role of sparse vegetation in wind erosion. Prog. Phys. Geogr. 1993, 17, 50–68. [Google Scholar] [CrossRef]
  9. San Luis Obispo County; Air Pollution Control District. Nipomo Mesa Particulate Study, San Luis Obispo Air Pollution Control District. 2007. Available online: https://storage.googleapis.com/slocleanair-org/images/cms/upload/files/Phase1PMStudyReport2.pdf (accessed on 4 January 2023).
  10. Craig, J.; Cahill, T.A.; Ono, D. South County Phase 2 Particulate Study. San Luis Obispo County Air Pollution Control District. 2010. Available online: https://storage.googleapis.com/slocleanair-org/images/cms/upload/files/PM2-final_report_with_appendices.pdf (accessed on 5 January 2023).
  11. San Luis Obispo County; Air Pollution Control District. 2018 Annual Air Quality Report, San Luis Obispo Air Pollution Control District. 2019. Available online: https://storage.googleapis.com/slocleanair-org/images/cms/upload/files/2018aqrt-FINAL.pdf (accessed on 5 January 2023).
  12. Swet, N.; Elperin, T.; Kok, J.F.; Martin, R.L.; Yizhaq, H.; Katra, I. Can active sands generate dust particles by wind-induced processes? Earth Planet. Sci. Lett. 2019, 506, 371–380. [Google Scholar] [CrossRef] [Green Version]
  13. Lewis, S.L.; Russell, L.M.; McKinsey, J.A.; Harris, W.J. Small contributions of dust to PM2.5 and PM10 concentrations measured downwind of Oceano Dunes. Atmos. Environ. 2022, 294, 119515. [Google Scholar] [CrossRef]
  14. US Environmental Protection Agency. List of Designated Reference and Equivalent Methods, United States Environmental Protection Agency. 15 December 2022. Available online: https://www.epa.gov/system/files/documents/2022-12/ListofFRMandFEM.pdf (accessed on 5 January 2023).
  15. California Air Resources Board. AQSB SOP 404: Standard Operating Procedures for Thermo Scientific Partisol Model 2025i Sequential Air Sampler, California Air Resources Board, Monitoring and Laboratory Division, 2020; California Air Resources Board: Sacramento, CA, USA, 2020. [Google Scholar]
  16. San Luis Obispo County; Air Pollution Control District. Standard Operating Procedures for MetOne Instruments BAM 1020 Beta Attenuation Particulate Matter Monitor, San Luis Obispo Air Pollution Control District, 2014; San Luis ObispoCounty Air Pollution Control District: San Luis Obispo, CA, USA, 2014. [Google Scholar]
  17. Chow, J.C.; Watson, J.G. Chemical Analyses of Particle Filter Deposits. In Aerosols Handbook: Measurement, Dosimetry, and Health Effects, 2nd ed.; Ruzer, L., Harley, N.H., Eds.; CRC Press/Taylor & Francis: New York, NY, USA, 2013; pp. 179–204. [Google Scholar]
  18. Watson, J.G.; Chow, J.C.; Engling, G.; Chen, L.-W.A.; Wang, X.L. Source Apportionment: PRINCIPLES and Methods. In Airborne Particulate Matter: Sources, Atmospheric Processes and Health; Harrison, R.M., Ed.; Royal Society of Chemistry: London, UK, 2016; pp. 72–125. [Google Scholar]
  19. Watson, J.G.; Tropp, R.J.; Kohl, S.D.; Wang, X.L.; Chow, J.C. Filter processing and gravimetric analysis for suspended particulate matter samples. Aerosol Sci. Eng. 2017, 1, 93–105. [Google Scholar] [CrossRef]
  20. South Coast Air Quality Management District. SOP 00104: Standard Operating Procedure for Weigh Room Operations and Weighing of PM2.5 Samples; South Coast Air Quality Management District: Diamond Bar, CA, USA, 2018. [Google Scholar]
  21. Watson, J.G.; Chow, J.C.; Frazier, C.A. X-ray fluorescence analysis of ambient air samples. In Elemental Analysis of Airborne Particles; Landsberger, S., Creatchman, M., Eds.; Gordon and Breach Science: Amsterdam, The Netherlands, 1999; Volume 1, pp. 67–96. [Google Scholar]
  22. Chow, J.C.; Watson, J.G. Enhanced ion chromatographic speciation of water-soluble PM2.5 to improve aerosol source apportionment. Aerosol Sci. Eng. 2017, 1, 7–24. [Google Scholar] [CrossRef]
  23. Chen, L.-W.A.; Chow, J.C.; Wang, X.L.; Robles, J.A.; Sumlin, B.; Lowenthal, D.H.; Zimmermann, R.; Watson, J.G. Multi-wavelength optical measurement to enhance thermal/optical analysis for carbonaceous aerosol. Atmos. Meas. Tech. 2015, 8, 451–461. [Google Scholar] [CrossRef] [Green Version]
  24. Chow, J.C.; Watson, J.G.; Chen, L.-W.A.; Chang, M.C.O.; Robinson, N.F.; Trimble, D.; Kohl, S. The IMPROVE_A temperature protocol for thermal/optical carbon analysis: Maintaining consistency with a long-term database. J. Air Waste Manag. Assoc. 2007, 57, 1014–1023. [Google Scholar] [CrossRef] [Green Version]
  25. Martin, R.F. General Deming regression for estimating systematic bias and its confidence interval in method-comparison studies. Clin. Chem. 2002, 46, 100–104. [Google Scholar] [CrossRef]
  26. R Core Team. R: A Language and Environment for Statistical Computing; R Foundation for Statistical Computing: Vienna, Austria, 2021; Available online: https://www.R-project.org/ (accessed on 15 December 2022).
  27. Therneau, T.; Deming, T.-S. Passing-Bablock and Total Least Squares Regression, R package version 1.4. 2018. Available online: https://CRAN.R-project.org/package=deming (accessed on 15 December 2022).
  28. Wang, X.L.; Chen, L.-W.A.; Lu, M.; Ho, K.-F.; Lee, S.-C.; Ho, S.S.H.; Chow, J.C.; Watson, J.G. Apportionment of vehicle fleet emissions by linear regression, positive matrix factorization, and emission modeling. Atmosphere 2022, 13, 1066. [Google Scholar] [CrossRef]
  29. Veron, F. Ocean spray. Annu. Rev. Fluid Mech. 2015, 47, 507–538. [Google Scholar] [CrossRef]
  30. Seinfeld, J.H.; Pandis, S.N. Atmospheric Chemistry and Physics: From Air Pollution to Climate Change, 2nd ed.; John Wiley & Sons: New York, NY, USA, 2012. [Google Scholar]
  31. McInnes, L.M.; Covert, D.S.; Quinn, P.K.; Germani, M.S. Measurements of chloride depletion and sulfur enrichment in individual sea-salt particles collected from the remote marine boundary layer. J. Geophys. Res. Atmos. 1994, 99, 8257–8268. [Google Scholar] [CrossRef]
  32. Cheung, K.; Daher, N.; Shafer, M.M.; Ning, Z.; Schauer, J.J.; Sioutas, C. Diurnal trends in coarse particulate matter composition in the Los Angeles Basin. J. Environ. Monit. 2011, 13, 3277–3287. [Google Scholar] [CrossRef]
  33. Lowenthal, D.; Kumar, N. Light Scattering from Sea-Salt Aerosols at Interagency Monitoring of Protected Visual Environments (IMPROVE) Sites. J. Air Waste Manag. Assoc. 2006, 56, 636–642. [Google Scholar] [CrossRef] [PubMed] [Green Version]
  34. Zhuang, H.; Chan, C.K.; Fang, M.; Wexler, A.S. Formation of nitrate and non-sea-salt sulfate on coarse particles. Atmos. Environ. 1999, 33, 4223. [Google Scholar] [CrossRef]
  35. Bardouki, H.; Liakakou, H.; Economou, C.; Sciare, J.; Smolík, J.; Ždímal, V.; Eleftheriadis, K.; Lazaridis, M.; Dye, C.; Mihalopoulos, N. Chemical composition of size-resolved atmospheric aerosols in the eastern Mediterranean during summer and winter. Atmos. Environ. 2003, 37, 195–208. [Google Scholar] [CrossRef]
  36. Chow, J.C.; Lowenthal, D.H.; Chen, L.-W.A.; Wang, X.L.; Watson, J.G. Mass reconstruction methods for PM2.5: A review. Air Qual. Atmos. Health 2015, 8, 243–263. [Google Scholar] [CrossRef] [PubMed] [Green Version]
  37. Simon, H.; Bhave, P.V.; Swall, J.L.; Frank, N.H.; Malm, W.C. Determining the spatial and seasonal variability in OM/OC ratios across the US using multiple regression. Atmos. Chem. Phys. 2011, 11, c2933–c2949. [Google Scholar] [CrossRef] [Green Version]
  38. Hand, J.L.; Copeland, S.A.; McDade, C.E.; Day, D.E.; Moore, J.C.T.; Dillner, A.M.; Pitchford, M.L.; Indresand, H.; Schichtel, B.A.; Malm, W.C.; et al. Spatial and Seasonal Patterns and Temporal Variability of Haze and Its Constituents in the United States, IMPROVE Report, V. Cooperative Institute for Research in the Atmosphere, Fort Collins, CO. 2011. Available online: https://vista.cira.colostate.edu/Improve/spatial-and-seasonal-patterns-and-temporal-variability-of-haze-and-its-constituents-in-the-united-states-report-v-june-2011/ (accessed on 7 January 2023).
  39. Pakkanen, T.A. Study of formation of coarse particle nitrate aerosol. Atmos. Environ. 1996, 30, 2475–2482. [Google Scholar] [CrossRef]
  40. Usher, C.R.; Michel, A.E.; Grassian, V.H. Reactions on mineral dust. Chem. Rev. 2003, 103, 4883–4940. [Google Scholar] [CrossRef]
  41. San Luis Obispo County; Air Pollution Control District. 2021 Ambient Air Monitoring Network Plan, San Luis Obispo Air Pollution Control District. 2021. Available online: https://storage.googleapis.com/slocleanair-org/images/cms/upload/files/2021-network-plan-for-publication.pdf (accessed on 5 January 2023).
  42. Lu, H.; Shao, Y. A new model for dust emission by saltation bombardment. J. Geophys. Res. Atmos. 1999, 104, 16827–16842. [Google Scholar] [CrossRef] [Green Version]
  43. Shao, Y. Physics and Modelling of Wind Erosion; Kluwer Academic Publishers: Dordrecht, The Netherlands, 2000. [Google Scholar]
  44. Shao, Y. A model for mineral dust emission. J. Geophys. Res. 2001, 106, 20239–20254. [Google Scholar] [CrossRef]
  45. Ovadnevaite, J.; Manders, A.; de Leeuw, G.; Ceburnis, D.; Manahan, C.; Partanen, A.-I.; Korhonen, H.; O’Dowd, C.D. A sea spray aerosol flux parameterization encapsulating wave state. Atmos. Chem. Phys. 2014, 14, 1837–1852. [Google Scholar] [CrossRef] [Green Version]
  46. Erinin, M.A.; Wang, S.D.; Liu, R.; Towle, D.; Liu, X.; Duncan, J.H. Spray generation by a plunging breaker. Geophys. Res. Lett. 2019, 46, 8244–8251. [Google Scholar] [CrossRef]
  47. Martin, S.T. Phase transitions of aqueous atmospheric particles. Chem. Rev. 2000, 100, 3403–3454. [Google Scholar] [CrossRef]
  48. McInnes, L.M.; Quinn, P.K.; Covert, D.S.; Anderson, T.L. Gravimetric analysis, ionic composition, and associated water mass of the marine aerosol. Atmos. Environ. 1996, 30, 869–884. [Google Scholar] [CrossRef]
  49. King, J.; Etyemezian, V.; Sweeney, M.; Buck, B.J.; Nikolich, G. Dust emission variability at the Salton Sea, California, USA. Aeolian Res. 2011, 3, 67–79. [Google Scholar] [CrossRef]
  50. Malm, W.; Sisler, J.; Huffman, D.; Eldred, R.; Cahill, T. Spatial and seasonal trends in particle concentration and optical extinction in the United States. J. Geophys. Res. 1994, 99, 1347–1370. [Google Scholar] [CrossRef]
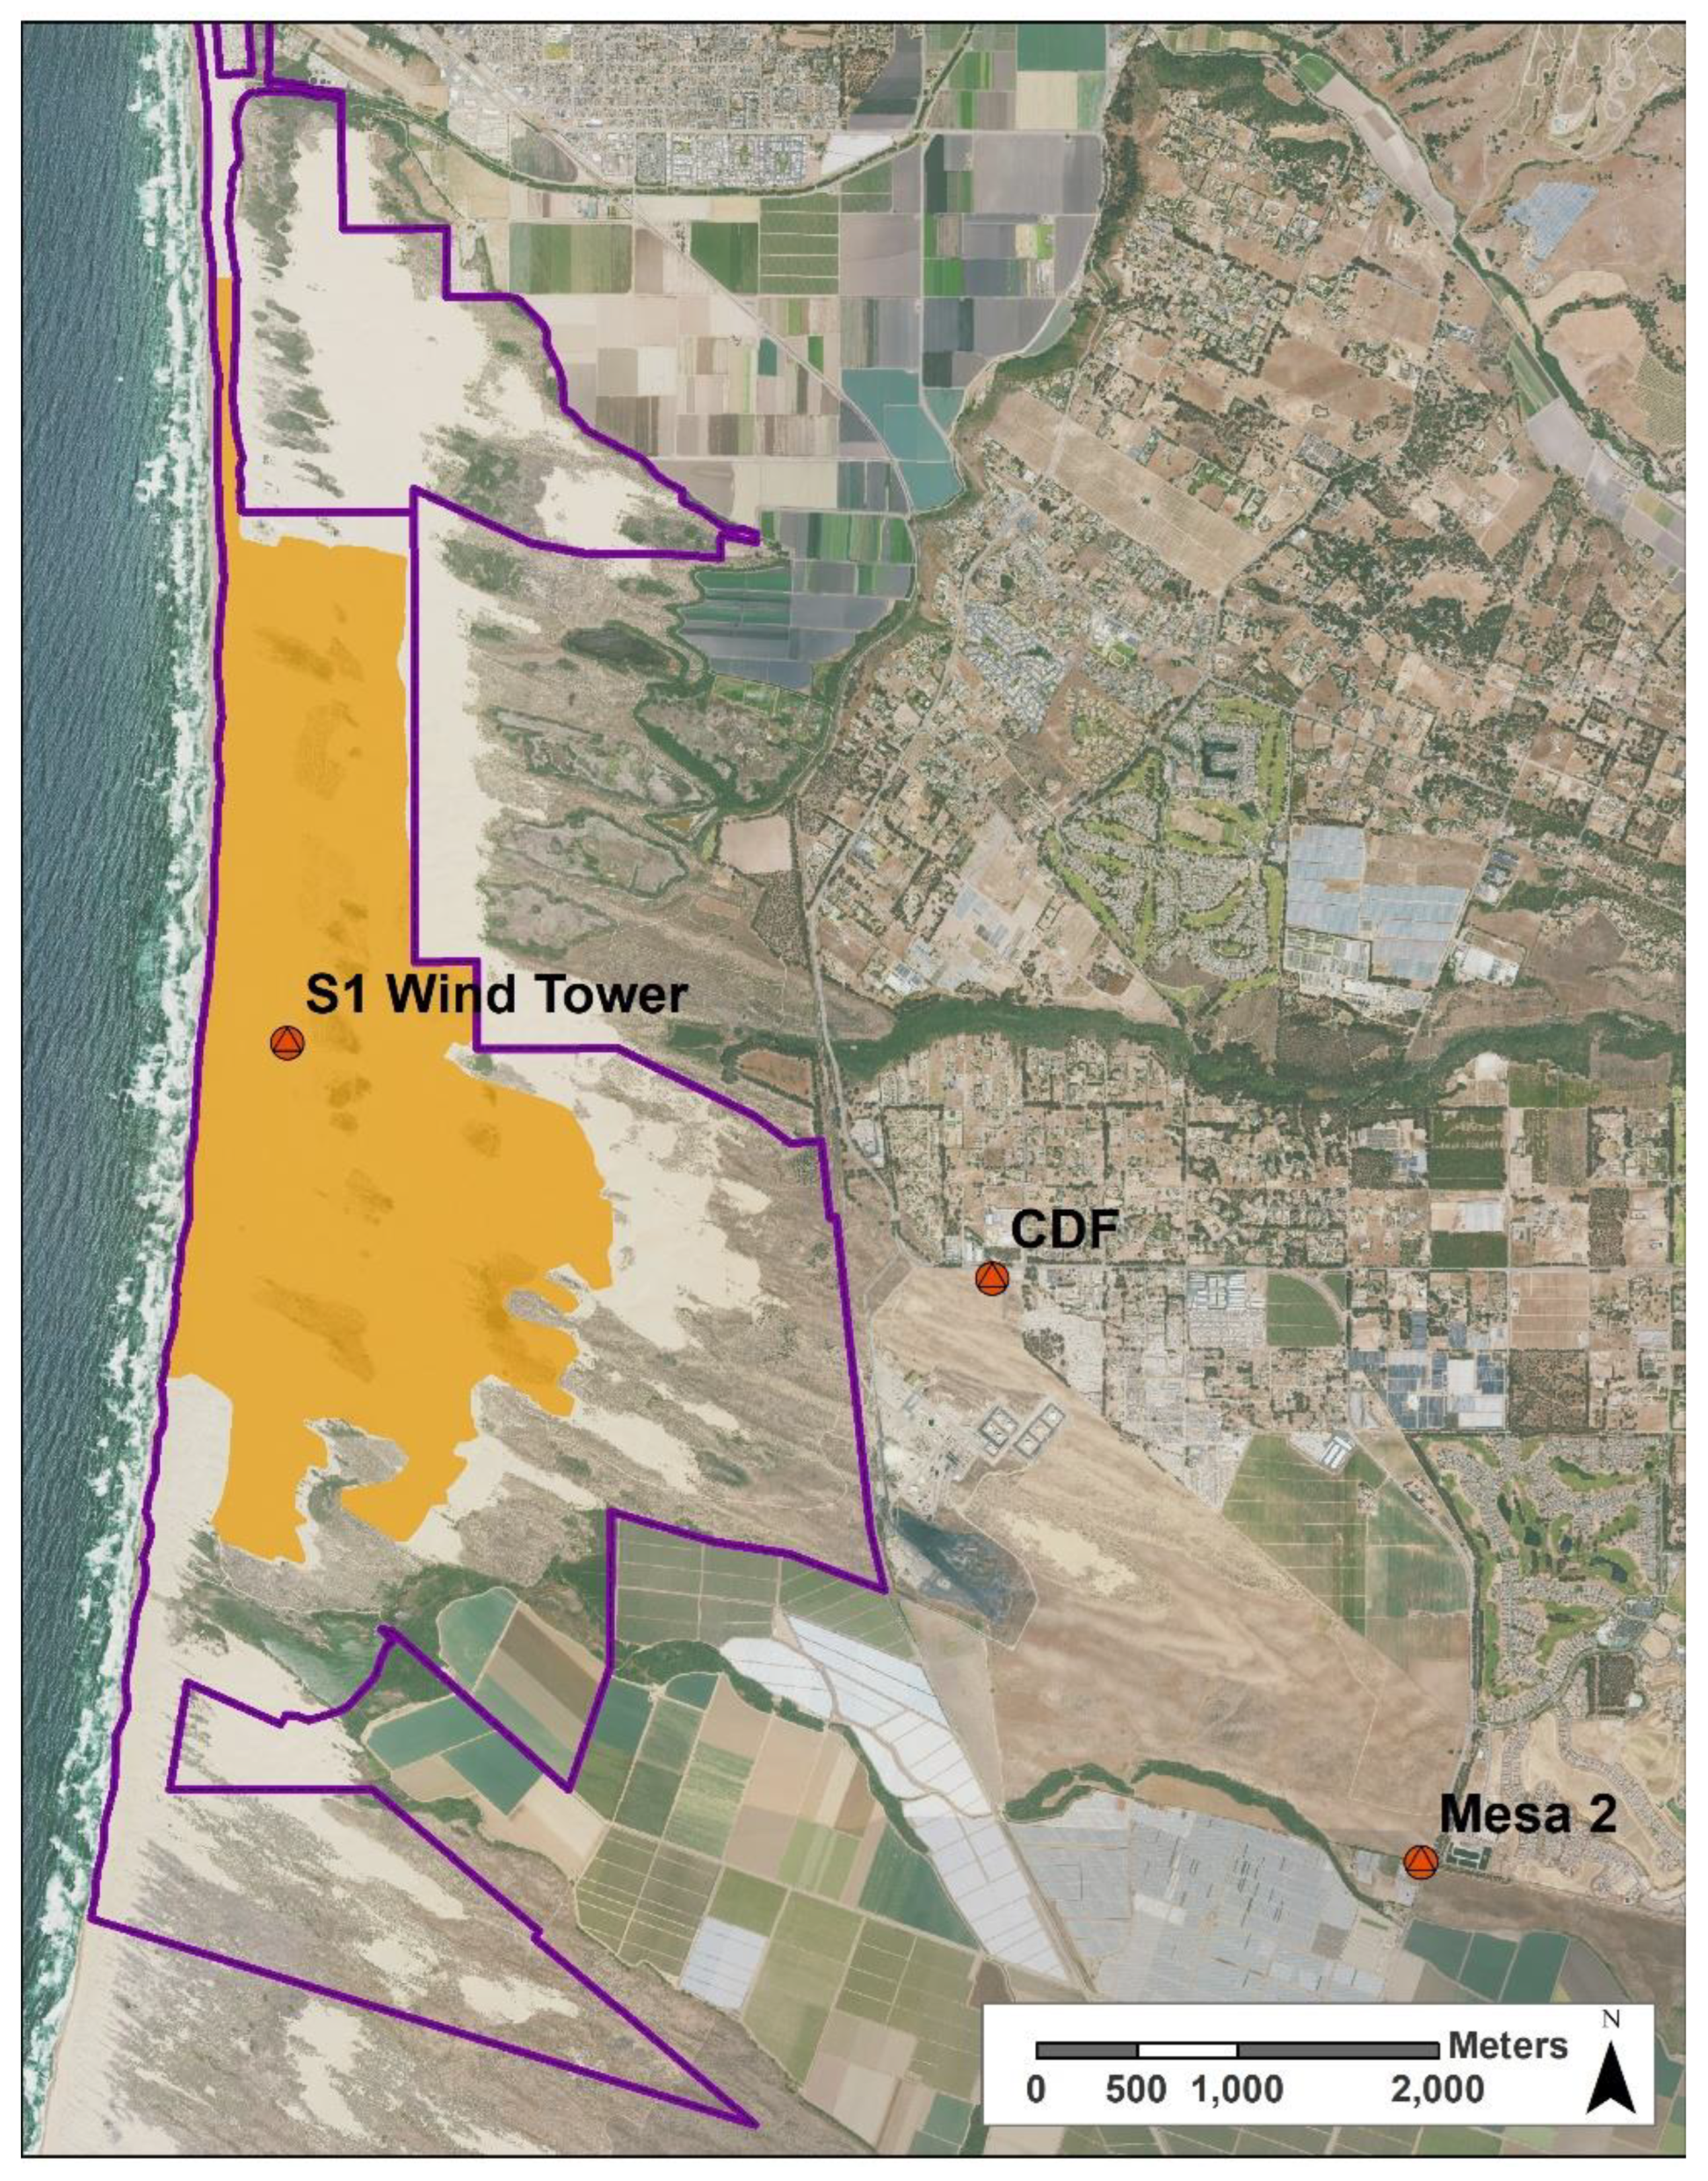
Figure 1. The location of the APCD’s environmental monitoring station, the CDF, with respect to the ODSVRA. The shaded area demarcates the riding area of the ODSVRA. The solid purple line demarcates the boundary of the ODSVRA. A red circle in the shaded area identifies the location of a 10 m tower designated as S1, where in-park meteorological data are collected, and Mesa2 is another of the APCD’s monitoring stations.
Atmosphere 14 00718 g001
Figure 2. The Partisol samplers and BAM 1020 monitors at the CDF sampling site. All sampler inlets (Partisols and BAMs) were approximately 4.0 m above ground level (Photo credit, David Cardiel).
Atmosphere 14 00718 g002
Figure 3. The validated mean 24 h PM10 (µg m−3) concentration for the days sampled between April and October 2021. Concentration of PM10 was determined from gravimetric analysis of the Teflon-membrane filter. The horizontal line represents the state mean 24 h PM10 standard of 50 µg m−3.
Atmosphere 14 00718 g003
Figure 4. Correlation between water-soluble cations and anions.
Atmosphere 14 00718 g004
Figure 5. Correlations between: (a) Mg2+ and Na+, (b) K+ and Na+. The dashed lines indicate ion ratios in fresh seawater.
Atmosphere 14 00718 g005
Figure 6. Correlations between: (a) Ca2+ and Na+, (b) SO42− and Na+. The dashed lines indicate ion ratios in fresh seawater.
Atmosphere 14 00718 g006
Figure 7. Correlations between: (a) Cl and Na+, (b) NO3 and excess Na+. Dashed line in (a) indicates the typical fresh sea-salt-particles’ Cl/Na+ mass ratio of 1.8. Dashed line in (b) is the 1:1 line.
Atmosphere 14 00718 g007
Figure 8. Ratio of aged over fresh sea salt (AS/FS) as a function of PM10 concentration.
Atmosphere 14 00718 g008
Figure 9. Correlation between reconstructed and gravimetric PM10 mass concentrations.
Atmosphere 14 00718 g009
Figure 10. Concentration of PM10 chemical constituents (stacked bars) and gravimetric mass () for the days sampled between April and October 2021. The horizontal line represents the state mean 24 h PM10 standard of 50 µg m−3.
Atmosphere 14 00718 g010
Figure 11. PM10 mass percentages of chemical constituents (stacked bars) and gravimetric mass () for the days sampled between April and October 2021.
Atmosphere 14 00718 g011
Figure 12. The mean source attribution of PM10, representing the eight exceedance days between April and October 2021. Note: OM, organic matter; EC, elemental carbon; FS, fresh sea salt; and AS, aged sea salt. Error bars represent the standard deviation of the mean based on the eight sample days.
Atmosphere 14 00718 g012
Figure 13. The mean source attribution of PM10, representing the non-exceedance days between April and October 2021. Error bars represent the standard deviations of the means based on 39 sample days.
Atmosphere 14 00718 g013
Figure 14. The fractions of the 24 h periods for the wind direction ranges of 236–326° (white portion of bar) and 327–235° (black portion of bar) for the 20 days with the highest 24 h mean PM10 values above 50 µg m−3, 2019–2022.
Atmosphere 14 00718 g014
Figure 15. The relation between the MD and unidentified components of the PM10 and the total daily PM10 calculated from the BAM for all the valid sampling days from April to October 2021.
Atmosphere 14 00718 g015
Figure 16. The relation between the OM and EC components of the PM10 and the total daily PM10 calculated from the BAM for all the valid sampling days from April to October 2021.
Atmosphere 14 00718 g016
Table 1. BAM vs. gravimetric PM10 concentration comparisons, linear regressions.
ComparisonSample SizeLinear RegressionLinear Regression through the Origin
SlopeInterceptR2SlopeR2
(95% CI)(95% CI)(95% CI)
SLOAPCD BAM vs. DRI Gravimetric531.047−0.4210.9931.0380.997
(1.023–1.071)(−1.323–0.481)(1.024–1.053)
SLOAPCD BAM vs. SCAQMD Gravimetric241.004−0.1280.98710.996
(0.956–1.051)(−1.675–1.419)(0.973–1.027)
Table 2. BAM vs. gravimetric PM10 concentration comparisons—Deming regression and CVUB results.
ComparisonSample SizeDeming RegressionDeming Regression through the OriginCVUB
SlopeInterceptSlope
(95% CI)(95% CI)(95% CI)
SLOAPCD BAM vs. DRI Gravimetric531.0140.3071.0326.44%
(0.981–1.046)(−0.129–0.907)(1.010–1.054)
SLOAPCD BAM vs. SCAQMD Gravimetric241.003−0.2360.9877.05%
(0.947–1.060)(−1.076–0.605)(0.947–1.027)
Table 3. Days that exceeded the state 24 h mean PM10, wind and PM10 directional relations, and the attribution of PM10 mass based on the hours of transport from the direction of the ODSVRA to the CDF.
Date24 h PM10 (µg m−3)Wind RosePM10 RoseSource Attribution% Mass from Direction of ODSVRA
4 May 202150Atmosphere 14 00718 i001Atmosphere 14 00718 i002Atmosphere 14 00718 i00358
7 May 202170Atmosphere 14 00718 i004Atmosphere 14 00718 i005Atmosphere 14 00718 i00684
19 May 2021103Atmosphere 14 00718 i007Atmosphere 14 00718 i008Atmosphere 14 00718 i00989
12 June 202161Atmosphere 14 00718 i010Atmosphere 14 00718 i011Atmosphere 14 00718 i01271
15 June 202190Atmosphere 14 00718 i013Atmosphere 14 00718 i014Atmosphere 14 00718 i01593
19 September 202178Atmosphere 14 00718 i016Atmosphere 14 00718 i017Atmosphere 14 00718 i01885
28 September 202182Atmosphere 14 00718 i019Atmosphere 14 00718 i020Atmosphere 14 00718 i02192
13 October 202153Atmosphere 14 00718 i022Atmosphere 14 00718 i023Atmosphere 14 00718 i02463
(one hour of missing BAM data)
Atmosphere 14 00718 i025Atmosphere 14 00718 i026
Disclaimer/Publisher’s Note: The statements, opinions and data contained in all publications are solely those of the individual author(s) and contributor(s) and not of MDPI and/or the editor(s). MDPI and/or the editor(s) disclaim responsibility for any injury to people or property resulting from any ideas, methods, instructions or products referred to in the content.