Article

Airglow Imaging Observations of Plasma Blobs: Merging and Bifurcation during Solar Minimum over Tropical Region

Heliophysics, Planetary Science and Aeronomy Division, National Institute for Space Research (INPE), São José dos Campos 12227-010, Brazil
*
Author to whom correspondence should be addressed.
Atmosphere 2023, 14(3), 514; https://doi.org/10.3390/atmos14030514
Submission received: 5 January 2023 / Revised: 23 February 2023 / Accepted: 1 March 2023 / Published: 7 March 2023

Abstract

:
Plasma blobs are night-time ionospheric irregularities whose generation mechanism is still under investigation. A large number of observations highlighted several aspects of their morphology and dynamics. However, the plasma blobs have not been attributed convincingly to a known mechanism. We analyzed the OI 630.0 nm emission images during March and October of 2019 and 2020 (minimum solar activity) using the ground-based all-sky imager at ZF-2 (2.58° S, 60.22° W) in the Amazon region of Brazil. The novelties of the present study are the rarely reported observation of both plasma blob merging and bifurcation. We studied the evolutional dynamics of plasma blobs and observed that blobs are distinct phenomena with unique properties. We attribute the merging of plasma blobs to the “wind reversion effect” (WRE) mechanism caused by a change in the direction of the zonal thermospheric wind from east to west. In some cases, the slower-drifting plasma blobs may merge with the faster ones. Moreover, blobs were observed initially bifurcating at the topside and later divided into two. The activity of the polarized electric field inside the plasma bubble mapping along the magnetic field lines is possibly responsible for the blob’s bifurcation. Subjecting the two features of ionospheric plasma blobs to simulation may reveal further the physics of blobs’ merging and bifurcation.

1. Introduction

Plasma instability occurring at the bottom side of the F-region in the night-time ionosphere has been responsible for the main cause of plasma irregularities, leading to the observation of a variety of phenomena ranging from equatorial through low-latitude regions [1]. Equatorial plasma bubbles (EPBs) are consequences of these plasma instabilities [2]. In the tropical F-region, these irregular structures show electron density depletions compared to the background ionospheric and are frequently called “equatorial spread-F” (ESF) or plasma bubbles. In 1982, Ref. [3] carried out early ground-based all-sky imaging observations of ionospheric plasma bubbles, using an image intensifier and photographic recording. On the other hand, using data from the Hinotori satellite, with an altitude of 650 km, Ref. [4] reported the first observations of localized regions of plasma density enhancements or plasma blobs, with densities increased by a factor of two, or more, above the background density. Their statistical study showed that the occurrence probabilities of the plasma blobs and plasma bubbles appear to be complementary to each other. In addition, Ref. [5] using all-sky images in the OI 630 nm emission, were the first to report ground-based observations of blobs in the tropical region and their association with equatorial spread-F plasma depletions. However, the relationship between the blobs and bubbles is still under investigation.
Several authors have reported various mechanisms that could be responsible for the generation of plasma blobs [2,4,5,6,7,8]. Ref. [7] suggested that plasma enhancements can occur at different altitudes and latitudes over the entire process of bubble evolution. According to them, at the early stage of the Rayleigh–Taylor instability, the E × B drift caused by the polarization electric field lifts the F-region, resulting in plasma enhancements in the topside F-region. Their study suggests that when the depleted region reaches the topside F-region, plasma enhancements occur just over the upper boundary of the depletions. At the late stage of the bubble evolution, plasma depletions exist near the magnetic equator, and plasma enhancements form at higher latitudes over the same longitudes. They suggest that bubbles could split the blob into two parts during vertical growth (see Figure 8 in [7]). Ref. [8] indicates the possibility that meridional wind is crucial and essential in developing plasma blobs. Ref. [5] using ground-based optical and radio techniques in the Brazilian tropical sector showed that the blob develops just after the reversal of the electric field when the drift velocity changes from upward (eastward electric field) to downward (westward electric field). According to them, the density increments could be further reinforced if the background ionosphere moves downward in the region near the equatorial anomaly crest. In addition, Ref. [9] reported two cases of low-latitude plasma blobs over Africa, and they found that the blobs exhibit similar properties as reported for Central/South America. They concluded that blobs are more related to the intensified equatorial ionization anomaly (EIA). Thus, they attributed the formation of blobs to the EIA dynamics. To reach a consensus as to the mechanism responsible for the generation of plasma blobs, it is imperative to investigate the morphology and dynamics of these structures since their signatures have been reported with other phenomena, MSTIDs [10], plasma bubbles [5], magnetic field line fluctuations [6], and EIA [9]. In this work, plasma blobs merging, and bifurcation are reported for the first time.
Plasma bubble merging and bifurcation are plasma instability processes observed in various space plasma studies [11,12]. In this context, plasma blob merging is the process of two blobs joining to form a resultant blob with a significant increase in the scale size. On the other hand, the bifurcation of plasma blobs can be defined as the process in which the upper part splits into two parts during the developmental phase. However, the blob regions that split remain connected to the bottom side of the blob. Ref. [13] reported the first observations of detached equatorial ionospheric plasma depletions using OI 630.0 nm and OI 777.4 nm emission nightglow imaging. They ruled out the contribution of the disturbance dynamo of the electric field in the occurrence of plasma bubble detachment based on their explanation because the observation periods were geomagnetically quiet. The detachment was found to be more prominent at the west arm of the plasma bubble in the three cases of plasma bubble detachment reported. They linked plasma bubble detachment to non-homogeneous vertical plasma drift caused by the non-homogeneous zonal electric field inside the bubble. In addition, Ref. [14] similarly observed the western wall of the plasma bubbles investigated to be more stable than the eastern wall.
On the other hand, Ref. [15], using the National Research Laboratory code SAMI3, reported the occurrence of plasma bubble merging, which was associated with ionospheric electrostatic reconnection in the ionosphere. The process of bubble merging was found to be closely associated with the presence of multiple plasma bubbles. When there were multiple bubbles in the ionosphere, the authors found that the electrostatic potential of one bubble could reconnect with that of other neighboring bubbles, causing a bigger bubble—the resultant bubble. The simulation study showed that the process favored growth of the low-density plasma as it merged with a fully developed plasma bubble. Ref. [16] reported plasma bubble merging and bifurcation around the pre-midnight period. They concluded that plasma bubble merging occurred due to the tilt changes and the non-linear evolution at the top portions of EPBs (equatorial plasma bubbles). Refs. [12,17] also reported disconnection and reconnection of plasma bubbles. The reconnection features of the plasma bubbles observed are similar to the plasma bubbles’ ionospheric electrostatic reconnection reported by [15]. However, in these works, only the plasma bubble detachment, bifurcation and merging were reported, and no research work has reported these features for ionospheric plasma blobs. Nevertheless, high-latitude blobs [18], solar plasma blobs [19], magnetospheric reconnection plasma blobs [20] and laboratory plasma blobs [21] have been reported.
Hence, this is the first observation of ionospheric plasma blobs merging and bifurcation in the tropical region. The importance of this study is that, according to [22], such plasma irregularities can cause scintillation, which disrupts communication when a radio signal passes through these structures. In this work, we report some interesting features of plasma blobs over the tropical region, such as plasma blob merging and plasma blob bifurcation. In addition, we propose the possible mechanisms for merging and bifurcation of ionospheric plasma blobs.

2. Instruments

Monochromatic all-sky imaging systems have been developed for auroral and thermospheric (630.0 nm) airglow studies that provide information over a very large field of view. With improvements in CCD detectors, these systems can view plasma depletions and plasma density enhancements in the ionospheric/thermospheric airglow emissions over a large geographic area with high resolution. Observations of the OI 630 nm nightglow emission using wide-angle imaging (130° field of view) have been carried out at ZF-2 (2.58° S, 60.22° W) in the Amazon region of Brazil since 2015. An essential piece of information on the imager is the relationship between the zenith angle and image size. A zenith angle of approximately 65° encompasses ± 8.6° latitude/longitude from the zenith, equivalent to a horizontal diameter of approximately ~950 km through the zenith at 250 km altitude. Figure 1 shows the field of view of this system, together with other relevant information. The all-sky imager used to observe the plasma irregularities in the tropical F-region consists of a Mamiya RB67 37 mm/F4.5 medium format achromatic fisheye lens, which images telecentrically onto a six-position 4-inch filter wheel, containing narrow-band interference filters, typically about 18–20 Å (1.8–2.0 nm) wide. The two filters of interest to this work are the OI 630 nm (centered at 630.09 nm, with an FWHM of 1.42 nm and peak transmission of 68%) and control filter/background (centered at 598.52 nm with an FWHM of 1.57 nm and peak transmission of 86%). The CCD imager consists of a large area (7.62 cm2), high resolution, 2048 × 2048 back-illuminated array and quantum efficiency of 96% in the 630 nm wavelength. The images were binned on-chip down to 1024 × 1024 resolution (hardware binning) to enhance the signal-to-noise ratio and are recorded at intervals of 105 s with a 90 s exposure time rate. Briefly, binning is adding the data from adjacent pixels to form a single pixel (sometimes called a superpixel). It can be accomplished in either hardware or software. Hardware binning is performed on the CCD array before the signal is read out of the output amplifier.
The all-sky images usually have problems associated with the use of all-sky optics for airglow studies. The image appears curved and compressed at low elevation angles. This occurs because the lens projects an image onto the CCD camera such that each pixel subtends an equal angle of the sky. To correct these problems, we first transform the images using the unwarping method described by [23]. This technique was used to estimate blobs’ zonal (E-W) extension during the merging process.

3. Observations and Methodology

At tropical latitudes, the dissociative recombination of  O 2 +  in the F-region is the dominant process for producing the excited oxygen atoms that give rise to the OI 630.0 nm nightglow. The primary chemical reactions that generate the OI 630.0 nm airglow emission in the F-region are as follows:
O + + O 2 O + O 2 +
O 2 + + e O ( S 1 ,   D 1 ) + O
O ( D 1 ) O + h v   ( 630   nm )
According to [24], the production of O(1D) by dissociative recombination of NO+ has been considered unimportant. The molecular oxygen density [O2] and the oxygen ion density [O+] are, therefore, primarily responsible for the production of OI 630 nm emission [5]. According to the quasi-neutrality property of plasma in the F-region, the oxygen ion density [O+] is approximately equal to the electron density in the F-region because the concentration of negative ions is considered highly negligible [25,26]. The F-region peak electron density height occurs around 350–400 km, while the molecular oxygen density [O2] increases with decreasing height [24]. Thus, the OI 630.0 nm emission peak occurs in the bottom side of the F-region around 220–300 km, as depicted in Figure 2 with a thick red line. The vertical fluctuation of the base height of the F-region, together with the variation in the OI 630 nm emission intensity, is often used to monitor the F-region vertical motions as well as temporal and plasma density variations. Hence, the OI 630.0 nm emission can be used to study the plasma structures and dynamics in the ionosphere.
In 1982, Ref. [3] carried out early all-sky imaging observations of ionosphere bubbles using an image intensifier and photographic recording. In 1997, Ref. [27] used a digital imaging CCD camera to determine bubble velocities during the Guará campaign at Alcantara (2.3° S, 44.5° W). We examined the March and October images of OI 630.0 nm, referring to the years 2019 and 2020, as these months have the highest occurrence rate of plasma irregularities in the tropical region [14]. Plasma bubbles have been identified as the regions of plasma-depleted flux tubes at the height range of emission [13], while plasma blobs have been associated with the enhanced ionization region significantly above the ambient plasma density (by a factor of two, or more). Plasma bubbles appear in the all-sky images as a dark band region due to a decrease in the OI 630 nm emission intensity, which signifies a region of a depleted electron.
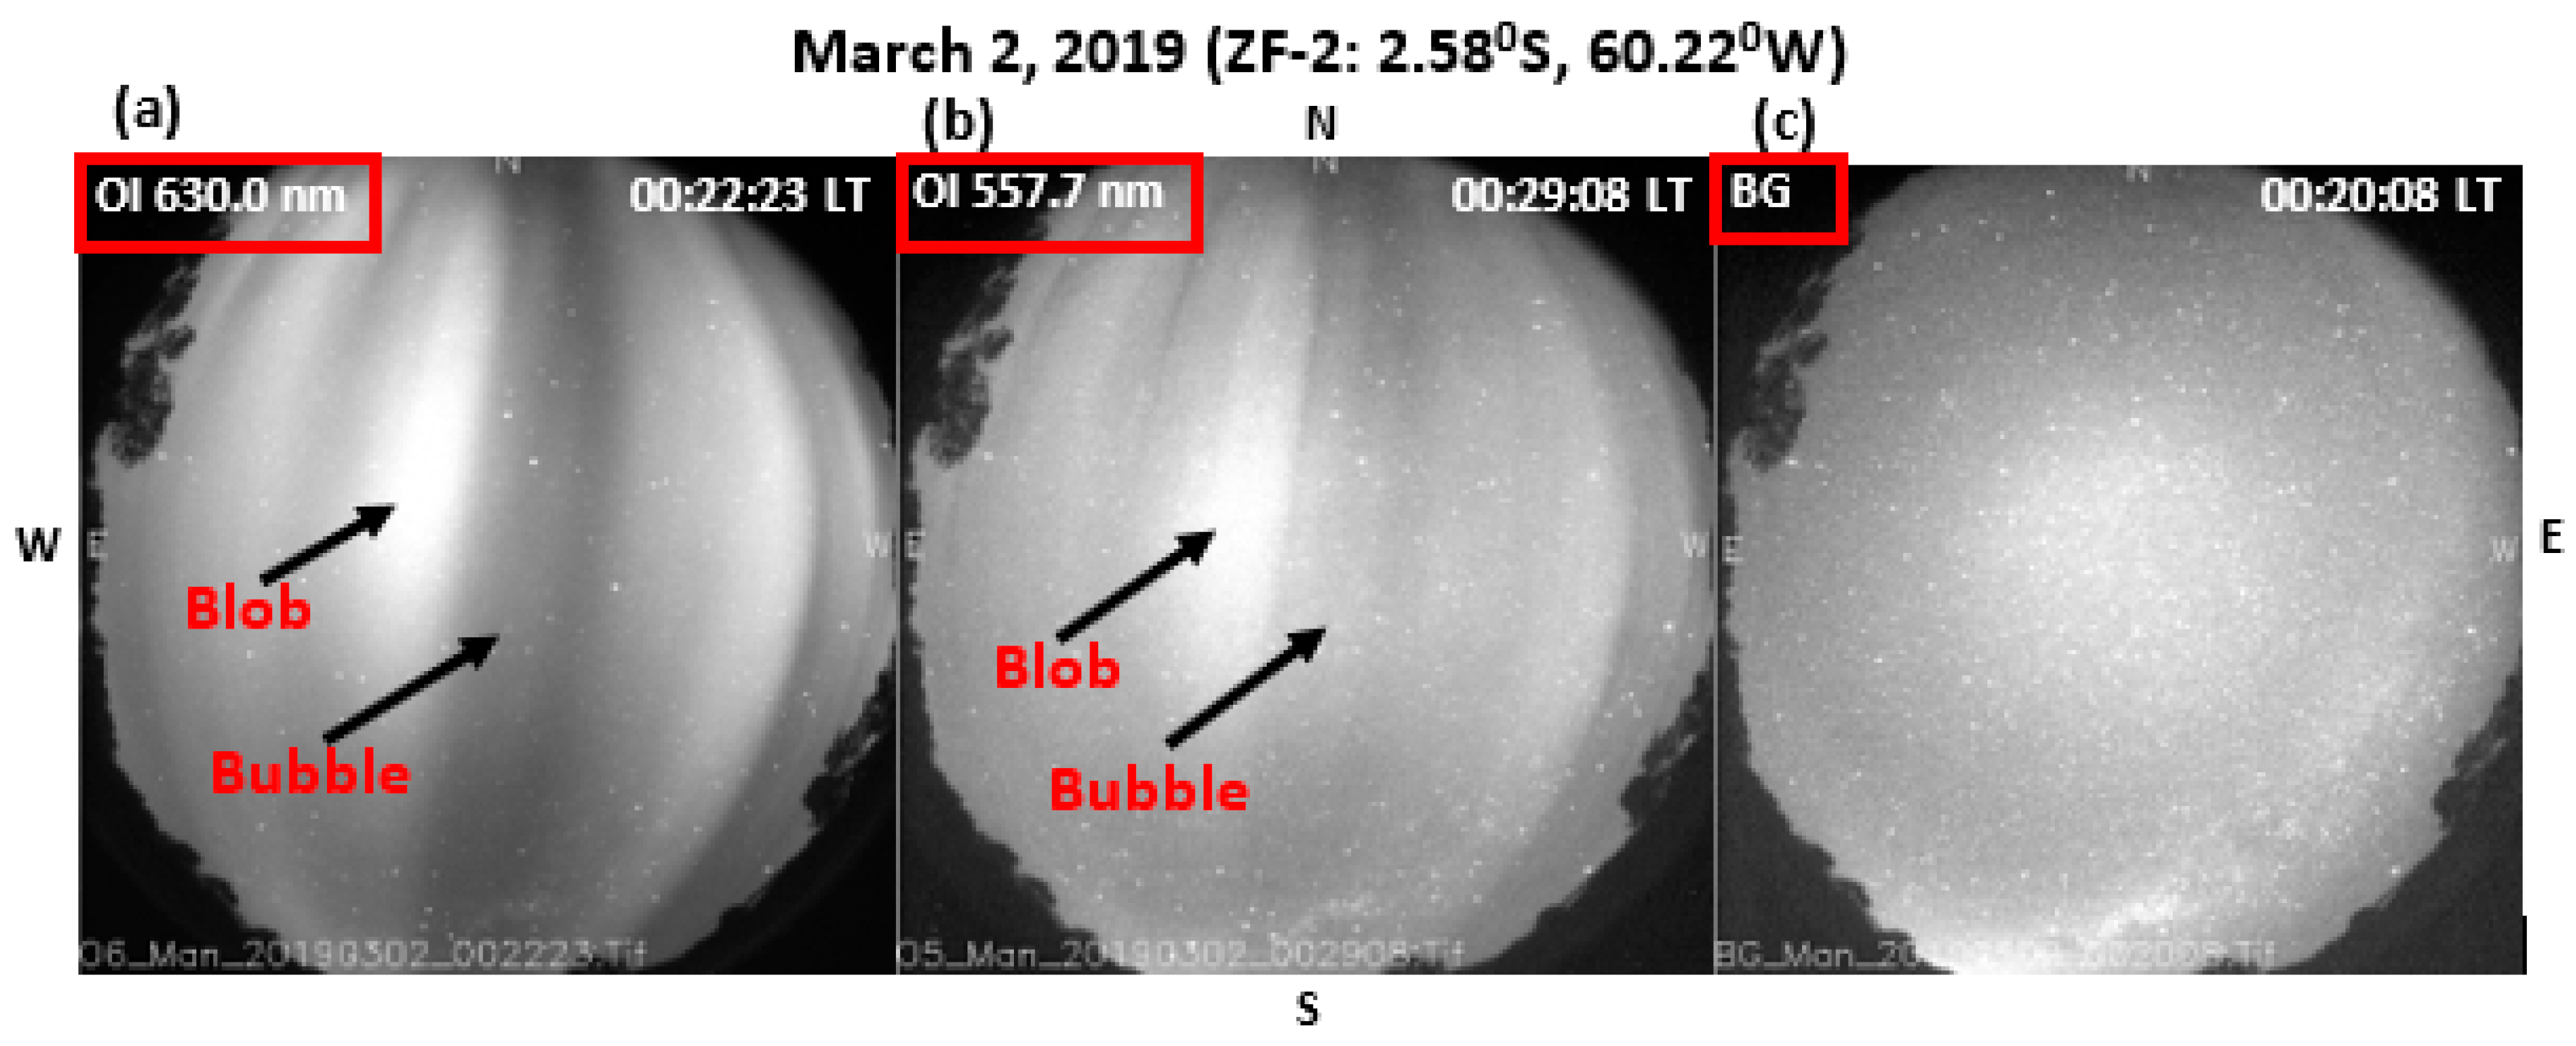
In contrast, plasma blobs appear as a quasi-oval-bright region in the OI 630.0 nm emission. However, not all dark and bright regions observed in the images were considered plasma bubbles and blobs. In Figure 3, panels (a) and (b), we have two examples that show two raw all-sky images obtained through the 630 nm filter at 00:22:23 local time (LT) and 557.7 nm filter at 00:29:28 LT on 2 March 2019, at ZF-2 Observatory (2.58° S, 60.22° W). In these panels, it is possible to see raw all-sky images showing both plasma bubbles and plasma blob, indicated by black arrows. The bubble and blob were spectral, only visible at the 630 nm and 557.7 nm emissions and not in the control/background 598 nm wavelengths, as shown in panel (c). In addition, only days of clear sky (cloud-free days) were analyzed. We observed plasma blobs merging on several occasions as they drifted eastward, but we only present the interesting cases here. All the merging features of blobs were observed in 2019 and none in 2020.
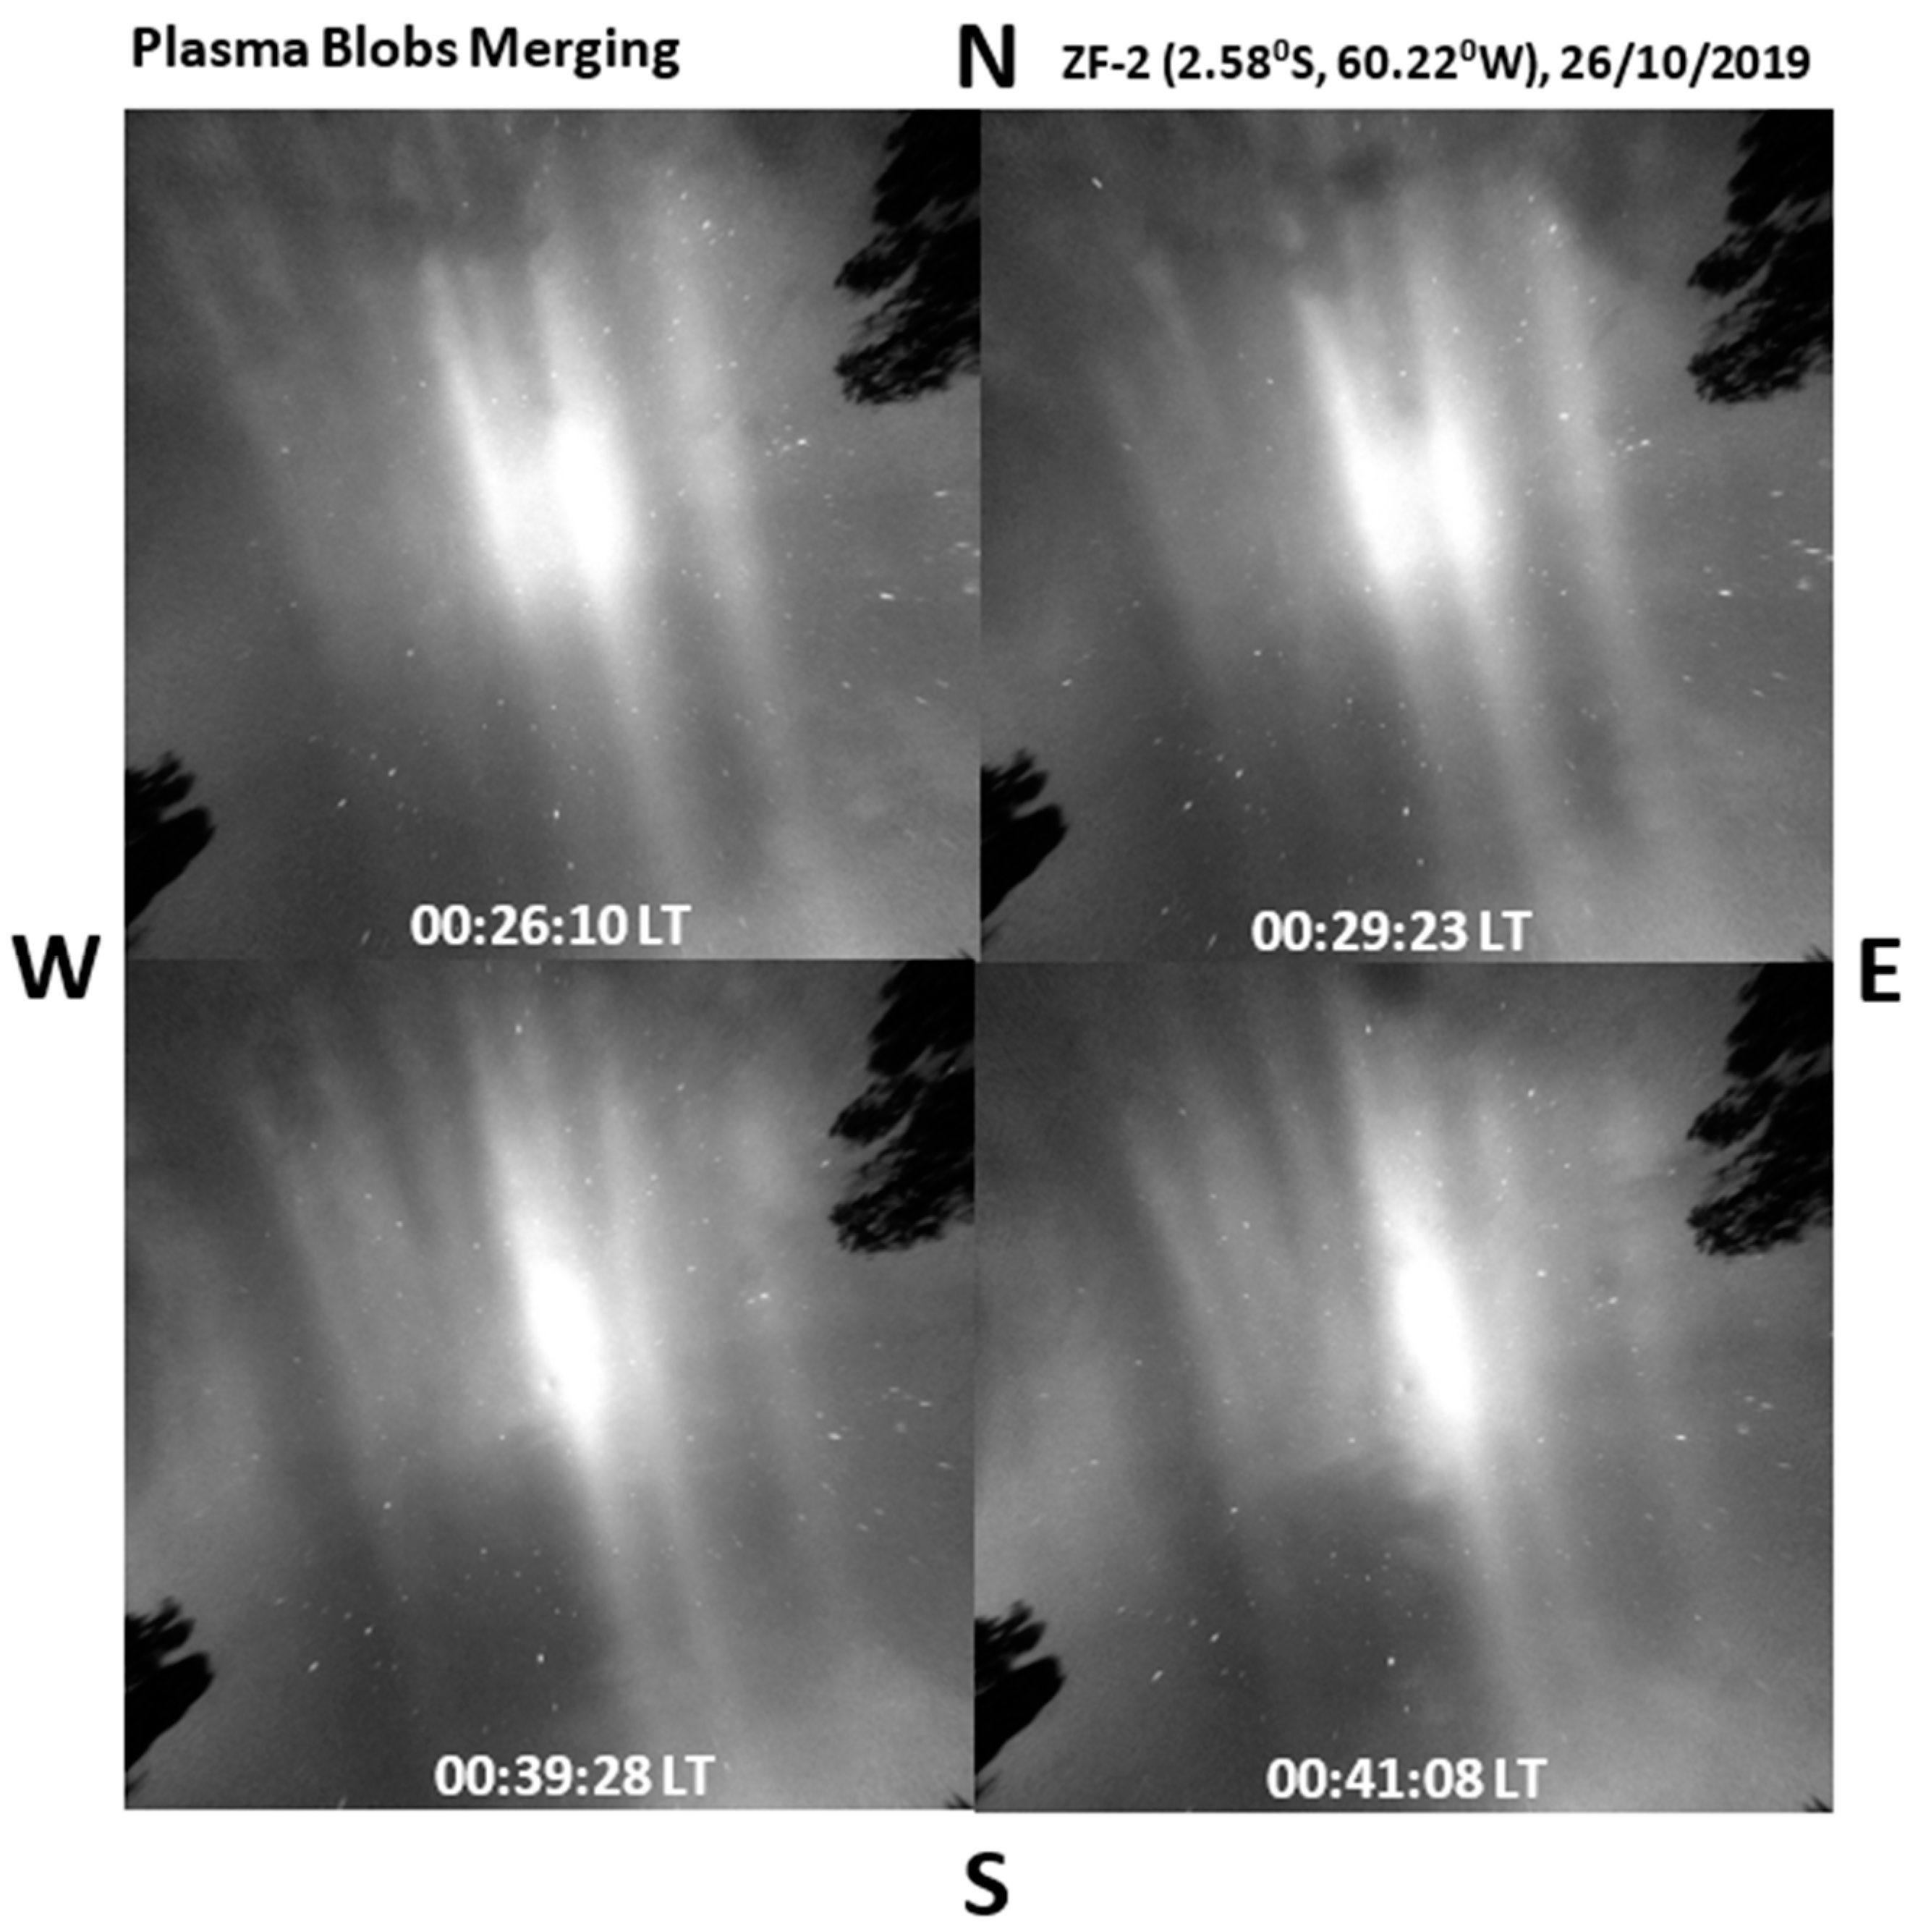
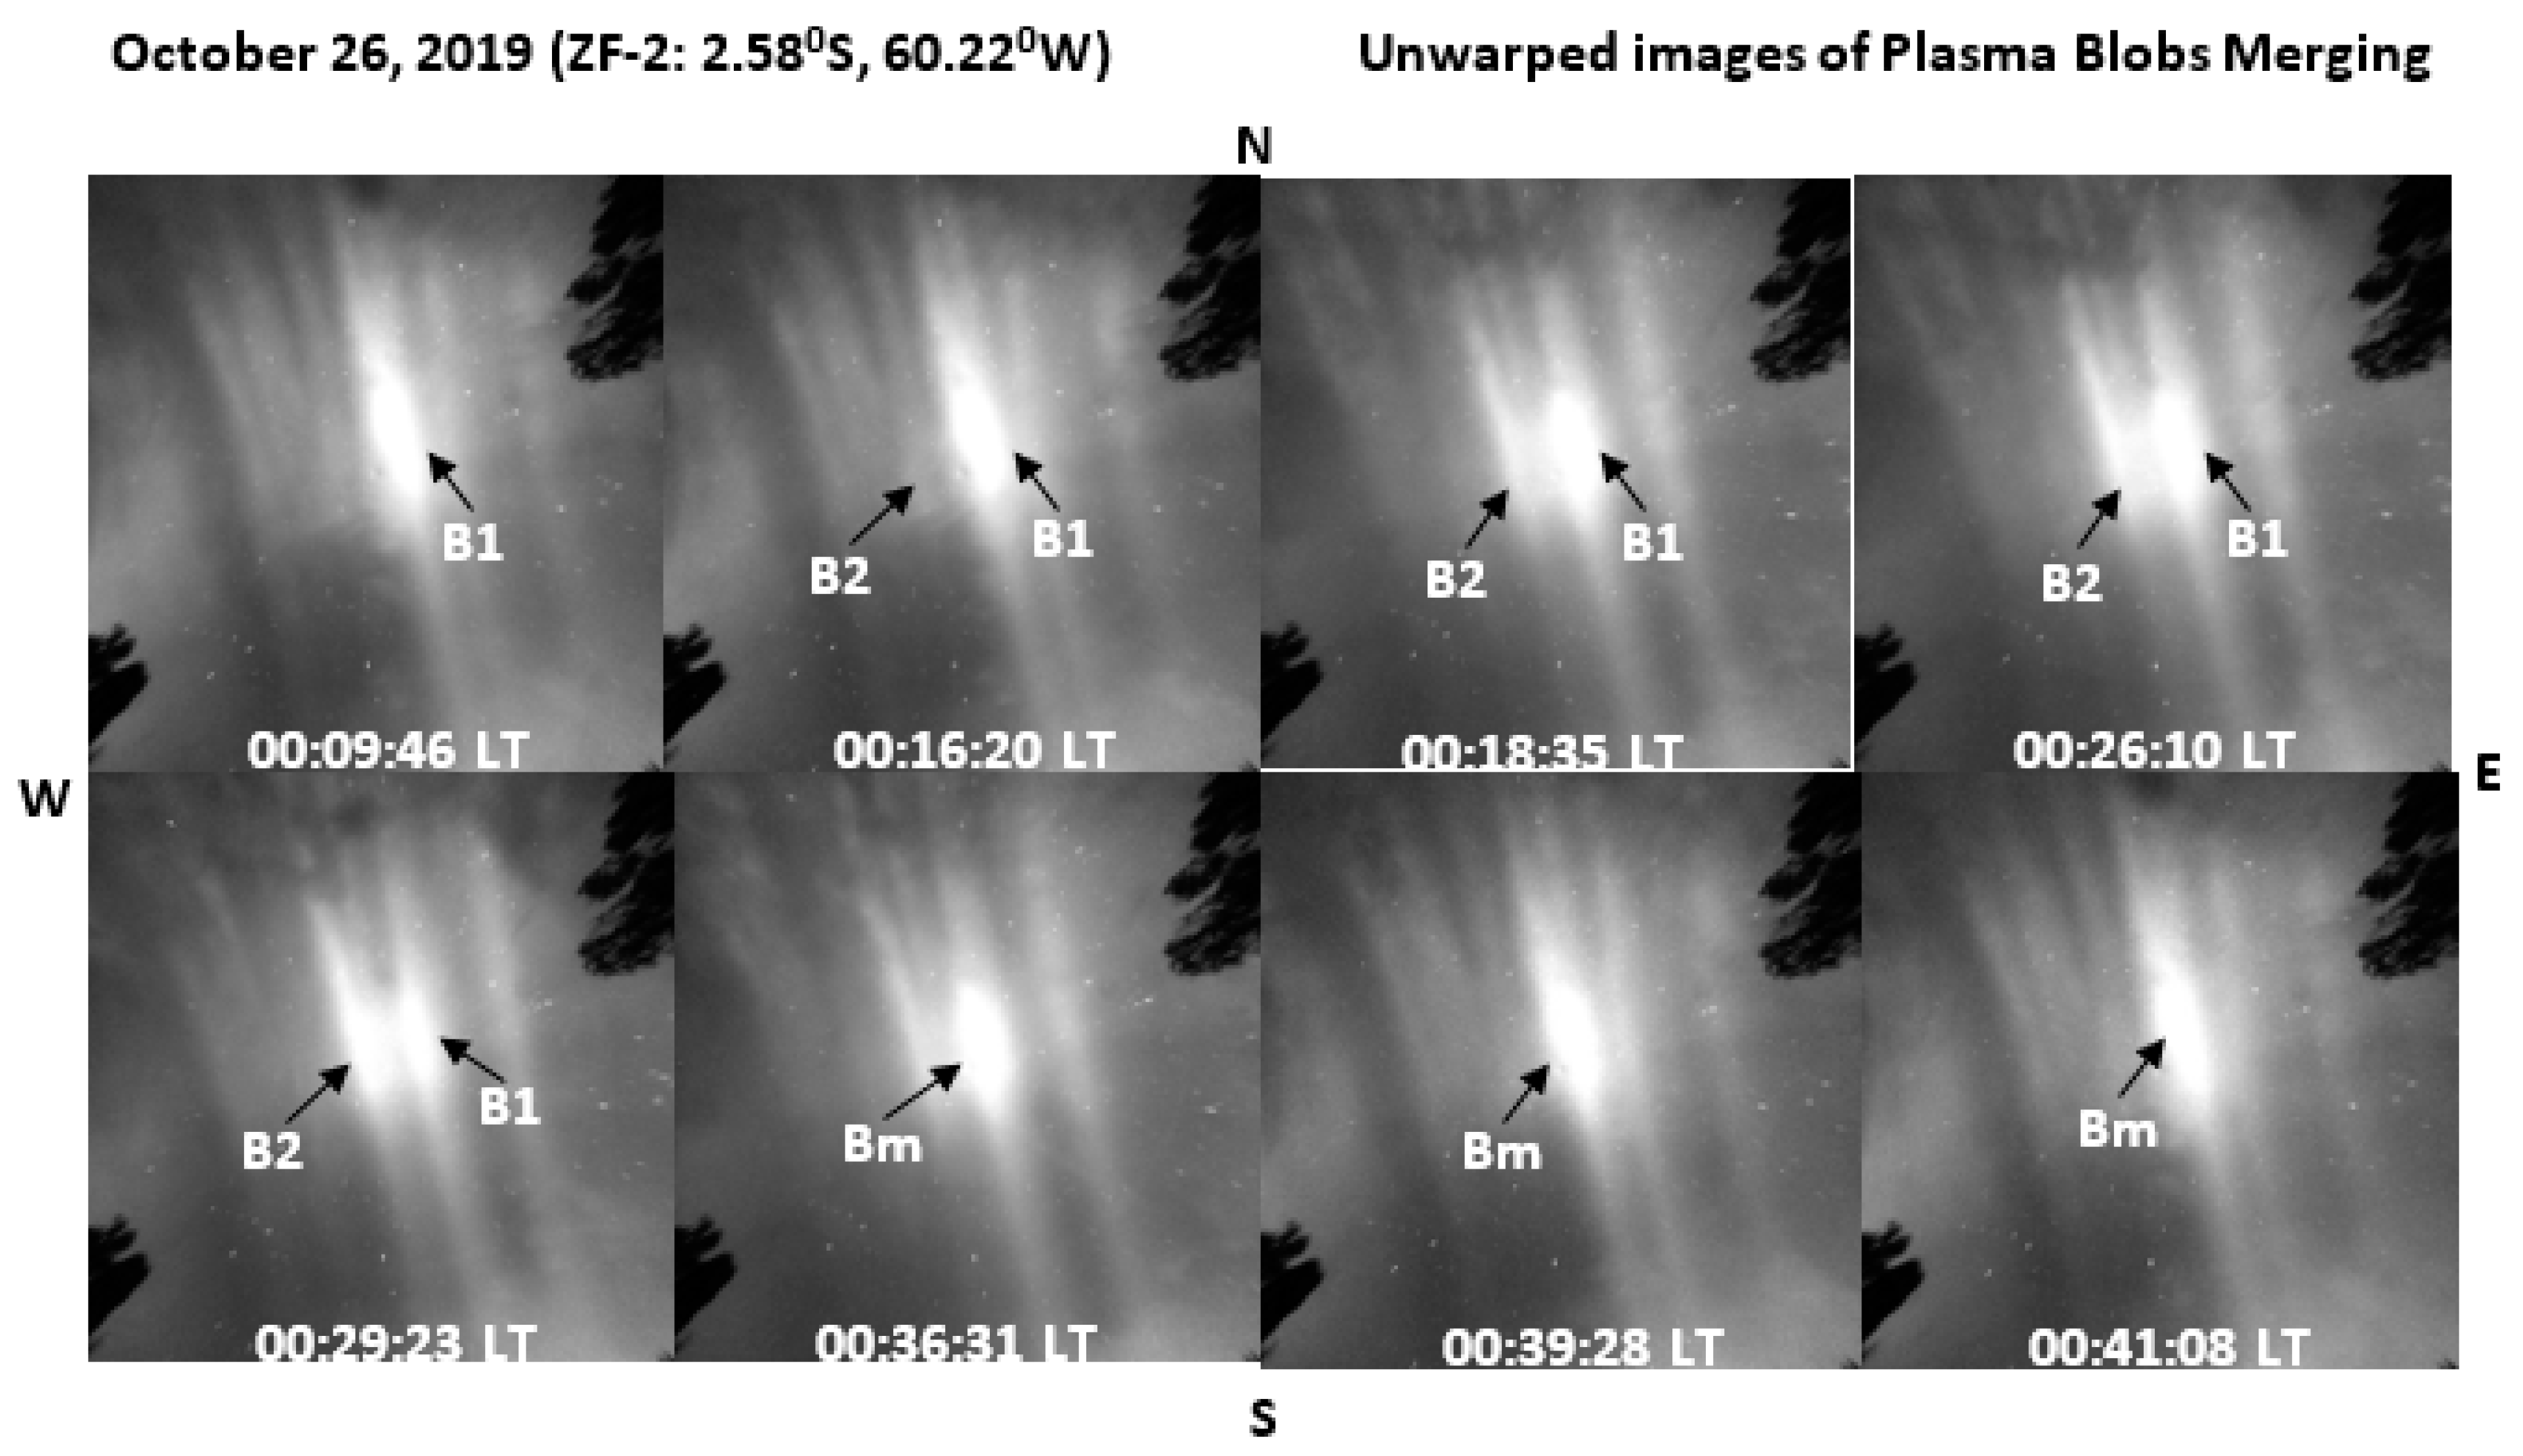
After the merging, the E-W scale size of the resultant blob increased significantly, as well as the emission intensity (see Figure 4). Plasma blob bifurcation was observed on three different occasions—two in 2019 and one in 2020. To determine whether the geomagnetic conditions were calm or disturbed during the period of the events, we mainly checked the Dst index. The Dst data enable us to study the geomagnetic condition in the tropical region to investigate whether the events are related to geomagnetic activity. We adopted the criteria described in [28], in which great (or intense) storms are those with peak Dst of −100 nT or less, moderate storms fall between −50 nT and −100 nT, and weak storms are those between −30 nT and −50 nT. Table 1 shows the dates of the events studied in this work together with the Dst index measured during the day of the observation. From Table 1, the Dst values greater than −30 nT imply a quiet geomagnetic condition. In other words, the features of plasma blobs observed in this research occurred naturally without the influence of an external force such as the activities of the prompt penetrating electric field. However, Ref. [29] reported an event of a plasma blob during the geomagnetic storm of 6–7 April 2000.

4. Results and Discussion

4.1. Plasma Blobs Merging

In Figure 5, on 26 October 2019, F-region ionospheric plasma blob merging was observed as the plasma blobs drifted towards the eastern edge of the view. This movement across magnetic field lines is due to the polarized electric field [30]. Initially, at 00:09:46 LT, only one blob (B1) appeared, and later, another one (faintly) appeared (B2) at 00:16:20 LT. Both blobs were drifting separately. B2 airglow intensity increased with time (see 00:16:20 to 00:26:10 LT), and at 00:29:23 LT, the two blobs appeared with almost the same scale size with an apparent merging attempt: no distinct space between the two blobs. At 00:36:31 LT, the two blobs merged to form a merged blob (Bm) with scale-size significantly larger than each of the blobs prior to merging.
From Figure 6, the scale size of the blobs is studied using the linearization technique [23] during the merging process, and it was found that from 00:09:46 LT to 00:41:08 LT, B1 E-W extension decreased from 97 km to 64 km as it drifted before it finally merged with B2. On the other hand, the B2 E-W extension increased from 44 km to 84 km as it drifted before merging with B2 but slightly decreased afterwards. Using the superposition principle, B1 rapidly decreased in its E-W extension with an average scale length of 8 km. At the same time, B2, before merging, increased its E-W extension gradually with an average scale length of 3 km. After the successful merging, the Bm E-W extension increased by almost twice the onset E-W scale size of B1, confirming the addition of another blob.
According to [1], thermospheric winds vary broadly. However, on a good approximation, in the post-sunset period, the winds are very strong and eastward, approximately 150 m/s, then decrease to about 50 m/s after midnight. Ref. [3] reported a similar drastic decrease in plasma bubbles’ zonal drift from approximately 190 m/s at 2100 LT to about 80 m/s at 0100 LT. Thus, they reported a decrease in the thermospheric wind during the post-midnight hours. Since the winds largely influence the zonal plasma drift, the drift follows the direction of the wind, thus causing the zonal drift also to decrease. It must be noted that, generally, the cases of plasma blob merging in this study occurred at the post-midnight hours.
According to Rayleigh Taylor’s Instability (RTI) theory, the development of plasma irregularity generates eastward and westward drift. From the numerical simulation, Ref. [2] found that the westward drift favors the formation of blobs, and the eastward drift favors the formation of bubbles. Therefore, probably the downward (westward) E × B drift gets reinforced due to the decrease in zonal wind velocity in the post-midnight hours, thereby retarding the plasma drift. This retardation could cause the slower-drifting plasma blobs to merge with the faster ones. We have called this mechanism the “Wind Reversal Effect (WRE)”. The lack of thermospheric wind data at the location of the imager prevents further investigation of the winds’ behaviour on the observation date. Thus, further investigation of these features of blobs with the thermospheric wind patterns is essential.
Moreover, we proposed that accumulated plasma along magnetic field lines would merge with succeeding blobs when its scale size (E-W extension) is substantially large, and a decrease in zonal thermospheric wind velocity and ion diffusion along field lines in the F-region may cause this process. This mechanism is based on the fact that the E-W extension of B1 was substantially large prior to the merging, suggesting that the charged particles accumulate along the field lines. Performing a statistical study on a larger sample of cases may reveal the scale-size threshold liable for merging. Nevertheless, the three merging cases observed in this study give an average zonal scale size of 105 ± 7 km. Ref. [31] reported that plasma blobs form at the balance of upward diffusive and downward gravitational forces. In other words, when the E × B drift lifts plasma to a very high altitude, they diffuse downward along the field lines against the upward diffusive force, and where the two forces are equal; this enhances the plasma (blobs).
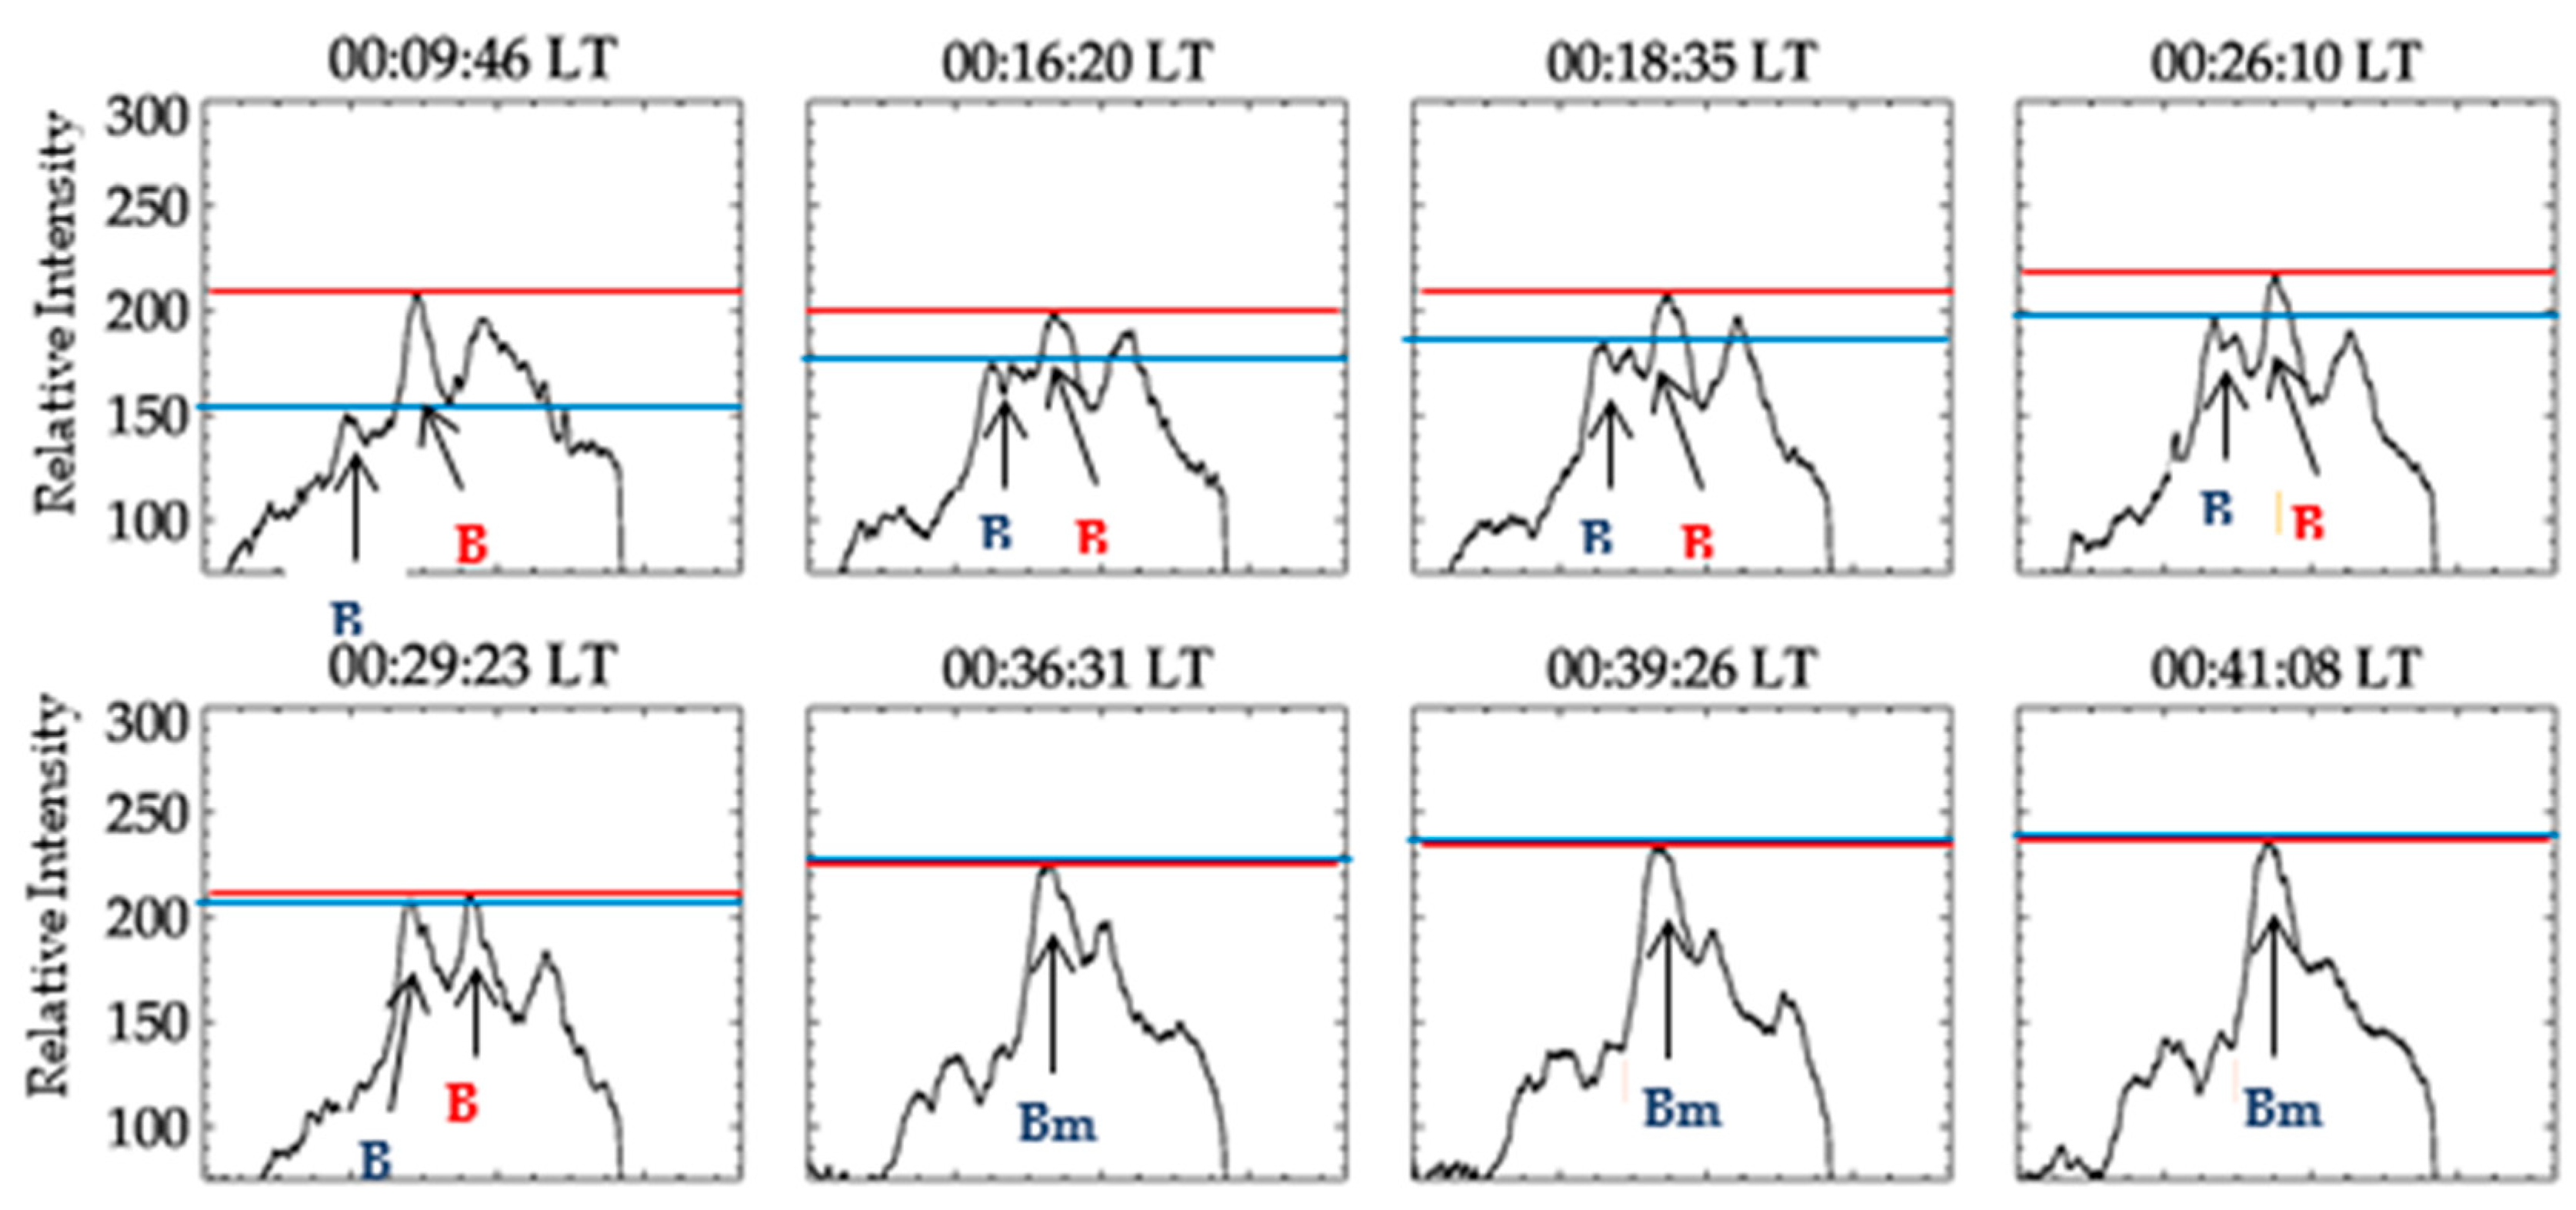
Figure 7 shows the relative intensity of the plasma blob merging on 26 October 2019. This corresponds to Figure 5, from image 00:09:46 LT through 00:41:06 LT. At 00:09:46 LT, the maximum relative intensity of B1 is about 210 (red line), while B2 is about 150 (blue line). As the two blobs drifted eastward, the intensity of B2 increased while that of B1 decreased (see 00:16:20 LT). While the intensity of B1 fluctuated around 200, that of B2 increased gradually (see 00:16:20 through 00:26:10 LT). This can be associated with the increase in electron density inside the blobs, which is proportional to the concentration of the excited atomic oxygen and produces a brighter glow (see Equations (1)–(3); [5,30]). At around 00:29:23 LT (Figure 7), the intensity of the two blobs was almost the same, about 200, and at 00:36:31 LT, the two blobs merged to produce a merged blob (Bm). All these dynamics occurred within about 30 min: the fully developed B1 vanished, and the developing blob B2 became fully developed. The physical understanding of these occurrences is that, firstly these features are unique, and radio signals passing through such features can suffer degradation (resulting in scintillation) due to the non-uniform nature of the plasma [22,32].

4.2. Plasma Blobs Bifurcation

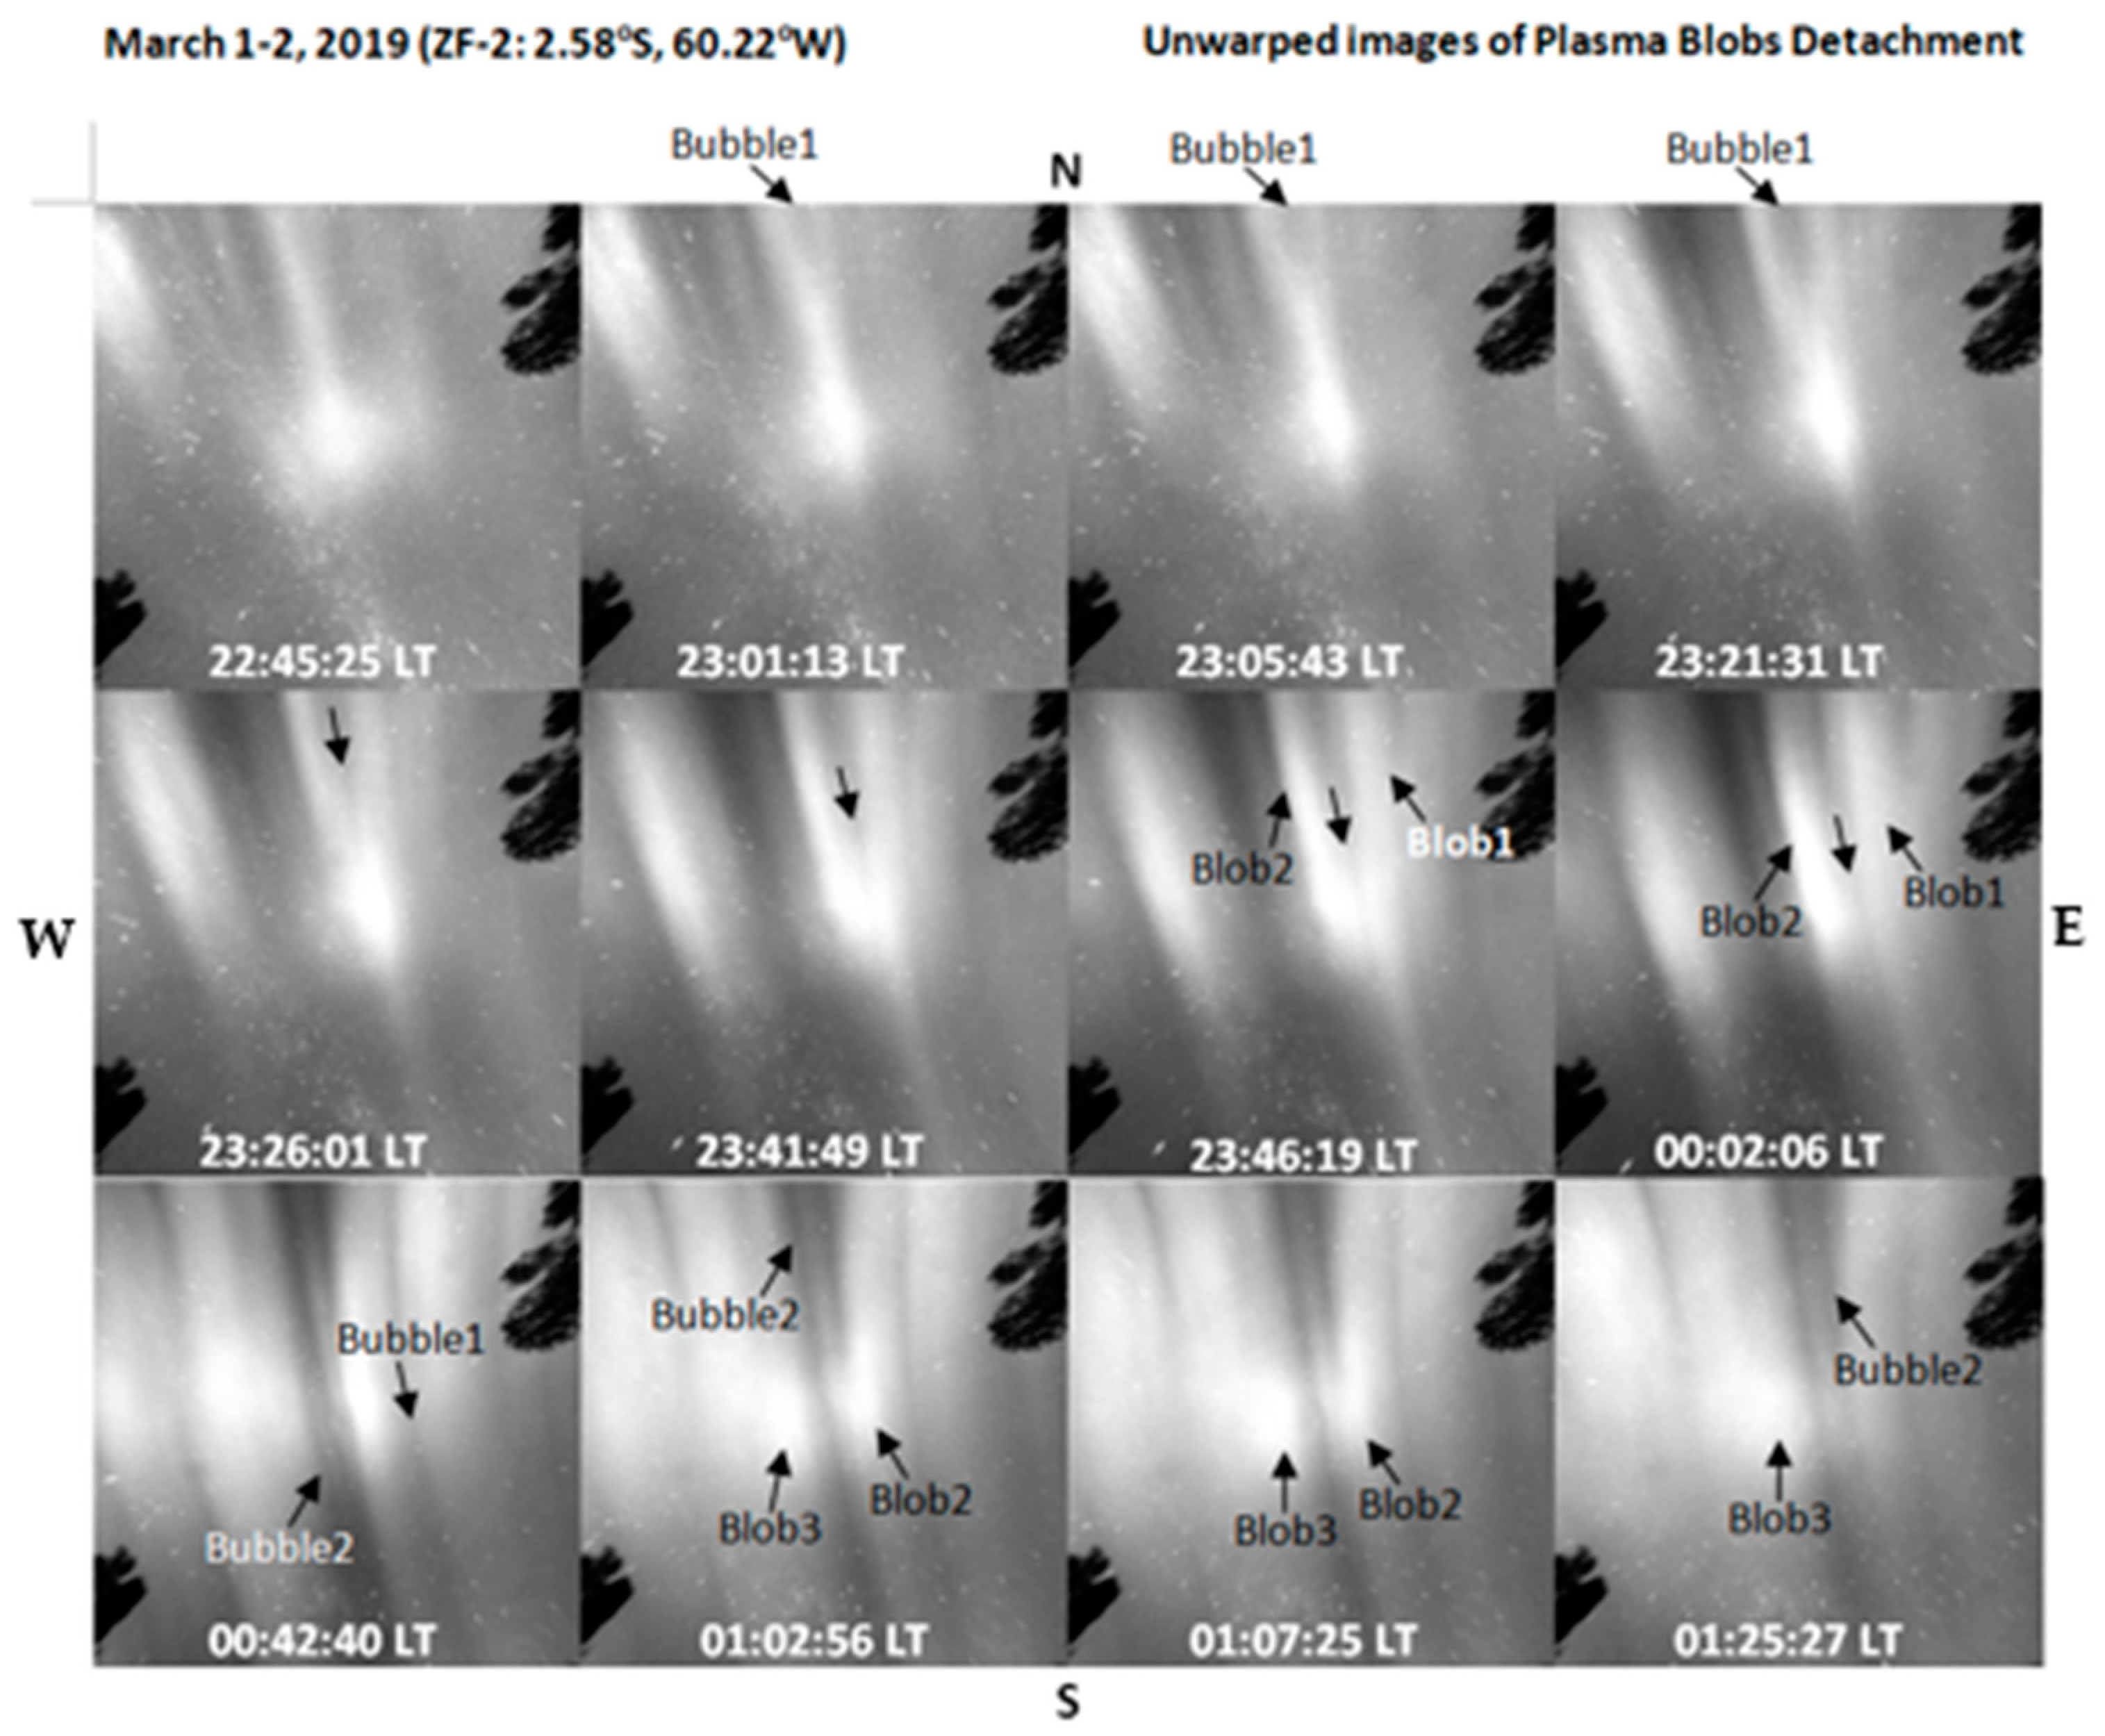
Figure 8: On 1–2 March 2019, at ZF-2 around midnight through post-midnight hours, a plasma blob was observed to be bifurcating and eventually detached into two separate blobs. Simultaneous with the bifurcation of the blob is the appearance of a bubble at the northern edge of the view, which corresponds to bubble mapping along the same line as the blob. At 23:01:13 LT, the plasma blob, located almost at the zenith of the all-sky imager, was drifting eastward. The blob elongates northward. As the blob (Blob1) drifted eastward, it began to bifurcate at the topside (northern edge of the FOV), and its base E-W extension increased. At 00:02:06 LT, the blob split in two—Blob1 and Blob2 (eastward and westward). At this time, ‘Bubble1’ had already extended to about 2/3 of the N-S of the field of view (see 00:02:06 LT), and the two blobs (Blob1 and Blob2) could be seen separately, with “Blob1” fading away (drifting away from the FOV). In summary, it has been observed that the detachment of plasma blobs occurred due to (1) the substantial scale size of the blob as it extends northward and (2) the development of post-midnight EPB mapping along the field line.
Figure 9 shows the bifurcation of plasma blobs by the plasma bubble emerging from the northern edge of the FOV. It has been established that plasma bubbles developing near the geomagnetic equator can map along the magnetic field line and be observed in the low latitude regions [26,33]. So, maybe the bubble mapping along the field line encounters the blob along the same field line and splits the blob in two. Several authors have found bubbles and blobs along the same field line [8,34,35].
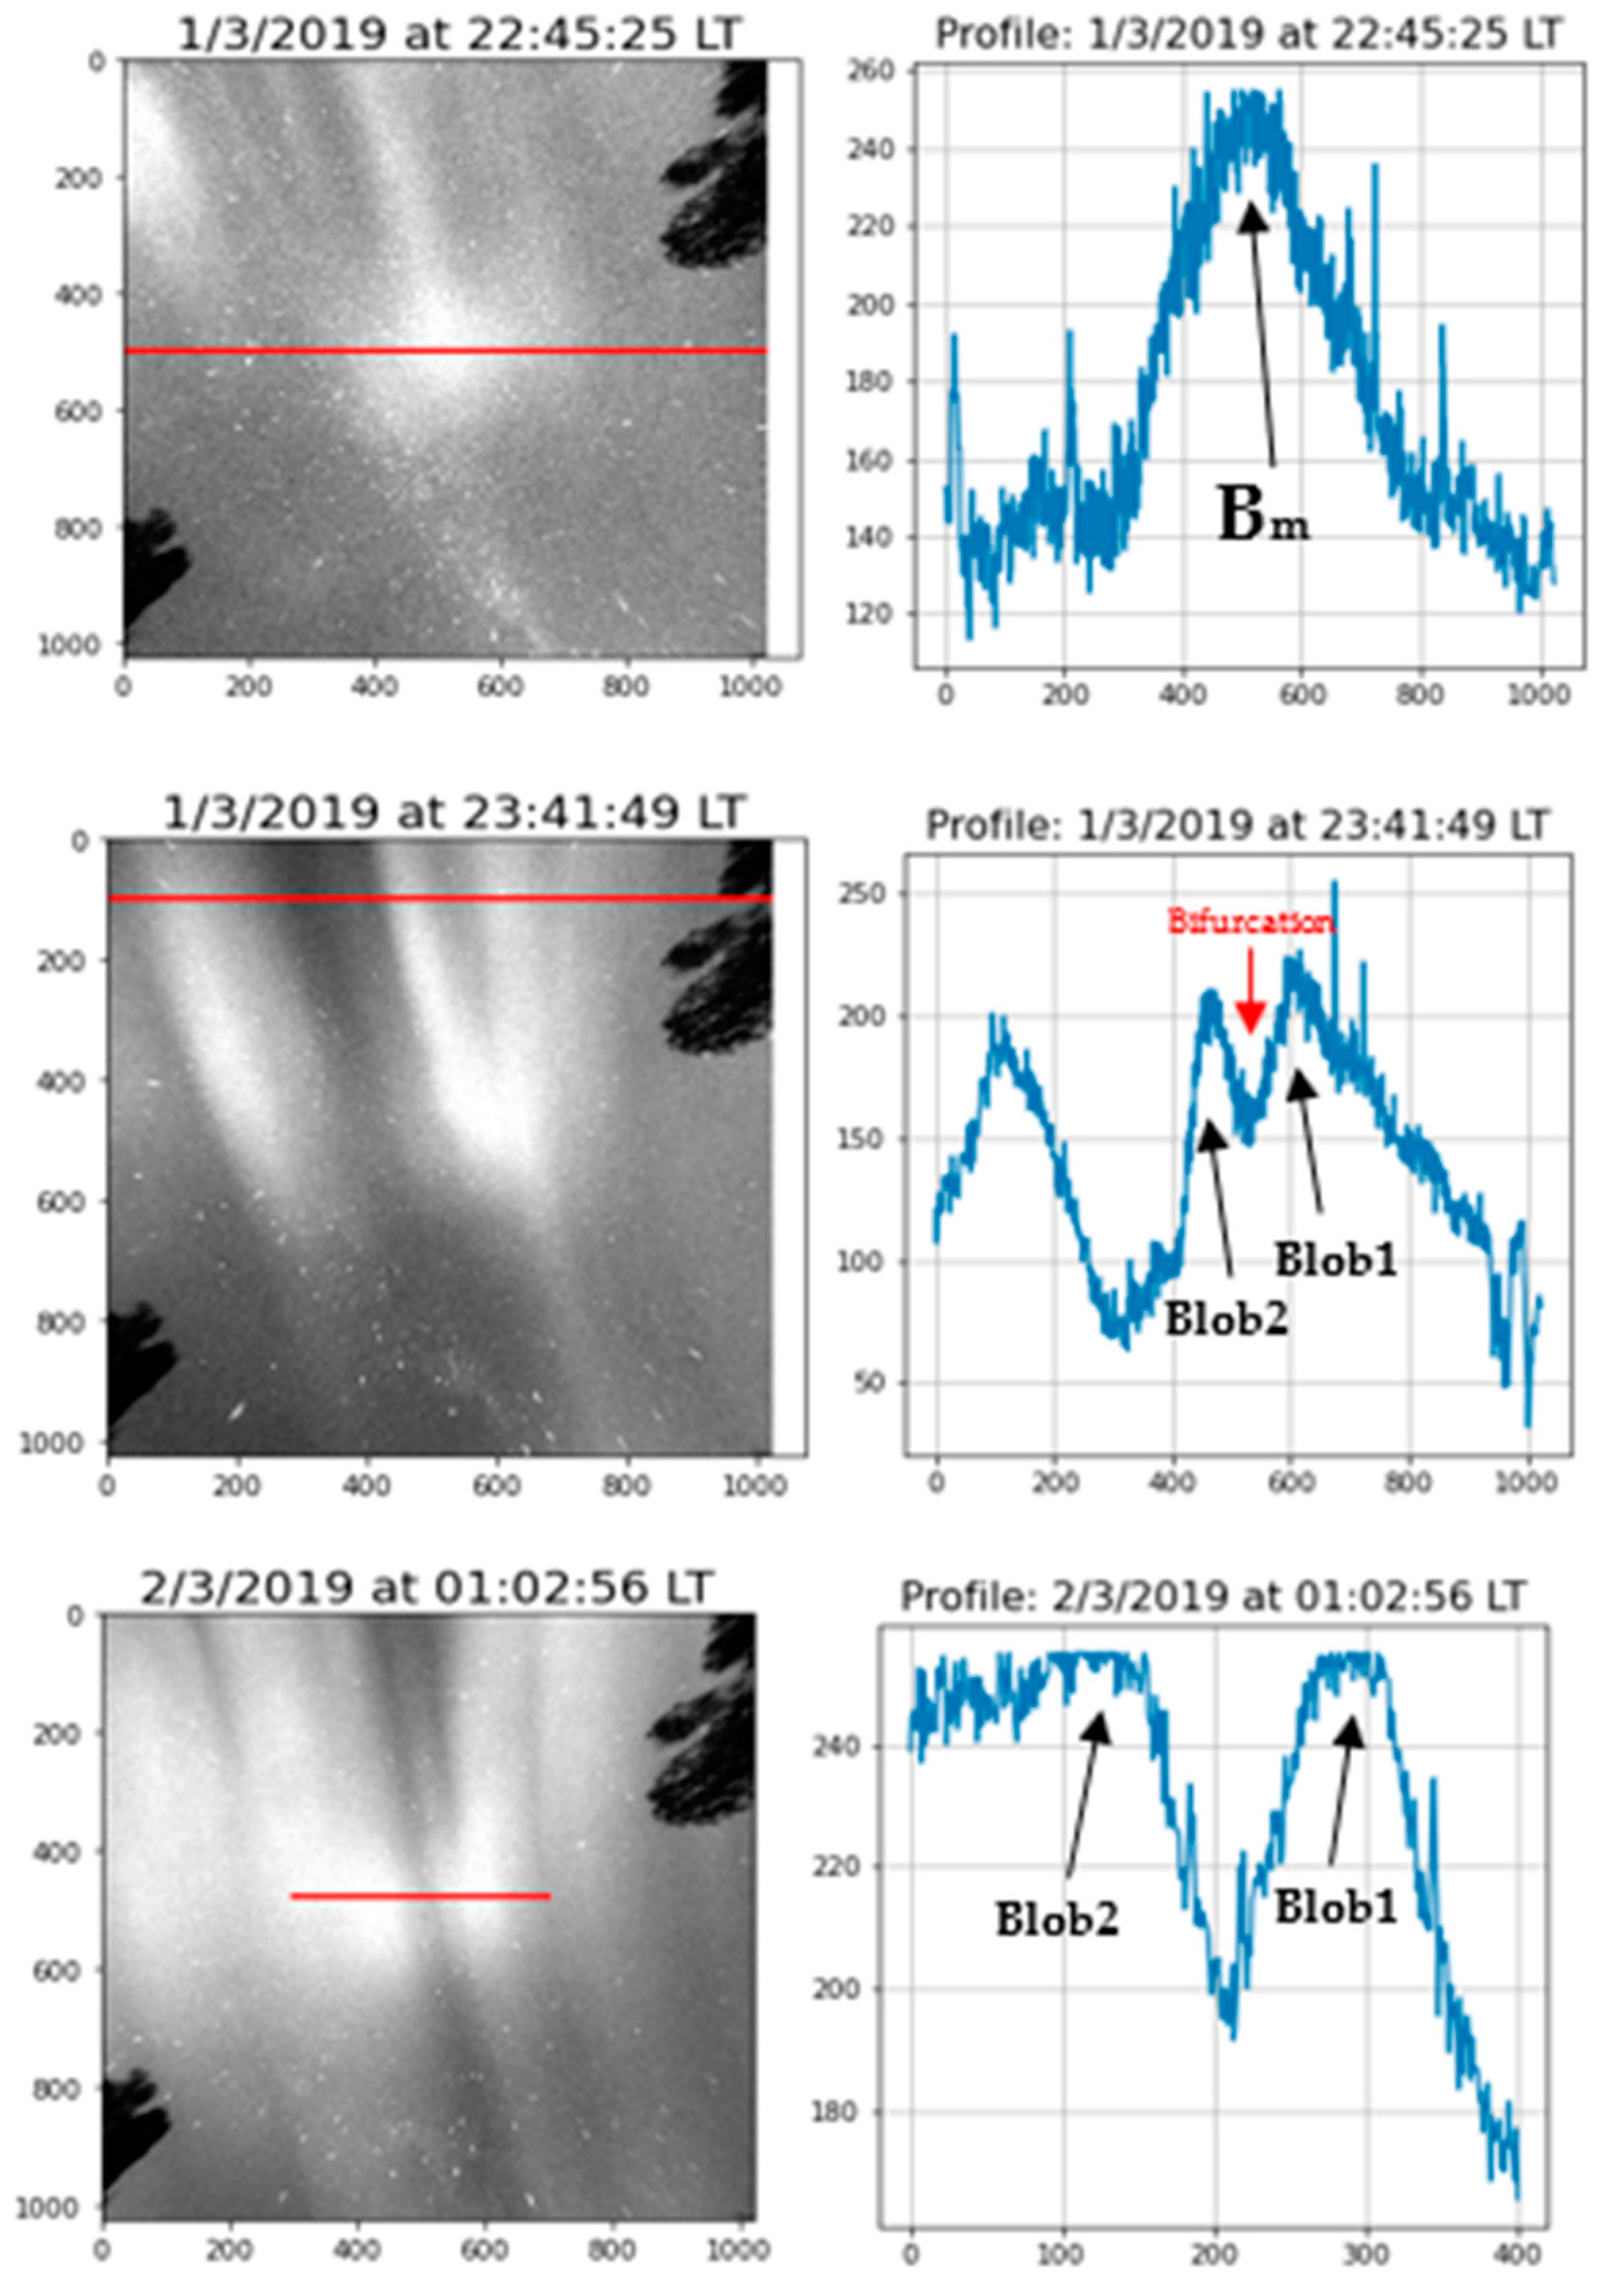
Furthermore, Figure 10 shows the relative intensity profile of a plasma blob in the first panel, and it appears to have a gaussian-like structure. The emission intensity inside the blob also increased by 53% above the ambient intensity. In the second panel, the bifurcation feature of the blob can be seen. In the third panel, two apparent blobs can be seen from the relative intensity profile after the successful disconnection of another blob from the primary blob. In future work, numerical simulations of these features may reveal more information about the relationship between plasma blobs and bubbles.

5. Conclusions

We analyzed the OI 630.0 nm emission images during March and October 2019 and 2020 (minimum solar activity). In this paper, based on the observations of OI 630.0 nm night-time emission using an all-sky imager in the tropical region of Brazil, we report for the first time interesting dynamical features of ionospheric plasma blobs: merging and bifurcation. Merging is the process of two separate blobs coming together to form a larger resultant blob. In comparison, bifurcation is the process of a substantially large blob splitting at the top and then eventually splitting into two separate blobs. The results show the apparent merging of two blobs as they drifted eastward. Before merging, B1 decreased in zonal scale size from 97 km to 64 km (with an 8 km average scale length), while B2 increased from 44 km to 84 km (with a 3 km average scale length). In other words, as one blob increased, the other decreased in zonal scale size. After the successful merging, Bm zonal scale size increased by almost twice the onset zonal scale size of B1, confirming the addition of another blob. Investigating the topside of the blob shows the apparent emergence of dark-band structure, causing the blob to bifurcate and eventually split into two separate blobs.
Two main mechanisms are possibly related to ionospheric plasma blobs merging:
  • Wind Reversion Effect (WRE) mechanism: in this mechanism, the change in the direction of the zonal thermospheric wind from eastward to westward at the equatorial region may cause the steepening of plasma; in some cases, the slower drifting plasma blobs may merge with faster ones.
  • Secondly, based on the results revealed from the scale-size evolution of plasma blobs during merging, we proposed that the accumulated plasma blob along the magnetic field lines would merge with adjacent blob when its scale size (E-W extension) is substantially large, and the decrease in zonal thermospheric wind velocity and ion diffusion along field lines in the F- region could be responsible for this process. Nevertheless, the three merging cases observed in this study give an average zonal scale-size of 105 ± 7 km. As the cases are few statistically, we could not infer the scale-size of blobs liable for merging. Thus, further studies on larger sample size of the cases could reveal the scale-size of plasma blobs liable for merging.
We associated the bifurcation of plasma blobs with possibly the activities of the polarized electric field inside plasma bubbles that maps along the same field line as the blob.
As this is the first observation of these kinds of features of ionospheric plasma blobs, further investigations should be carried out to understand the morphology of plasma blobs more deeply. These studies are essential and possess great potential for revealing the detailed causal relationship between equatorial plasma bubbles and plasma blobs. In addition, this kind of study shows the plasma structures and geomagnetic field interactions in the ionosphere. However, the development of plasma blobs associated with equatorial plasma bubbles appeared to depend largely on the activities of the induced polarized electric field inside bubbles; studies focusing on the onset conditions of this field may reveal the generation of plasma blobs. Numerical simulations of plasma blobs would be an excellent approach to investigate merging and bifurcation further.

Author Contributions

Conceptualization, M.O.A.; Data curation, M.O.A.; Formal analysis, M.O.A.; A.A.P. and S.S.; Funding acquisition, A.A.P.; Investigation, M.O.A.; Methodology, M.O.A., S.S.; Validation, M.O.A.; Visualization, M.O.A. and P.K.N.; Writing—original draft, M.O.A.; Writing—review and editing, M.O.A. All authors have read and agreed to the published version of the manuscript.

Funding

This research was funded by São Paulo Research Foundation (FAPESP), Brazil grant number 2008/50553-8 and 2022/10144-9 and the APC was funded by the National Institute for Space Research—INPE, Brazil.

Institutional Review Board Statement

Not applicable.

Informed Consent Statement

Not applicable.

Data Availability Statement

The data used for this research can be found at: 10.5281/zenodo.7689700.

Acknowledgments

The authors gratefully acknowledge the São Paulo Research Foundation (FAPESP), Brazil, for the support received through Grant 2008/50553-8 and 2022/10144-9. We thank the Brazilian Ministry of Science, Technology and Innovation and the Brazilian Space Agency for the support received through Grant 20VB0009172430. We thank the CAPES and CNPq for the master’s scholarship provided for this research.

Conflicts of Interest

The authors declare no conflict of interest.

References

  1. Kelley, M.C. The Earth’s Ionosphere: Plasma Physics and Electrodynamics; Academic Press: San Diego, CA, USA, 2009. [Google Scholar]
  2. Ossakow, S.; Zalesak, S.; McDonald, B.; Chaturvedi, P. Nonlinear equatorial spread F: Dependence on altitude of the F peak and bottomside background electron density gradient scale length. J. Geophys. Res. Space Phys. 1979, 84, 17–29. [Google Scholar] [CrossRef]
  3. Mendillo, M.; Baumgardner, J. Airglow characteristics of equatorial plasma depletions. J. Geophys. Res. Space Phys. 1982, 87, 7641–7652. [Google Scholar] [CrossRef]
  4. Watanabe, S.; Oya, H. Occurrence characteristics of low latitude ionosphere irregularities observed by impedance probe on board the Hinotori satellite. J. Geomagn. Geoelectr. 1986, 38, 125–149. [Google Scholar] [CrossRef] [Green Version]
  5. Pimenta, A.; Sahai, Y.; Bittencourt, J.; Abdu, M.; Takahashi, H.; Taylor, M.J. Plasma blobs observed by ground-based optical and radio techniques in the Brazilian tropical sector. Geophys. Res. Lett. 2004, 31, L12810. [Google Scholar] [CrossRef] [Green Version]
  6. Park, J.; Lühr, H.; Stolle, C.; Rother, M.; Min, K.; Michaelis, I. Field-aligned current associated with low-latitude plasma blobs as observed by the CHAMP satellite. Ann. Geophys. 2010, 28, 697–703. [Google Scholar] [CrossRef] [Green Version]
  7. Huang, C.-S.; Le, G.; de La Beaujardiere, O.; Roddy, P.A.; Hunton, D.E.; Pfaff, R.F.; Hairston, M.R. Relationship between plasma bubbles and density enhancements: Observations and interpretation. J. Geophys. Res. Space Phys. 2014, 119, 1325–1336. [Google Scholar] [CrossRef]
  8. Luo, W.; Xiong, C.; Zhu, Z.; Mei, X. Onset condition of plasma density enhancements: A case study for the effects of meridional wind during 17–18 August 2003. J. Geophys. Res. Space Phys. 2018, 123, 6714–6726. [Google Scholar] [CrossRef]
  9. Park, J.; Min, K.W.; Eastes, R.W.; Chao, C.K.; Kim, H.-E.; Lee, J.; Sohn, J.; Ryu, K.; Seo, H.; Yoo, J.-H.; et al. Low-latitude plasma blobs above Africa: Exploiting GOLD and multi-satellite in situ measurements. Adv. Space Res. 2022; in press. [Google Scholar] [CrossRef]
  10. Kil, H.; Paxton, L.J.; Jee, G.; Nikoukar, R. Plasma blobs associated with medium-scale traveling ionospheric disturbances. Geophys. Res. Lett. 2019, 46, 3575–3581. [Google Scholar] [CrossRef]
  11. Bhat, A.; Ganaie, B.A.; Ramkumar, T.K.; Malik, M.A. Bifurcation and merging of low mid-latitude plasma irregularities seeded by Medium Scale Traveling Ionospheric Disturbances over Srinagar, Jammu and Kashmir, India. AGU Fall Meet. Abstr. 2020, 2020, SA009-0004. [Google Scholar]
  12. Carrasco, A.; Batista, I.; Wrasse, C.; Takahashi, H.; Pimenta, A. Disconnection and reconnection in plasma bubbles observed by OI 630 nm airglow images from Cariri Observatory. J. Geophys. Res. Space Phys. 2022, 127, e2021JA030042. [Google Scholar] [CrossRef]
  13. Sahai, Y.; Abalde, J.; Fagundes, P.; Pillat, V.; Bittencourt, J. First observations of detached equatorial ionospheric plasma depletions using OI 630.0 nm and OI 777.4 nm emissions nightglow imaging. Geophys. Res. Lett. 2006, 33, L11104. [Google Scholar] [CrossRef] [Green Version]
  14. Pimenta, A.; Fagundes, P.; Bittencourt, J.; Sahai, Y. Relevant aspects of equatorial plasma bubbles under different solar activity conditions. Adv. Space Res. 2001, 27, 1213–1218. [Google Scholar] [CrossRef]
  15. Huba, J.; Wu, T.; Makela, J. Electrostatic reconnection in the ionosphere. Geophys. Res. Lett. 2015, 42, 1626–1631. [Google Scholar] [CrossRef]
  16. Gurav, O.; Narayanan, V.; Sharma, A.; Ghodpage, R.; Gaikwad, H.; Patil, P. Airglow imaging observations of some evolutionary aspects of equatorial plasma bubbles from Indian sector. Adv. Space Res. 2019, 64, 385–399. [Google Scholar] [CrossRef]
  17. Chian, A.C.-L.; Abalde, J.R.; Miranda, R.A.; Borotto, F.A.; Hysell, D.L.; Rempel, E.L.; Ruffolo, D. Multi-spectral optical imaging of the spatiotemporal dynamics of ionospheric intermittent turbulence. Sci. Rep. 2018, 8, 10568. [Google Scholar] [CrossRef] [Green Version]
  18. Crowley, G.; Ridley, A.J.; Deist, D.; Wing, S.; Knipp, D.J.; Emery, B.A.; Foster, J.; Heelis, R.; Hairston, M.; Reinisch, B.W. Transformation of high-latitude ionospheric F region patches into blobs during the March 21, 1990, storm. J. Geophys. Res. Space Phys. 2000, 105, 5215–5230. [Google Scholar] [CrossRef] [Green Version]
  19. Kumar, P.; Manoharan, P. Eruption of a plasma blob, associated M-class flare, and large-scale extreme-ultraviolet wave observed by SDO. Astron. Astrophys. 2013, 553, A109. [Google Scholar] [CrossRef]
  20. De Keyser, J.; Darrouzet, R.; Roth, M.; Vaisberg, O.L.; Rybjeva, N.; Smirnov, V.; Avanov, L.; Němeček, Z.; Safrankova, J. Transients at the dusk side magnetospheric boundary: Surface waves or isolated plasma blobs? J. Geophys. Res. Space Phys. 2001, 106, 25503–25516. [Google Scholar] [CrossRef]
  21. Manz, P.; Ribeiro, T.T.; Scott, B.D.; Birkenmeier, G.; Carralero, D.; Fuchert, G.; Müller, S.H.; Müller, H.W.; Stroth, U.; Wolfrum, E. Origin and turbulence spreading of plasma blobs. Phys. Plasmas 2015, 22, 022308. [Google Scholar] [CrossRef] [Green Version]
  22. Maruyama, T. Observations of quasi-periodic scintillations and their possible relation to the dynamics of E s plasma blobs. Radio Sci. 1991, 26, 691–700. [Google Scholar] [CrossRef]
  23. Garcia, F.; Taylor, M.J.; Kelley, M. Two-dimensional spectral analysis of mesospheric airglow image data. Appl. Opt. 1997, 36, 7374–7385. [Google Scholar] [CrossRef] [PubMed] [Green Version]
  24. Dalgarno, A.; Walker, J.C. The red line of atomic oxygen in the day airglow. J. Atmos. Sci. 1964, 21, 463–474. [Google Scholar] [CrossRef]
  25. Rishbeth, H.; Garriott, O.K. Introduction to Ionospheric Physics; Academic Press: New York, NY, USA, 1969. [Google Scholar]
  26. Abdu, M.A.; Bhattacharyya, A.; Pancheva, D. Aeronomy of the Earth’s Atmosphere and Ionosphere; Springer Science & Business Media: Berlin, Germany, 2011; Volume 2. [Google Scholar]
  27. Taylor, M.J.; Eccles, J.; LaBelle, J.; Sobral, J. High resolution OI (630 nm) image measurements of F-region depletion drifts during the Guará Campaign. Geophys. Res. Lett. 1997, 24, 1699–1702. [Google Scholar] [CrossRef] [Green Version]
  28. Gonzalez, W.D.; Joselyn, J.A.; Kamide, Y.; Kroehl, H.W.; Rostoker, G.; Tsurutani, B.T.; Vasyliunas, V.M. What is a geomagnetic storm? J. Geophys. Res. Space Phys. 1994, 99, 5771–5792. [Google Scholar] [CrossRef] [Green Version]
  29. Pimenta, A.; Sahai, Y.; Bittencourt, J.; Rich, F. Ionospheric plasma blobs observed by OI 630 nm all-sky imaging in the Brazilian tropical sector during the major geomagnetic storm of April 6–7, 2000. Geophys. Res. Lett. 2007, 34, L02820. [Google Scholar] [CrossRef] [Green Version]
  30. Banks, P.M.; Kockarts, G. Aeronomy; Elsevier: New York, NY, USA, 2013. [Google Scholar]
  31. Krall, J.; Huba, J.; Joyce, G.; Yokoyama, T. Density enhancements associated with equatorial spread F. Ann. Geophys. 2010, 28, 327–337. [Google Scholar] [CrossRef] [Green Version]
  32. Zabusky, N.; Doles, J., III; Perkins, F. Deformation and striation of plasma clouds in the ionosphere: 2. Numerical simulation of a nonlinear two-dimensional model. J. Geophys. Res. 1973, 78, 711–724. [Google Scholar] [CrossRef]
  33. de Paula, E.R.; de Oliveira, C.B.; Caton, R.G.; Negreti, P.M.; Batista, I.S.; Martinon, A.R.; Neto, A.C.; Abdu, M.A.; Monico, J.F.; Sousasantos, J.; et al. Ionospheric irregularity behavior during the September 6–10, 2017 magnetic storm over Brazilian equatorial–low latitudes. Earth Planets Space 2019, 71, 42. [Google Scholar] [CrossRef]
  34. Yokoyama, T.; Su, S.; Fukao, S. Plasma blobs and irregularities concurrently observed by ROCSAT-1 and Equatorial Atmosphere Radar. J. Geophys. Res. Space Phys. 2007, 112, A05311. [Google Scholar] [CrossRef] [Green Version]
  35. Wang, Z.; Liu, H.; Shi, J.; Wang, G.; Wang, X. Plasma blobs concurrently observed with bubbles in the Asian-Oceanian sector during solar maximum. J. Geophys. Res. Space Phys. 2019, 124, 7062–7071. [Google Scholar] [CrossRef]
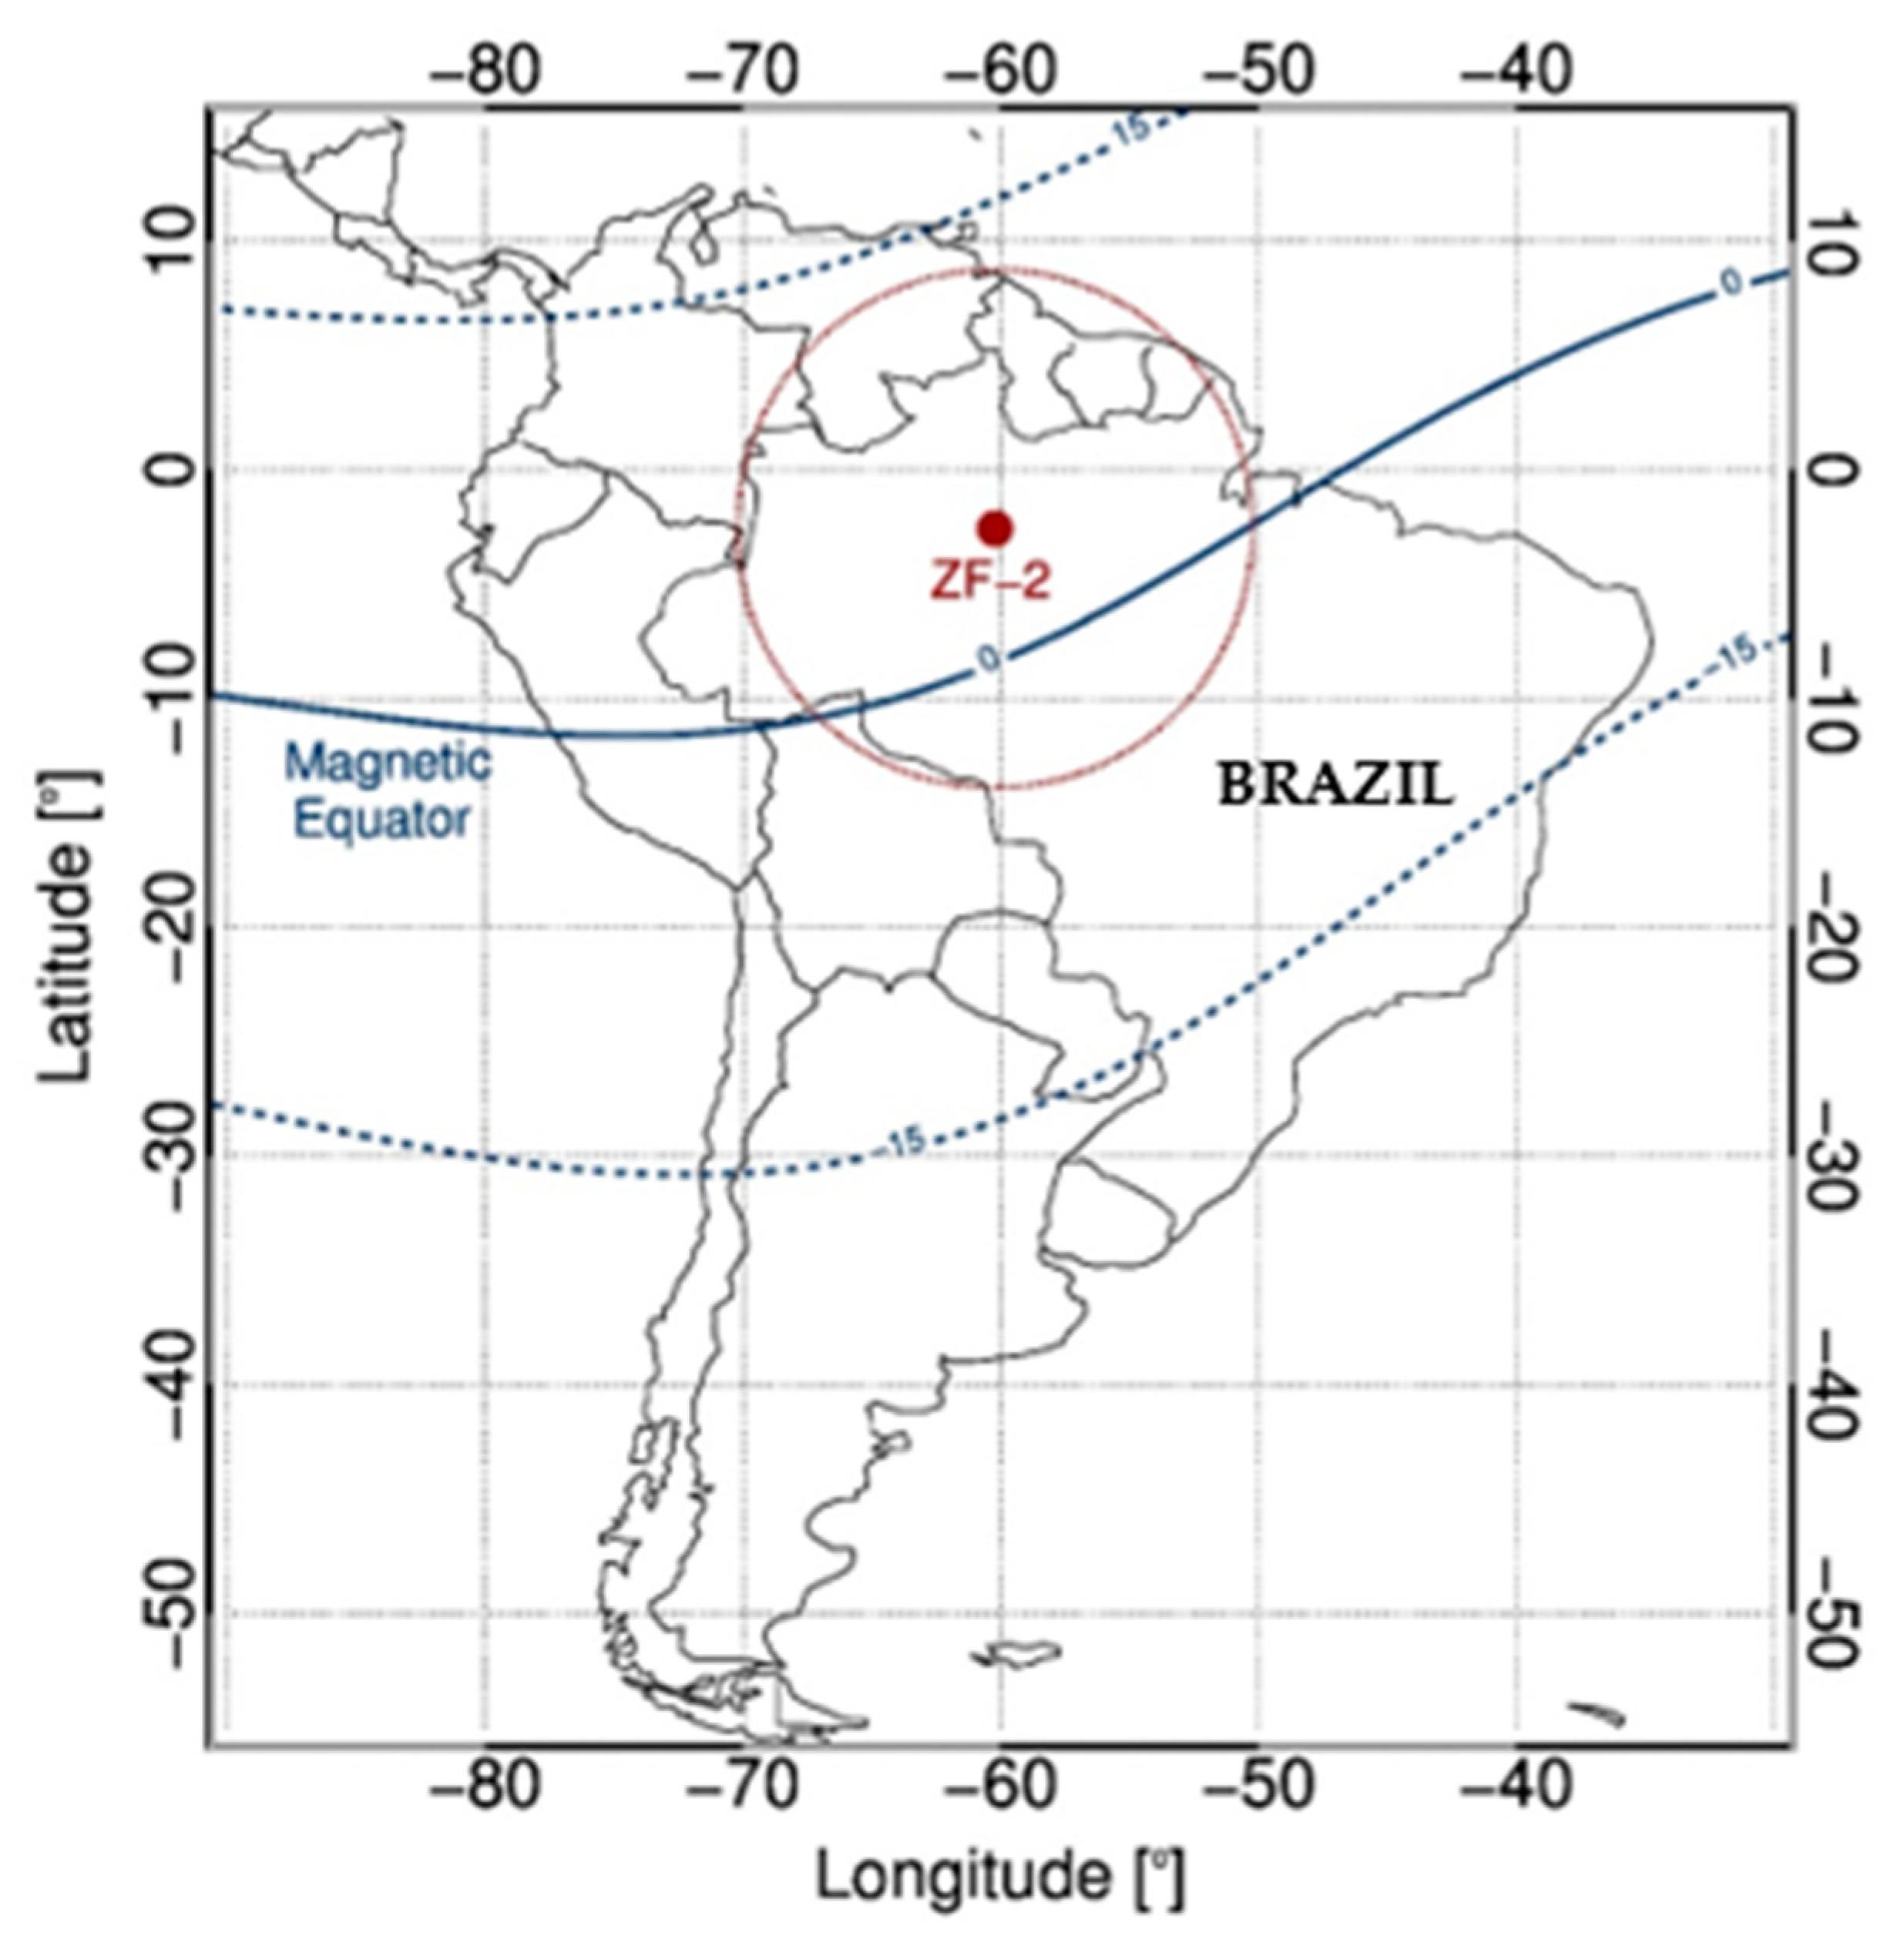
Figure 1. Location of the all-sky imager at ZF-2 (Amazon region) with its respective field of view, considering the OI 630 nm emission height at 250 km. Other relevant information, such as the magnetic equator, is shown in the figure.
Atmosphere 14 00514 g001
Figure 2. Schematic illustration of the position of the all-sky imager, its FOV (orange arrows), the zenith of the imager (green arrow), the height of OI 630 nm airglow layer (thick redline), electron density profile and the profile of the concentration of O2 on the magnetic geometry across the equatorial region. Adapted from [3].
Atmosphere 14 00514 g002
Figure 3. Raw all-sky images. The bubble and blob were spectral, being only visible at the 630 nm (panel a) and 557.7 nm (panel b) emissions and not in the control/background (BG) 598 nm wavelength, as shown in (panel c).
Atmosphere 14 00514 g003
Figure 4. OI 630.0 nm emission all-sky images obtained at ZF-2 on 26 October 2019, showing plasma blobs merging. Unwarped images corresponding to a mapped area of the processed image of 1024 km × 1024 km at the OI 630 nm airglow layer, assuming an emission altitude of 250 km. The black structures at the top-right and bottom-left of the images are trees at the imager’s location.
Atmosphere 14 00514 g004
Figure 5. Sequential unwarped images of plasma blob merging observed at the equatorial region (2.58° S, 60.22° W). The bright regions along the field lines are the plasma blobs. The blobs drift eastward and then later merge. B1 signifies Blob1, B2 signifies Blob2 and Bm signifies Merged Blob.
Atmosphere 14 00514 g005
Figure 6. East–West scale-size of the blobs during the merging process on 26 October 2019, at ZF-2. B1 and B2 (B denotes blob) are studied to observe their E-W scale-size variation during merging.
Atmosphere 14 00514 g006
Figure 7. Relative intensity profile of plasma blob merging. The red line tracks the peak relative intensity of B1 while the blue line tracks the peak relative intensity of B2.
Atmosphere 14 00514 g007
Figure 8. Unwarped sequential all-sky images of plasma blob bifurcation on the night of 1–2 March 2019, at ZF-2. The images show a dark structure (bubble) developing at the northern edge of the view, which splits the bright structure (blob).
Atmosphere 14 00514 g008
Figure 9. Blob’s bifurcation line profile analysis. A line is placed close to the view’s northern edge to monitor the bubble mapping’s emergence along the field line. The red box indicates the region of the bifurcation of the blob by the bubble. Unwarped images corresponding to a mapped area of the processed image of 1024 km × 1024 km at the OI 630 nm airglow layer, assuming an emission altitude of 250 km.
Atmosphere 14 00514 g009
Figure 10. Signatures of EPB bifurcating blob. The images and the zonal relative intensity profile (red line) are shown. The first panel is the blob yet to experience bifurcation. The second panel is the blob bifurcating. The third panel is the presence of two blobs already split in two. EPB means Equatorial Plasma Bubbles.
Atmosphere 14 00514 g010
Table 1. Dates of events studied.
S/NBifurcation EventsDst (nT)Merging EventsDst (nT)
11 March 2019>−298 March 2019>−16
29 October 2019>−913 March 2019>−16
319 October 2019>−425–26 March 2019>−34
Disclaimer/Publisher’s Note: The statements, opinions and data contained in all publications are solely those of the individual author(s) and contributor(s) and not of MDPI and/or the editor(s). MDPI and/or the editor(s) disclaim responsibility for any injury to people or property resulting from any ideas, methods, instructions or products referred to in the content.