Abstract
The Saudi government targets building eight solar plants across the country by 2030, which are expected to produce more than 3600 MW, enough to power more than 500,000 homes. However, the vast desert environment in Saudi Arabia increases dust and aerosol loading in the atmosphere, which affect the performance of photovoltaic systems due to scattering and absorption of the solar radiation by dust particles. In this work, ground-based data from weather stations located in six Saudi cities, Dammam, Hafar Al Batin, Riyadh, Jeddah, Najran, and Arar, along with data from the Moderate Resolution Imaging Spectroradiometer (MODIS) are used to examine the effects of dust loading on aerosol optical parameters, air temperature, and solar irradiance. The effects of three major dust storms that blew over different regions in Saudi Arabia on 20 March 2017, 23 April 2018, and 15 April 2021 have been investigated. It is found that there is a strong correlation between dust loading and aerosol optical parameters. The maximum Aerosol Optical Depth (AOD) was recorded over Jeddah on 19 March 2017 (about 2), over Riyadh on 20 March 2017 (about 2.3), over Riyadh on 24 April 2018 (about 1.5), and over Najran on 15 April 2021 (about 0.9). Strong dust events are found to reduce air temperature by a few degrees in high dust loading regions. The study found that such large dust loading decreases the direct and global solar irradiance components, while it increases the diffuse component over the cities of Jeddah, Riyadh, and Najran. This could be an indication that scattering from dust particles can play a significant role in the solar irradiance intensity.
1. Introduction
Saudi Arabia (Figure 1) is the largest country of the Arabian Peninsula, encompassing 80% of its area. The climate of Saudi Arabia is arid to semi-arid, mostly associated with high temperatures and low precipitation [1]. According to Koppen classification [2], the northern and central regions of Saudi Arabia remain hot and dry while steppe-mild conditions prevail in the SW regions. Moreover, there are two major climatic features, the South Asian Monsoon and Mediterranean systems, greatly impacting the regional climate. The South Asian Monsoon mainly influences the southern regions, whereas the Mediterranean systems are responsible for weather activities in the northern and central regions of Saudi Arabia. The highlands in the W and SW regions are mainly responsible for local weather activities, while the surrounded water bodies of the Red Sea (W), Arabian Gulf (E), and Arabian Sea (S) flow moisture over the region [3,4]. On the other hand, the three big deserts of Rub Al-Khali (SE), Al-Dahna (inland), and Nafud (N) are the major dust sources, which may cause dry and hot conditions over the region [5].
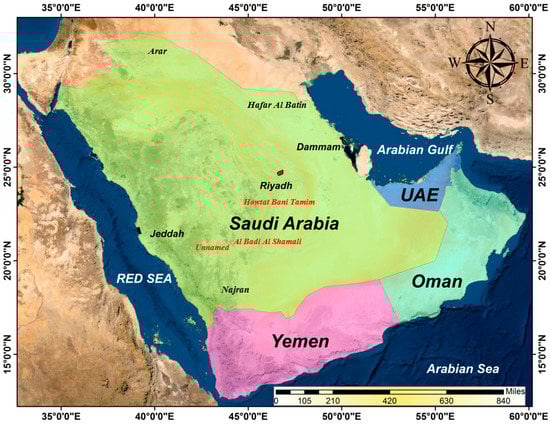
Figure 1.
Map of Saudi Arabia and other countries in the Arabian Peninsula.
However, the well-known climatic phenomena found in Saudi Arabia are temperature extremes that result in heat waves and cold waves, while precipitation extremes are responsible for flash flooding and drought over the region [6,7]. Furthermore, dust storms frequently hit the region and greatly impact the regional climate. Dust storms are more frequent over Saudi Arabia during spring and summer seasons [8,9,10]. However, the spring is a dust-prone season in the northern and central regions, while the frequency and intensity of dust events are higher in the south within the summer season. In addition, there are various dust source origins from where dust is transported to different places in Saudi Arabia. In the north, the An-Nafud desert (local source region), the Sahara Desert, and the Iraqi and Syrian deserts appear as major dust sources. Further, the Rub Al-Khali desert (local source region) and the NE African (remote) source regions raise dust that is transported to southern regions of Saudi Arabia. Additionally, the arid region of Yemen also contributes with dust to the southern regions [11].
Dust storms are mainly responsible for the dust aerosol load in the atmosphere, which cause problems to human health such as respiratory diseases, allergens, and skin issues [12]. Similarly, dust transport affects the visibility over the region and causes difficulties to traffic [13]. Further, dust storms greatly influence the regional climate. Dust aerosols alter the cloud microphysics and serve as cloud condensation nuclei [12]. Furthermore, the presence of dust aerosols in the atmosphere directly affects the energy budget through absorption and scattering of solar radiation, mechanisms that contribute to global warming and cooling [14,15,16].
Saudi Arabia, a leading global oil producer, is also among the top 10 oil consumers worldwide [17]. On the other hand, the world is attracted toward solar energy that is easily accessible, renewable, and unpolluted. In 2022, Saudi Arabia, announced its Middle East Green Initiative with many objectives including reducing carbon emissions by divagating the country away from an oil-based economy and towards renewables. In order to gradually transform into a green economy, the country must develop reliable renewable energy sources to replace fossil fuels. In the last few years, Saudi Arabia has launched several projects to generate electricity using renewable energy [18]. The projects include several wind and solar energy projects. Such projects aim to reach the optimal energy mix for electricity production by using renewable energy technology [18]. Saudi Arabia has a unique chance to exploit its great solar potential and to become one of the global largest solar energy producers, as it is geographically located on a sun belt [19,20]. Annual mean solar energy falling in Saudi Arabia is around 200 kWh/m2 [14]. Saudi Arabia has taken the initiative to use solar energy since the 1960s. Therefore, a solar hydrogen power plant was established at Solar Village near Riyadh [21]. Moreover, the King Abdullah University installed photovoltaic (PV) cells of 2 MW in Thuwal [22], which produce 3300 MWh energy annually and save 1700 tons of annual carbon emissions. Another solar power plant has been installed on Farasan Island [14] in the south of Saudi Arabia with a capacity of 500 KW. Furthermore, the world largest solar park project is in Dhahran at Aramco headquarters with a 10 MW carport system. Moreover, Saudi Energy Company is investing to construct a 2060 MW PV plant in western Saudi Arabia and it is expected to be operational by winter of 2025 [23]. Saudi Arabia had an installed solar capacity of around 0.344 GW in 2019 [24].
Beside the advantages of solar energy, dust loading in the atmosphere is one of the main concerns for the consistency of solar panels. The arid/semi-arid nature of Saudi Arabia along the vast desert environment increases aerosol loading in the atmosphere. Moreover, dust storms frequently blow over Saudi Arabia, which significantly load dust particles in the atmosphere. Meanwhile, dust in the atmosphere accumulates on the surface of solar panels; this mechanism reduces the amount of solar radiation absorbed at the surface of the panels. This high dust concentration reduces the efficiency in harvesting solar energy as dust particles block and scatter solar radiation; therefore, it is crucial to investigate dust loading in the atmosphere and its effect on the atmospheric characteristics and solar irradiance especially during major dust events. Thus, the output and the efficiency of solar panels are reduced and, consequently, affect the overall PV performance [16,25]. Numerous studies investigated the relationship between the power losses on PV panels and the total mass of the dust; the findings have revealed that both variables have a linear relation. It has also been reported that small-size dust particles block more solar radiation and result in more output power decreases [26,27,28].
Solar irradiance measurements from the Solar Atlas of Saudi Arabia, which was developed in February 2014, are assessed in [29] along with surface meteorological measurements available from the Renewable Resource Atlas for Saudi Arabia developed by the King Abdullah City for Atomic and Renewable Energy (KACARE), where the Solar Atlas provides live data recorded from 41 stations across Saudi Arabia. According to the Atlas, the direct normal irradiance in the various regions of Saudi Arabia changes from 9000–5000 W h/m2/day during summer–winter months.
Many studies investigated the various aspects of solar radiation and power generation utilizing solar energy to identify the suitable localities to obtain maximum output from PV systems in Saudi Arabia. In [30], a solar irradiance model was developed and compared with 16 other models for different regions and meteorological conditions. They showed that their model performance is reasonably good to estimate solar radiation over Saudi Arabia. Similarly, [31] examined the solar radiation resources in Saudi Arabia. Their findings depict that western inland regions are more suitable relative to eastern regions for the power generation through solar energy, where average daily total solar radiations of 6474 W h/m2 and 5510 W h/m2 were recorded in western and the eastern regions of Saudi Arabia, respectively. They also examined three solar irradiance components (Diffuse Horizontal Irradiance (DHI), the Direct Normal Irradiance (DNI), and the Global Horizontal Irradiance (GHI)) from 30 stations across Saudi Arabia from October 2013 to September 2014. High GHI values were observed across all stations, which indicates that GHI values are well suited for high PV performance. The study also reported that dust settling and the extreme high temperature (>30 °C annual average in some locations) may degrade the performance of some types of PV panels. Meanwhile, they reported that DNI values are spatially variable due to a combination of aerosols, pollution, clouds, and dust and were found to be closely linked to the DHI/GHI ratio for each station. Moreover, [32] developed a mathematical model to simulate the hourly data of solar radiation for four different climatic regions such as Jeddah (warm humid), Dammam (maritime-inland desert), Riyadh (dry hot), and Najran (highland). The results showed a model accuracy of >90%. Consequently, [33] estimated the global and solar radiations on horizontal and tilted surfaces over Jeddah, Saudi Arabia, using various meteorological parameters (i.e., ambient temperature, max and min ambient temperature, sunshine hours, cloud cover, and relative humidity) for the period 1996–2007. Later on, the empirical correlation was evaluated for the diffuse solar radiation on horizontal surfaces, while the total solar radiation on tilted surfaces was estimated by using “Liu and Jordon isotropic” and “Klucher’s anisotropic” models and compared with the NASA “SSE model”. The findings highlight that models are capable of predicting solar radiations on horizontal and tilted surfaces in Jeddah with reasonably good accuracy. A model developed by [34] was used to estimate monthly averaged global solar radiation over the NW of Saudi Arabia and the model output was compared with the measured data and 29 other regression models. The results showed high accuracy for the region. The local solar radiation in the east region of Saudi Arabia was measured using an Eppley Normal Incidence Pyrheliometer (NIP) [35] to examine the correlation between the monthly average daily global solar radiation and the sunshine duration. They found that, on an annual basis, the agreement between the measured and the predicted global values is >4%.
From the above, it is seen that only limited studies have investigated the effect of dust loading in the atmosphere on the solar irradiance over Saudi Arabia. This gap is filled by the present work, where the Moderate Resolution Imaging Spectroradiometer (MODIS) on board the Terra satellite along with meteorological and solar irradiance data from several meteorological stations have been used to measure aerosol optical and physical parameters and the effect of dust loading on the intensity of solar irradiance during major dust events. The goal is to understand how dust loading in the atmosphere can affect solar irradiance and other atmospheric conditions. This information is useful to improve the performance of solar panels in a desert-like environment such as that of Saudi Arabia.
2. Materials and Methods
Three major dust events (Figure 2 and Table 1) that blew over Saudi Arabia on 20 March 2017, 23 April 2018, and 15 April 2021 have been investigated.
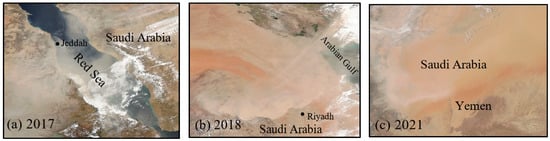
Figure 2.
Major dust storms blown over Saudi Arabia on (a) 20 March 2017, (b) 23 April 2018, and (c) 15 April 2021.

Table 1.
Major dust events blown over Saudi Arabia in 2017, 2018, and 2021. Source: [36].
On 20 March 2017 (Figure 2a), a dust storm originated in Libya and moved through Sudan, Eritrea, and the Red Sea entering Saudi Arabia. Further, the dust and sand covered the wider domain and caused poor visibility. Fluctuations in temperatures, strong winds, and rapid variability in meteorological conditions associated with seasonal changes from winter to spring played a major role in initiating this dust storm [37]. On 23 April 2018 (Figure 2b), a large cloud of dust originated in Iraq/Syria and blew across Saudi Arabia through the Shamal wind [38] and extended up to 500 km across Saudi Arabia, reaching Riyadh, the capital city. The Shamal wind is usually attributed to the pressure gradient between the Northern Arabian Peninsula and the Arabian Gulf [39]. On 15 April 2021 (Figure 2c), large dust plumes stretched up to 1200 km coming from Yemen, where dust and sand storms are very common as Yemen is located in a semi-arid region. Dust can then be easily transported to Saudi Arabia through its SW borders and fueled by the dust particles across the vast Empty Quarter “Rub Al-Khali “desert [40]. The three storms have been selected based on their sources, dust dynamics, and path criteria [41,42]. Large dust events that blew over Saudi Arabia from different sources/directions have been selected. For example, the 20 March 2017 dust event originated in the Sahara Desert (west of Saudi Arabia) and it mostly affected the NW and W regions of Saudi Arabia. Meanwhile, the 23 April 2018 dust storm originated in the Iraqi and Syrian deserts (north east of Saudi Arabia) and affected the NE regions of Saudi Arabia, and the 15 April 2021 dust event originated in Yemen and affected the SW regions of Saudi Arabia.
2.1. Experimental Sites and Parameters
2.1.1. The Moderate Resolution Imaging Spectroradiometer (MODIS)
The Moderate Resolution Imaging Spectroradiometer (MODIS) is an instrument on board the two polar orbiting satellites Terra and Aqua. The Terra satellite was launched in 1999; it crosses the equator from north to south at 10:30 am (UTC). The Aqua satellite has orbited since 2002 and crosses the equator from south to north at 1:30 pm. Moreover, the MODIS is designed to acquire the qualitative information of land, atmosphere, and ocean for research. However, the MODIS is armed with different features. The radiometric sensitivity of the MODIS is 12 bits in 36 spectral bands in the range 0.4–14.4 µm [15,43,44,45]. Moreover, these spectral bands have different spatial resolutions such as 2 bands (250 m), 5 bands (500 m), and 29 bands (1000 m). In addition, these spectral bands are defined to obtain the various types of information. Bands 1 and 2 are utilized to differentiate boundaries of land, cloud, and aerosols, while bands 3–7 are mostly used to fetch the information of land, cloud, and aerosol properties. On the other hand, precise information of the ocean and phytoplankton is captured by utilizing bands 8–16. Furthermore, bands 17–19 (near infra-red) and 27–28 (short-wave infra-red) provide precise information about the atmospheric water vapor. Similarly, the 20–23 (33–36) bands of thermal (long-wave) infra-red are employed to detect the surface and cloud temperatures. The thermal infra-red bands (24–25) are particularly used for atmospheric temperature profiles. Further, the near infra-red band 26 is useful to detect high clouds such as cirrus. Nevertheless, spectral bands 29–30 (short-wave infra-red) are utilized to retrieve information of cloud properties and ozone, whereas bands 31–32 are specifically used to detect land-surface temperature. Finally, the long-wave infra-red bands (33–36) are utilized to explore cloud characteristics including thickness, altitude, and top pressure [46,47].
With its high radiometric sensitivity and swath resolution (2330 km × 10 km), MODIS retrievals provide information about aerosol optical and physical characteristics. Over bright land, the Deep Blue (DB) algorithm developed by NASA is used to calculate AOD by observing differences between aerosols and surface features. DB uses 412, 470, and 479 nm for AOD retrievals. Over water and other low-reflectance surfaces (e.g., vegetated regions, dark soil), the DB algorithm is not used, but the Dark Target (DT) algorithm is used instead. DT uses 470 and 650 nm (visible) and 2100 nm (infrared) [48] for AOD retrievals. This makes MODIS combine retrievals for both land and water over this region. In this work, the Deep Blue (550 nm land only) Aerosol Optical Depth (AOD) and Angstrom Exponent (AE) (412–470 nm land only) Collection 6 L2 MODIS/Terra dataset [49] is used. The uncertainty in MODIS retrievals is caused by uncertainties in computing cloud masking, surface reflectance, aerosol model type (e.g., single-scattering albedo), pixel selections, and instrument calibration. Data are available at [50].
2.1.2. Solar Stations
Solar irradiance measurements presented in this work are based on data collected in the frame of the Renewable Resource Atlas (RRA) for Saudi Arabia, which was launched in 2013 as part of the King Abdullah City for Atomic and Renewable Energy’s (K.A.CARE’s) Renewable Resource Monitoring and Mapping (RRMM) program [51]. The RRMM program funded the establishment of 47 solar radiation stations throughout Saudi Arabia. The collection of data started in August 2013 and continued to the end of August 2021; although, this duration is not the same at all the stations of the program, which means that gaps exist.
The parameters measured at the RRMM stations were the global horizontal irradiance (GHI) (W/m2), the diffuse horizontal irradiance (DHI) (W/m2), the direct-normal irradiance (DNI) (W/m2), and the air temperature (°C). The solar radiation components were measured with Kipp–Zonen CMP11 pyranometers with an accuracy of ±2%. The diffuse radiation was provided by a rotating shadow band over the pyranometer. The data were sampled every minute and hourly averages were later computed offline. According to the technical reports for each station and the RRMM program, the maintenance of the equipment took place daily. Data uncertainty results from possible supporting equipment failures (e.g., solar trackers, ventilators, etc.), or errors due to station installation, operation, and maintenance performance (including calibrations).
In the present study, datasets of solar and meteorological stations (Table 1) of Dammam (eastern Saudi Arabia), Hafar Al Batin (NE), Riyadh (central), Jeddah (W), Najran (SW), and Arar (N) are utilized. The corresponding latitude/longitude of each city is listed in Table 2. The selection of the aforementioned cities is based on three criteria: first is their location, such that they cover different cardinal directions of the country; the second is that they are on the dust path during the selected storms; and the third is that they have a solar irradiance station with a reliable dataset.
Table 2.
Specifications of solar monitoring stations used in this study, covering the period 2013–2021 (9 years).
Panoply 5 and Microsoft Excel have been used to read, process, and analyze the data from MODIS/Terra and the solar stations.
2.1.3. Aerosol Optical Depth (AOD)
The Aerosol Optical Depth (AOD) is an estimate of the amount of the aerosols present in the atmosphere. It is measured using sun photometers by comparing the solar radiation passing through an aerosol-burden and an aerosol-free atmosphere [52].
2.1.4. Angstrom Exponent (AE)
The Angstrom parameter () delineates the aerosols’ optical thickness and depends on the wavelength of the light ranging from 440 nm to 1020 nm. However, the first derivative of AOD with respect to wavelength in logarithmic scale defines the Angstrom parameter [53].
A value of above 2 indicates the presence of fine particles, while a near-zero value indicates the existence of coarse dust particles.
2.1.5. Solar Irradiance Components
Three solar irradiance components are investigated in this study, i.e., the Diffuse Horizontal Irradiance (DHI), the Direct Normal Irradiance (DNI), and the Global Horizontal Irradiance (GHI), where DHI is the solar radiation which reaches the ground surface from light scattered by the atmosphere, DNI is the solar radiation which reaches the ground surface in a straight line from the Sun according to its instant position in sky, and GHI is the total shortwave radiation received from the Sun by the horizontal surface. In other words, it is the sum of DHI, DNI, and the ground-reflected radiations. DHI, DNI, and GHI are measured in W/.
2.1.6. HYSPLIT Model
The Hybrid Single Particle Lagrangian Integrated Trajectory (HYSPLIT) model is a computational tool that predicts air parcels’ transport and spatial distribution [54]. Gridded meteorological parameters are used to allocate air parcels’ trajectories at specific times.
The HYSPLIT back trajectories have been used to find the origin of air masses, their paths, and their sources. The model calculation method is a hybrid between the Lagrangian approach and the Eulerian methodology, which applies a fixed three-dimensional mesh as a reference frame to determine air pollution loadings.
3. Results and Discussion
3.1. AOD and AE Variability
Using Terra/MODIS data, the AOD values at 550 nm and AE values at (412–470) nm on 20 March 2017, 23 April 2018, and 15 April 2021 are displayed in Figure 3a–c and Figure 4a–c, respectively. On 20 March 2017, high AOD values (2.8–3.5) were observed in northern regions of Saudi Arabia, while minimum AOD values (0.1–0.7) were retrieved over the southern regions, particularly in the SE domain (Figure 3a). The high AOD values were attributed to the high dust loading in the atmosphere near the cities of Arar and Jeddah (Table 1 and Figure 1) in the NW region of Saudi Arabia during the 20 March 2017 dust event. Meanwhile, low AE values (0.1–0.3) were observed around Arar and Jeddah (Figure 4a), indicating that large dust particles from the desert mostly loaded the atmosphere.
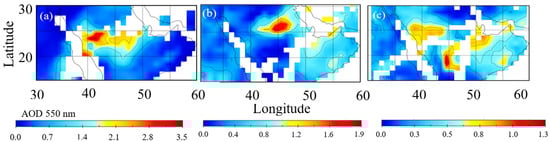
Figure 3.
AOD at 550 nm during some major dust storms blown over Saudi Arabia on (a) 20 March 2017, (b) 23 April 2018, and (c) 15 April 2021.
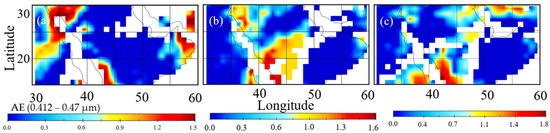
Figure 4.
AE in the band 0.412–0.47 µm during some major dust storms blown over Saudi Arabia on (a) 20 March 2017, (b) 23 April 2018, and (c) 15 April 2021.
During the 23 April 2018 dust event, high AOD values (about 3.5) were observed in the NE quadrant of Saudi Arabia, while low values (0.1–0.3) were observed near the west and some central parts of the country. Moreover, the AOD values fluctuate between 0.7 and 1.4 in the southern regions of Saudi Arabia (Figure 3b). The high AOD values are attributed to the high dust loading in the atmosphere near the cities of Riyadh and Dammam (Table 1 and Figure 1) in the NE region of Saudi Arabia during the 23 April 2018 dust event. Low AE values (0.2–0.6) were observed around Riyadh and Dammam (Figure 4b), indicating that large dust particles dominated the atmosphere. Meanwhile, high AE values (1–1.5) (Figure 4b) were observed in the SW part of Saudi Arabia, indicating small-size particles in the atmosphere. Those particles were mostly generated by traffic and industrial pollution in those areas.
During the 15 April 2021 dust event, AOD values of 0.8–1.3 were observed over the central and SW regions of Saudi Arabia (Figure 3c). The relatively high AOD values were attributed to the high dust loading in the atmosphere near the city of Najran (Table 1 and Figure 1) in the SW region of Saudi Arabia during this dust event. Interestingly, despite the storm, high AE values (1.4–1.8) were still observed near Najran (Figure 4c). This indicates that natural dust loading was not that high during the storm and anthropogenic particles still dominated the atmosphere.
3.2. Wind Patterns
Wind characteristics and dynamics play a significant role in moving dust plumes across Saudi Arabia during large dust events. Wind speed and direction patterns during the 20 March 2017, 23 April 2018, and 15 April 2021 dust storms along with lead-lag days are shown in Figure 5.
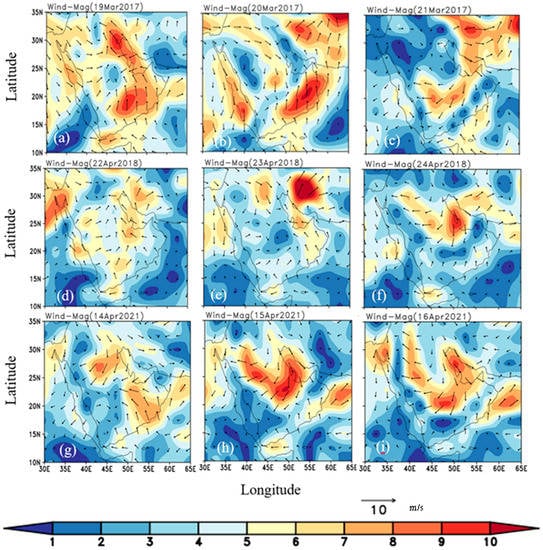
Figure 5.
Wind speed and wind direction over Saudi Arabia during (a–c) 19–21 March 2017, (d–f) 22–24 April 2018; (g–i) 14–16 April 2021.
Figure 5a shows the wind pattern on 19 March 2017, one day before the occurrence of the March 2017 dust storm. High wind speed (7–10 m/s) was observed over the entire eastern regions of Saudi Arabia, while a low wind speed (3–6 m/s) was observed at the western coast along with some central regions of the country with the wind directed towards Saudi Arabia from the southern Arabian Sea and western (Africa) side. It is noted that circulation developed over the NE regions where both directed wind patterns meet up. On the storm day (20 March 2017), this circulation pattern became mature and extended over the northern and central regions. Similarly, the wind speed became higher (about 10 m/s) over the eastern regions, specifically in SE regions of the country, whereas a low wind speed (<6 m/s) was observed in the western and few central regions (Figure 5b). It can be observed that the dust observed over the cities of Arar and Jeddah during the dust storm was possibly transported from the Sahara Desert in Africa. On 21 March 2017, one day after the dust event, the wind speed increased (8 m/s) in central regions and became low (<5 m/s) in a wider domain of the country including the northern, western, and southern coastal regions (Figure 5c).
Figure 5d shows the wind pattern on 22 April 2018, one day before the occurrence of the April 2018 dust storm. Wind speed was observed to be slightly high (about 8 m/s) in the central and northern regions, while the speed was lower (<5 m/s) over the SE regions. The wind approached the region from the W and SE regions and convergence occurred over NW regions. On 23 April 2018, the day of the storm, wind speed was observed to be about 6 m/s in the SE and about 2 m/s in the central regions. Moreover, the circulation developed in the central and northern regions of Saudi Arabia (Figure 5e). It can be observed that the dust observed over the cities of Riyadh and Dammam during the dust storm was possibly transported from the Iraq and Syrian Deserts. On 24 April 2018, one day after the storm, wind speed became about 10 m/s in the NE region and a low wind speed (<5 m/s) was observed over W and S regions. Further, the developed circulation weakened and shifted toward the NW regions on 24 April 2018 (Figure 5f).
Figure 5g shows the wind pattern on 14 April 2021, one day before the occurrence of the April 2021 dust storm. Wind speed was observed to be about 9 m/s over the eastern regions, while a lower speed (<5 m/s) was observed in W and central regions. Furthermore, the NE and SE winds converged over the NW region of Saudi Arabia and a circulation pattern formed over that region. Later, on 15 April 2021, the dust storm day, the wind magnitude had a maximum of >10 m/s in the NW and central regions, while the circulation motion became stronger over the NE regions, which is responsible for initiating dust activity. However, the wind speed was low (<3 m/s) in SW regions of Saudi Arabia (Figure 5h). It can be observed that the dust observed over the city of Najran during the dust storm was possibly transported from Yemen and transported all the way to the United Arab Emirates and Oman. The spatial pattern of wind on 16 April 2021, the day after the occurrence of dust storm, indicates the storm’s dissipation. The circulation motion weakened over the NE regions, while a high (low) wind speed was observed in NE and SW regions (Figure 5i).
3.3. Temperature Variability
The temperature variability during the 20 March 2017, 23 April 2018, and 15 April 2021 dust storms along with two days before and after the event are shown in Figure 6, Figure 7 and Figure 8, respectively, and in Table 2 for six Saudi cities: Dammam, Hafar Al Batin, Riyadh, Jeddah, Najran, and Arar.
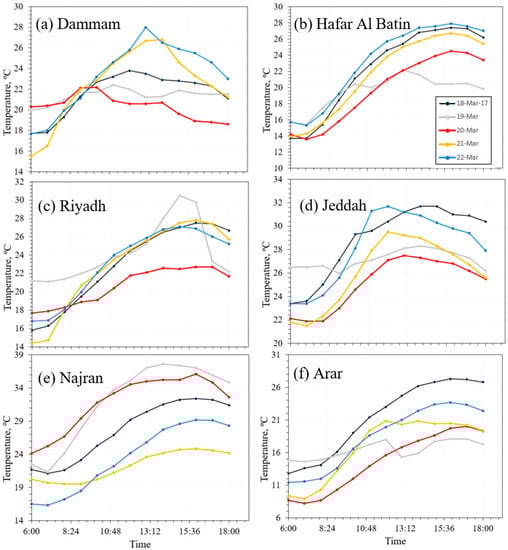
Figure 6.
Air temperature variability (°C) over six Saudi cities (a) Dammam, (b) Hafar Al Batin, (c) Riyadh, (d) Jeddah, (e) Najran, and (f) Arar from 18 to 22 March 2017.
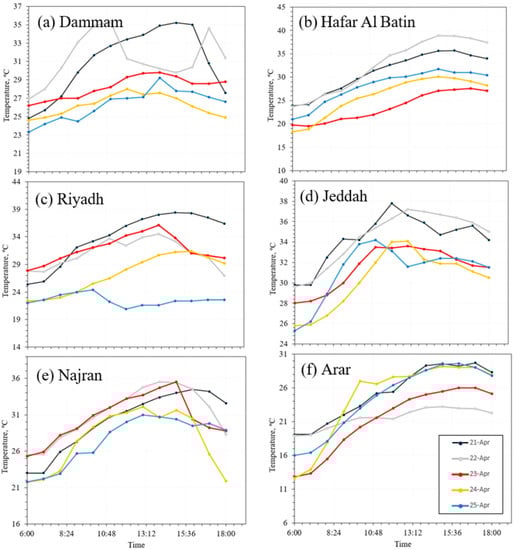
Figure 7.
Air temperature variability (°C) over six Saudi cities (a) Dammam, (b) Hafar Al Batin, (c) Riyadh, (d) Jeddah, (e) Najran, and (f) Arar from 21 to 25 April 2018.
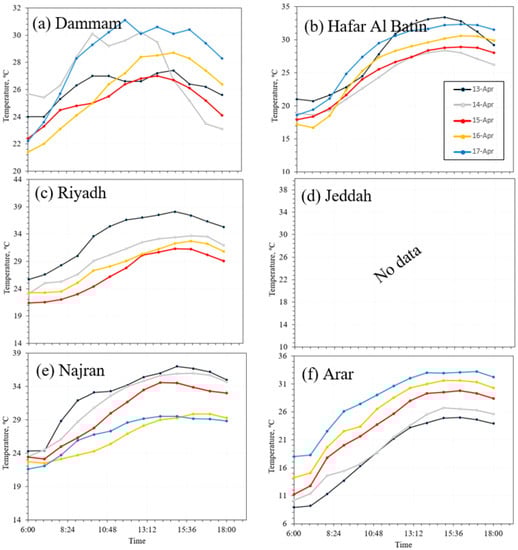
Figure 8.
Air temperature variability (°C) over six Saudi cities (a) Dammam, (b) Hafar Al Batin, (c) Riyadh, (d) Jeddah, (e) Najran, and (f) Arar from 13 to 17 April 2021. No data are available for (c) Riyadh on 17 April 2021. No data are available for Jeddah.
3.4. Air Mass Trajectories
Figure 9a–c illustrate the NOAA HYSPLIT model backward trajectories at the cities of Jeddah, Dammam, and Najran during the 20 March 2017, 23 April 2018, and 15 April 2021 dust events, respectively. Figure 9a shows that air parcels moved from North Africa towards Saudi Arabia during the 20 March 2017 storm. Additionally, Figure 9b shows that air parcels moved from NE borders near Iraq and Syria towards Saudi Arabia during the 23 April 2018 storm. Meanwhile, Figure 9c shows that air parcels moved from Yemen toward Saudi Arabia during the 15 April 2021 storm. It can be observed that the HYSPLIT model air mass trajectories prediction matches the MODIS observations related to dust particles’ dynamics and distribution.
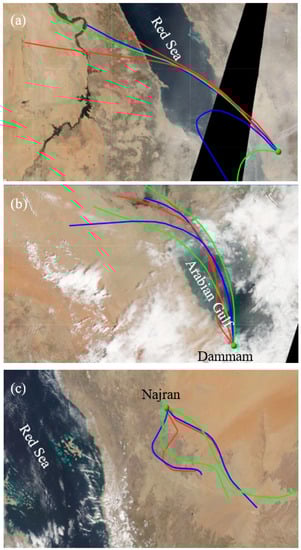
Figure 9.
NOAA HYSPILT back trajectories modeling air mass on (a) 20 March 2017, (b) 23 April 2018, and (c) 15 April 2021.
The results (Table 3) show that during the 20 March 2017 dust storm, the temperature decreased over all six cities except Najran. The decrease in temperature was more pronounced in W and NW Saudi Arabia near the cities of Jeddah and Arar, and this may be attributed to high dust loading in the atmosphere during the dust storm (Figure 3a). As the wind blew towards the SE, high dust loading was also observed near the NE regions around the city of Hafar Al Batin (Figure 3a and Figure 4b). There was also a reduction in air temperature at the city of Dammam, which may also be attributed to the storm; however, AOD values cannot be confirmed due to missing MODIS data (Figure 3a). There was no observed reduction in air temperature near Najran as this region of the country was not affected by the dust event.
Table 3.
Temperature variability during the 20 March 2017, 23 April 2018, and 15 April 2021 dust events. T1 = temperature (day of the storm) − temperature (two days before the storm) and T2 = temperature (day of the storm) − temperature (two days after the storm). T1 and T2 were measured at 13:12 local time.
During the 23 April 2018 dust storm, in Hafar Al Batin and Arar, the air temperatures on the day of the storm were less than the temperatures observed pre- and post-storm. In Dammam and Riyadh, the temperatures on the day of the storm were less than the lag days only (Table 3). This temperature decrease can also be attributed to the dust loading in the atmosphere during the storm as indicated by high AOD values measured near the N and NE regions of Saudi Arabia (Figure 3b). However, the decrease in temperature near Arar could be attributed to other meteorological conditions as there was no high dust loading near the city. The wind pattern (Figure 4e) shows that a low-speed wind (about 3 m/s) was circulating Arar, which may have transported some dust to the region. Meanwhile, there were also no changes in the air temperature of the Najran site as the storm was far away from that region (Figure 3b).
During the 15 April 2021 dust storm, in Hafar Al Batin, the air temperatures on the day of the storm were less than the temperatures observed pre- and post-storm. In Dammam and Arar, the temperature decreased by about 5 °C after the storm, while it increased by about 10 °C in Arar on the day of the storm compared to that on 13 April 2021 (two days before the storm, see Table 3). The temperature decreased by about −8.8 °C over Riyadh during the storm compared to two days before the storm; meanwhile, no data are available for the temperature two days after the storm in Riyadh. Even in Najran, where the storm blew away from it, the temperature on the day of the storm was about 2 °C less than that on 13 April 2021 (two days before the storm). On the other hand, the temperature increased by 5 °C on 17 April 2021 (two days after the storm). This may be attributed to the low dust loading associated with the dust storm as observed from the relatively low AOD on 15 April 2021 compared to what was observed on 20 March 2017 and 23 April 2018 (Figure 3c). This temperature profile over Najran may also be attributed to low wind speeds (<3 m/s), which reduced the probability of carrying dust toward Najran (Figure 4h). Data are not available over Jeddah for the period of that storm.
3.5. Solar Irradiance Variability
The correlation between solar irradiance components (DHI, DNI, and GHI) and AOD over the cities of Jeddah (18–22 March 2017), Riyadh (18–22 March 2017 and 21–25 April 2018), and Najran (13–17 April 2021) is displayed in Figure 10.
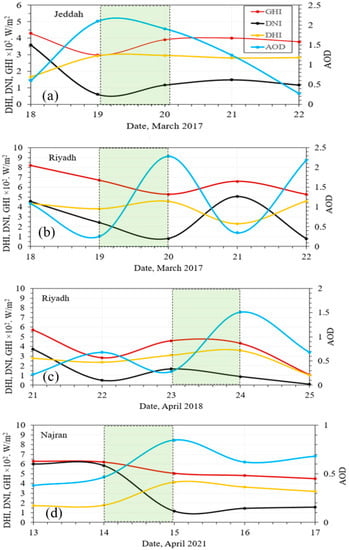
Figure 10.
Variability of DHI, DNI, GHI, and AOD for (a) Jeddah on 19–20 March 2017, (b) Riyadh on 19–20 March 2017, (c) Riyadh on 23–24 March 2018, and (d) Najran on 14–15 April 2021.
Figure 10a shows that the AOD values increased over Jeddah starting on 19 March 2017, one day before the 20 March 2017 dust event. A maximum AOD (about 2) was recorded around noon on 19 March. This early AOD increase over Jeddah is attributed to the passage of the dust storm from the Sahara Desert towards Saudi Arabia, thereby affecting its west coast first.
It can be observed that DNI and GHI are negatively correlated with AOD with correlation coefficients of −0.5467 and −0.5954, respectively (Table 4). Meanwhile, DHI is positively correlated with AOD with a correlation coefficient of 0.52354.
Table 4.
Correlation coefficients between either DHI, DNI, or GHI with AOD in (a) Jeddah on 19–20 March 2017, (b) Riyadh on 19–20 March 2017, (c) Riyadh on 23–24 March 2018, and (d) Najran on 14–15 April 2021.
Figure 10b shows that the AOD values increased over Riyadh starting on 20 March 2017, on the day of the dust storm. A maximum AOD (about 2.3) was recorded early on 20 March. This could indicate that the dust storm was developed and conveyed the dust particles from the west coast towards central Saudi Arabia within two days (19 and 20 March), a distance of about 948 km between Jeddah and Riyadh.
Similar to Jeddah, it is found that DNI and GHI are negatively correlated with AOD, while DHI is positively correlated, with correlation coefficients of −0.7495, −0.6326, and 0.7520, respectively (Table 4).
Figure 10c shows that the AOD values increased over Riyadh starting on 24 April 2018, on the day of the dust storm. A maximum AOD (about 1.5) was recorded around 10:00 am on 24 April. The AOD gradually decreased to about 0.7 on 25 April.
It is also found that DNI and GHI are negatively correlated with AOD, while DHI is positively correlated, with correlation coefficients of −0.9016, −0.2049, and 0.27226, respectively (Table 4). It can be observed that there was a weak correlation between GHI and AOD over Riyadh during this dust storm (Table 4).
Figure 10d shows that the AOD values increased over Najran starting on 15 April 2021, on the day of the dust storm. A maximum AOD (about 0.9) was recorded around 10:00 am on 15 April. The AOD values gradually decreased to about 0.7 on 17 April.
The DNI and GHI are negatively correlated with AOD, while DHI is positively correlated, with correlation coefficients of −0.9016, −0.7888, and 0.9390, respectively (Table 4).
It is interesting to note that not all solar irradiation components are negatively correlated with dust loading, where the above results show that DHI increases with increasing AOD, thereby with increasing of dust loading in the atmosphere.
4. Conclusions
For its location on a sun belt, Saudi Arabia is a potential solar energy hub in the Middle East [55], which can lead the country to become one of the largest solar energy producers. Dust and wind dynamics (direction and speed) play a significant role in the loading of dust particles in the atmosphere, as indicated by the high AOD values observed over the dust storms’ regions. For instance, the 20 March 2017 dust storm mostly affected the northern region (latitude 20–25° N) and did not affect the southern region (latitude 17–<20 N) of Saudi Arabia. This is because the dust storm was initiated in the Sahara Desert in North Africa and moved east towards northern Saudi Arabia. It is found that cities such as Arar and Jeddah located in the NW region of Saudi Arabia are mostly affected by storms that originate in the Sahara Desert. Dust storms blowing from Iraq and Syria are found to mostly affect the NE region of Saudi Arabia and some central regions, while they have a lesser effect on the NW and the SW regions. For instance, the 23 April 2018 dust storm mostly affected the cities of Dammam, Riyadh in the NE, and the central part of the country. Dust storms originating from Yemen mostly affect the SW regions of Saudi Arabia and their effect can be extended to the central region of the country. For instance, the 15 April 2021 storm mostly affected the city of Najran in the SW region of Saudi Arabia.
It can be observed that Saudi Arabia is vulnerable to dust storms from its NW, NE, and SW borders, and most of the time dust plumes are transported to the central part of the country. This dust loading directly affects air temperature and the solar energy reaching the ground. It is then important to avoid dust loading regions while developing new solar panel projects in Saudi Arabia. Based on the possible dust sources and path, three regions have been identified as the least affected by atmospheric dust loading during major dust storms regardless of which direction the dust blows from. The three locations are Al Badie Al Shamali (21.99° N, 46.58° E), Howtat Bani Tammim (23.52° N, 46.84° E), and an unnamed location (21.89° N, 43.06° E) (Figure 1). These three locations have been chosen as they are located south of Riyadh and the central region, while they are away from the dust plume path that may blow from the SW borders of Saudi Arabia. Additionally, in previous studies [19,56,57], these three locations have been identified to receive the optimum solar irradiance at solar panel inclination angles of (20–25°) towards the S.
Dust storms are found to reduce the air temperature in the dust loading areas. Meanwhile, this study also found that dust loading only reduces specific components of solar irradiance (DNI and GHI), while it increases the DHI component of solar irradiance. This means that dust plays a significant role in increasing solar irradiance by scattering solar radiation; however, it is very difficult to harvest solar energy scattered from dust due to the dust’s dynamical and unsustainable nature.
This work focused on the effect of dust storms on solar irradiance in Saudi Arabia: however, it can be potentially generalized to other locations with similar landscape, environmental, and meteorological conditions, especially the Gulf Cooperation Council countries (United Arab Emirates, Kuwait, Qatar, Bahrain, and Oman). The results of this research include data from three major dust events only, but a long-term study with more dust events and aerosol dynamic scenarios will help to better understand atmospheric dust loading effects on solar irradiance in Saudi Arabia.
With its 2030 vision [58], the government of Saudi Arabia is aiming to develop new cities, expand non-petrochemical industries, and reach net-zero carbon emissions during the next three decades through an ambitious plan to accelerate the transition from fossil fuels to renewable sources. Understanding dust emission sources and paths will help policy makers, stakeholders, and economic sectors to make decisions on where to construct PV panels in new cities in order to maintain sustainable green energy resources.
Author Contributions
Conceptualization, A.F.; methodology, A.F.; validation, A.L. and A.F.; formal analysis, A.L. and A.F.; and data curation, A.L. and A.F.; writing—original draft preparation, A.L. and A.F.; review and editing, A.L. and A.F.; project administration, A.L. and A.F.; funding acquisition, A.L. and A.F. All authors have read and agreed to the published version of the manuscript.
Funding
Author (A.F.) would like to acknowledge the support provided by the Centre of Research Excellence in Renewable Energy through the Deanship of Research Oversight and Coordination (DROC) at the King Fahd University of Petroleum and Minerals (KFUPM) for funding this work through project No. INRE2205.
Data Availability Statement
The solar radiation data for the sites in Saudi Arabia used in this work have been downloaded from the RRMM/RRA program’s website (available at https://rratlas.kacare.gov.sa, accessed on 15 September 2022. MODIS data are publically accessible through https://modis.gsfc.nasa.gov/data/ (accessed on 25 January 2023).
Acknowledgments
Author A.L. thanks the Department of Meteorology, Faculty of Meteorology, Environment and Arid Land Agriculture, King Abdulaziz University, Jeddah for their utmost support. The authors would like to thank the anonymous reviewers for their comments/suggestions that have helped us improve the manuscript’s current version.
Conflicts of Interest
The authors declare no conflict of interest.
References
- Almazroui, M.; Hasanean, H.M.; Al-Khalaf, A.K.; Abdel Basset, H. Detecting climate change signals in Saudi Arabia using mean annual surface air temperatures. Theor. Appl. Climatol. 2013, 113, 585–598. [Google Scholar] [CrossRef]
- Beck, H.E.; Zimmermann, N.E.; McVicar, T.R.; Vergopolan, N.; Berg, A.; Wood, E.F. Present and future Köppen-Geiger climate classification maps at 1-km resolution. Sci. Data 2018, 5, 180214. [Google Scholar] [CrossRef] [PubMed]
- Patlakas, P.; Stathopoulos, C.; Flocas, H.; Kalogeri, C.; Kallos, G. Regional climatic features of the Arabian Peninsula. Atmosphere 2019, 10, 220. [Google Scholar] [CrossRef]
- Al-Mutairi, M.; Abdel Basset, H.; Morsy, M.; Abdeldym, A. On the effect of red sea and topography on rainfall over Saudi Arabia: Case study. Atmosphere 2019, 10, 669. [Google Scholar] [CrossRef]
- Patlakas, P.; Stathopoulos, C.; Flocas, H.; Bartsotas, N.S.; Kallos, G. Precipitation climatology for the arid region of the Arabian Peninsula—Variability, trends and extremes. Climate 2021, 9, 103. [Google Scholar] [CrossRef]
- Almazroui, M. Changes in temperature trends and extremes over Saudi Arabia for the period 1978–2019. Adv. Meteorol. 2020, 2020, e8828421. [Google Scholar] [CrossRef]
- Syed, F.S.; Adnan, S.; Zamreeq, A.; Ghulam, A. Identification of droughts over Saudi Arabia and global teleconnections. Nat. Hazards 2022, 112, 2717–2737. [Google Scholar] [CrossRef]
- Farahat, A. Air pollution in the Arabian Peninsula (Saudi Arabia, the United Arab Emirates, Kuwait, Qatar, Bahrain, and Oman): Causes, effects, and aerosol categorization. Arab. J. Geosci. 2016, 9, 196. [Google Scholar] [CrossRef]
- Farahat, A.; El-Askary, H.; Al-Shaibani, A. Study of Aerosols’ characteristics and dynamics over the Kingdom of Saudi Arabia using a multisensor approach combined with ground observations. Adv. Meteorol. 2015, 2015, e247531. [Google Scholar] [CrossRef]
- Al Otaibi, M.; Farahat, A.; Tawabini, B.; Omar, M.H.; Ramadan, E.; Abuelgasim, A.; P. Singh, R. Long-term aerosol trends and variability over central Saudi Arabia using optical characteristics from solar village aeronet measurements. Atmosphere 2019, 10, 752. [Google Scholar] [CrossRef]
- Labban, A. Dust storms over Saudi Arabia: Temporal and spatial characteristics, climatology and synoptic case studies. Environ. Sci. 2016. [Google Scholar] [CrossRef]
- Shalaby, A.; Rappenglueck, B.; Eltahir, E.A.B. The Climatology of Dust Aerosol over the Arabian Peninsula. Atmos. Chem. Phys. Discuss. 2015, 15, 1523–1571. [Google Scholar] [CrossRef]
- Gandham, H.; Dasari, H.P.; Langodan, S.; Karumuri, R.K.; Hoteit, I. Major changes in extreme dust events dynamics over the Arabian Peninsula during 2003–2017 driven by atmospheric conditions. J. Geophys. Res. Atmos. 2020, 125, e2020JD032931. [Google Scholar] [CrossRef]
- Almasoud, A.H.; Gandayh, H.M. Future of solar energy in Saudi Arabia. J. King Saud Univ. Eng. Sci. 2015, 27, 153–157. [Google Scholar] [CrossRef]
- Khan, M.M.A.; Asif, M.; Stach, E. Rooftop PV potential in the residential sector of the Kingdom of Saudi Arabia. Buildings 2017, 7, 46. [Google Scholar] [CrossRef]
- Rahman, M.M.; Hasanuzzaman, M.; Rahim, N.A. Effects of various parameters on PV-module power and efficiency. Energy Convers. Manag. 2015, 103, 348–358. [Google Scholar] [CrossRef]
- Saudi Arabia Population (2022)-Worldometer. Available online: https://www.worldometers.info/world-population/saudi-arabia-population/ (accessed on 2 December 2022).
- Saudi Arabia Launches 5 Renewable Projects to Produce 3300 MW Energy | Arab News. Available online: https://www.arabnews.com/node/2169081/business-economy (accessed on 1 February 2023).
- Farahat, A.; Kambezidis, H.D.; Almazroui, M.; Ramadan, E. Solar potential in Saudi Arabia for southward-inclined flat-plate surfaces. Appl. Sci. 2021, 11, 4101. [Google Scholar] [CrossRef]
- Farahat, A.; Kambezidis, H.D.; Almazroui, M.; Ramadan, E. Solar energy potential on surfaces with various inclination modes in Saudi Arabia: Performance of an isotropic and an anisotropic model. Appl. Sci. 2022, 12, 5356. [Google Scholar] [CrossRef]
- Sayigh, A.A.M. Photovoltaic powered villages in Saudi Arabia. In Proceedings of the IEE Colloquium on Energy for Isolated Communities, Reading, UK, 18 May 1988; pp. 2/1–2/4. [Google Scholar]
- Parrott, B.; Carrasco Zanini, P.; Shehri, A.; Kotsovos, K.; Gereige, I. Automated, robotic dry-cleaning of solar panels in Thuwal, Saudi Arabia using a silicone rubber brush. Sol. Energy 2018, 171, 526–533. [Google Scholar] [CrossRef]
- Saudi Arabia to Build Giant Solar Power Plant-Al-Monitor: Independent, Trusted Coverage of the Middle East. Available online: https://www.al-monitor.com/originals/2022/11/saudi-arabia-build-giant-solar-power-plant (accessed on 1 February 2023).
- Life, B.S. World Largest Solar Parking Project in the Kingdom of Saudi Arabia, at HQ of Saudi Arabian Oil Company (Saudi Aramco). Available online: https://www.prnewswire.com/news-releases/world-largest-solar-parking-project-in-the-kingdom-of-saudi-arabia-at-hq-of-saudi-arabian-oil-company-saudi-aramco-119071674.html (accessed on 26 January 2023).
- Zaihidee, F.M.; Mekhilef, S.; Seyedmahmoudian, M.; Horan, B. Dust as an unalterable deteriorative factor affecting PV panel’s efficiency: Why and how. Renew. Sustain. Energy Rev. 2016, 65, 1267–1278. [Google Scholar] [CrossRef]
- Mani, M.; Pillai, R. Impact of dust on solar photovoltaic (PV) performance: Research status, challenges and recommendations. Renew. Sustain. Energy Rev. 2010, 14, 3124–3131. [Google Scholar] [CrossRef]
- Shenouda, R.; Abd-Elhady, M.S.; Kandil, H.A. A Review of dust accumulation on PV panels in the MENA and the far east regions. J. Eng. Appl. Sci. 2022, 69, 8. [Google Scholar] [CrossRef]
- A Decision Aiding Framework for Investing in Cleaning Systems for Solar Photovoltaic (PV) Power Plants in Arid Regions-Sécheresse Info. Available online: http://www.secheresse.info/spip.php?article26208 (accessed on 25 January 2023).
- AlYahya, S.; Irfan, M.A. Analysis from the new solar radiation atlas for Saudi Arabia. Sol. Energy 2016, 130, 116–127. [Google Scholar] [CrossRef]
- Rehman, S. Solar Radiation over Saudi Arabia and comparisons with empirical models. Energy 1998, 23, 1077–1082. [Google Scholar] [CrossRef]
- Zell, E.; Gasim, S.; Wilcox, S.; Katamoura, S.; Stoffel, T.; Shibli, H.; Engel-Cox, J.; Subie, M.A. Assessment of solar radiation resources in Saudi Arabia. Sol. Energy 2015, 119, 422–438. [Google Scholar] [CrossRef]
- Zuhairy, A.A.; Sayigh, A.A.M. Simulation and modeling of solar radiation in Saudi Arabia. Renew. Energy 1995, 6, 107–118. [Google Scholar] [CrossRef]
- El-Sebaii, A.A.; Al-Hazmi, F.S.; Al-Ghamdi, A.A.; Yaghmour, S.J. Global, direct and diffuse solar radiation on horizontal and tilted surfaces in Jeddah, Saudi Arabia. Appl. Energy 2010, 87, 568–576. [Google Scholar] [CrossRef]
- Maghrabi, A.H. Parameterization of a simple model to estimate monthly global solar radiation based on meteorological variables, and evaluation of existing solar radiation models for Tabouk, Saudi Arabia. Energy Convers. Manag. 2009, 50, 2754–2760. [Google Scholar] [CrossRef]
- Bahel, V.; Srinivasan, R.; Bakhsh, H. Solar radiation for Dhahran, Saudi Arabia. Energy 1986, 11, 985–989. [Google Scholar] [CrossRef]
- Articles. Available online: https://earthobservatory.nasa.gov/features (accessed on 26 January 2023).
- North African Sandstorm ‘Madar’ Disrupts Life in Saudi Arabia. Available online: https://www.arabnews.com/node/1070706/saudi-arabia (accessed on 1 February 2023).
- Francis, D.; Fonseca, R.; Nelli, N.; Teixido, O.; Mohamed, R.; Perry, R. Increased shamal winds and dust activity over the Arabian Peninsula during the COVID-19 lockdown period in 2020. Aeolian Res. 2022, 55, 100786. [Google Scholar] [CrossRef]
- Chaichitehrani, N.; Allahdadi, M.N. Overview of wind climatology for the gulf of Oman and the Northern Arabian Sea. Am. J. Fluid Dyn. 2018, 8, 1–9. [Google Scholar]
- Ghalib, W.A.M.; Mansoor, A.M.; Ponnappa, S.C. Environmental factors that influence the geography of yemen leading to dust and sand storms—A case Study. J. Environ. Geogr. 2021, 14, 24–37. [Google Scholar] [CrossRef]
- Mapping the Global Dust Storm Records: Review of Dust Data Sources in Supporting Modeling/Climate Study | SpringerLink. Available online: https://link.springer.com/article/10.1007/s40726-015-0008-y (accessed on 9 February 2023).
- Albugami, S.; Palmer, S.; Cinnamon, J.; Meersmans, J. Spatial and temporal variations in the incidence of dust storms in Saudi Arabia revealed from In Situ observations. Geosciences 2019, 9, 162. [Google Scholar] [CrossRef]
- Al-Housani, M.; Bicer, Y.; Koç, M. Experimental investigations on PV cleaning of large-scale solar power plants in desert climates: Comparison of cleaning techniques for drone retrofitting. Energy Convers. Manag. 2019, 185, 800–815. [Google Scholar] [CrossRef]
- Kazem, H.A.; Chaichan, M.T. The Effect of dust accumulation and cleaning methods on PV panels’ outcomes based on an experimental study of six locations in northern Oman. Sol. Energy 2019, 187, 30–38. [Google Scholar] [CrossRef]
- Shi, W.; Wang, M. Sea ice properties in the Bohai Sea measured by MODIS-Aqua: 1. Satellite algorithm development. J. Mar. Syst. 2012, 95, 32–40. [Google Scholar] [CrossRef]
- Mukherjee, R.; Liu, D. Downscaling MODIS spectral bands using deep learning. GISci. Remote Sens. 2021, 58, 1300–1315. [Google Scholar] [CrossRef]
- Stibig, H.-J.; Bucha, T. Feasibility Study on the Use of Medium Resolution Satellite Data for the Detection of Forest Cover Change Caused by Clear Cutting of Coniferous Forests in the Northwest of Russia: Report; EUR 21579 EN, 2005. JRC31125. Available online: https://publications.jrc.ec.europa.eu/repository/handle/JRC31125 (accessed on 25 January 2023).
- Kaufman, Y.J.; Tanré, D.; Remer, L.A.; Vermote, E.F.; Chu, A.; Holben, B.N. Operational remote sensing of tropospheric aerosol over land from EOS moderate resolution imaging spectroradiometer. J. Geophys. Res. Atmos. 1997, 102, 17051–17067. [Google Scholar] [CrossRef]
- Earth Science Data Systems, N. MODIS/Terra Collection 6 Aerosol, Cloud, and Other Atmospheric Level-2 and Level-3 Products Released. Available online: https://www.earthdata.nasa.gov/news/modis-terra-collection-6-aerosol-cloud-and-other-atmospheric-level-2-and-level-3-products (accessed on 2 February 2023).
- Giovanni. Available online: https://giovanni.gsfc.nasa.gov/giovanni/ (accessed on 2 February 2023).
- Projects | King Abdullah City for Atomic and Renewable Energy. Available online: https://www.kacare.gov.sa/en/projects/Pages/atlas.aspx (accessed on 3 February 2023).
- Aerosol Optical Depth. Available online: https://earthobservatory.nasa.gov/global-maps/MODAL2_M_AER_OD (accessed on 3 February 2023).
- Earth Science Data Systems, N. Angstrom Exponent. Available online: https://www.earthdata.nasa.gov/topics/atmosphere/aerosols/aerosol-optical-depth-thickness/angstrom-exponent (accessed on 3 February 2023).
- HYSPLIT. Air Resources Laboratory. Available online: https://www.ready.noaa.gov/HYSPLIT.php (accessed on 25 January 2023).
- Pazheri, F.; Malik, N.H.; Al-Arainy, A.; Ottukulotk, S.; Othman, F.; Al-Ammar, E.; Ahamed, I. Use of renewable energy sources in Saudi Arabia through smart grid. J. Energy Power Eng. 2012, 6, 1065–1070. [Google Scholar]
- Kambezidis, H.D.; Farahat, A.; Almazroui, M.; Ramadan, E. Solar potential in Saudi Arabia for flat-plate surfaces of varying tilt tracking the sun. Appl. Sci. 2021, 11, 11564. [Google Scholar] [CrossRef]
- Alwadei, S.; Farahat, A.; Ahmed, M.; Kambezidis, H.D. Prediction of solar irradiance over the Arabian Peninsula: Satellite data, radiative transfer model, and machine learning integration approach. Appl. Sci. 2022, 12, 717. [Google Scholar] [CrossRef]
- A Sustainable Saudi Vision—Vision 2030. Available online: https://www.vision2030.gov.sa/v2030/a-sustainable-saudi-vision/ (accessed on 3 February 2023).
Disclaimer/Publisher’s Note: The statements, opinions and data contained in all publications are solely those of the individual author(s) and contributor(s) and not of MDPI and/or the editor(s). MDPI and/or the editor(s) disclaim responsibility for any injury to people or property resulting from any ideas, methods, instructions or products referred to in the content. |
© 2023 by the authors. Licensee MDPI, Basel, Switzerland. This article is an open access article distributed under the terms and conditions of the Creative Commons Attribution (CC BY) license (https://creativecommons.org/licenses/by/4.0/).