Abstract
Atmospheric synoptic weather patterns have a significant impact on the concentration, dispersion, and transportation of air pollution in various regions and times around the world. To assess the impact of atmospheric synoptic weather patterns and long-range air mass transportation, we used weather classification techniques from the BP training model and the HYSPLIT model. Our research uncovered four weather conditions linked to PM10 concentration categories ranging from normal to extreme. Weather conditions 3 and 4 are the most significant conditions supporting the occurrence of extreme concentration events that are heavily influenced by anti-cyclones. Despite weather conditions influencing high concentrations, 60% of long-distance air mass transport to Secunda from Mpumalanga province increased to extreme PM10 concentrations. Furthermore, long-term weather shifts have been observed to positively impact reducing the concentration of PM10 extreme events.
1. Introduction
Atmospheric synoptic weather parameters play a significant role in determining the transportation, dispersion, and concentration of air pollutants in different geographical areas [1]. Various parameters play different roles; however, wind direction and speed, turbulence, and stability have the greatest influence on pollutant dispersion in the atmosphere [1]. In the presence of calm and stable weather conditions, surface concentrations rise due to weak turbulence dispersing pollutants both vertically and horizontally. In addition, air pollutants disperse rapidly in highly turbulent winds, reducing pollutant concentrations [2,3]. Since the 1900s, scientists have been studying the effects of atmospheric weather changes on air pollution. Different studies repeatedly reported similar findings, that changing atmospheric weather conditions have a significant effect on seasonal movements and the concentration of air pollution in different regions, particularly in areas sensitive to air pollution [4]. According to the majority of studies, Asia and Africa are among the countries most affected by high levels of particulate matter (PM) and surface ozone (O3) [5]. Despite geographical differences, air pollution concentrations are affected by weather circulation; for example, in India, the country is heavily affected by O3 concentrations in urban areas during the summer season, while the air is affected by PM2.5 and PM10 during the winter season [5]. On other hand, in China, dust storms occur in cities located near the desert regions as a result of increased wind intensity, particularly during the dry season [6]. In addition, according to [7], persistent mesoscale convection and an active Red Sea trough situation both contribute to and initiate dust events and increase PM10 high-concentration events in Middle Eastern urban cities. In terms of the impact of seasonal weather changes on air pollution, since weather varies by geographical location, it is critical to assess the influence of synoptic weather system meteorology to understand how local weather influences extreme air pollution events, particularly in the world’s major cities [8,9].
Sub-Saharan Africa (SSA) continues to have high levels of air pollution in comparison to the rest of the world [10]. Urbanization, industrialization, and population growth have all been linked to a worsening trend in air quality in SSA countries such as South Africa [11]. South Africa’s heavy reliance on coal-fired power generation, heavy industries, and mining activities contributes significantly to increasing air pollution [12]. Several air quality management policies and strategies have been implemented in South Africa to address deteriorating air quality. These include designating air pollution-prone areas as priority areas for the effective management of scarce air quality management resources, identifying and controlling priority pollutants, and enacting legislation to reduce industrial emissions [11,12,13].
Several studies have been carried out to investigate the effect of weather on air quality in South African cities. Research shows that synoptic weather changes influence extreme weather events as well as inter-annual and decadal climate variability in South Africa [14]. This means that, despite experiencing relatively dry and warm conditions at times, the country occasionally experiences years that are unusually wet and cool in comparison to the long-term average [14,15]. This type of variability is a natural part of the Earth’s climate dynamics, and it is caused in part by oscillations and complex configurations of global and regional climate systems working together to produce weather [15]. Based on weather changes in South Africa, it is critical to investigate pollution trends and how they are affected by these changes, particularly in the most vulnerable cities such as Secunda. Secunda, in the Highveld priority area, has the highest concentration of particulate matter in South Africa [16]. The Highveld priority area is one of the world’s top five air pollution hotspots, according to a NASA report of 2018, while Secunda has been reported to have the highest concentrations of PM10, SO2, and NO2 in more than 70 countries, including Norway and Portugal [17].
Various studies agree about the intensity and contribution of Secunda concentration in South Africa. For example, [18] observed that the highest diurnal concentration level of hourly averaged ambient PM2.5 was recorded in Secunda city, and suggested that Secunda city has the highest concentration of PM compared to other areas in Mpumalanga. Furthermore, [19] suggests that Secunda City does have the highest concentration of PM, and it has long contributed to the country’s extreme PM concentration for a very long time. Despite its significant contribution to global air quality, little research has been conducted to investigate the influence of local and regional weather circulations in Secunda’s extreme PM10 concentration. For the first time, this study examines the effect of atmospheric synoptic weather patterns and long-range transportation of air mass on the extreme PM10 concentration events over a long period of time (2009–2022). The aims of our study are: (a) to analyze the spatial and temporal distribution pattern of ground PM10 concentration in Secunda from 2009 to 2022; (b) to evaluate the proximity patterns linked to the occurrence of extreme concentration; (c) to classify meteorological conditions of various PM10 concentration levels using the BP neural network; (d) to verify the classification results, and (e) to evaluate the contribution of long-range air mass transportation to the occurrence of extreme concentration events.
2. Materials and Methods
2.1. Site Description
Figure 1 shows the location of Secunda city in the Mpumalanga province of South Africa. It is roughly 80 miles (130 km) east of Johannesburg in an area with abundant coal deposits and appropriate water supplies, and is home to South Africa’s second largest oil-from-coal production plants. The city has a population of around 40,198 residents and is predicted to grow to 205,005 by 2050. Secunda has a total area of 174.71 km2 and a population density of 230 people per square kilometer [20].
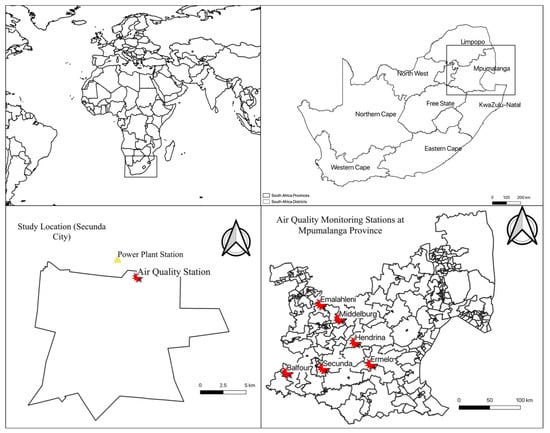
Figure 1.
The location of Secunda in Mpumalanga province of South Africa. The red star shows the location of the air quality monitoring stations, the yellow triangle shows the coal-fired power plant, and the black-dot shows the location of the coal mines.
2.1.1. Data Collection and Analysis
The atmospheric meteorological weather data were extracted from ERA5 (ECMWF- Re-Analysis) datasets [21,22], and the air quality and surface weather data were obtained from the South Africa air quality information service (SAAQIS) [23]. Th Open air R package [24], and the Grid Analysis and Display System (GrADS) were used for statistical analysis data visualization [25]. Before the weather classification, weather data were calculated and averaged based on seasonal trends to establish the overall synoptic weather patterns for each season, and after that the application of the BP neural network model was applied to classify weather conditions favorable for extreme concentration events.
2.1.2. Backpropagation (BP) Neural Network
The backpropagation (BP) neural network algorithm, which is a multi-layer feedforward network trained using the error backpropagation algorithm, is one of the most widely used neural network models. Its learning rule is to use the gradient descent method, which uses backpropagation to regulate the network’s weight and threshold values in order to achieve the minimum error sum of squares [26,27].
The sample data for the BP training model were drawn from the main PM10 pollution categories, which were determined based on the hourly, daily, and monthly, ground PM10 distributions in the study area. Monthly and daily mean values, including PM10 extreme concentrations, were estimated for a 13-year period (2009–2022) in Secunda, to analyze spatial distribution characteristics. The meteorological parameters considered in this study include average relative humidity (RH), average wind speed (w/s), average zonal wind component (U), average meridional wind vector (V), average sea level pressure (SLP), average temperature (Tm), and average planetary boundary layer (PBL). The physical parameters primarily affecting extreme pollution were obtained as input parameters for the BP training model by evaluating the relationship between ground PM10 concentrations and meteorological parameters using the correlation coefficient (CC), which was calculated as follow [28]:
when n is the sample size, x is the PM10 concentration, y is the meteorological parameter, and and are the averages of x and y.
2.1.3. Classification Method for the Meteorological Condition of PM10 Pollution Levels
Figure 2 depicts how the method used to classify weather conditions influences the occurrence of extreme concentrations. The overall method used consisted of three major aspects: (1) the correlation between meteorological conditions and PM10 concentration categories, (2) classifier training using the BP neural network, and (3) classification using the trained BP classifier [27,28]. The concentration was divided into four categories based on the daily average concentration according to the South African air quality standards (0–50: normal air quality; 51–100: moderate air quality; 101–200: extreme air quality; >201: dangerous air quality). As a result, the meteorological conditions were classified into four different levels related to the concentration category.
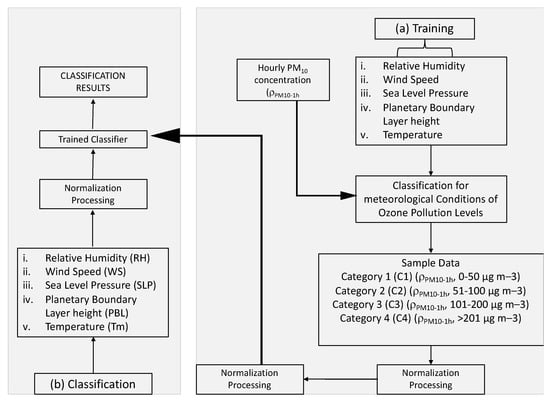
Figure 2.
Complete flowchart of the backpropagation (BP) neural network-based classification method for meteorological conditions affecting PM10 pollution categories.
2.1.4. Relationship between Meteorology Patterns and Extreme Concentration of PM10
Table 1 shows the relationship between meteorological conditions and PM10 concentration categories. A daily PM10 concentration of 0–50μg/m−3 is classified as Category 1 (C1), and the associated meteorological conditions are regarded as unfavorable for the occurrence of extreme PM10 concentrations (WC1). A daily PM10 extreme concentration of 51–100μg/m−3 is classified as Category 2 (C2), and the associated meteorological conditions are regarded as moderately favorable to the occurrence of PM10 extreme concentrations (WC2). A daily PM10 concentration of 101–200g/m−3 is classified as category 3, and the associated meteorological conditions are thought to favor the occurrence of extreme PM10 concentrations (WC3). Finally, a daily concentration of more than 201g/m−3 is categorized to be very suitable for the occurrence of extreme concentrations (WC4).

Table 1.
The relationship classification between atmospheric meteorological variables and PM10 concentration.
2.1.5. Training
The Secunda city training model was developed after the sample data of BP training model input parameters, including weather variables, were grouped together according to the corresponding PM10 levels (shown in Table 1). Furthermore, in order to produce good training module results, we selected nearby cities within a 100-km radius of Secunda, developed the training module for each city, and compared the results with Secunda. The classification performance of a single model was compared to that of other individual models. The multi-model comparison aided in the development of a better understanding of regional PM10 concentrations and the synoptic weather impact. The input layer, hidden layer, and output layer of the BP neural network was used to train the classifiers. The BP neural network was trained using signal forward propagation and error backward propagation, with weight and threshold adjustments repeated until the learning and training times were met, or the output error was reduced to an acceptable level. The number of nodes in the input layer was determined by the number of input parameters (which in this study was six), and the number of nodes in the output layer was determined by the number of PM10 concentration categories (which is four in this study). The number of hidden layers and nodes was carefully chosen based on the training error and classification accuracy. The number of hidden layers and nodes was determined through comparative testing.
Using the No. 1 model as an example, comparison results revealed that one and two hidden layers had classification accuracies of 65.6% and 87.3%, respectively. As a result, increasing the number of hidden layers to two improved the training model’s performance. Furthermore, the training error decreased as the number of hidden layer nodes increased; however, when the number of hidden layer nodes became too large, the models modified. The number of nodes in the first layer was set between seven and nine to save computing resources while achieving optimal discriminability, and the number of nodes in the second layer was set between eight and ten. The mean square error was used as the BP neural network’s performance function. During the training process, each parameter was scaled to (0, 1) using minimum-maximum normalization. The hidden layer and output layer activation functions or transfer functions were logarithmic sigmoid transfer components and linear transfer functions, respectively. The BP neural network’s training function was gradient descent with momentum and adaptive learning rate backpropagation. The data from a PM10 concentration period from 2009 to 2022 were used for training and validation in this study. The obtained BP classifier gained the “knowledge” to answer the question about the influence of meteorological conditions on PM10 pollution after training.
2.1.6. Classification
When a new meteorological parameter is supplied to the trained BP classifier, classification results can be obtained. For the PM10 extreme concentration, the classification output would be 1, 2, 3, or 4, corresponding to non-supportive, moderate-supportive, very supportive, and extremely supportive, respectively. For example, when new meteorological data arrive and are fed into the trained BP classifier, if the output is 1, it indicates that the meteorological conditions are extremely unfavorable to the occurrence of extreme PM10 concentrations. The performance of the trained BP classifier was assessed both qualitatively and quantitatively by comparing it to observations. The classification accuracy (the percentage of correct samples in the total number of samples) was calculated to quantitatively validate the classification results. The classification result was correct when it matched the observation; otherwise, it was incorrect. When both the classification result and the observation are 1 the classification is correct.
2.1.7. Long-Range Transportation of Air Mass HYSPLIT Model
After finalizing the classification of meteorology weather in air quality, the HYSPLIT model was applied to evaluate the effect of long-range transportation on extreme concentration events in category 3 and category 4 (because these are the only categories with high extreme events). HYSPLIT is a comprehensive system for simulating simple air parcel trajectories as well as complex transport, dispersion, chemical transformation, and deposition scenarios [29]. HYSPLIT remains one of the most extensively used atmospheric transport and dispersion models [30]. Back trajectory analysis is a prominent approach to understanding the origin and connection of air masses to sources and receptors [30]. The HYSPLIT model employs the Lagrangian approach for advection calculations as trajectories from the initial locations and by adding random components as turbulent eddies for dispersion calculations as trajectories or air parcels move from their initial locations, as opposed to the Eulerian method, which employs a fixed three-dimensional grid as a reference to calculate air pollutant concentrations [31] Figure 3 shows the complete flow of the HYSPLIT model from settings, input to output data.
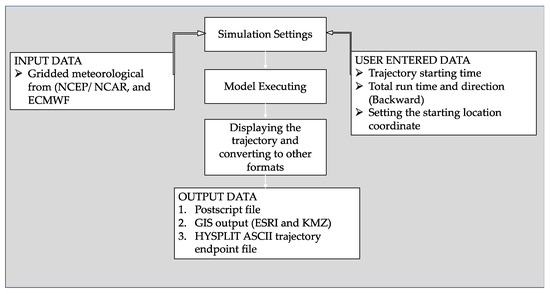
Figure 3.
Complete flowchart of the overall settings, data sets, and output of the HYSPLIT model used in this study.
3. Results
3.1. Characteristics of Surface PM10 Concentration
Figure 4 depicts the monthly surface concentration comparison between Secunda and other cities within a 100-km radius from 2009 to 2022. The difference between Secunda concentration and that observed in other cities was strong between 2009 and 2014, then decreased in 2015. Figure 5 depicts the hourly, daily, monthly, and seasonal PM10 concentrations in Secunda. According to Figure 5a hourly observation results, two concentration peaks were observed during the morning hours (05:00–09:00 a.m.) and the other peak was observed during the evening hours (17:00–22:00 p.m.). The concentration in these two observed peaks exceeds 500 μg/m−3. Surprisingly this concentration trending occurred throughout all observed years in all seasons. Figure 5c,d shows the monthly and seasonal concentration, with low concentration observed during December, January, and February months (during the summer season <50 μg/m−3), and high concentration in June, July, and August (in winter season >100 μg/m−3).
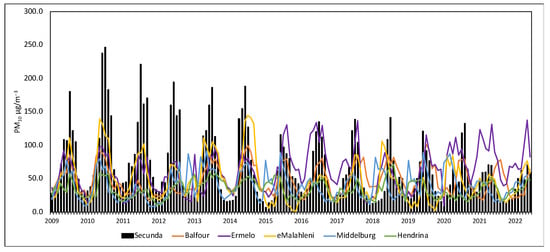
Figure 4.
Overall monthly concentration between Secunda and other cities located within a range of 100km in the Mpumalanga province.
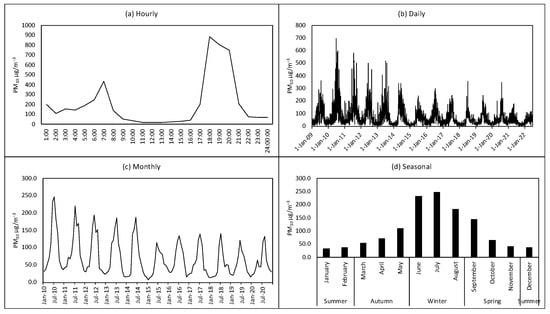
Figure 5.
Daily, hourly, monthly and seasonal concentration of PM10 observed at Secunda city.
3.1.1. Atmospheric Regional and Local Weather Circulation
Figure 6 depicts seasonal synoptic weather circulation during the summer, autumn, winter, and spring seasons observed from 2009 to 2022 using ERA5 ECMWF synoptic weather data and ground observation weather data. Figure 7 depicts seasonal local weather conditions observed at Secunda station. As a result, there are two atmospheric weather circulation systems in South Africa that control the region and the local weather conditions throughout the year. The first is controlled by tropical low-pressure, which normally occurs during the summer season (December, January, and February) and causes rainy, warm, and humid weather with a strong breeze with an average temperature of 25 °C. During the winter season, the other synoptic weather system occurs when the South Atlantic Ocean high pressure is closer to the western coast, the South Indian Ocean high pressure is closer to the east coast, and the tropic high pressure is in the center or eastern side of South Africa (June, July, and August). This weather system creates cold, dry, and calm weather conditions with an average temperate of <15 °C.
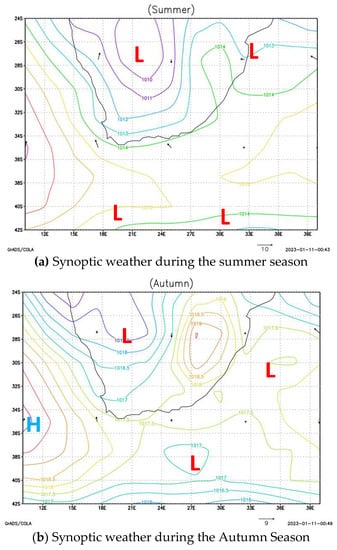
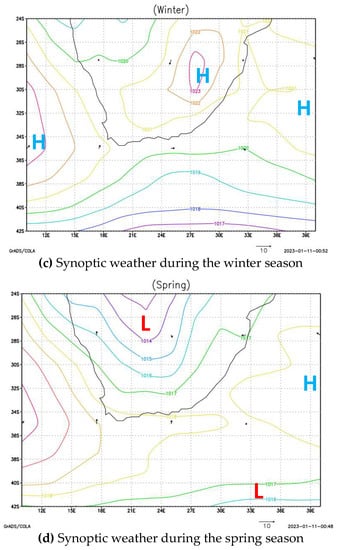
Figure 6.
Seasonal atmospheric synoptic weather circulation system in South Africa. H represent High pressure, and L represent Low pressure.
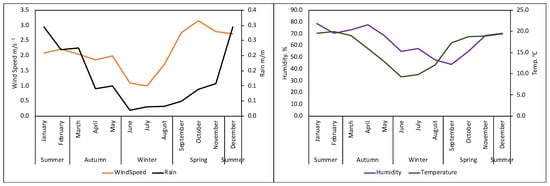
Figure 7.
Seasonal ground observation meteorological weather conditions observed at Secunda.
3.1.2. Classification of Meteorological Weather Conditions Influencing the PM10 Extreme Concentration Events
The BP classifier was trained using weather conditions and PM10 concentration categories in various cities based on topography and sample count. In addition, the Secunda model was compared to the unique BP training model that combines all six cities. Table 2 shows the sample numbers of four PM10 concentration categories during extreme hours measured every winter months June, July, and August from 15:00 to 22:00 p.m. in all selected cities, including Secunda, from 2009 to 2022. Table 3 displays the selected six cities (Nos. 1–6) as well as single classifiers for all cities (No. 7). When training the BP classifier, the sample numbers for the concentration categories should be approximately the same. The categories with a large sample size had to be screened and obtained at random. Spontaneous sampling was carried out in percentage to the distribution frequency of PM10 concentrations in each interval to ensure that the BP classifier training samples complied with the actual distribution pattern. The particular extraction method was as follows: first, the total sample number (n) and the sampling frequency at varying concentrations intervals (p, unit %) at each level were determined, and then the product of p and n was calculated to obtain the number of samples to be randomly sampled at different concentration intervals at each level.
Table 2.
The BP classifier training model for six cities in Mpumalanga province near Secunda, and the trained classifier’s classification accuracy for the test samples.
Table 3.
Classification accuracy for the trained six cities model and the trained single model.
The sample data were separated into training and test samples. The classification accuracy of the test samples was greater than 70% for all seven BP classifiers (shown in Table 2). Three of the BP classifiers had classification accuracy greater than 80%. The classification accuracy of the trained six individual BP classifiers was higher for category 1, as shown in Table 2, particularly in cities with lower concentrations, such as Middelburg and Hendrina. When compared to other cities, the classification accuracy of category 3 and category 4 was higher with the trained single model in Secunda, with higher PM10 concentrations of extreme events. The reason for this was that there were a large number of category 3 and 4 samples when training a single BP classifier for all six cities, which helped to improve the model’s performance. Table 4 shows that the classification accuracy of all six cities was greater than 60%, and that the classification accuracy of all cities was greater than 70% when using a single model. Because the trained single model outperformed the trained all-individual models in classification, the weather associated with each category from the single model was used to evaluate weather conditions.
Table 4.
Results for the atmospheric weather classification which influence the occurrence of different PM10 concentration categories. The meaning of all synoptic weather conditions are as follows: (a) Tropical low pressure (TRP-LP); (b) Tropical low pressure and South Atlantic Ocean high pressure (TRP-LP + SAT-HP); (c) South Atlantic ocean high-pressure and Tropical high pressure (SAT-HP + TRP-HP); (d) South Indian Ocean high pressure and Tropical high pressure (SIND-HP + TRP-HP).
3.1.3. Weather Conditions associated with PM10 Concentration Categories (WC)
The weather classification results produce four different weather conditions that are associated with each concentration category, as shown in Table 4 (see concentration categories in Table 1). Weather condition 1 (WC1) and weather category 2 (WC2) are classified as unfavorable to the occurrence of extreme concentration events. The WC1 and WC2 weather conditions are characterized as humid, warm, and strong wind, with an average temperature of 30 °C, a humidity of 80%, and a planetary boundary layer height of 1100 m. The synoptic weather condition associated with WC1 and WC2 (Figure 8) is tropical low pressure, which creates strong atmospheric conditions suitable for dispersing and transporting pollutants, thus helping to reduce the ground concentration. On the other hand, WC3 and WC4 are weather conditions that are associated with supporting the occurrence of extreme concentration events of PM10. WC3 and WC4 are characterized as cold, calm, and dry (with an average temperature of <10 °C, and a wind speed of 0.12 m/s−1). The weather condition in WC3 and WC4 is influenced by the atmospheric high pressure (anti-cyclones) located in both coastal areas of South Africa. Such weather conditions normally influence atmospheric stability, which forms a weak condition for pollutants dispersion and transportation. Figure 9 depicts the relationship between PM10 concentration and various weather conditions. The extreme concentration rises quickly in WC3 and WC4, indicating that the weather in these two categories has a significant impact on the occurrence of PM10 extreme concentration events in Secunda. The results show a significant negative correlation coefficient.
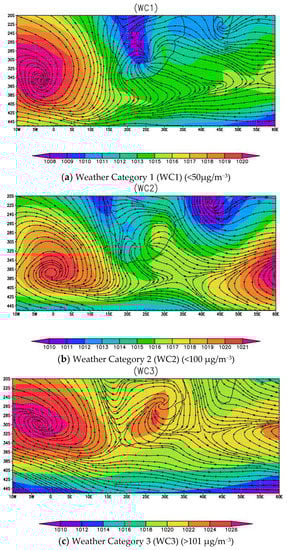
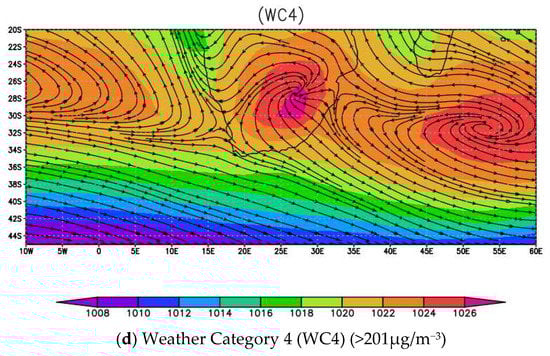
Figure 8.
The classified atmospheric synoptic weather system based on PM10 concentration categories.
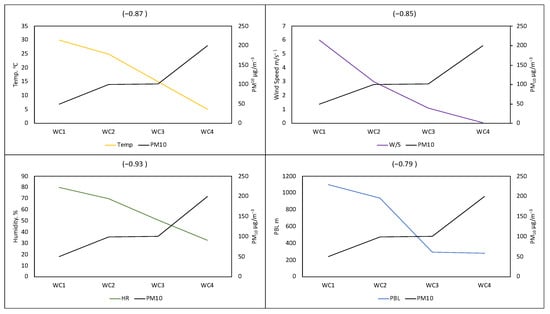
Figure 9.
The correlation coefficient between PM10 and the classified weather condition patterns.
3.1.4. Synoptic Weather Changes and their Impact on Ground Concentration
Our research evaluated the influence of atmospheric synoptic meteorology on long-term concentration trends (Shown in Figure 4 and Figure 5). We applied the weather difference calculation technique to assess the difference in the synoptic weather circulation system at two different periods and its role in the long-term trending of PM10 concentration. Our study used sea level pressure, planetary boundary layer, wind speed, and wind vector at 950 hPa extracted to ERA5 ECMWF. The meteorological data were separated into two periods, each consisting of three months of severe concentration: period (1) in June, July, and August between 2009 and 2015, and period (2) in June, July, and August between 2016 and 2022. Following separation, the second step was to compute the average of the synoptic weather patterns of overall extreme concentration months (June, July, and August) from 2009–2022. The final step was to calculate the average difference in synoptic weather conditions between periods (P1) and (P2) by subtracting them from the overall average for each period.
The weather in P1 is controlled by the tropical high-pressure, South Atlantic Ocean high-pressure, and South Indian Ocean high-pressure centered on the east, and west sides of South Africa, which creates stable, calm, dry, and cold weather conditions as shown in Figure 10. The weather condition in P2 is only dominated by the South Indian Ocean anti-cyclone, and the South Atlantic Ocean anti-cyclone. The difference in P1 and P2 concentrations is associated with the tropical high-pressure center on the east coast of South Africa, which influences the atmospheric stability conditions that normally occur when air masses move unnaturally in a vertical direction, reducing mixing and dispersing of pollutants, causing pollutants to concentrate close to the ground and affecting temporary but severe events of air pollution, especially on P1.
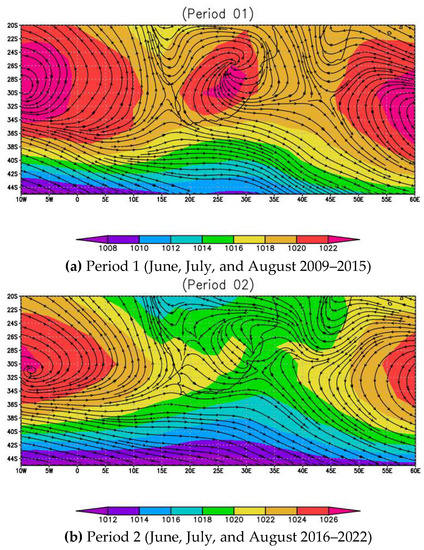
Figure 10.
The synoptic weather circulations difference of (a) period 1 and (b) period 2.
3.1.5. Long-Range Transportation of Air Mass
Figure 11 depicts the HYSPLIT backward trajectory evaluation for 24 h of air mass movement at 10, 500, and 1000 m above ground level (MAGL). The primary objective was to investigate the long-distance transportation of the air mass during extreme concentration events and how it contributes to the extreme concentration on the surface in Secunda. In the trajectory analysis, 1647 extreme events from categories 3 and 4 (>101 μg/m−3) were used (HYSPLIT model setting see Figure 3). Following the completion of the trajectory analysis, the origin of the air mass was traced manually. This procedure was used to determine the possible location of the transported air mass during the specified time period. The trajectories were divided into three categories: (a) air masses transported to Secunda from within the Mpumalanga province; (b) air masses transported to Secunda from neighboring provinces, and (c) air masses transported to Secunda from outside South Africa (see results in Table 5). Figure 11 depicts the air mass at a surface level (10 MAGL) transported from within South Africa, particularly from the eastern provinces, and the extreme concentration can be attributed to high domestic emissions from a variety of sources. Unlike the air mass movement at 10 MAGL, the air mass movement at 500 MAGL and 1000 MAGL had a large number of extreme events traced within South Africa, and only a few events traced from outside the country. Table 5 shows that neighboring provinces account for more than 60% of the air mass transported to Secunda at all levels. And Figure 11d depicts the contribution of air mass transportation to the extreme concentration based on trajectory direction using a scale of <3% (categorized as having a low contribution) to >3%. (categorized as having high contribution). According to Figure 11d, air masses transported from the northwest (NW), west (W), southwest (SW), and northeast (NE) contribute up to 5% of total extreme concentration events.
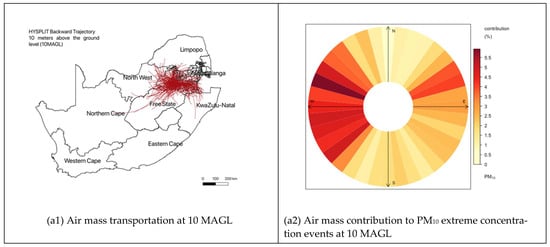
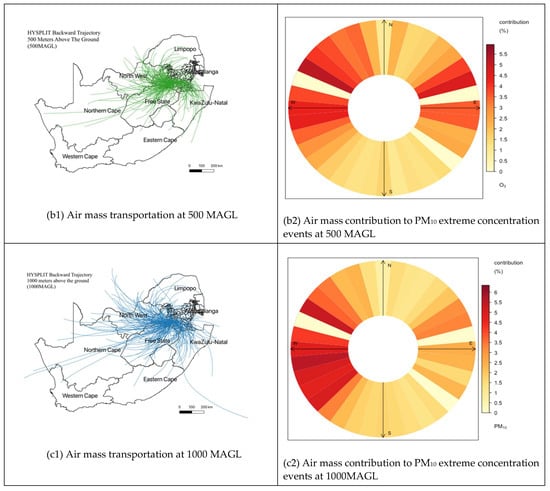
Figure 11.
Long-range transportation of air masses during extreme concentration events of C3 and C4 within 10MAGL, 500MAGL, and 1000MAGL, and the contribution of transportation to extreme concentration events.
Table 5.
The traced air mass transportation origin within a period of 24 h during the extreme PM10 concentration events.
4. Discussion
The primary goal of this research was to assess the impact of atmospheric weather patterns and long-distance transportation on PM10 surface extreme concentration events in Secunda City. The hourly concentration was extremely high in the morning and evening (>400 μg/m−3), while a low concentration was observed in the afternoons (<50 μg/m−3) (Figure 5a). Meanwhile, the monthly concentration showed the inter-seasonal concentration of PM10, with high concentrations exceeding the NAAQS standard during the winter season (June, July, and August) (>101 μg/m−3) and low concentrations observed during the summer season (December, January, and February) (50 μg/m−3). In order to understand the atmospheric weather impact, we applied the BP network training model’s weather classification technique to identify different weather conditions and how they affect the occurrence of severe PM10 concentrations. The classification of different weather conditions that affect different PM10 concentration categories is described in Table 1. The results show 2 weather conditions associated with PM10 extreme concentration (WC3–WC4). WC3 and WC4 are characterized as cold, dry, calm, and stable with an average temperature of 5 °C, average wind speed of 1.05 m/s−1, average relative humidity of 50% RH) weather conditions, and a planetary boundary layer height of 300 m, (see Table 4). WC3 and WC3 weather conditions are controlled by anticyclones (Southern Atlantic Ocean high pressure, Southern Indian Ocean high pressure, and subtropics high pressure) located in coastal areas of South Africa. Based on weather classification results (see Table 4) the anticyclone synoptic weather condition has a significant impact on surface weather conditions which influence the formation of extreme concentrations of PM10.
An anticyclone is a large mass of subsiding air from the upper atmosphere that causes a high-pressure area on the Earth’s surface [28], which typically occurs on South Africa’s west, east, and eastern coasts (see Figure 8). Because the air comes from the upper atmosphere, which is cooler and thus has a lower saturation vapor pressure, the amount of water vapor affiliated with it is limited on the descent, and the air warms at the dry adiabatic lapse rate, resulting in dry conditions [29]. Anticyclone pressure gradients are gentle, resulting in low winds or calms that cause poor surface air pollution transport. In the northern hemisphere, the wind blows gently radially outward and rotates clockwise [32]. Once established, anticyclones can provide several days, or even weeks, of settled weather, influencing long extreme concentration events for several days (the longest event in Secunda lasted for 20 days from 10 June 2010 to 31 June 2010).
Fewer studies have concentrated on meteorological factors that could influence local PM concentrations. Similar to our findings, higher air pollution has been linked to anticyclonic conditions in other studies, while lower air pollution has been linked to cyclonic conditions [27,28,29,30,31]. The skies are typically clear during this weather condition, with little precipitation and increased stability [28]. These elements impede dispersion and encourage the accumulation of air pollutants. Pollutant accumulation is favored during stagnation episodes, which are frequently associated with anticyclones [29]. Low-pressure cyclonic systems, on the other hand, have ascending air flows and are frequently accompanied by cloudy skies and precipitation [30]. Some studies have examined the relationship between meteorological factors and air pollution levels in select locations [31,32,33,34,35,36,37,38,39,40,41,42,43]. While some of the dependencies found in these studies pertain to the geography of the particular region studied, a number conclude that during the days with the full development of sea breeze cells, the air quality of is become poor in morning and evening hours due to lack of particle dispersion associated with stagnation episodes and/or warm advection aloft creating stable temperature inversions [28,29,30,31,33]. These authors also confirmed that anticyclonic conditions result in a very stable atmosphere with stagnation, and thus favor the accumulation of pollutants, especially in the cold period of the year [28,29,30,31,33].
Despite WC1 and WC2 having a low influence of extreme concentration in Secunda city (see Table 4), WC1 and WC2 are caused by the strong pressure gradients associated with subtropics cyclones which increase wind speed over a great escarpment. These strong winds lift large amounts of air pollutants from different point sources and transport them hundreds to thousands of kilometers away. However, in such weather conditions in northern Africa, the Middle East, and China where the world’s largest dust sources are located, strong winds can lift large amounts of dust from bare, dry soils into the atmosphere [44]. Once entrained into the atmosphere, dust is transported thousands of kilometers away from the point sources [44,45,46]. In addition, the weather condition in WC1 and WC2 has characteristics that influence O3 concentration, especially in an urban area. However, since our study was limited only to PM10 concentration, our results can be a good starting point for further analysis of O3 concentration in Secunda, since no study has yest been conducted to evaluate such an issue. Figure 11 shows the long-range transportation of air masses during extreme concentration events in C3 and C4 at 10, 500, and 1000 m above the ground (MAGL). Overall, more than 60% of the extreme events were transported to Secunda from nearby provinces at all heights, less than 25% were transported from outside the country, and less than 35% were transported from within the province. Figure 11d shows the contribution of the extreme concentration of each trajectory based on the direction of the trajectory. More than 5.5% of extreme events are contributed by the transported pollutants from NW, W, SW, and NE from Secunda. With these results, more evaluation is needed to evaluate the contribution of each source so that good air quality management can take place. As there have been few studies devoted to evaluating the contribution of atmospheric weather conditions on air pollution in Secunda, this study provides very important knowledge of one of the most significant factors that greatly influence the frequency of extreme PM10 concentration events in South Africa. The findings of this study might be useful for developing vital air quality control plans and strategies based on the atmospheric weather in the country’s most susceptible areas.
5. Conclusions
The main goal of this study was to evaluate the impact of atmospheric synoptic weather patterns and long-range transportation on extreme concentration events in Secunda. Based on the weather classification results of the BP training network model, extreme concentration events of PM10 are associated with anticyclone synoptic weather conditions WC3 and WC4. The anti-cyclone synoptic weather condition makes favorable weather condition that influences the increase of surface extreme concentration events of PM10. On the other hand, the long-range transportation airmass has a significant influence on extreme concentration events in Secunda. Based on the results, more than 60% of the airmass is transported to Secunda from within Mpumalanga province where a large number of coal-fired power plants, coal mines, and other heavy industries reside, contributing up to a 5% increase in concentration intensity. Despite WC1 and WC2 having the lowest concentration influence of extreme PM10 concentration, they represent favorable weather conditions for extreme O3 concentration and dust storms. Our study is limited only to PM10 but these results can be useful for further analysis of air pollutants in Secunda and other cities.
Author Contributions
Conceptualization, S.W.M., H.-C.L. and Y.-T.D.; Data Curation, S.W.M., L.-W.L. and M.-C.H.; Format Analysis, H.-C.L. and Y.-T.D.; Methodology, H.-C.L., Y.-T.D., S.W.M. and M.-C.H.; Project administration, S.W.M. and M.-C.H.; Resources, Y.-T.D. and H.-C.L.; Software, L.-W.L., S.W.M., H.-C.L. and M.-C.H.; Visualization, L.-W.L., S.W.M., H.-C.L.; Supervision; H.-C.L. and Y.-T.D.; Writing the original manual script, S.W.M., H.-C.L. and Y.-T.D.; and Writing—Review and Editing, S.W.M., H.-C.L. and Y.-T.D. All authors have read and agreed to the published version of the manuscript.
Funding
This research received no external funding.
Institutional Review Board Statement
Not applicable.
Informed Consent Statement
Not applicable.
Data Availability Statement
The data presented in this study are available on request from the corresponding author and the first author.
Acknowledgments
The authors would like to express their gratitude to the entire team at the Environmental Research and Information Center (Eric) for their analytical assistance throughout the project. The authors would also like to express their gratitude to the administrative team of the CJCU Green Energy and Environmental Resources Department Computer Research Lab for providing all necessary materials and assistance.
Conflicts of Interest
The authors declare no conflict of interest.
References
- Demuzere, M.; Trigo, R.M.; Vila-Guerau de Arellano, J.; van Lipzig, N.P. The impact of weather and atmospheric circulation on o3 and PM10 levels at a rural mid-latitude site. Atmos. Chem. Phys. 2009, 9, 2695–2714. [Google Scholar] [CrossRef]
- Lockwood, A.H. Air Pollution, air quality, and climate change. Heat Advis. 2016, 109–130. [Google Scholar] [CrossRef]
- Tong, C.H.; Yim, S.H.; Rothenberg, D.; Wang, C.; Lin, C.-Y.; Chen, Y.D.; Lau, N.C. Assessing the impacts of seasonal and vertical atmospheric conditions on air quality over the Pearl River Delta Region. Atmos. Environ. 2018, 180, 69–78. [Google Scholar] [CrossRef]
- Ramos Torre, R. El Futuro Climático del IPCC: Una Aproximación sociológica / The climatic future of the ipcc: A sociological approach. Rev. Española De Investig. Sociológicas 2021. [Google Scholar] [CrossRef]
- Aryal, R.K.; Lee, B.-K.; Karki, R.; Gurung, A.; Kandasamy, J.; Pathak, B.K.; Sharma, S.; Giri, N. Seasonal PM10 dynamics in Kathmandu Valley. Atmos. Environ. 2008, 42, 8623–8633. [Google Scholar] [CrossRef]
- Wang, R.; Liu, B.; Li, H.; Zou, X.; Wang, J.; Liu, W.; Cheng, H.; Kang, L.; Zhang, C. Variation of strong dust storm events in northern China during 1978–2007. Atmos. Res. 2017, 183, 166–172. [Google Scholar] [CrossRef]
- Sarant, L. Red Sea corals will stand the test of Time. Nat. Middle East 2017. [CrossRef]
- Ohara, T. Long-range transport and deposition of Air Pollution. Encycl. Environ. Health 2019, 126–130. [Google Scholar] [CrossRef]
- Tiwari, S.; Kun, L.; Chen, B. Spatial variability of sedimentary carbon in South Yellow Sea, China: Impact of anthropogenic emission and long-range transportation. Environ. Sci. Pollut. Res. 2020, 27, 23812–23823. [Google Scholar] [CrossRef]
- Katoto, P.D.M.C.; Byamungu, L.; Brand, A.S.; Mokaya, J.; Strijdom, H.; Goswami, N.; De Boever, P.; Nawrot, T.S.; Nemery, B. Ambient air pollution and health in Sub-Saharan Africa: Current evidence, Perspectives and a call to action. Environ. Res. 2019, 173, 174–188. [Google Scholar] [CrossRef]
- Jury, M.R. Statistics and meteorology of air pollution episodes over the South African Highveld based on satellite–model datasets. J. Appl. Meteorol. Climatol. 2017, 56, 1583–1594. [Google Scholar] [CrossRef]
- Tshehla, C.; Wright, C.Y. 15 years after the National Environmental Management Air Quality Act: Is legislation failing to reduce air pollution in South Africa? S. Afr. J. Sci. 2019, 115. [Google Scholar] [CrossRef] [PubMed]
- Jury, M.R.; Buthelezi, M.S. Air pollution dispersion over Durban, South Africa. Atmosphere 2022, 13, 811. [Google Scholar] [CrossRef]
- Nchaba, T.; Mpholo, M.; Lennard, C. Long-term austral summer wind speed trends over Southern Africa. Int. J. Climatol. 2016, 37, 2850–2862. [Google Scholar] [CrossRef]
- Feig, G.T.; Vertue, B.; Naidoo, S.; Ncgukana, N.; Mabaso, D. Measurement of atmospheric black carbon in the Vaal Triangle and Highveld Priority Areas. Clean Air J. 2015, 25. [Google Scholar] [CrossRef]
- Altieri, K.E.; Keen, S.L. Public health benefits of reducing exposure to ambient fine particulate matter in South Africa. Sci. Total Environ. 2019, 684, 610–620. [Google Scholar] [CrossRef]
- Wernecke, B.; Language, B.; Piketh, S.J.; Burger, R.P. Indoor and outdoor particulate matter concentrations on the Mpumalanga highveld–A case study. Clean Air J. 2015, 25, 12. [Google Scholar] [CrossRef]
- Venter, A.; De Vos, S. Ambient air quality data reported at Sasol Secunda Monitoring Stations during COVID-19 lockdown–Mpumalanga, South Africa. Clean Air J. 2021, 31. [Google Scholar] [CrossRef]
- Olutola, B.; Claassen, N.; Voyi, K.; Wichmann, J. Apparent temperature as a modifier of the effects of air pollution on respiratory disease hospital admissions in Secunda, South Africa. Environ. Epidemiol. 2019, 3, 439. [Google Scholar] [CrossRef]
- Morris, D.R.; Boardman, W.S.; Swanepoel, L.H.; Simpson, G.; Coetzee, J.; Camacho, G.J.; McWhorter, T.J. Population density estimate of leopards (Panthera pardus) in north-western Mpumalanga, South Africa, determined using spatially explicit capture–recapture methods. Mamm. Biol. 2021. [CrossRef]
- Hou, Z.; Li, J.; Wang, L.; Zhang, Y.; Liu, T. Improving the forecast accuracy of ECMWF 2-m air temperature using a historical dataset. Atmos. Res. 2022, 273, 106177. [Google Scholar] [CrossRef]
- ECMWF Reanalysis v5 | Ecmwf. (n.d.). Available online: https://www.ecmwf.org/en/forecasts/dataset/ecmwf-reanalysis-v5 (accessed on 18 January 2023).
- Saaqis. (n.d.). Available online: https://saaqis.environment.gov.za/ (accessed on 18 January 2023).
- Agustine, I.; Yulinawati, H.; Suswantoro, E.; Gunawan, D. Application of open air model (R package) to analyze air pollution data. Indones. J. Urban Environ. Technol. 2017, 1, 94–109. [Google Scholar] [CrossRef]
- Berman, F.; Chien, A.; Cooper, K.; Dongarra, J.; Foster, I.; Gannon, D.; Johnsson, L.; Kennedy, K.; Kesselman, C.; Mellor-Crumme, J.; et al. The Grads Project: Software support for high-level grid application development. Int. J. High Perform. Comput. Appl. 2001, 15, 327–344. [Google Scholar] [CrossRef]
- Li, J.; Cheng, J.-H.; Shi, J.-Y.; Huang, F. Brief introduction of back propagation (BP) Neural Network algorithm and its improvement. Adv. Intell. Soft Comput. 2012, 169, 553–558. [Google Scholar] [CrossRef]
- Elminir, H.K. Dependence of urban air pollutants on meteorology. Sci. Total Environ. 2005, 350, 225–237. [Google Scholar] [CrossRef]
- Hsu, C.-H.; Cheng, F.-Y. Synoptic weather patterns and associated air pollution in Taiwan. Aerosol Air Qual. Res. 2019, 19, 1139–1151. [Google Scholar] [CrossRef]
- Rainham, D.G.; Smoyer-Tomic, K.E.; Sheridan, S.C.; Burnett, R.T. Synoptic Weather Patterns and modification of the association between Air Pollution and human mortality. Int. J. Environ. Health Res. 2005, 15, 347–360. [Google Scholar] [CrossRef]
- Vanos, J.K.; Cakmak, S.; Bristow, C.; Brion, V.; Tremblay, N.; Martin, S.L.; Sheridan, S.S. Synoptic weather typing applied to air pollution mortality among the elderly in 10 Canadian cities. Environ. Res. 2013, 126, 66–75. [Google Scholar] [CrossRef] [PubMed]
- Lai, L.-W.; Cheng, W.-L. Air quality influenced by urban heat island coupled with synoptic weather patterns. Sci. Total Environ. 2009, 407, 2724–2733. [Google Scholar] [CrossRef] [PubMed]
- Vautard, R.; Colette, A.; van Meijgaard, E.; Meleux, F.; Jan van Oldenborgh, G.; Otto, F.; Tobin, I.; Yiou, P. Attribution of wintertime anticyclonic stagnation contributing to air pollution in Western Europe. Bull. Am. Meteorol. Soc. 2018, 99, S70–S75. [Google Scholar] [CrossRef]
- Kallos, G.; Kassomenos, P.; Pielke, R.A. Synoptic and mesoscale weather conditions during air pollution episodes in Athens, Greece. In Transport and Diffusion in Turbulent Fields; Springer: Dordrecht, The Netherlands, 1993; pp. 163–184. [Google Scholar] [CrossRef]
- Kumar, V.S.; Naseef, T.M. Performance of ERA-Interim wave data in the nearshore waters around India. J. Atmos. Ocean. Technol. 2015, 32, 1257–1269. [Google Scholar] [CrossRef]
- Mamun, M.I. The seasonal variability of aerosol optical depth over Bangladesh based on satellite data and Hysplit Model. Am. J. Remote Sens. 2014, 2, 20. [Google Scholar] [CrossRef]
- Gustin, M.S.; Dunham-Cheatham, S.M.; Zhang, L.; Lyman, S.; Choma, N.; Castro, M. Use of membranes and detailed HYSPLIT analyses to understand atmospheric particulate, gaseous oxidized, and reactive mercury chemistry. Environ. Sci. Technol. 2021, 55, 893–901. [Google Scholar] [CrossRef]
- Sharif, F.; Alam, K.; Afsar, S. Spatio-temporal distribution of aerosol and cloud properties over Sindh using MODIS satellite data and a HYSPLIT model. Aerosol Air Qual. Res. 2015, 15, 657–672. [Google Scholar] [CrossRef]
- Zhang, Y.; Fan, J.; Chen, X.; Ashkenazy, Y.; Havlin, S. Significant impact of rossby waves on air pollution detected by network analysis. Geophys. Res. Lett. 2019, 46, 12476–12485. [Google Scholar] [CrossRef]
- Tagaris, E.; Manomaiphiboon, K.; Liao, K.-J.; Leung, L.R.; Woo, J.-H.; He, S.; Amar, P.; Russell, A.G. Impacts of global climate change and emissions on regional ozone and fine particulate matter concentrations over the United States. J. Geophys. Res. 2007, 112. [Google Scholar] [CrossRef]
- Zelenka, M.P. An analysis of the meteorological parameters affecting ambient concentrations of acid aerosols in Uniontown, Pennsylvania. Atmos. Environ. 1997, 31, 869–878. [Google Scholar] [CrossRef]
- Hien, P.D.; Bac, V.T.; Tham, H.C.; Nhan, D.D.; Vinh, L.D. Influence of meteorological conditions on PM2.5 and PM2.5−10 concentrations during the monsoon season in Hanoi, Vietnam. Atmos. Environ. 2002, 36, 3473–3484. [Google Scholar] [CrossRef]
- Laakso, L.; Hussein, T.; Aarnio, P.; Komppula, M.; Hiltunen, V.; Viisanen, Y.; Kulmala, M. Diurnal and annual characteristics of particle mass and number concentrations in urban, rural and Arctic Environments in Finland. Atmos. Environ. 2003, 37, 2629–2641. [Google Scholar] [CrossRef]
- Beaver, S.; Palazoglu, A.; Singh, A.; Soong, S.-T.; Tanrikulu, S. Identification of weather patterns impacting 24-H average fine particulate matter pollution. Atmos. Environ. 2010, 44, 1761–1771. [Google Scholar] [CrossRef]
- Wang, Q.; Gu, J.; Wang, X. The impact of Sahara Dust on air quality and public health in European countries. Atmos. Environ. 2021, 241, 117771. [Google Scholar] [CrossRef]
- Scott, A. Polar Winds Stir Desert Dust. Nat. Middle East 2019. [CrossRef]
- Filonchyk, M. Characteristics of the severe March 2021 Gobi Desert Dust Storm and its impact on air pollution in China. Chemosphere 2022, 287, 132219. [Google Scholar] [CrossRef] [PubMed]
Disclaimer/Publisher’s Note: The statements, opinions and data contained in all publications are solely those of the individual author(s) and contributor(s) and not of MDPI and/or the editor(s). MDPI and/or the editor(s) disclaim responsibility for any injury to people or property resulting from any ideas, methods, instructions or products referred to in the content. |
© 2023 by the authors. Licensee MDPI, Basel, Switzerland. This article is an open access article distributed under the terms and conditions of the Creative Commons Attribution (CC BY) license (https://creativecommons.org/licenses/by/4.0/).