Article

Lake Water Quality and Dynamics Assessment during 1990–2020 (A Case Study: Chao Lake, China)

1
Shanghai Waterway Engineering Design and Consulting Co., Ltd., Shanghai 200120, China
2
Department of Geography, Yazd University, Yazd 8915818411, Iran
3
Institute for Atmospheric Sciences-Weather and Climate, University of Iceland and Icelandic Meteorological Office (IMO), Bustadavegur 7, IS-108 Reykjavik, Iceland
4
Department of Physics, Institute for Atmospheric Sciences-Weather and Climate, University of Iceland and Icelandic Meteorological Office (IMO), Bustadavegur 7, IS-108 Reykjavik, Iceland
5
Department of Environmental Science, Engineering Jiangwan Campus, Fudan University, 2005 Songhu Road, Yangpu District, Shanghai 200438, China
*
Authors to whom correspondence should be addressed.
Atmosphere 2023, 14(2), 382; https://doi.org/10.3390/atmos14020382
Submission received: 10 December 2022 / Revised: 11 February 2023 / Accepted: 13 February 2023 / Published: 15 February 2023
(This article belongs to the Section Biosphere/Hydrosphere/Land–Atmosphere Interactions)

Abstract

:
Settlements along the coastlines of oceans and lakes, which are among the world’s most densely populated areas, are in immediate danger due to stressors brought on by climate change and dangers posed by human activities. This study investigates the water changes of Chao Lake during the last 30 years by using Landsat 5, 7 and 8 time-series images and water indices, including Normalized Difference Water Index (NDWI), Normalized Difference Turbidity Index (NDTI), Green Normalized Difference Vegetation Index (GNDVI) and Normalized Sea Surface Temperature (SST). The gathered data demonstrates that each estimated indicator’s value has increased with time. Thus, over the course of the 30-year research period, the NDWI, NDTI, GNDVI and SST annual average values show increases of 112.10%, 242.42%, 112.82% and 119.42%, respectively. The NDWI index underwent these fluctuations, evidenced with the biggest amount (681.8%) in the winter and the lowest amount (28.13%) in the fall. The most NDTI changes (480%) and the least (only 50%) occurred in summer and fall, respectively. The largest increases in GNDVI (180%) and SST values (537.86%) were observed in winter; the smallest changes in GNDVI (43.48%) and GNDVI (68.76%) in fall. The outcomes also demonstrated a strong link between all four estimated factors. In the majority of the analyzed months, the correlation between the 2 measures, GNDVI and NDTI, was considerably greater and near to 1. The findings of this study may be utilized by managers, decision-makers and local planners for the purpose of environmental planning and reducing water pollution in Chao Lake (and other water regions), as well as reducing the risk of environmental hazards due to water pollution.

1. Introduction

Climate change stressors, including rising and warmer seas, more intense storms and droughts, acidifying oceans and dangers caused by human activities [1], are fast posing a danger to sea and lake coastal zones, which are where people live in the greatest concentrations. Although local human activities have a negative influence on coastal zones, it is still unclear how these effects and stresses from climate change may interact to imperil coastal ecosystems [2,3,4,5,6]. The national economy and food supply are significantly impacted by coastal regions and the food they produce. Due to increased productivity and alterations in land use and land cover, the replacement of shrimp farming for agriculture in coastal regions in recent years has represented a paradigm shift [7,8,9]. Human actions, such as creating shrimp farms [10], crops or neglecting to maintain drained marshes [11,12], a location for sewage and industrial waste disposal, commercial navigation or aquaculture [13] have caused the salinity of water near the shores [14]. The effects of ocean salinity include a decrease in soil fertility, a shortage of freshwater for drinking and a threat to public health (particularly near coasts) [10,15,16,17,18,19]. Monitoring water-soluble chemicals (especially water salinity) is critical for persons who live on beaches near the ocean since a surge in these pollutants might disturb the environment, impair human health and destroy aquatic creature habitats [14,20,21,22].
For water purification, it is required to evaluate the water quality resources. Considerations for water quality include a body of water’s thermal, physical, chemical and biological characteristics [23]. These measures are important for figuring out if water is safe to drink or to use recreationally. Given the wide range of uses for water, defining its quality is challenging. For instance, the water qualities suitable for human consumption and those suitable for irrigation in agriculture are different [23]. Additionally, it typically has to do with the security of water users. A wide variety of chemical and microbiological contaminants may be found in drinking water, some of which can have serious negative health effects on consumers. To ensure water safety, it is essential to comprehend the kinds of pollutants that may enter the water supply and how they get there [23]. Discharges from urban, agricultural and industrial sources are also connected to water quality. Furthermore, urban waste flows are a global risk factor for fecal pollution of surface water. Furthermore, by including significant numbers of fecal bacteria, urban stormwater runoff has been shown to impact the quality of surface water [24].
Saline level measurements using conventional techniques are expensive and time-consuming. Additional primary data collection and laboratory testing are required for these [25,26,27,28]. Therefore, the remote sensing technique, which has been shown to be a good method of monitoring water quality, may be a different tool to make the monitoring process more pleasant and effective [28,29,30,31,32,33]. Additionally, Landsat data sets offer varieties of satellite pictures, which facilitates and expedites monitoring and change detection [14,34]. Because they are influenced by a number of variables, such as the quantity and characteristics of suspended particles, dissolved solids and other organic compounds, the optical properties of water are significant in this situation [35,36,37]. Based on the relationship between optical characteristics of water and band values of the Landsat data set, an efficient monitoring technique may be used [25,37,38].
Many methods for identifying water quality parameters from Landsat photos have been developed by a number of researchers from across the world for diverse locations [14,32,37,39,40]. In Mexico’s coastal zones, Gonzalez-Marquez et al. (2018) showed how Landsat-8 (OLI) pictures may be utilized to examine water quality indicators, such as phosphate concentrations, electrical conductivity, total suspended particles, turbidity and pH. The Landsat-8 OLI imagery was also demonstrated to be able to monitor salinity in Iraq’s Al-Huwaizah wetland. In a different study, Vu et al. (2018) concentrated on the relationship between in situ salinity level data and Landsat-8 (OLI) band values in order to develop a monitoring plan for the Vietnamese Mekong delta. Landsat-5 TM may be used to map water quality indicators, such as suspended sediments, turbidity, chlorophyll-a and others. Nas et al. (2010) developed regression models for these parameters using 28 band compositions to examine the relationship between band values and field level parameter values [14].
In order to track and evaluate environmental changes in Australian estuaries at the watershed level, Bugnot et al. (2018) employed Landsat-5 (TM) and 7 (ETM+). The concentration of suspended solids in the water may also be measured using Landsat pictures (SSC). Shahzad et al. (2018) and Montaner et al. (2014) developed empirical methods to recognize SSC from Landsat images. According to Chang et al. (2017), remote sensing techniques may be the most useful way to monitor and control water quality. Landsat spectral bands may be used to identify turbidity, total suspended particles, and heavy metals, such as iron, zinc, copper, chromium, lead and cadmium [14,27]. It may also be used to gauge water quality and chlorophyll-a concentrations [30]. Vignolo et al. (2006) developed a model using linear regression analysis to identify water quality index from Landsat-7 ETM bands, particularly the blue and green bands. This study also demonstrated that the blue and green bands in Landsat images may be utilized to precisely assess water quality.
In order to determine the soil salinity in coastal Bangladesh, Morshed et al. (2016) developed a regression equation using data from Landsat-7 ETM+. Landsat-5 TM was also examined by Ferdous and Rahman (2018) to determine the soil water content of the area [41,42]. According to Ferdous et al. (2019), Landsat-8 OLI images should be used to track water quality using the Total Dissolved Solid (TDS) index in coastal Bangladesh. Water quality has a substantial influence on both public health and the economy as a result of beach closures, decreased fishing, or deteriorating drinking water sources [16]. In order to maintain ecosystem services and production in tidal wetlands, it is essential to comprehend hydrodynamic and hydrological processes [43]. On the other hand, industrial effluent and agricultural runoff both contribute to eutrophication processes that lead to phytoplankton accumulation. The increased plant growth that results from the rise in nitrogen levels makes the water muddy, affects fish populations, and hastens algal blooms [20,44,45]. In light of this, the current study aims to look at how water turbidity and the amount of chlorophyll in the water of Chao Lake, China varies over 30 years. This study aids in examining this lake, which has recently witnessed significant urban growth in the area surrounding it [46,47]. This study evaluates the variations in water temperature over time and by season since thermal remote sensing is a useful method for identifying thermal changes in freshwater systems that can affect biological productivity [48].

2. Materials and Methods

2.1. Study Area

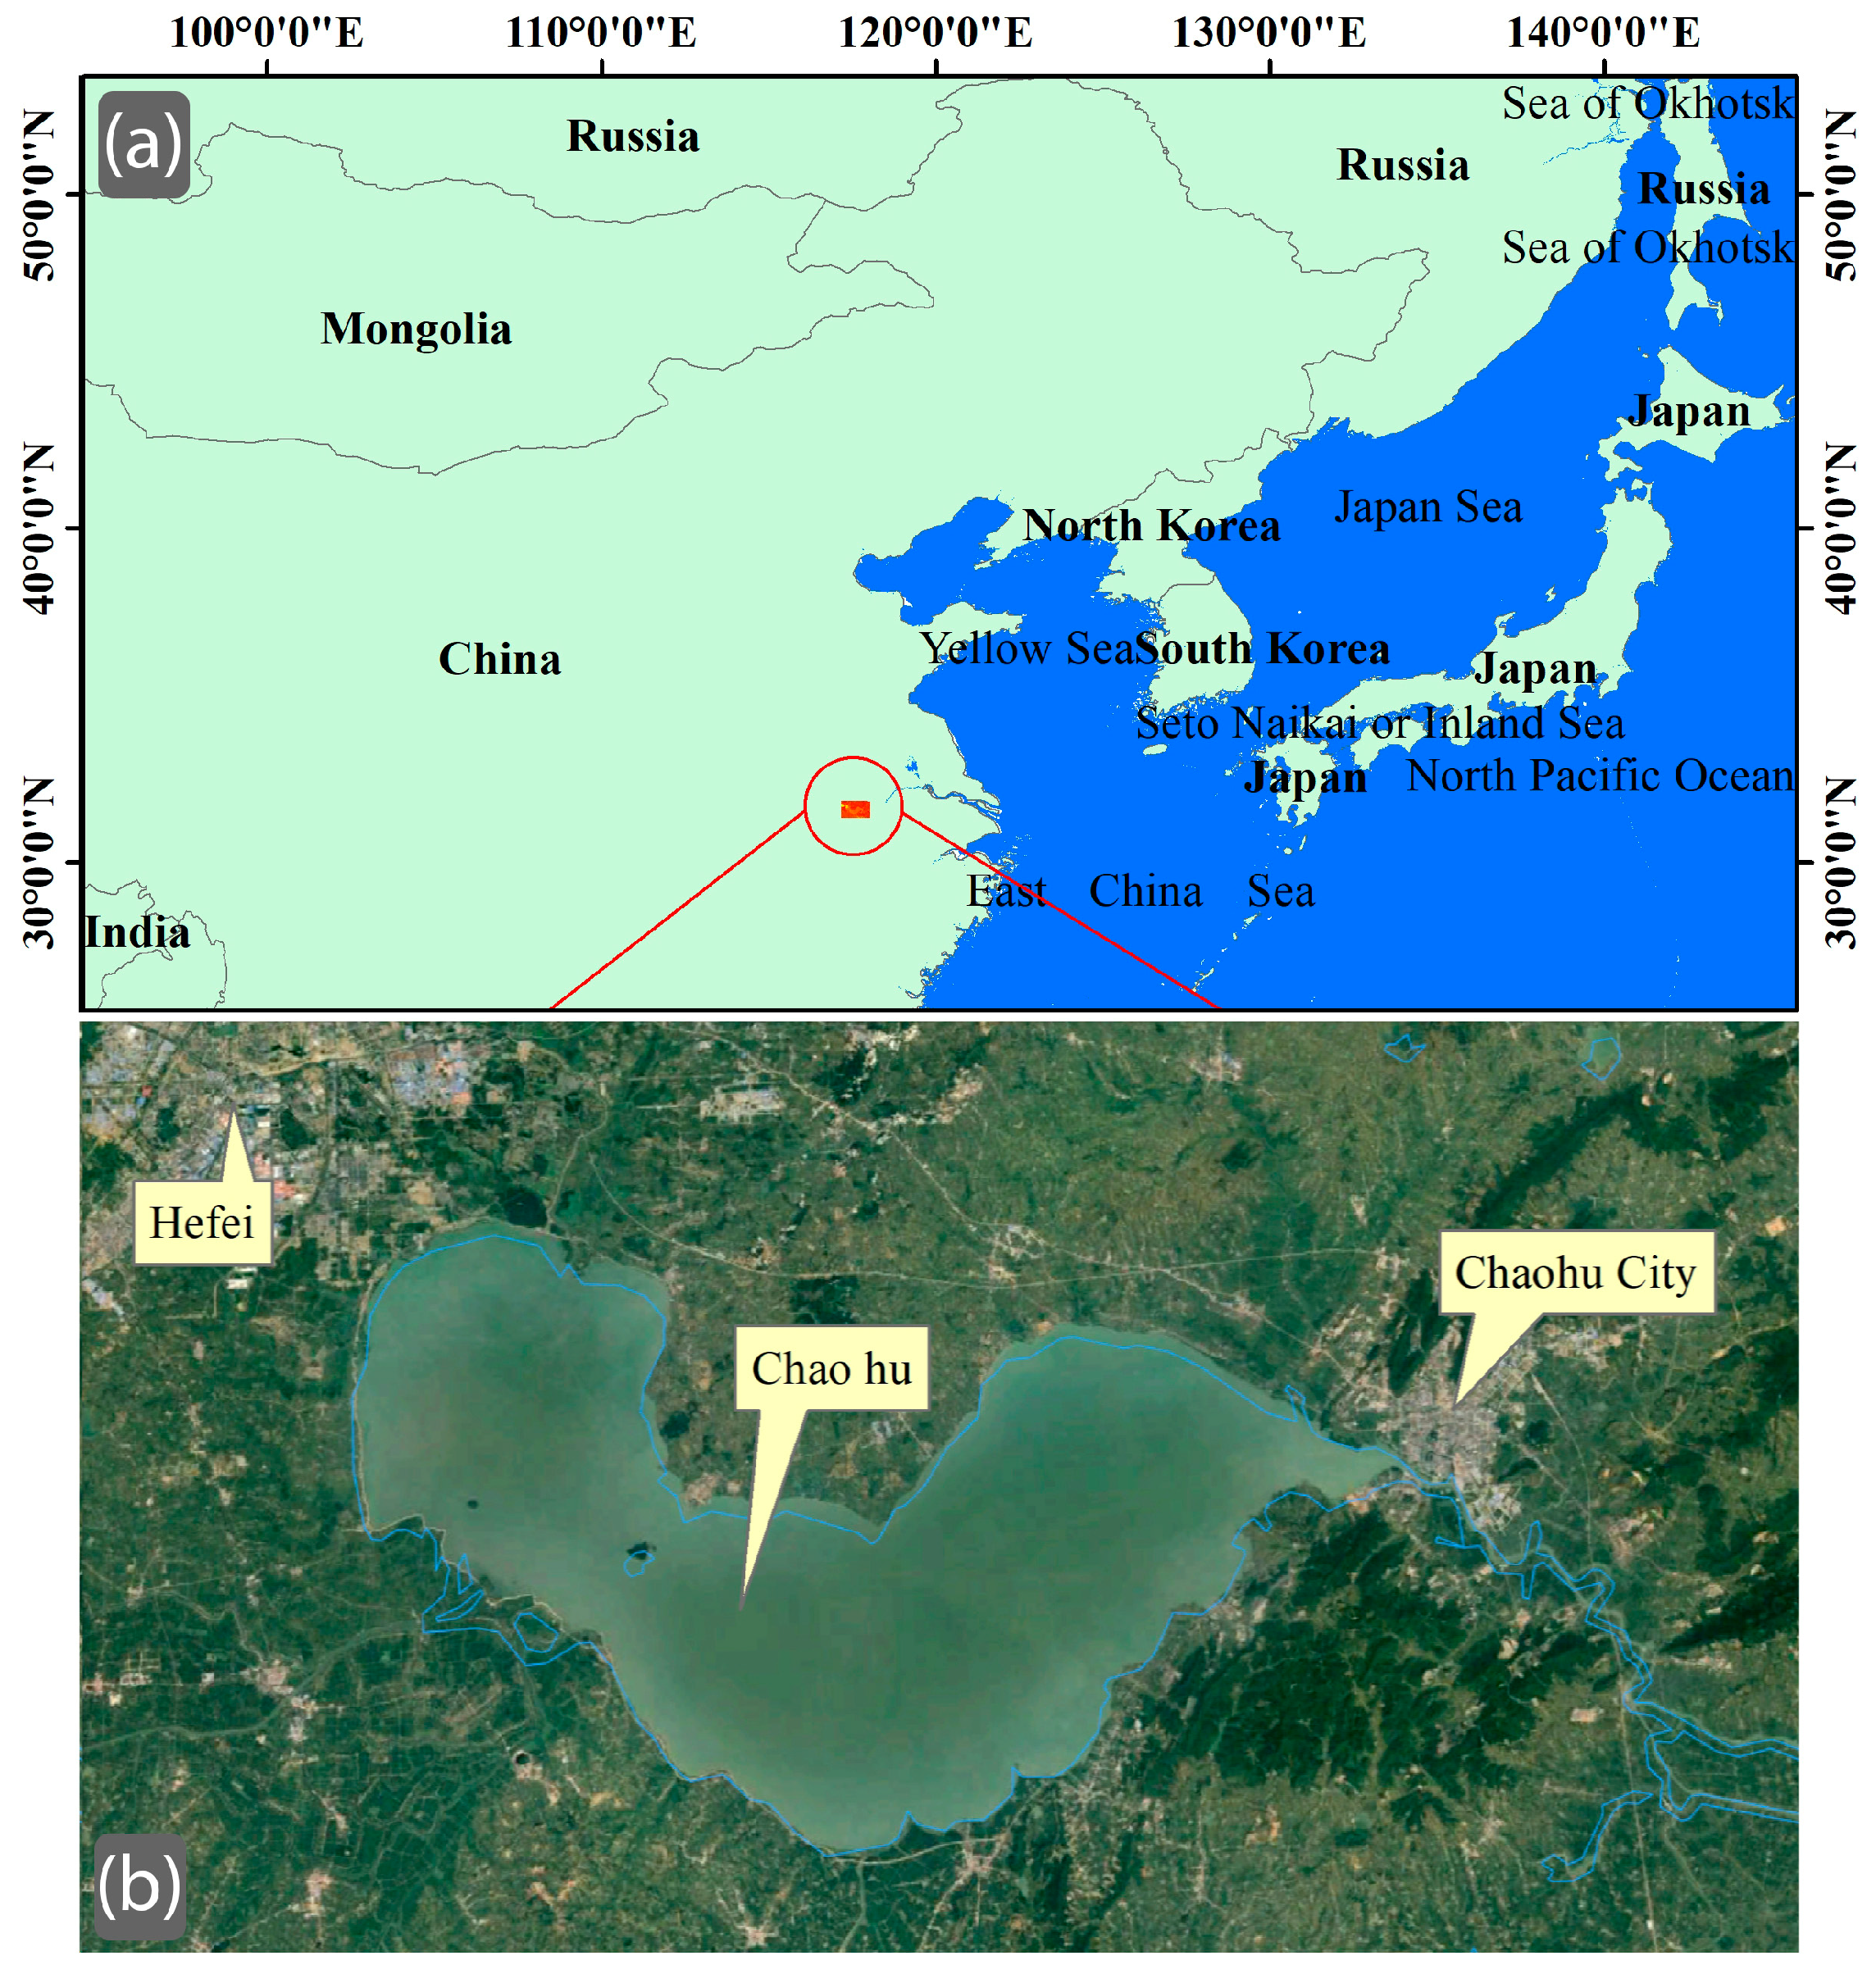
The study area, Chao Lake, is located between latitude 31°25′ and 44′ N and longitude 117°17′ and 52′ E in China (Figure 1). The city of Hefei is located in the northwest and the city of Chaohu is located in the eastern part of this lake. This lake has an area of 780 square kilometers and its average depth is 2.89 m. A population of nearly 5 million people live around this lake and use it for irrigation, transportation and fishing. The water of this lake has been eutrophicated. Additionally, this lake is one of the most polluted in China due to China’s fast economic development and excessive water use [49].

2.2. Data Collection

To investigate the changes of chlorophyll suspended in the water as well as the SST changes of Lake Chao, the present research has used the Landsat 5 (TM), Landsat 7 (ETM+) and Landsat 8 (OLI) satellite images. For monitoring seasonal changes, one image from these data were selected from each season from 1990, 2000, 2010 and 2020 (Table 1), which showed the high visual quality with the least cloud cover. These data were received from the United States Geological Survey (www.earthexplorer.usgs.gov, (accessed on 20 January 2021)) and released as the level-1 T terrain corrected products. All of the optical bands of these images were generated at 30-m resolution while the spatial resolution of thermal bands ranges from 120 m (Landsat-5 TM) to 100 m (Landsat-8 OLI/TIRS) to 60 m (Landsat-7 ETM+).

2.3. Data Preprocessing

After images were acquired using ENVI software and the Fast Line-of-Sight Atmospheric Analysis of Spectral Hypercubes (FLAASH) technique, they were corrected radiometrically and atmospherically. This technique was performed because the FLAASH is suggested for atmospheric correction over images of ocean or water bodies [50,51]. Following this, the spectral reflectance of each image was examined for the years 1990, 2000, 2010 and 2020. Afterward, using changes in the index values, water indices were constructed to compare changes in water content. In order to track the variations in ocean warming, the Sea Surface Temperature (SST) has been calculated for years.

2.4. Calculation of Water Indices

2.4.1. Green Normalized Difference Vegetation Index (GNDVI)

The GNDVI index was employed in this study to assess changes in water’s chlorophyll concentration. This is because variations in chlorophyll concentration, which is inversely proportional to water nitrogen content, lead the index to be particularly sensitive [52,53,54]. The GNDVI maps were calculated using Equation (1) [52]:
GNDVI = NIR G NIR + G
where NIR is the Near-Infrared band which is Landsat-8 (OLI) 5th and Landsat-7 (ETM+) 4th bands and G is the green band with 0.54~0.57 µm wavelength range which is the Green band [51].

2.4.2. Normalized Difference Turbidity Index (NDTI)

The NDTI index was established to assess the turbidity of water in ponds and inland lakes using remote sensing data [54,55]. The NDTI maps were calculated using Equation (2) [55]:
NDTI = R G R + G
where R is the red band w and G is the green band.

2.4.3. Normalized Difference Water Index (NDWI)

Using satellite data, remote sensing techniques make it simple to study the changes of the land surface. We have examined the dynamics of the surface water after the disaster at several locations using the spectral water index. Various measurements such as ratios, differences and normalized differences of two or more bands are used to calculate the spectral water index. The major percentage of noise is also canceled out by such arithmetic spectrum operations. Moreover, [56] was the first to create the idea of the NDWI.
NDWI = G NIR G + NIR
where G is the reflectance in green band and NIR is the reflectance in the near-infrared band, respectively.

2.5. Calculation of SST

2.5.1. Calculation of SST Using ETM+ and TM Bands

To calculate SST from ETM+ and TM sensor thermal band (6th band), the Digital Number (DN) value of thermal bands were converted to the Top Of Atmosphere (TOA) radiance using Equation (3) [51,57]:
L λ   = ( ( L MAX λ   L MIN λ ) / ( DN MAX DN MIN ) )   *   ( DN DN MIN ) +   L MIN λ
where L λ is Spectral radiance (watts/m2·ster·µm), L MAX λ is Spectral radiance which is correlated with DNMAX (watts/m2·ster·µm), L MIN λ is Spectral radiance which is correlated with DNMIN and DN MIN is Minimum value of DN (1 or 0 based on LPGS or NLAPS Product respectively [58]). It was then converted to the effective temperature value using Equation (4) [58]:
T Landsat 7   =   K 2 / ln ( ( K 1 / L λ ) + 1 ) 273.15
where T is Effective temperature (°C), K 2 and K 1 are calibration constants 2 and 1 for thermal band (Table 2). The thermal band that is used in this study is band 62 of ETM+ and TM sensors, which is recommended as the more effective band for SST calculation [51,58].

2.5.2. Calculating SST for TIRS Sensor Multi-Band

For the 11 µm and 12 µm channels, the Multi-Channel SST (MCSST) algorithm has been the most often employed for SST retrieval from satellite data [50,59,60,61]. Although the single-window method was used in previous studies [62], the multi-window method has also been used in several studies [63,64,65,66]. To calculate SST for TIRS images (years 2014, 2016, 2019, and 2020), Equation (3) has been used [66]:
SST = a 1 T 11 + a 2 ( T 11 T 12 ) + a 3
where a 1 , a 2 , a 3 are regression coefficients given in Table 3; T 11 and T 12 are brightness temperature (in Celsius) which are retrieved with 10th and 11th thermal bands of Landsat-8 (TIRS sensor).

3. Results

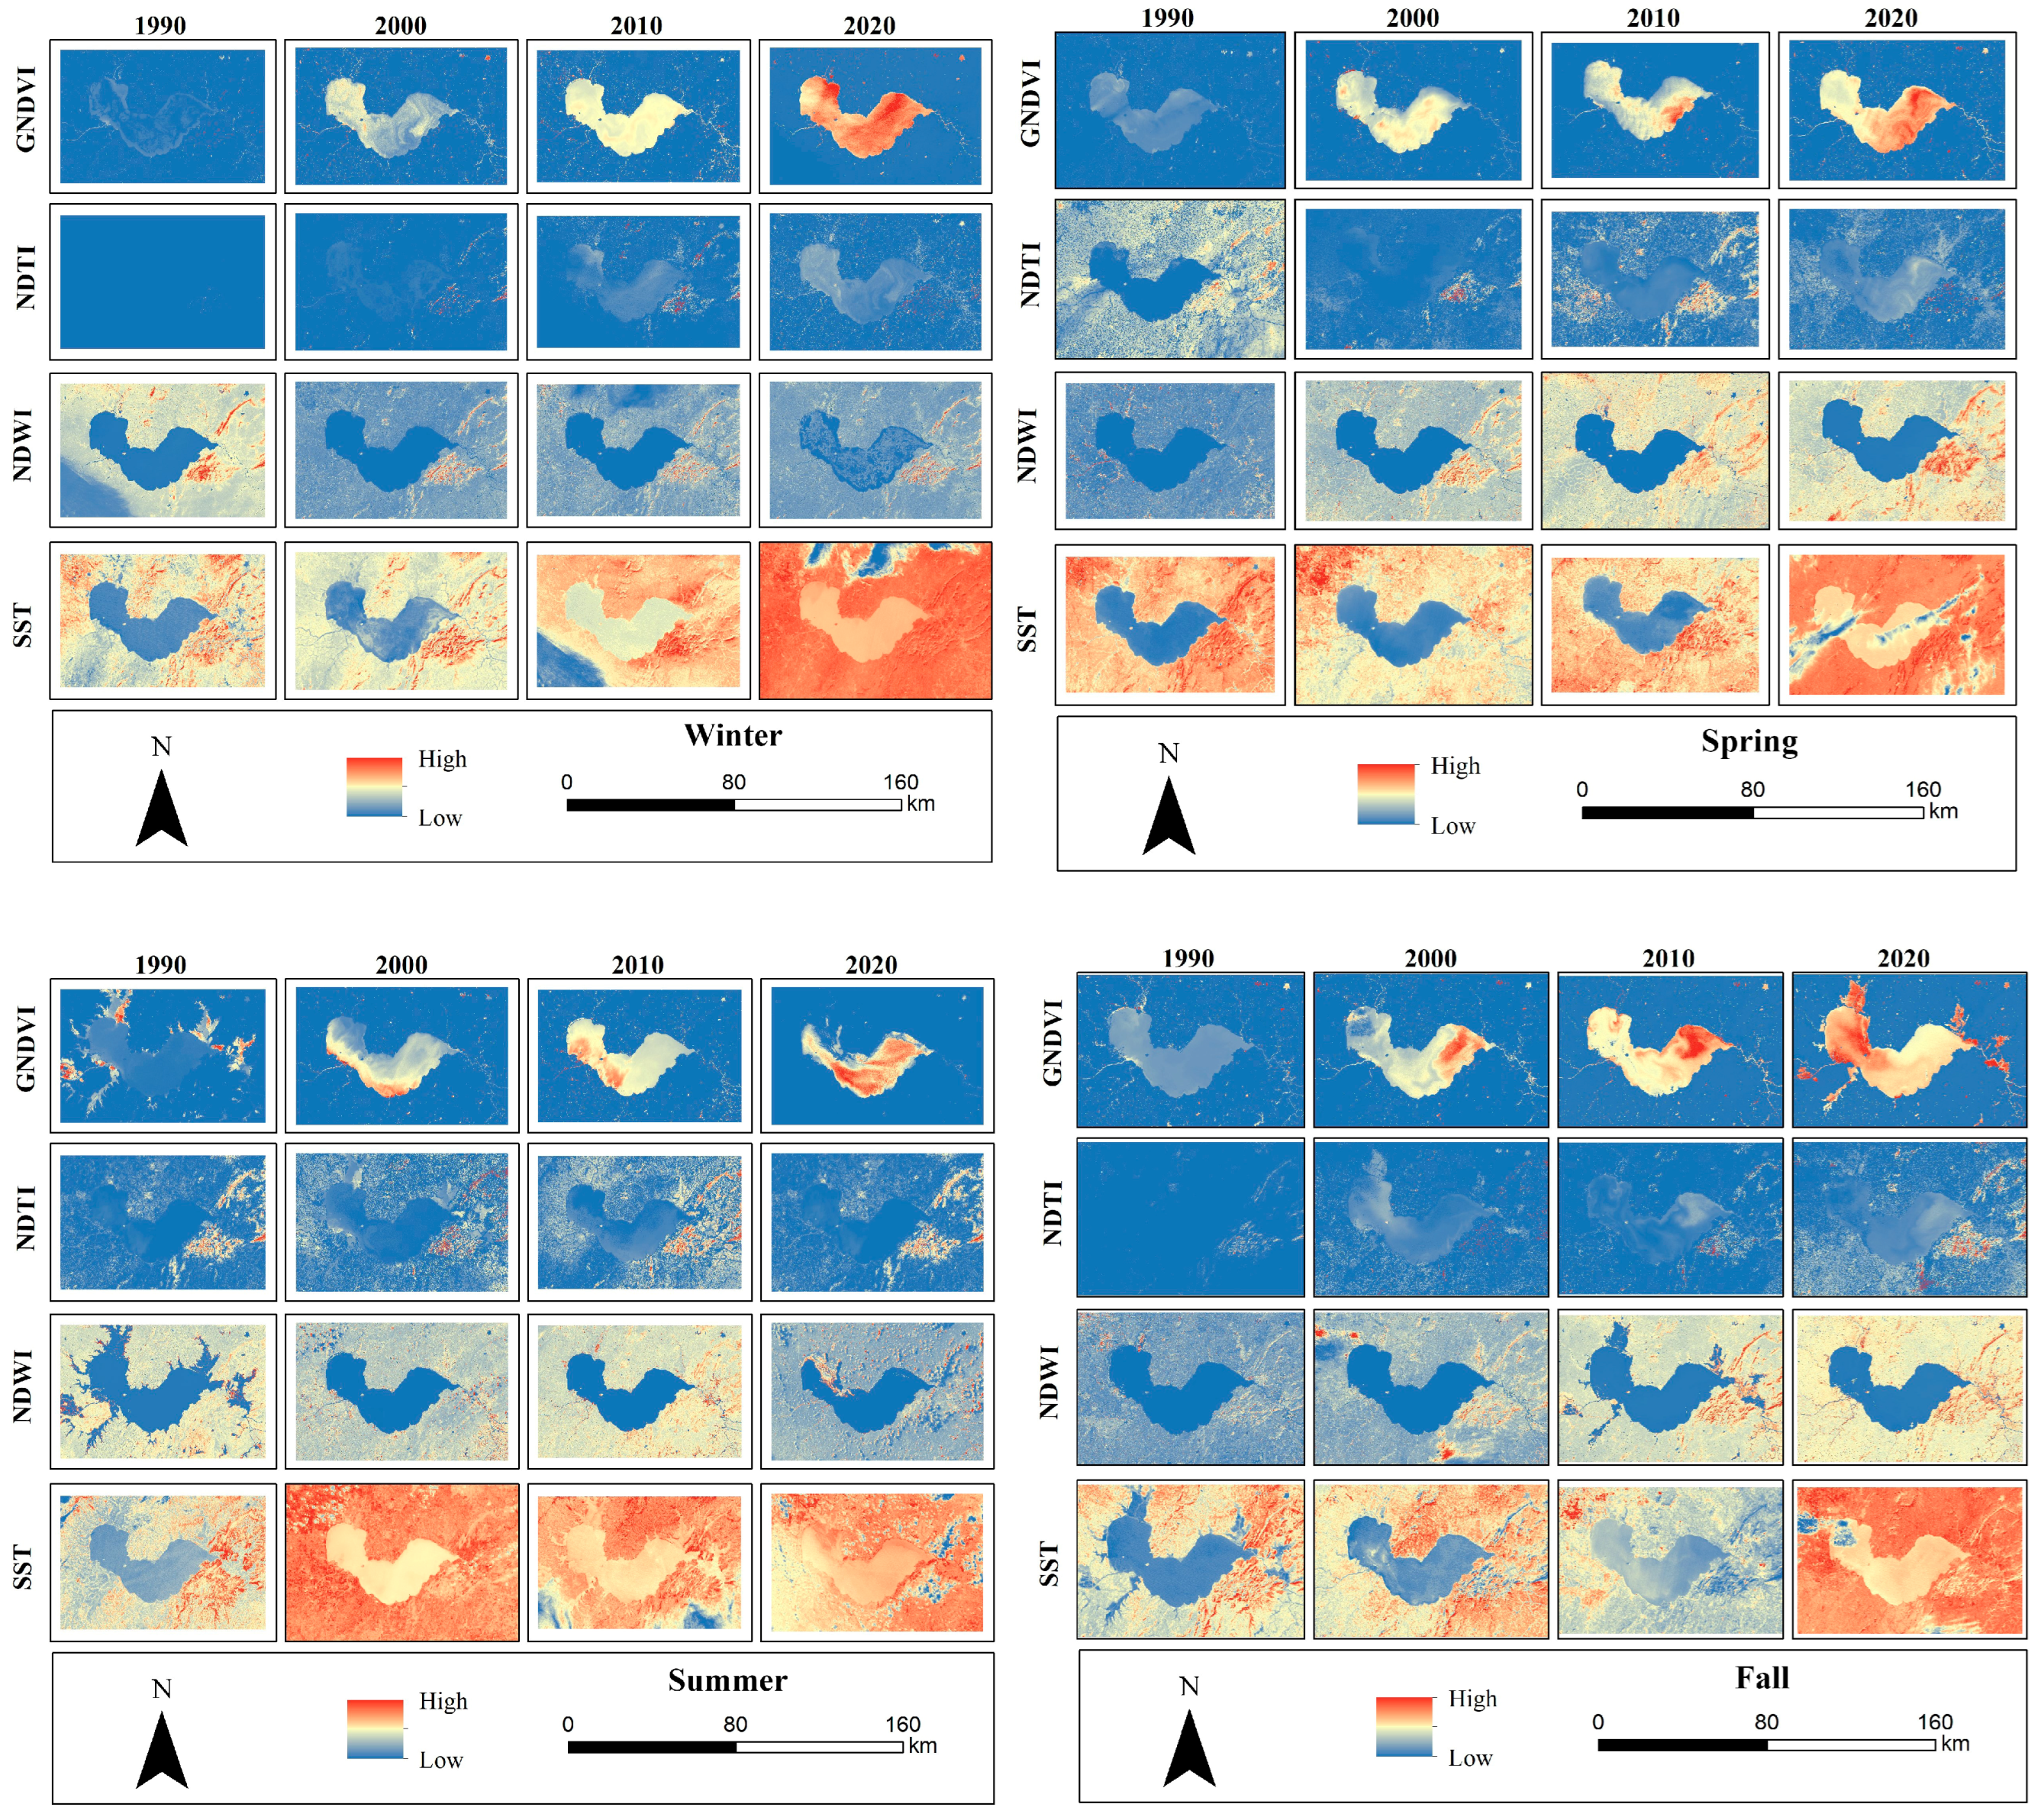
The present study was conducted with the aim of monitoring the changes of parameters related to the water of Chao Lake, China. In order to evaluate the changes of dissolved substances in water and water chlorophyll as well as SST changes over 30 years, these values were calculated by Landsat images and by seasons for Chao Lake (Figure 2). The results of NDWI and NDTI to monitor the amount of turbidity of water, GNDVI to monitor the amount of chlorophyll in water and SST to monitor changes in water surface temperature were analyzed.
The obtained results indicate an increase in the value of all calculated indicators over time. The annual average value of NDWI, NDTI, GNDVI and SST shows an increase of 112.10%, 242.42%, 112.82% and 119.42%, respectively, during the 30-year-studied period (Table 4).
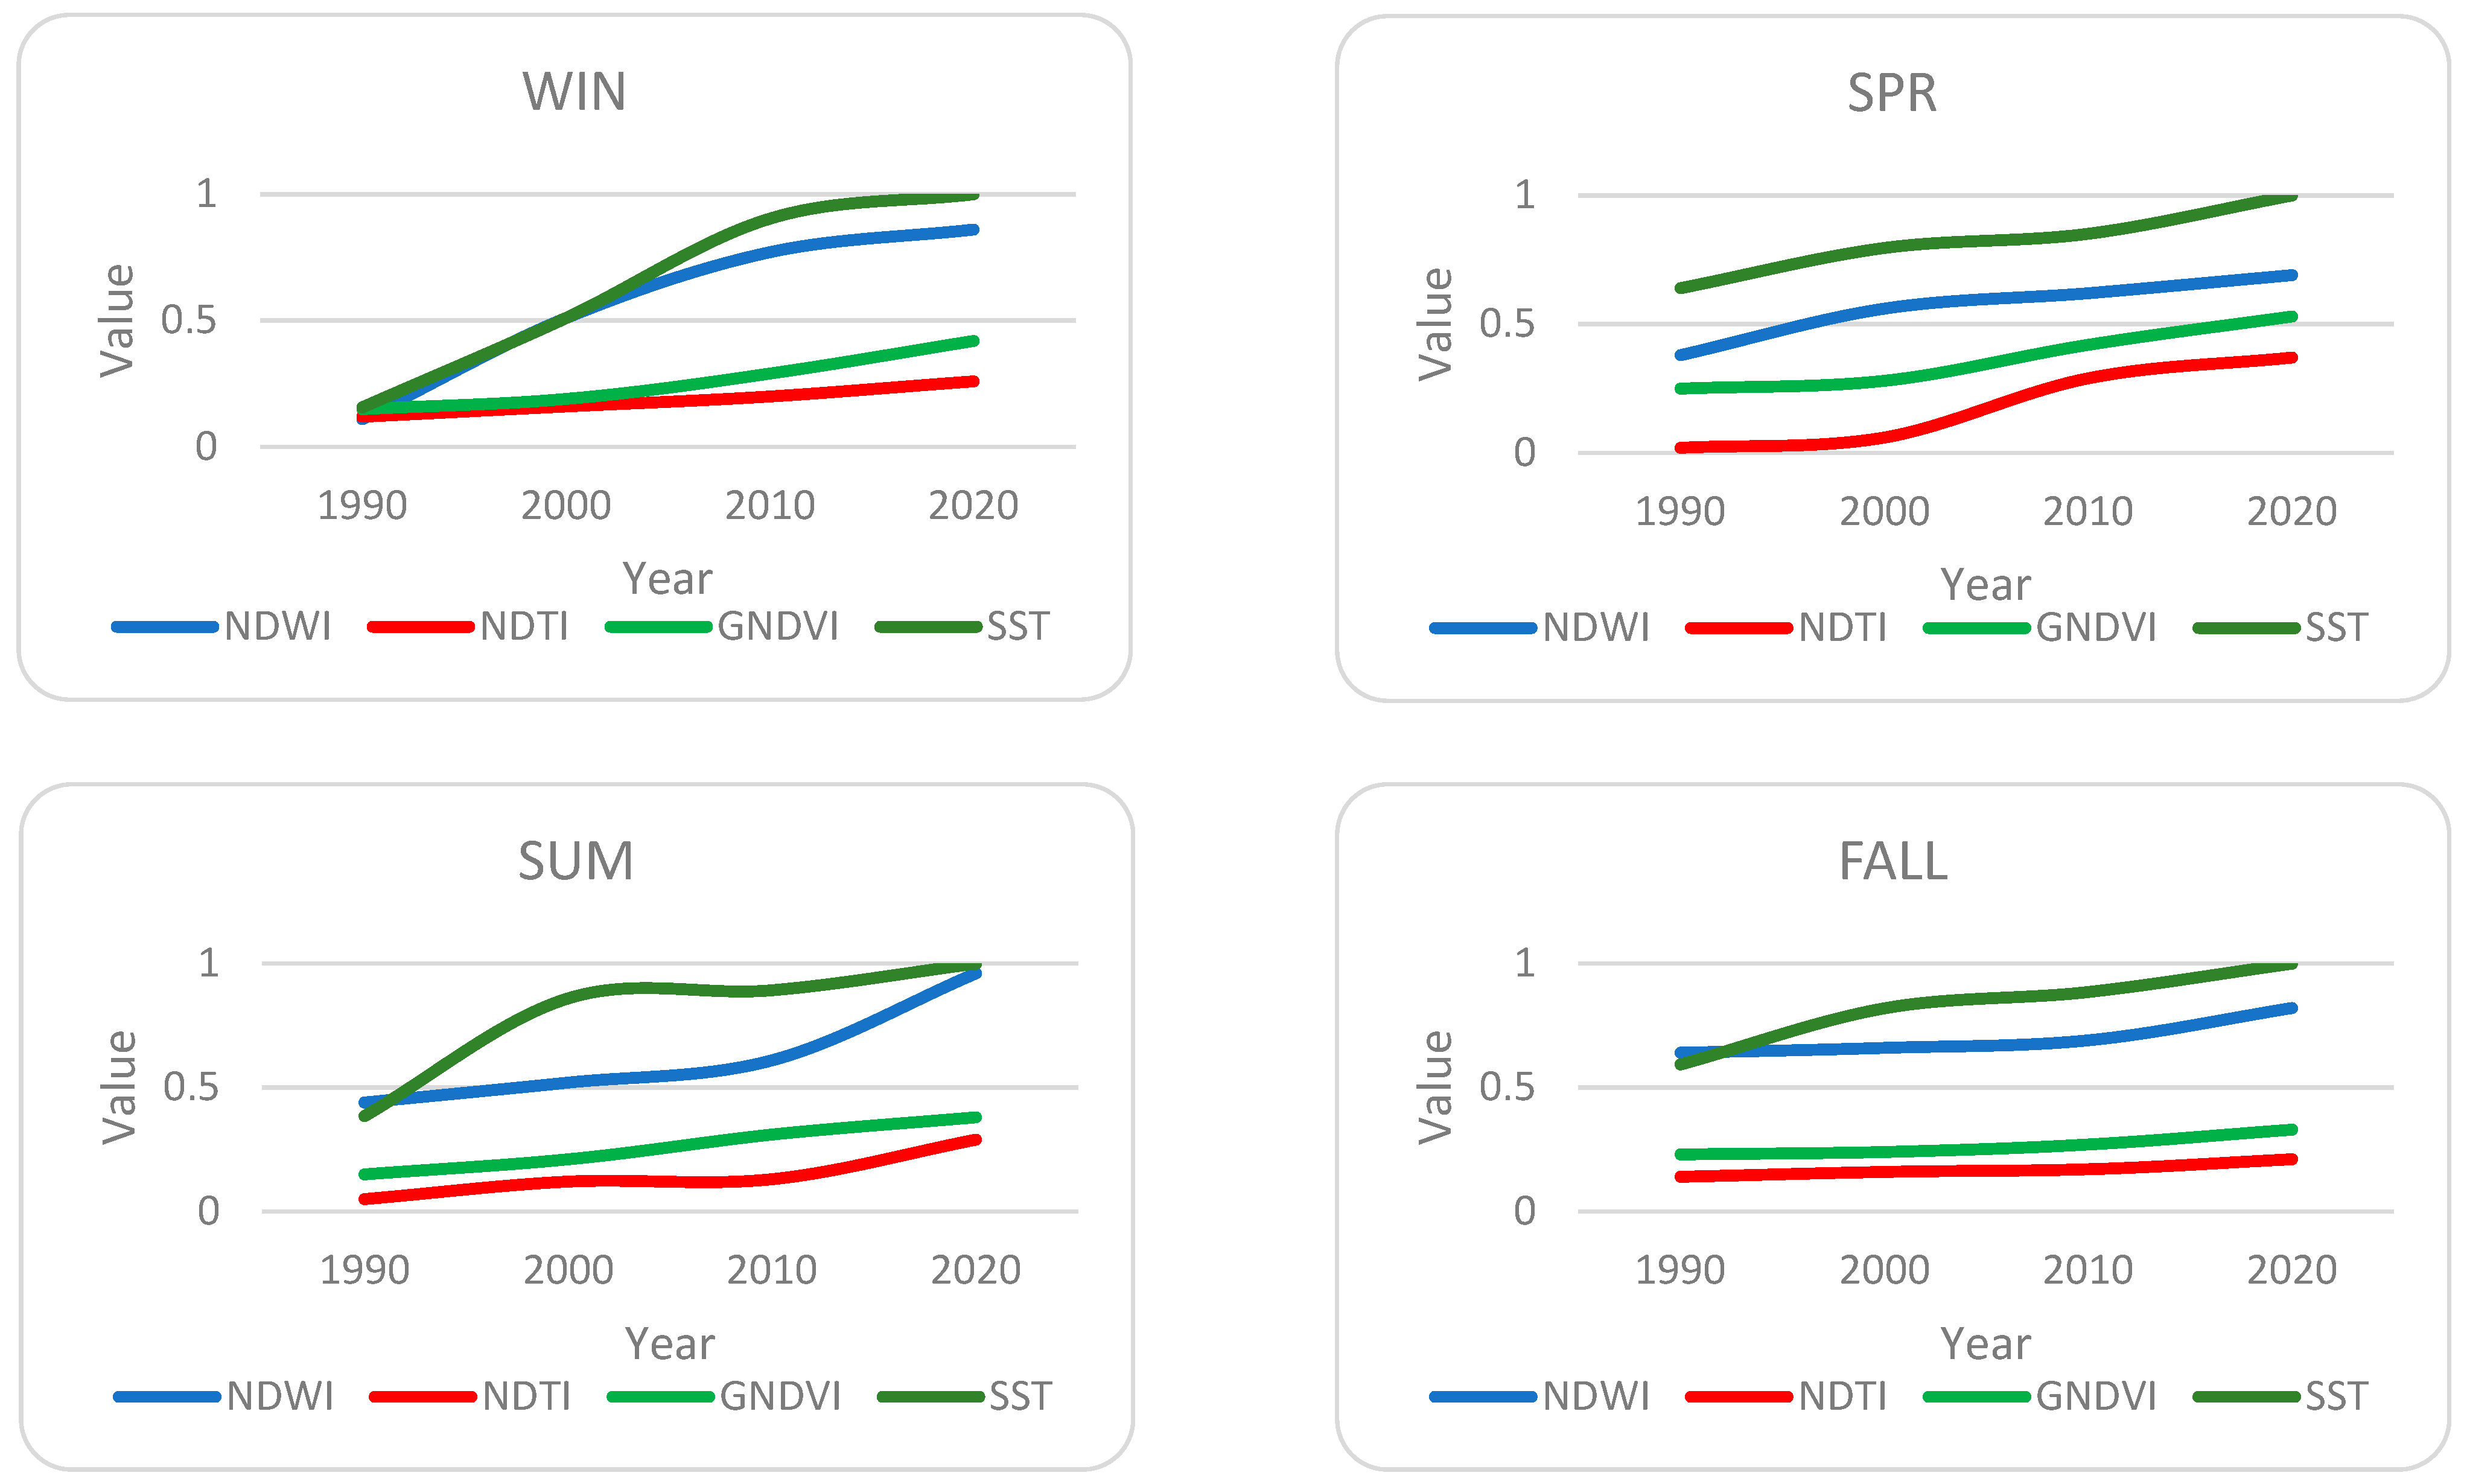
These changes were for the NDWI index with the highest amount, 681.8% in the winter season, and the lowest amount, 28.13% in the fall season. The highest amount of NDTI changes was 480% in summer and the lowest was 50% in fall. The highest changes in GNDVI and SST values were in winter, 180% and 537.86%, respectively, and the lowest was in fall with 43.48% and 68.76% (Figure 3).
Table 5, Table 6, Table 7 and Table 8 indicate the statistically significant correlation between NDWI, NDTI, GNDVI and SST, of which the correlation coefficients are mostly above 90% (and rarely above 80% or 70%) between these parameters in all these seasons. As shown, the highest correlations in winter and spring were related to NDTI with GNDVI and NDWI with SST. The lowest (relative) correlations were related to SST and NDWI in summer and autumn seasons, while the correlation between NDTI and NDWI increased by 0.1 in these 2 seasons. In the summer season, there is also a decrease of 0.1 in the correlations between SST and NDTI, and GNDVI and NDWI.

4. Discussion

The present study was conducted to monitor the changes in the water-related parameters of Chao Lake, including NDVI, GNDVI, NDTI and SST over the past 30 years. The collected findings show that the value of each estimated indicator has risen with time. As a result, over the 30-year study period, the yearly average values of the NDWI, NDTI, GNDV, and SST indicate increases of 112.10%, 242.42%, 112.82% and 119.42%, respectively. Since the indices are sensitive to changes in chlorophyll concentration, these increases may be the result of human activities increasing the chlorophyll in the water [53,54]. This is logical considering the global expansion of cities, increasing the use of water resources and their pollution. In particular, the significant expansion of the cities around this lake—such as Hefei city, which has been mentioned by several researches such as [46,47] in recent years—can cause overcrowding of the population, excessive use and finally, increased pollution and a hotter climate. Additionally, considering that some of the parameters used to monitor the changes of this lake such as NDWI have been related to dengue fever cases in research on this connection [67], the increase of these parameters in recent years can be an important alarm for local officials. The obtained results also showed the high correlation of all four calculated parameters. This relationship has been confirmed in previous research in this field [51,68]. This correlation between the 2 parameters, GNDVI and NDTI, was relatively higher and close to 1 in most of the studied months, as the previous research also confirmed this correlation [54]. Furthermore, the correlations between SST and NDTI, as well as GNDVI and NDWI, decreased by 0.1 throughout the summer season, according to the findings. Since the values of the used indices are based on the changes in water dynamics, the high correlation between the variables is proof of the reliability of the used indices and their changes over time.
5. Conclusions

The current research was conducted to evaluate the changes in Chao Lake, China using parameters extracted from satellite images such as GNDVI, NDTI, NDWI and SST for the years 1990, 2000, 2010 and 2020. The obtained results indicated an increase in suspended sediments in water, water turbidity and an increase in water surface temperature over a 30-year period. In order to confirm the findings and ensure the results, the correlation between the used indicators was investigated, which showed a positive and high correlation between different parameters. Additionally, this research is useful for managers, policy-makers and local planners for the purpose of environmental planning to reduce the water pollution of Chao Lake (and other water areas), as well as reducing the risk of environmental hazards caused by the pollution of lake water. Future research should emphasize the methods of validating the indices calculated from small-scale lake water areas obtained from satellite images and measure the amount of changes that have occurred with their values.

Author Contributions

C.L., I.R. and H.Z. proposed the topic, C.L. and I.R. commanded the data processing, analysis and wrote the manuscript. C.L., I.R., H.O. and H.Z. helped to enhance the research design, analysis, interpretation and manuscript writing. C.L., H.O. and H.Z. finalized the manuscript. All authors have read and agreed to the published version of the manuscript.

Funding

This study is supported by Shanghai Municipal Science and Technology Commission within the international cooperation framework of the Youth Scientists from the ‘One Belt and One Road’ countries (2020–2023).

Institutional Review Board Statement

Not applicable.

Informed Consent Statement

Not applicable.

Data Availability Statement

Contact to [email protected].

Acknowledgments

The authors are grateful to Vedurfelagid, Rannis and Rannsoknastofai vedurfraedi-Iceland for their supports.

Conflicts of Interest

The authors declare no conflict of interest.

References

  1. Chen, X.; Zhang, M.; Zhang, W. Landscape pattern changes and its drivers inferred from salt marsh plant variations in the coastal wetlands of the Liao River Estuary, China. Ecol. Indic. 2022, 145, 109719. [Google Scholar] [CrossRef]
  2. He, Q.; Silliman, B.R. Climate change, human impacts, and coastal ecosystems in the Anthropocene. Curr. Biol. 2019, 29, R1021–R1035. [Google Scholar] [CrossRef] [PubMed]
  3. Daya, B.; Pant, K. Biomonitoring of wetland using macrophytes and macroinvertebrates. Malays. J. Sustain. Agric. 2017, 1, 11–14. [Google Scholar] [CrossRef]
  4. Wang, G.; Zhao, B.; Lan, R.; Liu, D.; Wu, B.; Li, Y.; Li, Q.; Zhou, H.; Liu, M.; Liu, W. Experimental Study on Failure Model of Tailing Dam Overtopping under Heavy Rainfall. Lithosphere 2022, 2022, 5922501. [Google Scholar] [CrossRef]
  5. Tian, H.; Pei, J.; Huang, J.; Li, X.; Wang, J.; Zhou, B.; Qin, Y.; Wang, L. Garlic and winter wheat identification based on active and passive satellite imagery and the google earth engine in northern china. Remote Sens. 2020, 12, 3539. [Google Scholar] [CrossRef]
  6. Mansourmoghaddam, M.; Naghipur, N.; Rousta, I.; Ghaffarian, H.R. Temporal and spatial monitoring and forecasting of suspended dust using google earth engine and remote sensing data (Case Study: Qazvin Province). Desert Manag. 2022, 10, 77–98. [Google Scholar]
  7. Rahman, M.T.U.; Tabassum, F.; Rasheduzzaman, M.; Saba, H.; Sarkar, L.; Ferdous, J.; Uddin, S.Z.; Islam, A.Z. Temporal dynamics of land use/land cover change and its prediction using CA-ANN model for southwestern coastal Bangladesh. Environ. Monit. Assess. 2017, 189, 565. [Google Scholar] [CrossRef]
  8. Mansourmoghaddam, M.; Rousta, I.; Zamani, M.; Mokhtari, M.H.; Karimi Firozjaei, M.; Alavipanah, S.K. Study and prediction of land surface temperature changes of Yazd city: Assessing the proximity and changes of land cover. J. RS GIS Nat. Resour. 2021, 12, 1–27. [Google Scholar]
  9. Mansourmoghaddam, M.; Rousta, I.; Zamani, M.S.; Mokhtari, M.H.; Karimi Firozjaei, M.; Alavipanah, S.K. Investigating And Modeling the Effect of The Composition and Arrangement of The Landscapes of Yazd City on The Land Surface Temperature Using Machine Learning and Landsat-8 and Sentinel-2 Data. Iran. J. Remote Sens. GIS 2022. [Google Scholar] [CrossRef]
  10. Basar, A. Water security in coastal region of Bangladesh: Would desalination be a solution to the vulnerable communities of the sundarbans? Bangladesh e-J. Sociol. 2012, 9, 31. [Google Scholar]
  11. Baten, M.A.; Seal, L.; Lisa, K.S. Salinity intrusion in interior coast of Bangladesh: Challenges to agriculture in south-central coastal zone. Am. J. Clim. Chang. 2015, 4, 248. [Google Scholar] [CrossRef] [Green Version]
  12. Tian, H.; Huang, N.; Niu, Z.; Qin, Y.; Pei, J.; Wang, J. Mapping winter crops in China with multi-source satellite imagery and phenology-based algorithm. Remote Sens. 2019, 11, 820. [Google Scholar] [CrossRef] [Green Version]
  13. Le Tixerant, M. Dynamique des activités humaines en mer côtière. In Application à la Mer d’Iroise; Université de Bretagne occidentale-Brest: Brest, France, 2004. [Google Scholar]
  14. Ferdous, J.; Rahman, M.T.U. Developing an empirical model from Landsat data series for monitoring water salinity in coastal Bangladesh. J. Environ. Manag. 2020, 255, 109861. [Google Scholar] [CrossRef]
  15. Nahian, M.A.; Ahmed, A.; Lázár, A.N.; Hutton, C.W.; Salehin, M.; Streatfield, P.K.; Chadwick, O.; Renaud, F. Drinking water salinity associated health crisis in coastal Bangladesh. Elem. Sci. Anthr. 2018, 6, 2. [Google Scholar] [CrossRef]
  16. Rahman, M.T.U.; Ferdous, J. Detection of environmental degradation of satkhira district, Bangladesh through remote sensing indices. In GCEC 2017: Proceedings of the 1st Global Civil Engineering Conference; Lecture Notes in Civil Engineering; Springer: Singapore, 2017; Volume 9, pp. 1053–1066. [Google Scholar] [CrossRef]
  17. Yang, Y.; Li, T.; Wang, Y.; Cheng, H.; Chang, S.X.; Liang, C.; An, S. Negative effects of multiple global change factors on soil microbial diversity. Soil Biol. Biochem. 2021, 156, 108229. [Google Scholar] [CrossRef]
  18. Yang, Y.; Li, T.; Pokharel, P.; Liu, L.; Qiao, J.; Wang, Y.; An, S.; Chang, S.X. Global effects on soil respiration and its temperature sensitivity depend on nitrogen addition rate. Soil Biol. Biochem. 2022, 174, 108814. [Google Scholar] [CrossRef]
  19. Zhao, T.; Shi, J.; Lv, L.; Xu, H.; Chen, D.; Cui, Q.; Jackson, T.J.; Yan, G.; Jia, L.; Chen, L. Soil moisture experiment in the Luan River supporting new satellite mission opportunities. Remote Sens. Environ. 2020, 240, 111680. [Google Scholar] [CrossRef]
  20. Lamghari Moubarrad, F.-Z.; Assobhei, O. The health effects of wastewater on the prevalence of ascariasis among the children of the discharge zone of El Jadida, Morocco. Int. J. Environ. Health Res. 2005, 15, 135–142. [Google Scholar] [CrossRef]
  21. Paraskevas, P.; Giokas, D.; Lekkas, T. Wastewater management in coastal urban areas: The case of Greece. Water Sci. Technol. 2002, 46, 177–186. [Google Scholar] [CrossRef]
  22. Xu, Z.; Wang, Y.; Jiang, S.; Fang, C.; Liu, L.; Wu, K.; Luo, Q.; Li, X.; Chen, Y. Impact of input, preservation and dilution on organic matter enrichment in lacustrine rift basin: A case study of lacustrine shale in Dehui Depression of Songliao Basin, NE China. Mar. Pet. Geol. 2022, 135, 105386. [Google Scholar] [CrossRef]
  23. Cherif, E.K.; Salmoun, F.; Mesas-Carrascosa, F.J. Determination of bathing water quality using thermal images Landsat 8 on the west coast of Tangier: Preliminary results. Remote Sens. 2019, 11, 972. [Google Scholar] [CrossRef] [Green Version]
  24. Selvakumar, A.; Borst, M. Variation of microorganism concentrations in urban stormwater runoff with land use and seasons. J. Water Health 2006, 4, 109–124. [Google Scholar] [CrossRef] [PubMed]
  25. Abdelmalik, K. Role of statistical remote sensing for Inland water quality parameters prediction. Egypt. J. Remote Sens. Space Sci. 2018, 21, 193–200. [Google Scholar] [CrossRef]
  26. Morshed, M.M.; Islam, M.T.; Jamil, R. Soil salinity detection from satellite image analysis: An integrated approach of salinity indices and field data. Environ. Monit. Assess. 2016, 188, 119. [Google Scholar] [CrossRef]
  27. Swain, R.; Sahoo, B. Mapping of heavy metal pollution in river water at daily time-scale using spatio-temporal fusion of MODIS-aqua and Landsat satellite imageries. J. Environ. Manag. 2017, 192, 1–14. [Google Scholar] [CrossRef] [Green Version]
  28. Shahzad, M.I.; Meraj, M.; Nazeer, M.; Zia, I.; Inam, A.; Mehmood, K.; Zafar, H. Empirical estimation of suspended solids concentration in the Indus Delta Region using Landsat-7 ETM+ imagery. J. Environ. Manag. 2018, 209, 254–261. [Google Scholar] [CrossRef]
  29. Le, C.; Hu, C.; Cannizzaro, J.; Duan, H. Long-term distribution patterns of remotely sensed water quality parameters in Chesapeake Bay. Estuar. Coast. Shelf Sci. 2013, 128, 93–103. [Google Scholar] [CrossRef]
  30. Dona, C.; Chang, N.-B.; Caselles, V.; Sánchez, J.M.; Camacho, A.; Delegido, J.; Vannah, B.W. Integrated satellite data fusion and mining for monitoring lake water quality status of the Albufera de Valencia in Spain. J. Environ. Manag. 2015, 151, 416–426. [Google Scholar] [CrossRef] [Green Version]
  31. Binding, C.E.; Greenberg, T.A.; Watson, S.B.; Rastin, S.; Gould, J. Long term water clarity changes in N orth A merica’s G reat L akes from multi-sensor satellite observations. Limnol. Oceanogr. 2015, 60, 1976–1995. [Google Scholar] [CrossRef]
  32. Bugnot, A.; Lyons, M.; Scanes, P.; Clark, G.; Fyfe, S.; Lewis, A.; Johnston, E. A novel framework for the use of remote sensing for monitoring catchments at continental scales. J. Environ. Manag. 2018, 217, 939–950. [Google Scholar] [CrossRef]
  33. Mansourmoghaddam, M.; Ghafarian Malamiri, H.R.; Arabi Aliabad, F.; Fallah Tafti, M.; Haghani, M.; Shojaei, S. The Separation of the Unpaved Roads and Prioritization of Paving These Roads Using UAV Images. Air Soil Water Res. 2022, 15, 11786221221086285. [Google Scholar] [CrossRef]
  34. Mansourmoghaddam, M.; Rousta, I.; Ghaffarian, H.; Mokhtari, M.H. Evaluating the capability of spatial and spectral fusion in land-cover mapping enhancement. Earth Obs. Geomat. Eng. 2022, 6, 161–174. [Google Scholar] [CrossRef]
  35. Hellweger, F.; Schlosser, P.; Lall, U.; Weissel, J. Use of satellite imagery for water quality studies in New York Harbor. Estuar. Coast. Shelf Sci. 2004, 61, 437–448. [Google Scholar] [CrossRef]
  36. Pavelsky, T.M.; Smith, L.C. Remote sensing of suspended sediment concentration, flow velocity, and lake recharge in the Peace-Athabasca Delta, Canada. Water Resour. Res. 2009, 45. [Google Scholar] [CrossRef]
  37. González-Márquez, L.C.; Torres-Bejarano, F.M.; Rodríguez-Cuevas, C.; Torregroza-Espinosa, A.C.; Sandoval-Romero, J.A. Estimation of water quality parameters using Landsat 8 images: Application to Playa Colorada Bay, Sinaloa, Mexico. Appl. Geomat. 2018, 10, 147–158. [Google Scholar] [CrossRef]
  38. Mallick, J.; Hasan, M.A.; Alashker, Y.; Ahmed, M. Bathymetric and geochemical analysis of lake al-saad, abha, kingdom of saudi arabia using geoinformatics technology. J. Geogr. Inf. Syst. 2014, 6, 440. [Google Scholar] [CrossRef] [Green Version]
  39. Hasab, H.A.; Ahmad, A.; Marghany, M.; Ziboon, A.R. Landsat TM-8 Data for retrieving salinity in AL-HUWAIZAH marsh, south of IRAQ. J. Teknol. 2015, 75, 201–206. [Google Scholar] [CrossRef] [Green Version]
  40. Nas, B.; Ekercin, S.; Karabörk, H.; Berktay, A.; Mulla, D.J. An application of Landsat-5TM image data for water quality mapping in Lake Beysehir, Turkey. Water Air Soil Pollut. 2010, 212, 183–197. [Google Scholar] [CrossRef]
  41. Chang, N.-B.; Bai, K.; Chen, C.-F. Integrating multisensor satellite data merging and image reconstruction in support of machine learning for better water quality management. J. Environ. Manag. 2017, 201, 227–240. [Google Scholar] [CrossRef]
  42. Vignolo, A.; Pochettino, A.; Cicerone, D. Water quality assessment using remote sensing techniques: Medrano Creek, Argentina. J. Environ. Manag. 2006, 81, 429–433. [Google Scholar] [CrossRef]
  43. Wang, Y.; Zhang, M. Modeling hydrodynamic and hydrological processes in tidal wetlands. Wetlands 2022, 42, 1. [Google Scholar] [CrossRef]
  44. Yan, Y.; Jarvie, S.; Liu, Q.; Zhang, Q. Effects of fragmentation on grassland plant diversity depend on the habitat specialization of species. Biol. Conserv. 2022, 275, 109773. [Google Scholar] [CrossRef]
  45. Rousta, I.; Mansourmoghaddam, M.; Olafsson, H.; Krzyszczak, J.; Baranowski, P.; Zhang, H.; Tkaczyk, P. Analysis of the recent trends in vegetation dynamics and its relationship with climatological factors using remote sensing data for Caspian Sea watersheds in Iran. Int. Agrophys. 2022, 36, 139–153. [Google Scholar] [CrossRef]
  46. Li, Y.-Y.; Liu, Y.; Ranagalage, M.; Zhang, H.; Zhou, R. Examining land use/land cover change and the summertime surface urban heat island effect in fast-growing greater Hefei, China: Implications for sustainable land development. ISPRS Int. J. Geo-Inf. 2020, 9, 568. [Google Scholar] [CrossRef]
  47. Sun, J.; Ongsomwang, S. Impact of Multitemporal Land Use and Land Cover Change on Land Surface Temperature Due to Urbanization in Hefei City, China. ISPRS Int. J. Geo-Inf. 2021, 10, 809. [Google Scholar] [CrossRef]
  48. Oxford, M. Remote sensing of suspended sediments in surface waters. Photogramm. Eng. Remote Sens 1976, 42, 1539–1545. [Google Scholar]
  49. Chen, S. Scientists Find Way to Stop Algae Poisoning China’s Dirtiest Freshwater Lake. Available online: https://www.scmp.com/news/china/science/article/3023545/scientists-find-way-stop-algae-poisoning-chinas-dirtiest?module=perpetual_scroll_0&pgtype=article&campaign=3023545 (accessed on 5 November 2022).
  50. McMillin, L.; Crosby, D. Theory and validation of the multiple window sea surface temperature technique. J. Geophys. Res. Oceans 1984, 89, 3655–3661. [Google Scholar] [CrossRef]
  51. Mansourmoghaddam, M.; Ghafarian Malamiri, H.R.; Rousta, I.; Olafsson, H.; Zhang, H. Assessment of Palm Jumeirah Island’s Construction Effects on the Surrounding Water Quality and Surface Temperatures during 2001–2020. Water 2022, 14, 634. [Google Scholar] [CrossRef]
  52. Gitelson, A.; Merzlyak, M.N. Quantitative estimation of chlorophyll-a using reflectance spectra: Experiments with autumn chestnut and maple leaves. J. Photochem. Photobiol. B Biol. 1994, 22, 247–252. [Google Scholar] [CrossRef]
  53. Gitelson, A.A.; Merzlyak, M.N. Remote estimation of chlorophyll content in higher plant leaves. Int. J. Remote Sens. 1997, 18, 2691–2697. [Google Scholar] [CrossRef]
  54. Elhag, M.; Gitas, I.; Othman, A.; Bahrawi, J.; Gikas, P. Assessment of water quality parameters using temporal remote sensing spectral reflectance in arid environments, Saudi Arabia. Water 2019, 11, 556. [Google Scholar] [CrossRef] [Green Version]
  55. Lacaux, J.; Tourre, Y.; Vignolles, C.; Ndione, J.; Lafaye, M. Classification of ponds from high-spatial resolution remote sensing: Application to Rift Valley Fever epidemics in Senegal. Remote Sens. Environ. 2007, 106, 66–74. [Google Scholar] [CrossRef]
  56. McFeeters, S.K. The use of the Normalized Difference Water Index (NDWI) in the delineation of open water features. Int. J. Remote Sens. 1996, 17, 1425–1432. [Google Scholar] [CrossRef]
  57. USGS. Landsat-7 ETM+ Handbook; Department of the Interior U.S. Geological Survey: Sioux Falls, SD, USA, 2019. [Google Scholar]
  58. Trisakti, B.; Sulma, S.; Budhiman, S. Study of Sea Surface Temperature (SST) using Landsat-7 ETM (In Comparison with sea surface temperature of NOAA-12 AVHRR). In Proceedings of the 13th Workshop of OMISAR (WOM-13) on Validation and Application of Satellite Data for Marine Resources Conservation, Bali, Indonesia, 5–9 October 2004; pp. 7–10. [Google Scholar]
  59. McMillin, L.M. Estimation of sea surface temperatures from two infrared window measurements with different absorption. J. Geophys. Res. 1975, 80, 5113–5117. [Google Scholar] [CrossRef]
  60. Bernstein, R. Sea surface temperature estimation using the NOAA 6 satellite advanced very high resolution radiometer. J. Geophys. Res. Oceans 1982, 87, 9455–9465. [Google Scholar] [CrossRef]
  61. McClain, E.P.; Pichel, W.G.; Walton, C.C. Comparative performance of AVHRR-based multichannel sea surface temperatures. J. Geophys. Res. Oceans 1985, 90, 11587–11601. [Google Scholar] [CrossRef]
  62. Kang, K.-M.; Kim, S.H.; Kim, D.-J.; Cho, Y.-K.; Lee, S.-H. Comparison of coastal sea surface temperature derived from ship-, air-, and space-borne thermal infrared systems. In Proceedings of the 2014 IEEE Geoscience and Remote Sensing Symposium, Quebec City, QC, Canada, 13–18 July 2014; pp. 4419–4422. [Google Scholar]
  63. Yu, X.; Guo, X.; Wu, Z. Land surface temperature retrieval from Landsat 8 TIRS—Comparison between radiative transfer equation-based method, split window algorithm and single channel method. Remote Sens. 2014, 6, 9829–9852. [Google Scholar] [CrossRef] [Green Version]
  64. Jiménez-Muñoz, J.C.; Sobrino, J.A.; Skoković, D.; Mattar, C.; Cristóbal, J. Land surface temperature retrieval methods from Landsat-8 thermal infrared sensor data. IEEE Geosci. Remote Sens. Lett. 2014, 11, 1840–1843. [Google Scholar] [CrossRef]
  65. Xing, X.; Liu, Y.; Dong, W.; Wang, Z.; Zhang, L.; Sun, Z.; Huang, M. An algorithm to inverse sea surface temperatures at offshore water by employing Landsat 8/TIRS Data. In Proceedings of the 36th Asian Conference on Remote Sensing, Quezon City, Philippines, 19–23 October 2015; pp. 4504–4511. [Google Scholar]
  66. Jang, J.-C.; Park, K. High-resolution sea surface temperature retrieval from Landsat 8 OLI/TIRS data at coastal regions. Remote Sens. 2019, 11, 2687. [Google Scholar] [CrossRef] [Green Version]
  67. Yue, Y.; Sun, J.; Liu, X.; Ren, D.; Liu, Q.; Xiao, X.; Lu, L. Spatial analysis of dengue fever and exploration of its environmental and socio-economic risk factors using ordinary least squares: A case study in five districts of Guangzhou City, China, 2014. Int. J. Infect. Dis. 2018, 75, 39–48. [Google Scholar] [CrossRef] [Green Version]
  68. Veronez, M.R.; Kupssinskü, L.S.; Guimarães, T.T.; Koste, E.C.; Da Silva, J.M.; De Souza, L.V.; Oliverio, W.F.; Jardim, R.S.; Koch, I.É.; De Souza, J.G. Proposal of a method to determine the correlation between total suspended solids and dissolved organic matter in water bodies from spectral imaging and artificial neural networks. Sensors 2018, 18, 159. [Google Scholar] [CrossRef] [PubMed]
Figure 1. Location of Chao Lake as the study area (a) and its Google Earth image for 2021 (b).
Atmosphere 14 00382 g001
Figure 2. The results of Normalized Difference Water Index (NDWI), Normalized Difference Turbidity Index (NDTI), Green Normalized Difference Vegetation Index (GNDVI) and Sea Surface Temperature (SST) indices for each season in Chao Lake, during 1990–2020.
Atmosphere 14 00382 g002
Figure 3. Normalized changes in Normalized Difference Water Index (NDWI), Normalized Difference Turbidity Index (NDTI), Green Normalized Difference Vegetation Index (GNDVI) and Normalized Sea Surface Temperature (SST) indices for each season in Chao Lake during 1990–2020.
Atmosphere 14 00382 g003
Table 1. The characteristics of the images used in the present study.
Satellite/SensorAcquisition DateCloud Cover (%)
Landsat-5 TM13 April 199010
9 December 19900
22 August 19915
25 October 19910
8 April 20001
3 January 200029
2 November 20000
14 January 20101
19 March 20100
10 August 201020
29 October 20109
Landsat-7 ETM+21 July 200015
Landsat-8 OLI9 December 20195.5
15 April 20200.7
2 June 202026.9
24 October 20202.8
Table 2. Calibration constants of ETM+ and TM thermal bands.
SymbolConstant (watts/m2·ster·µm)
K11282.71
K21282.71
Table 3. MCSST correlation coefficients [66].
SymbolCoefficient
a10.9767
a21.8362
a30.0699
Table 4. Changes in Normalized Difference Water Index (NDWI), Normalized Difference Turbidity Index (NDTI), Green Normalized Difference Vegetation Index (GNDVI) and Sea Surface Temperature (SST) indices by year/season for 30 years studied in Chao Lake.
YearNDWINDTIGNDVISST
WINSPRSUMFALLWINSPRSUMFALLWINSPRSUMFALLWINSPRSUMFALL
19900/110/380/440/640/120/020/050/140/150/250/150/231/48/5910/259/06
20000/510/560/520/660/160/060/120/160/190/280/210/244/5610/6922/912/53
20100/770/620/610/690/20/290/130/170/290/420/310/278/0711/4223/7613/53
20200/860/690/960/820/260/370/290/210/420/530/380/338/9313/4326/6415/29
Table 5. Correlation coefficient of Normalized Difference Water Index (1), Normalized Difference Turbidity Index (2), Green Normalized Difference Vegetation Index (3) and Sea Surface Temperature (4) indices for winter of 30 years studied in Chao Lake.
NDWINDTIGNDVISST
NDWI1
NDTI0/91
GNDVI0/91/01
SST1/00/90/91
Table 6. Correlation coefficient of Normalized Difference Water Index (1), Normalized Difference Turbidity Index (2), Green Normalized Difference Vegetation Index (3) and Sea Surface Temperature (4) indices for spring of 30 years studied in Chao Lake.
NDWINDTIGNDVISST
NDWI1
NDTI0/91
GNDVI0/91/01
SST1/00/90/91
Table 7. Correlation coefficient of Normalized Difference Water Index (1), Normalized Difference Turbidity Index (2), Green Normalized Difference Vegetation Index (3) and Sea Surface Temperature (4) indices for summer of 30 years studied in Chao Lake.
NDWINDTIGNDVISST
NDWI1
NDTI1/01
GNDVI0/90/91
SST0/70/80/91
Table 8. Correlation coefficient of Normalized Difference Water Index (1), Normalized Difference Turbidity Index (2), Green Normalized Difference Vegetation Index (3) and Sea Surface Temperature (4) indices for fall of 30 years studied in Chao Lake.
NDWINDTIGNDVISST
NDWI1
NDTI1/01
GNDVI1/01/01
SST0/80/90/91
Disclaimer/Publisher’s Note: The statements, opinions and data contained in all publications are solely those of the individual author(s) and contributor(s) and not of MDPI and/or the editor(s). MDPI and/or the editor(s) disclaim responsibility for any injury to people or property resulting from any ideas, methods, instructions or products referred to in the content.