Article

A Drone Routing Problem for Ship Emission Detection Considering Simultaneous Movements

Logistics Research Center, Shanghai Maritime University, Shanghai 201306, China
*
Author to whom correspondence should be addressed.
Atmosphere 2023, 14(2), 373; https://doi.org/10.3390/atmos14020373
Submission received: 29 December 2022 / Revised: 5 February 2023 / Accepted: 8 February 2023 / Published: 14 February 2023
(This article belongs to the Special Issue Impacts of Air Pollutants Emitted from Ships on Environment)

Abstract

:
Offshore ships’ emission has a tremendous environmental and healthy impact on the port cities and citizens, even though the Emission Control Area (ECA) policy imposes legislative constraints on the ships. It is challenging to detect ships with illegal emissions using traditional administrative and enforcement methods. In addition to a system of ships’ emission detection, a drone-based detection system is investigated, and a drone routing problem is formulated considering the distinct feature: the drone flying while ships move simultaneously. A nonlinear program is devised, and heuristics algorithms are developed to solve the test instances. The numerical experiments demonstrate the feasibility and advantages of using drone routing solutions. The solution algorithm can solve large samples with 50 ships within 2 s, and the computing time is almost linear to the number of ships. The proposed model and algorithms should contribute to drone-based ship emission detection and a featured routing problem.

1. Introduction

1.1. Background

Greenhouse gas (GHG) causes global warming and threatens the living environment of human beings [1]. Green and low carbon have become essential topics for the balanced development of the world economy [2]. Internet technology accelerates the iteration speed of global information flow, promotes the process of economic globalization, and is accompanied by the vigorous development of international trade and the global supply chain. As a reasonable transportation mode with economies of scale, ocean shipping carries more than 80% (weight) of the world’s international trade goods. With prosperous international transportation, the world’s shipping fleet’s carbon dioxide (CO2) emissions will increase by nearly 5% (weight) from 2020 to 2021 [3]. The fuel consumption of ships during shipping and berthing will emit pollutants such as nitrogen oxides (NOx), inhalable particulates (PM10), and sulfides (SOx). Due to the lack of tail gas filtering devices installed on ships, this pollutant has become an essential source of environmental pollution in marine and coastal areas [4]. According to the report of the International Maritime Organization [5], CO2, SOx, and NOx account for 2.6%, 13%, and 15% (weight) of the world’s annual emissions, and 70% (weight) of the ship’s exhaust emissions are in the offshore area less than 400 km from the land. As a multimodal transport hub, with the increase in the density of docked ships, the port continues to drive the work of fuel machinery and equipment around ships and cargo operations inside and outside the port area, increasing the environmental pollution of the port area. The waste gas emissions of port cities are much higher than those of other cities [6].
China’s port clusters are mainly distributed in the Yangtze River Delta, the Pearl River Delta, and the Bohai Rim. The population density of port cities in each region is relatively high, especially in the densely populated city clusters in Shanghai and the Yangtze River Delta. COx, Sox, and NOx discharged from ships have apparent temporal and spatial effects. The discharge area mainly involves the port area and the junction area. Among them, the Yangtze Estuary and the waters of Hangzhou Bay, Yangshan Deepwater Port, Ningbo Beilun Port, and the northern channel of Shanghai have significant emissions [7]. The physical and chemical properties and emission scale of pollutants affect urban and regional air quality, including NOx and Sox, which are the most harmful. This primary emission will induce acid rain, acid fog, and toxic smoke, damaging the local natural environment and accelerating the global greenhouse effect [8]. The pollution gas emitted by ships is enveloping the port cities, causing great harm to the health of coastal and riverside residents. The maritime authorities must control and supervise the exhaust emissions from ships.
In recent years, governments and the International Maritime Organization (IMO) have paid more and more attention to shipping emissions as the primary source of environmental problems [9], limiting the emission of pollutants from ships by formulating emission control measures and regulations [10], such as preparing a list of ship emissions [11], collecting fuel taxes [12], and purchasing low sulfur fuel subsidies. Establishing an emission control area (ECA) [13] is significant. Among them, establishing ECA is the most widely used control means. The idea of ECA is to set up a scope based on the waters around the port. After entering a specific area around the harbor, ships must use fuel with low sulfur levels to effectively reduce the harm of sulfide, inhalable particles, and other pollutants to the port city. Once the sulfur content of a ship exceeds the standard, ECA participating countries will impose severe penalties on it and may even detain the ship [14]. Four ECAs have been identified by the International Maritime Organization (IMO) worldwide, mainly distributed in developed countries such as Europe and North America. All ECA conventions and decrees related to the use of fuel oil are mainly based on Annex VI of the International Convention for the Prevention of Pollution from Ships (MARPOL) formulated by IMO, as well as the current regulations of regional governments [15].
China implements the Law of the People’s Republic of China on the Prevention and Control of Air Pollution to promote the development of green shipping, energy conservation, and emission reduction of ships. By setting the space and time range of ECAs, taking key areas as practice, and gradually expanding ECA’s geographical coverage, China reduces atmospheric pollutants emissions from ships. The Implementation Plan for Ship Emission Control Zones in Pearl River Delta, Yangtze River Delta, and Bohai Rim (Beijing Tianjin Hebei) Waters [4] issued by the Ministry of Transport has been implemented since 1 January 2016. Ships shall strictly enforce the current international conventions and domestic laws and regulations on NOx, PM10, and SOx emission control requirements. This plan is aimed at limiting the use of fuel oil with a sulfur content not higher during berthing. The Implementation Plan for Ship Air Pollutant Discharge Control Area formulated by the Ministry of Transport came into effect on 1 January 2019, which extended the scope of ECA to coastal waters nationwide and inland waters along the Yangtze River and the West River. First, it continues to implement the fuel oil standard with a sulfur content limit for ships and limit it to all waters within ECAs. Then, it improves the fuel oil standard with a sulfur content for seagoing ships, implements it in inland waters from 1 January 2020, and expands it to Hainan waters in coastal control areas after 1 January 2022.

1.2. Problem

Although laws and regulations related to ECAs have been issued, using low-sulfur fuel for ships will lead to additional navigation costs, resulting in frequent violations by many ship operators. Historical cases show that the proportion of noncompliant ships is as high as 12.3% [16]. The maritime supervision department should adopt effective monitoring methods to timely identify the ships that use illegal fuel oil during the driving process in ECA. In the traditional way of determining fuel oil, firstly, the problem ships with abnormal exhaust emissions are selected for visual observation, then the fuel oil is sampled on board and sent to the third-party inspection department for analysis. Finally, the relevant index parameters of the oil sample are used as the basis for whether the ship’s emissions exceed the standard. The characteristics of this traditional method, such as the complex sampling process, long test result cycle, and high personnel and equipment investment cost, lead to low sampling rate and monitoring efficiency, and it is not easy to achieve the emission reduction target of ship air pollutants. To break through the disadvantages of traditional monitoring methods, microsensors and remote sensing measurement technologies [17] using remote sampling means, such as laser radar and differential optical absorption spectroscopy, are used to measure the SOx and NOx contents in the exhaust gas emitted by ships [18], strengthening the ECA supervision.
With the development of drone-related technology, the sensor equipment of a drone is used to determine the pollutant density above the ship, to realize the close sampling and monitoring of monitoring equipment [19]. The drone with monitoring equipment reduces the real-time monitoring of ship exhaust gas in the detection link. This low-cost monitoring means can achieve rapid monitoring, effectively cover the number of ships, and is widely used in the shipping industry [20]. To maximize the actual effect of drone monitoring, a single drone will undertake the detection task of multiple ships in ECA due to the limitation of drone scale to improve drones’ travel efficiency [16]. In the drone scheduling scene of ship exhaust monitoring, due to the lack of practical scheduling algorithms, there are many problems: the drone flight direction is not accurate, and the flight efficiency is low; the endurance planning of the drone is unreasonable, and the drone is forced to return due to power shortage. At the same time, considering that the procurement cost of appropriate monitoring equipment and drones is increasing with the number of monitoring ships, determining how to effectively plan the drone flight route is an urgent problem to be studied [21]. However, in the scheduling of ship exhaust monitoring drones, the location of heterogeneous ships and ships with different emission scale attributes changes at the same time, leading to changes in the selection of drone detection ships and flight time, further improving the difficulty of scheduling planning.

1.3. Solutions

Drone sniffing technology is an effective law enforcement tool for sulfur limitation. In the manner of drones patrolling for thousands of ships entering and leaving the port, it first uses drones to detect and screen the ships that exceed the standard, send the data back to the land monitoring system in real time, quickly lock the ships that exceed the standard, and then the law enforcement personnel on the shore lock the ships that violate the standard and accurately implement the inspection. Drones can be equipped with sulfur-sniffing devices to measure sulfur emissions from ships. For the supervision of ship exhaust emissions, the current practice requires many supervisors to screen or conduct surprise inspections on incoming and outgoing ships, which is insufficient in monitoring strength and coverage and wastes many workforce and material resources. The periodic ECA monitoring using drone sniffing technology can effectively improve detection efficiency and quality and save costs. The monitoring system of drone sniffing equipment is mainly composed of a rotor drone, sniffing sensor module, flight controller, fast screening system of ship emissions, etc. It can transmit data through a 4G network and monitor real-time data through a cloud platform. Before carrying out the monitoring task, it selects the target ship, estimates the flight path of the drone according to the speed, sailing direction, ship plume (airflow caused by the exhaust difference of the ship’s internal combustion engine), and other information on the target ship, processes the obtained data, and determines the flight plan of the drone. Due to the wide range of inspection sea area and the uncertainty of climate conditions, the use of drones will also incur related costs. Optimizing the patrol path can reduce the operations cost of the drone.

1.4. Organization

The remaining sections are organized as follows. In Section 2, the related studies on ships’ emissions and drone routing problems are reviewed. Then, Section 3 investigates the components and modules in the drone-based ship emission detection system. As a critical system component, the drone routing problem is formulated and solved by heuristics in Section 4 and Section 5. A series of numerical experiments are conducted to examine the proposed models and algorithms in Section 6. Finally, the study is concluded in Section 7.

2. Related Studies

2.1. Air Pollutants Emitted from Ships

The establishment of the sulfur restriction order and ECA has promoted the transformation of ships, but at the same time, it has also increased ships’ transformation and operation costs. Implementing ECA and the sulfur restriction order has a substantial adverse economic effect on the shipowner. The high transformation cost, high operation cost, low violation cost, and single supervision mode lead to the shipowners taking risks and not complying with the regulations. With rising fuel costs, liner companies, including Maersk Shipping, Mediterranean Shipping, Dafei Shipping, and Hebron Shipping, have indicated that they will charge additional fuel surcharges. Increasing the overall cost of the shipping industry, which is at the bottom of the industry cycle, may lead small- and medium-sized shipowners to take risks.
Due to the lack of uniform enforcement regulations, the enforcement of IMO rules by various countries varies significantly in terms of monitoring strength and punishment, including fines and detention. Subject to the jurisdiction of domestic laws, most of the regulations are relatively vague, there are many gray areas for law enforcement, and the illegal cost is relatively low. At the same time, due to the single and insufficient regulatory means, the monitoring and supervision of illicit ships are limited, making the actual number of violations of ship emissions higher. If the fuel used by a ship is not in compliance with the standard and will pose a danger to the ship itself, other ships, and the environment, the port state can inspect the ship and impose penalties, including imposing fines or even detaining fines. Overall, the monitoring mode of ship pollutant emissions has problems such as delayed regulatory effectiveness, limited regulatory scope, and distorted monitoring process, which greatly restrict the fairness and strength of regulatory enforcement. Recently, new technologies, such as drones with air detection functions for monitoring, have emerged, iterated, and been placed into use, which provides a unique solution to the regulation of ship air pollutant emissions.
Table 1 summarizes some pioneering studies on ship emissions and impacts in three aspects: research problem, research method, and corresponding regions or ports. Most studies examined the emission estimation problem, including ship-activity-based, data-driven, comparison, and comprehensive analyses. Ship-related data acquisition devices and information systems are typical research data sources, typically including devices of an automatic identification system (AIS) and Global Positioning System (GPS).

2.2. Drone Applications in Ship Emissions Detection

A drone is an unmanned aerial vehicle operated by radio remote control equipment or its program control device. The drone has the advantages of low cost, flexibility, low safety risk, and high efficiency. Compared with traditional vehicles, it has a higher degree of automation and is unmanned, can overcome some geographical obstacles, has a faster speed of movement, and can monitor and transmit information in real time. It plays a vital role in military activities, environmental monitoring, forest fire prevention, border defense, and smuggling suppression, aerial photography [41], geospatial exploration [42], power grid pipeline patrol, traffic management, urban security, logistics distribution, and post-disaster search and rescue [43].
Drones are widely used in atmospheric environment monitoring due to their economy, portability, and easy operation advantages. The drone’s remote sensing technology applied to environmental monitoring has formed a professional industrial drone through a variety of high-precision intelligent gas sensing equipment specially designed for drone atmospheric environment monitoring function, such as air component gas detectors. It cooperates with the ground monitoring system to view the gas data and pollution of the environment where the drone is located in real time. The industrial air monitoring drone is attaining more extensive and mature applications in regional environmental monitoring, environmental law enforcement, and environmental inspection. A drone can monitor the emission of atmospheric pollutants from ships in an all-around way, monitor air quality in the air, and effectively monitor specific areas quickly. It has high flexibility, fast response, and can efficiently lock the location of pollution sources. At the same time, drones also have some problems, mainly due to short flight time and limited battery life. The endurance limits the monitoring vision of the drone. The drone patrols the sea area, especially in the open sea waters far from the coast. The flight cost of the drone is expensive. The drones most widely used in environmental protection are equipped with visible light cameras. However, observing atmospheric pollutants by the visible light camera only stays in the photography stage, and video lacks accurate monitoring data as support. Due to light, rain, fog, low camera resolution, and other factors, it can only monitor visual pollution sources with high pollution density (such as a black chimney, straw burning, etc.). In addition, in environmental protection, there are drones equipped with infrared thermal imagers, enabling drones to monitor at night. The thermal distribution visualization, temperature measurement, and other characteristics of the thermal imagers can effectively find sewage enterprises that produce at night, which can be used to curb night emissions. However, environmental conditions significantly affect the thermal imager, and different types of enterprises have various heat distribution forms, so the emission temperature and emissions are not necessarily related, and the relevant models are complex. It takes a long time to compare and monitor to reach the detection conclusion, which makes it challenging to meet the urgent needs of environmental monitoring.
The maritime drone has the following significant advantages by carrying such mission loads as photoelectric equipment, airborne AIS, airborne VHF (very high frequency), hyperspectral imaging equipment, sea search radar, oil pollution sampling equipment, etc., to achieve the main functions of cruise law enforcement, administrative inspection, search and rescue emergency, oil and chemical pollution emergency, communication relay, maritime security, navigation mapping, etc. First, the naval drone is small, light in weight, fast in-flight speed, low in takeoff and landing site requirements, and prompt in response. Second, the speed of maritime drones is 3~10 times that of sea patrol ships carrying mission loads. With the advantages of a high overhead position in the air and a wide range of equipment monitoring the horizon, the scope of supervision is expanded by stages compared with sea patrol ships. Third, the operation cost of maritime drones is low. The procurement cost of maritime drones is lower than manned aircraft and sea patrol boats. The training cost is low, and the training duration is extended. In addition, drones’ fuel consumption or power consumption cost per unit voyage is far lower than that of sea patrol boats and manned aircraft. The fourth is the safety of maritime drones, which can adapt to severe weather without personnel safety risks.
Drones have more advantages in the maritime environment than manned aircraft and patrol boats. The procurement cost of a drone is much lower than that of manned patrol aircraft. Drones can perform various detection, supervision, and rescue tasks excellently by equipping them with specific airborne mission equipment. The drone takes off without any auxiliary devices. Large patrol ships or manned aircraft are large and weight. Although the fuel consumption per unit weight is low, the cost is much higher than that of drones based on cruise mileage.
Maritime flight requires pilots with rich driving experience and the ability to control at night and in bad weather. The drone does not need experienced pilots to operate it. After training in operation technology, ordinary personnel can control the aircraft track and speed through a measurement and control vehicle or a ship measurement and control device. The training cost is low. Large patrol ships need to build high-level berthing docks, and the daily maintenance cost is high. Building a large hangar for manned patrol aircraft is necessary to facilitate daily maintenance. The drone can take off in a narrow space without building a special dock or hangar, and the daily maintenance cost is low. Although the design and construction safety factor of ships and manned aircraft is very high, in severe weather conditions, rare events such as damage and crash may occur. When performing tasks, drones only need to carry appropriate mission equipment. Even in extreme weather, the most common problem is that they cannot be recovered due to accidents. There is no risk to personnel safety, so the risk cost is low. In general, the effective radiation area of drones is more than 12 times that of ships. A drone can reach the target to the maximum extent to obtain reliable information on ship emissions.
With the increasingly stringent emission laws and regulations, the pressure on maritime authorities to monitor and supervise the emission of atmospheric pollutants from ships has also increased. Currently, the monitoring means used by law enforcement personnel of the Maritime Administration is to directly board the ship for oil pumping and testing, which significantly reduces the law enforcement efficiency of law enforcement personnel and improves the labor cost. Taking Shanghai as an example, the detection rate is less than 0.5%. The drone has incomparable advantages in the dynamic management of ships, antipollution monitoring, law enforcement, and evidence collection due to its benefits such as lightness, flexibility, and convenient loading. The drone loaded with gas detection equipment can quickly detect the density of the ship’s exhaust gas when flying along the route of the port area. Based on the sulfur content of the fuel oil and the SO2 in the exhaust gas, the range of sulfur content in fuel oil can be estimated.
There are also challenges to using drones. First, the endurance is limited, ranging from tens of minutes to several hours. This vehicle mainly relies on two power sources. One is the battery, and the other is fuel. Due to size and load limitations, drones generally only install tiny batteries or fuel tanks, resulting in a lower range than ordinary vehicles. Before the drone runs out of battery or fuel, it must return to the base station to replenish energy. Secondly, the fixed cost of purchasing drones and the variable cost caused by regular use are not small. The drone is a relatively new vehicle. Although it has become increasingly advanced and mature, its use cost is still relatively high.
Table 2 summarizes some studies on drones applied to ships, especially ship emissions. Here, drones are used to detect the pollution degrees of ECAs and verify the emissions of specific ships. This study extends these studies and focuses on a more concrete problem: the drone routing problem considering ship movements.

2.3. Incremental Contributions

As studied in Section 2.1, most studies examined the emission estimation problem, including ship activity-based, data-driven, comparison, and comprehensive analyses. However, fewer studies are concerned with drone-based emission-detection systems, and general frameworks may help develop holistic solutions. As studied in Section 2.1, although some studies recognized drones applied to emission detection, the applications, especially the scheduling models, are seldom studied.
This study contributes to the studies on ship emission detection and the drone routing problem. The pollution produced by ocean transportation increasingly impacts the ocean and offshore environments. As a great startup to restrict emissions, many countries have released the ECA policies and set the regions where the ships must use cleaner fuels. However, the detection and management methods still find it challenging to balance the administrative costs and effects at this stage. A drone-based emission detection system is a lightweight and costless solution. This study identifies the solution through four levels: the system framework, the functionality components, the drone modules, and the drone routing method. Second, the drone routing problem is extensively examined in the study because of its distinct features. When a drone is scheduled and directed to accomplish the emission detection tasks, the drone flies while the ships travel in the ECA simultaneously. This study formulates this problem and solution methods for it.

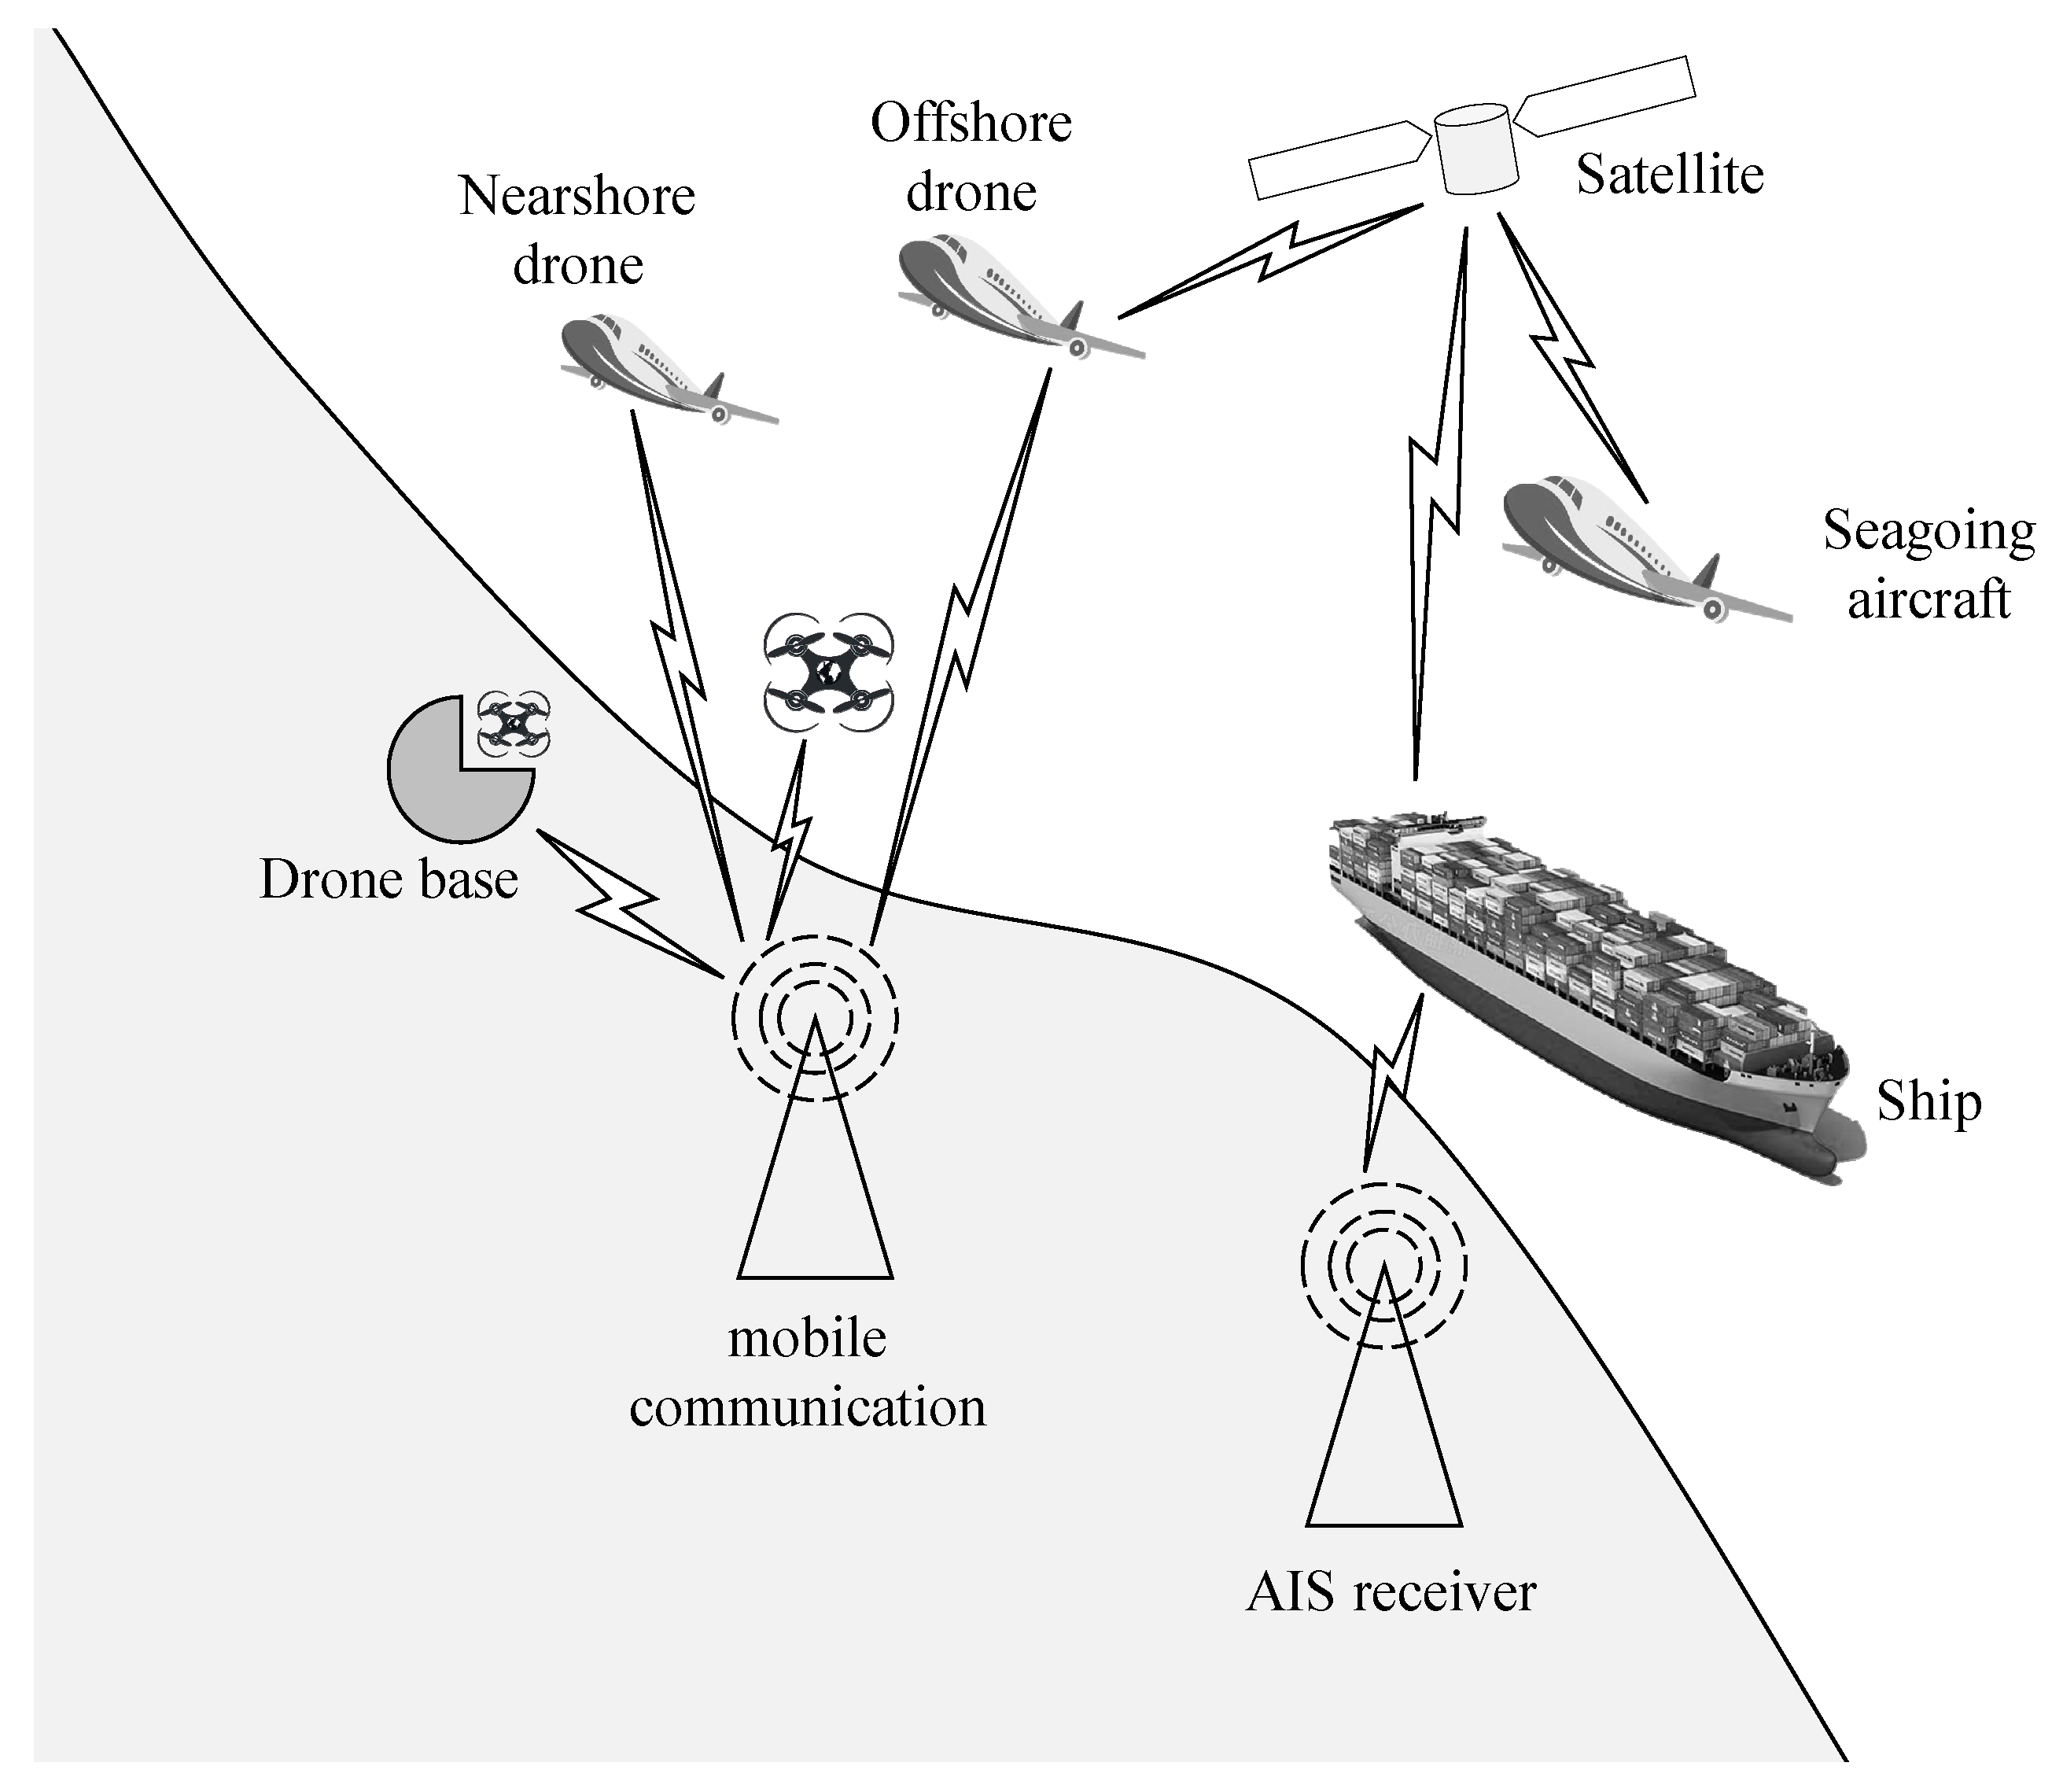
3. Systematic Schemes for Detecting Ship Emissions by Drones

Implementing policies and effects in ship ECAs requires vital regulatory means as a guarantee. At present, the maritime department mainly implements supervision on the sulfur content of ships’ fuel oil in the ECA by inspecting the fuel oil quality, fuel supply, and receipt documents, recording documents and other relevant requirements in the control area during the onsite law enforcement process, and sampling and testing the fuel oil as appropriate. There are shortcomings, such as random inspection objectives, weak pertinence, and relatively low efficiency.
The maritime supervision departments generally use two standard methods to detect ships’ emissions: the optical method that can be remotely monitored and the sniffing method that can directly sample the emissions. The ship emission detection system mainly uses drones to carry the exhaust monitoring pod to complete the detection and transmission of ship exhaust. It uses extraction equipment (sniffer) to measure the ratio of SO2 (ppb) and CO2 (ppm) in the downwind direction of the ship exhaust plume to obtain the sulfur content (%) of the fuel. The exhaust gas monitoring pod using sniffing technology has the characteristics of small size, easy to carry, etc. It can be used to screen seagoing ships with fuel sulfur content exceeding a specific ratio for maritime law enforcement personnel to target boarding inspection. The ship emission detection system consists of the drones as carriers, the exhaust detection pod, and the ground data server. During the system’s regular operation, the remote-control drone carries the tail-gas-sniffing sensor to fly to the ship’s tail gas plume to collect SO2 and CO2. For the density data of other gases, it records the time information, calculates the sulfur content of ship fuel, and completes the data integration and packaging process.

3.1. The Cyber-Physical System

The drone-based ship emission intelligent detection system uses the drone-loaded gas detection equipment to collect the density values of various pollutants in the ship exhaust in real time from multiple angles and transmit the data to the cloud. Each mobile terminal can display the exhaust density degrees and indirectly detect the sulfur content range in the fuel oil through the inversion algorithm of the material balance principle. In addition, it can also be used for atmospheric environmental quality detection. The pollutant gas detection part is designed in a modular way, and multiple gas sensors are installed at the same time. The gas sensors can also be replaced to detect different gas densities. The UAV ship exhaust intelligent detection system is mainly composed of a ship emission smart detection drone, cloud platform, AIS base station, ground UAV base, mobile terminal, remote monitoring center, etc., as shown in Figure 1.
The drone-based ship emission detection system obtains the ship information sent by the AIS base station according to the cloud of the Internet of Things and flies to the ship’s rear to be detected. The drone can locate the ship’s chimney with its thermal imaging module. The wind speed and direction detection module and the laser ranging module enable the drone to calculate the distance of emissions in the downwind area of the ships. The negative pressure generated by the gas collector will suck in the ship’s tail gas. After the tail gas is dehumidified and filtered through the gas sampling interface, it will enter the gas sensor group for density detection, and the data will be transmitted to the cloud. Each mobile terminal can display the tail gas density and indirectly detect the sulfur content range in the fuel oil through the inversion algorithm of the material balance principle, helping the regulatory authority to complete the remote, rapid, and accurate preliminary screening work.

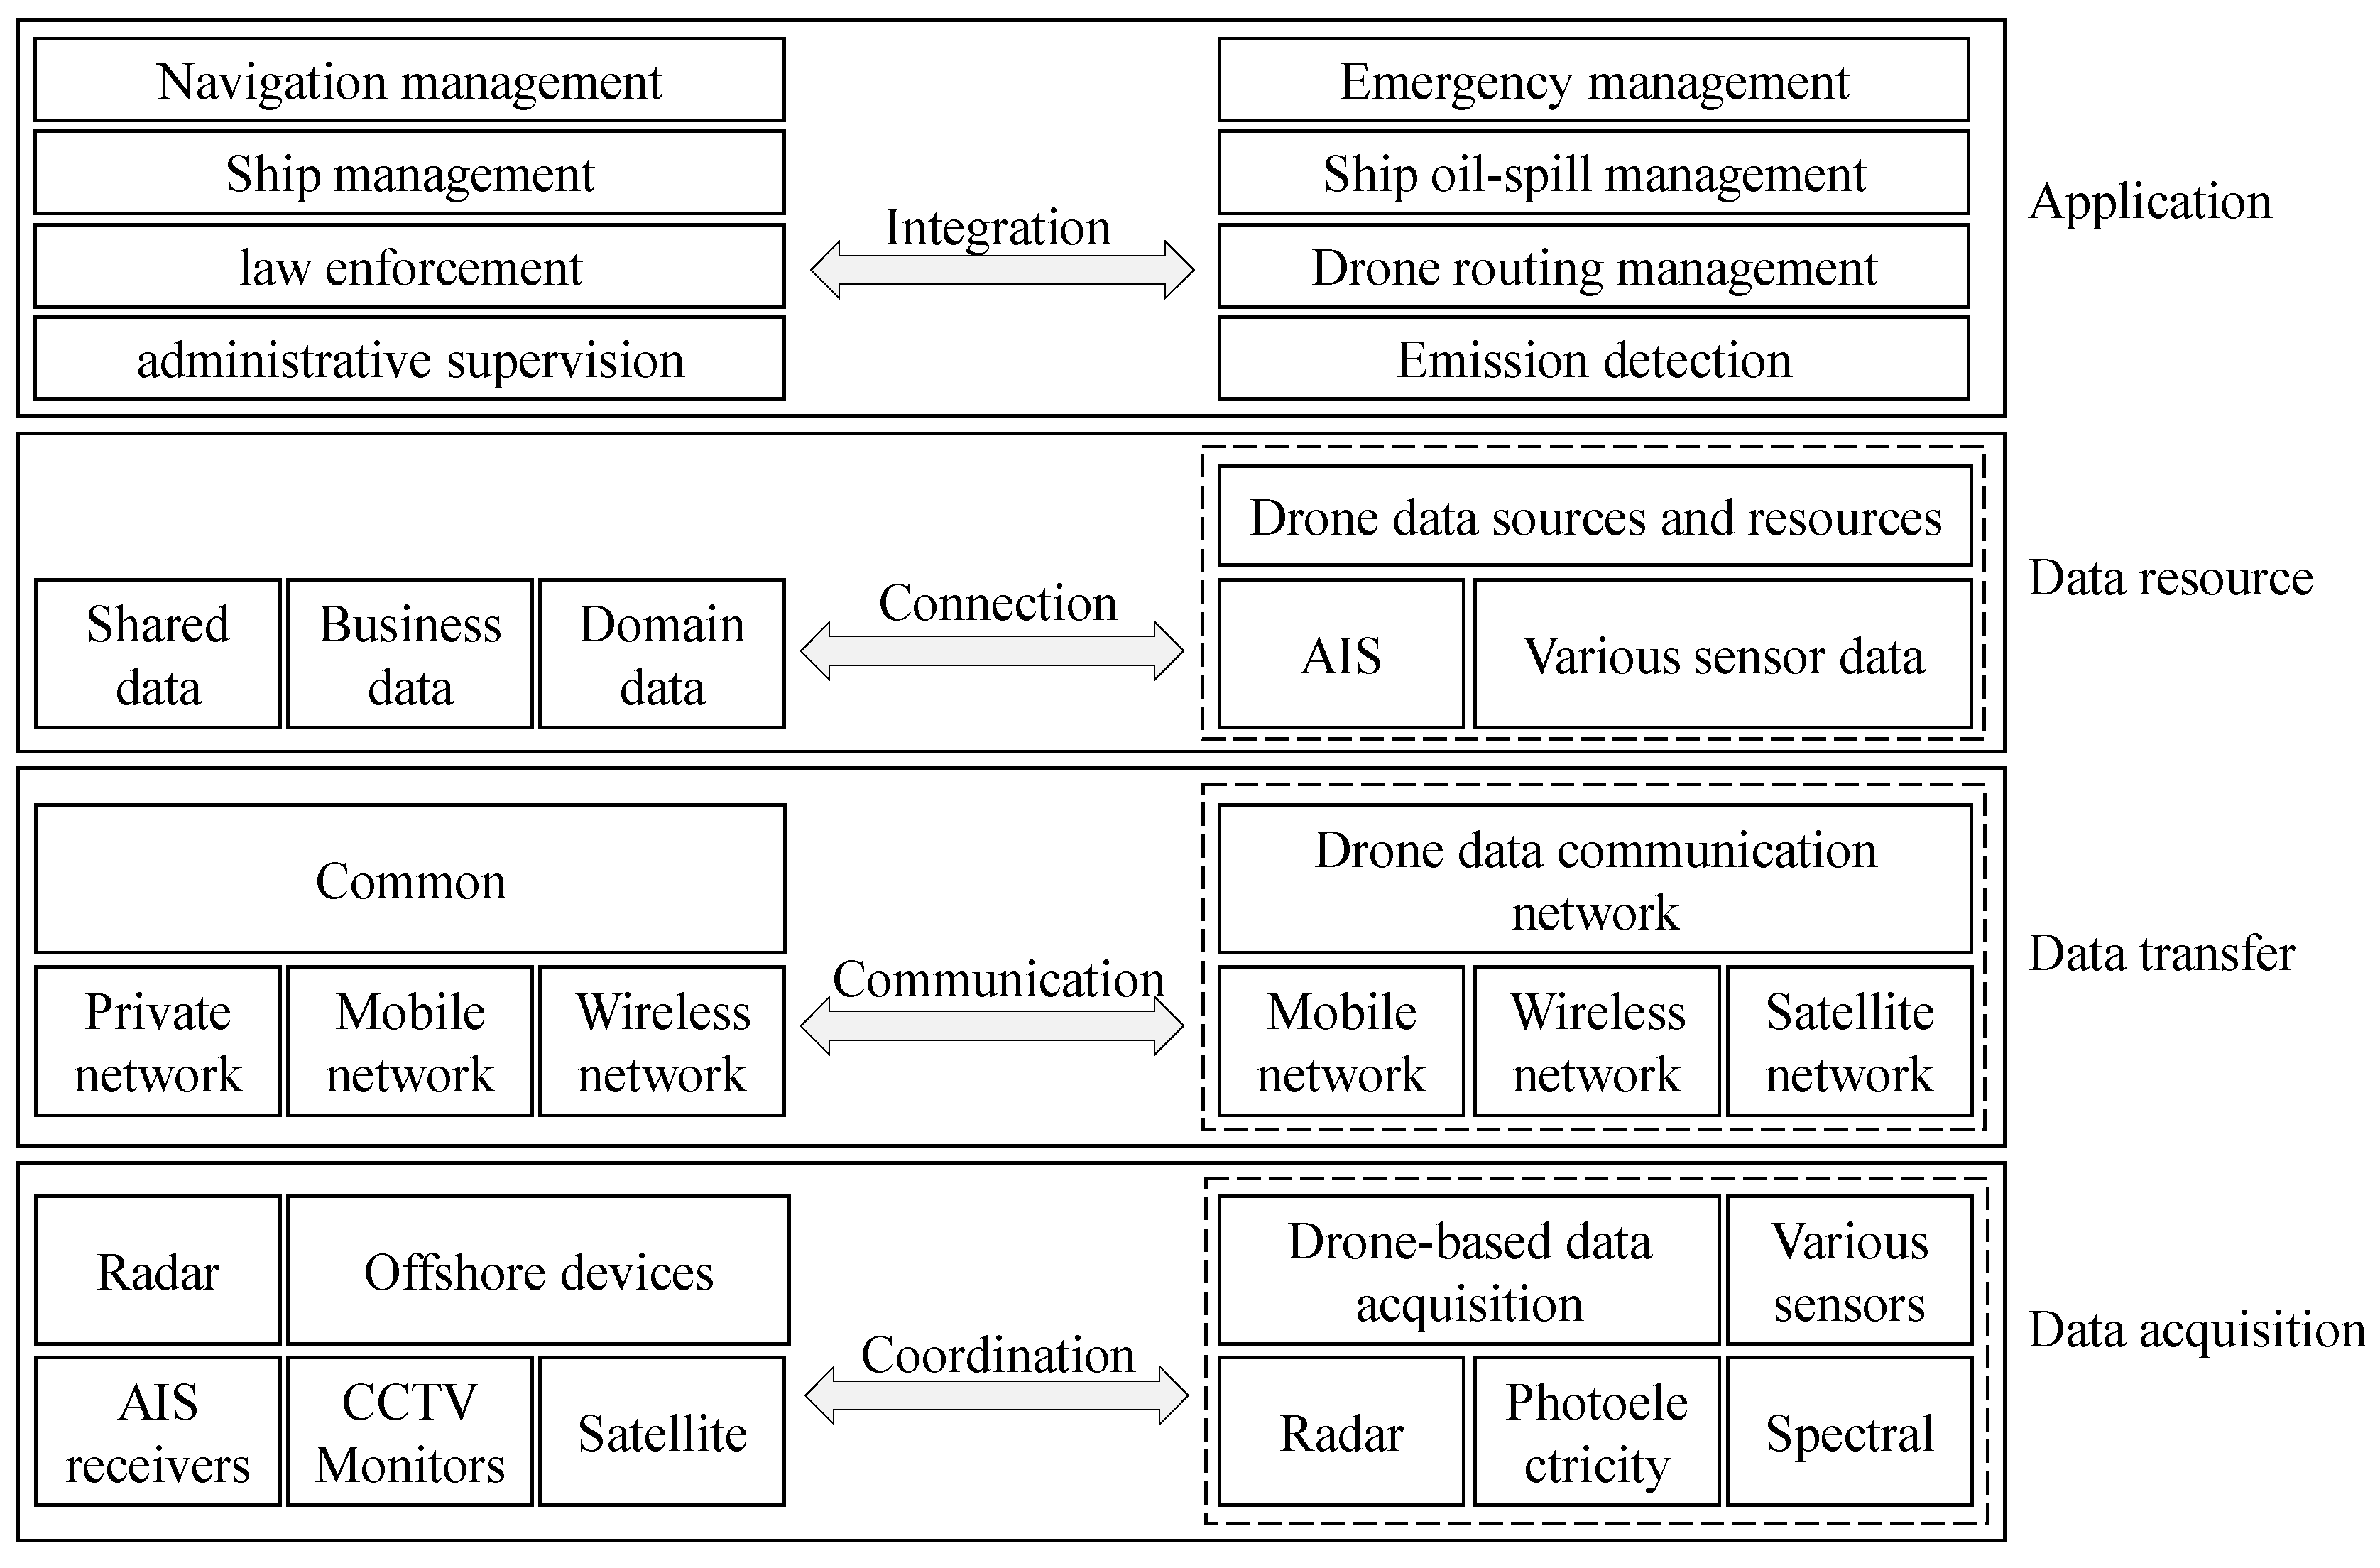
3.2. The Functionality Components

3.2.1. The System Framework

The overall structure of the drone-based ship emission detection system is shown in Figure 2. It consists of four layers: data acquisition, data communication, data resources, and application layer.

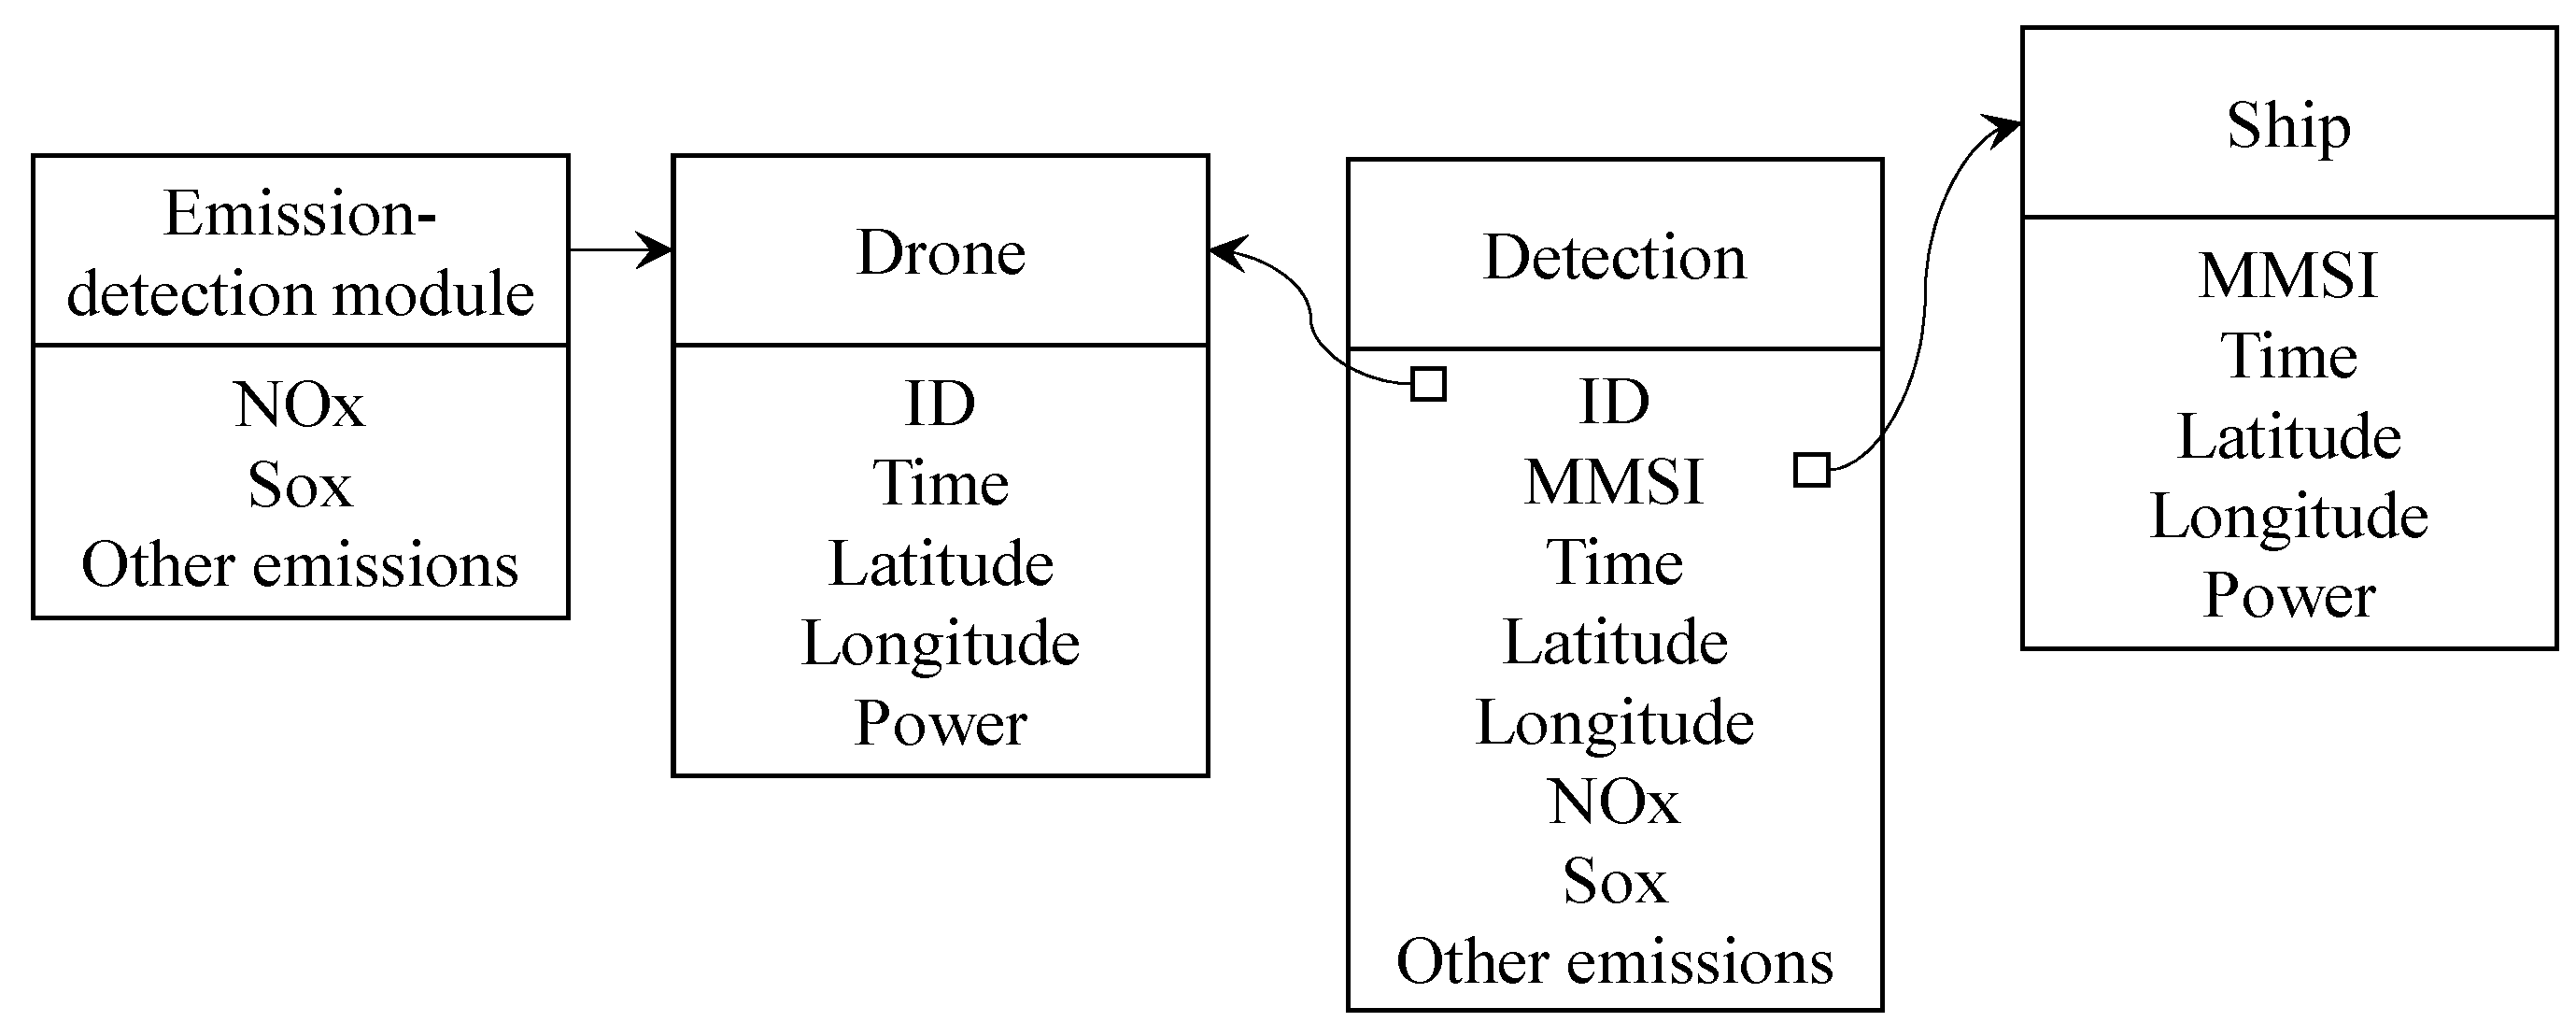
3.2.2. The Primary Data Model

The database ER diagram design is shown in Figure 3, and the entities mainly comprise “Drone”, “Emission-detection module”, and “Ship”. The “Drone” entity includes longitude, latitude, and current time information. The “Emission-detection module” entity includes SO2 and NOx. The “Ship” includes MMSI and other information. The “Drone” is connected one-to-one with the “Emission-detection module”. A connection entity entitled as “Detection” builds the many-to-many relation between “Done” and “Ship”.

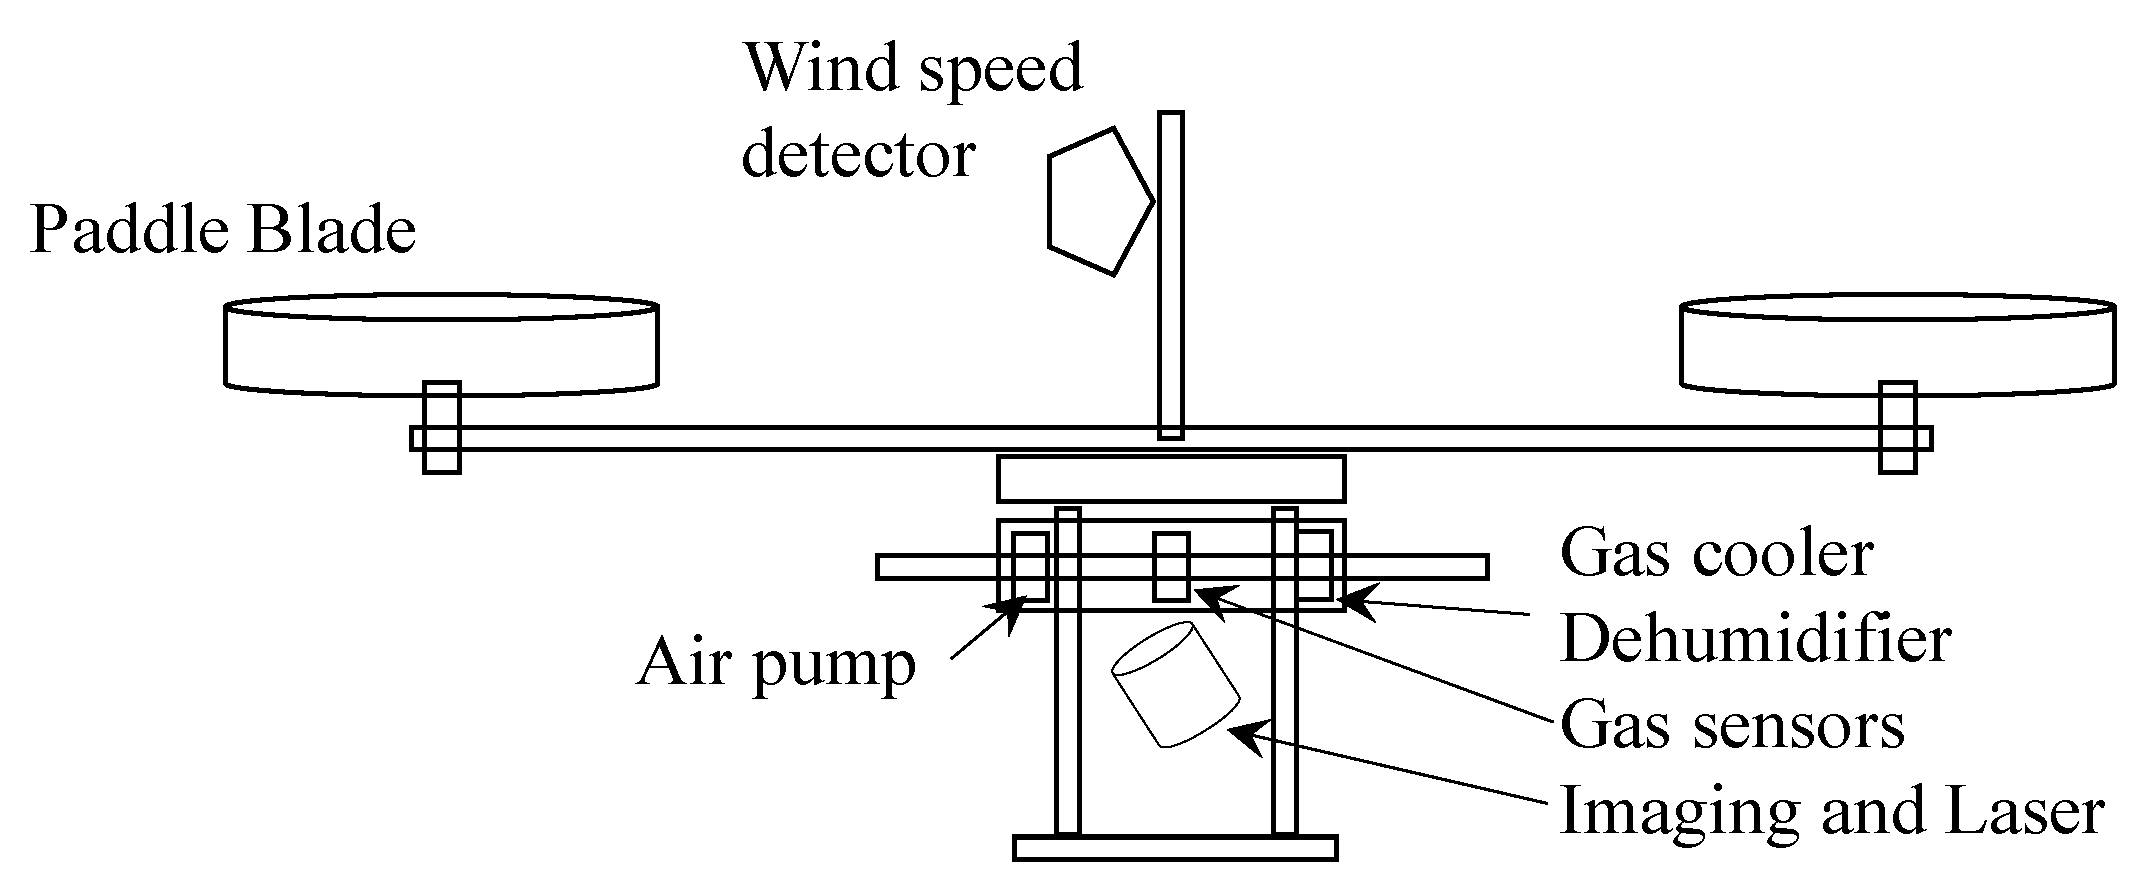
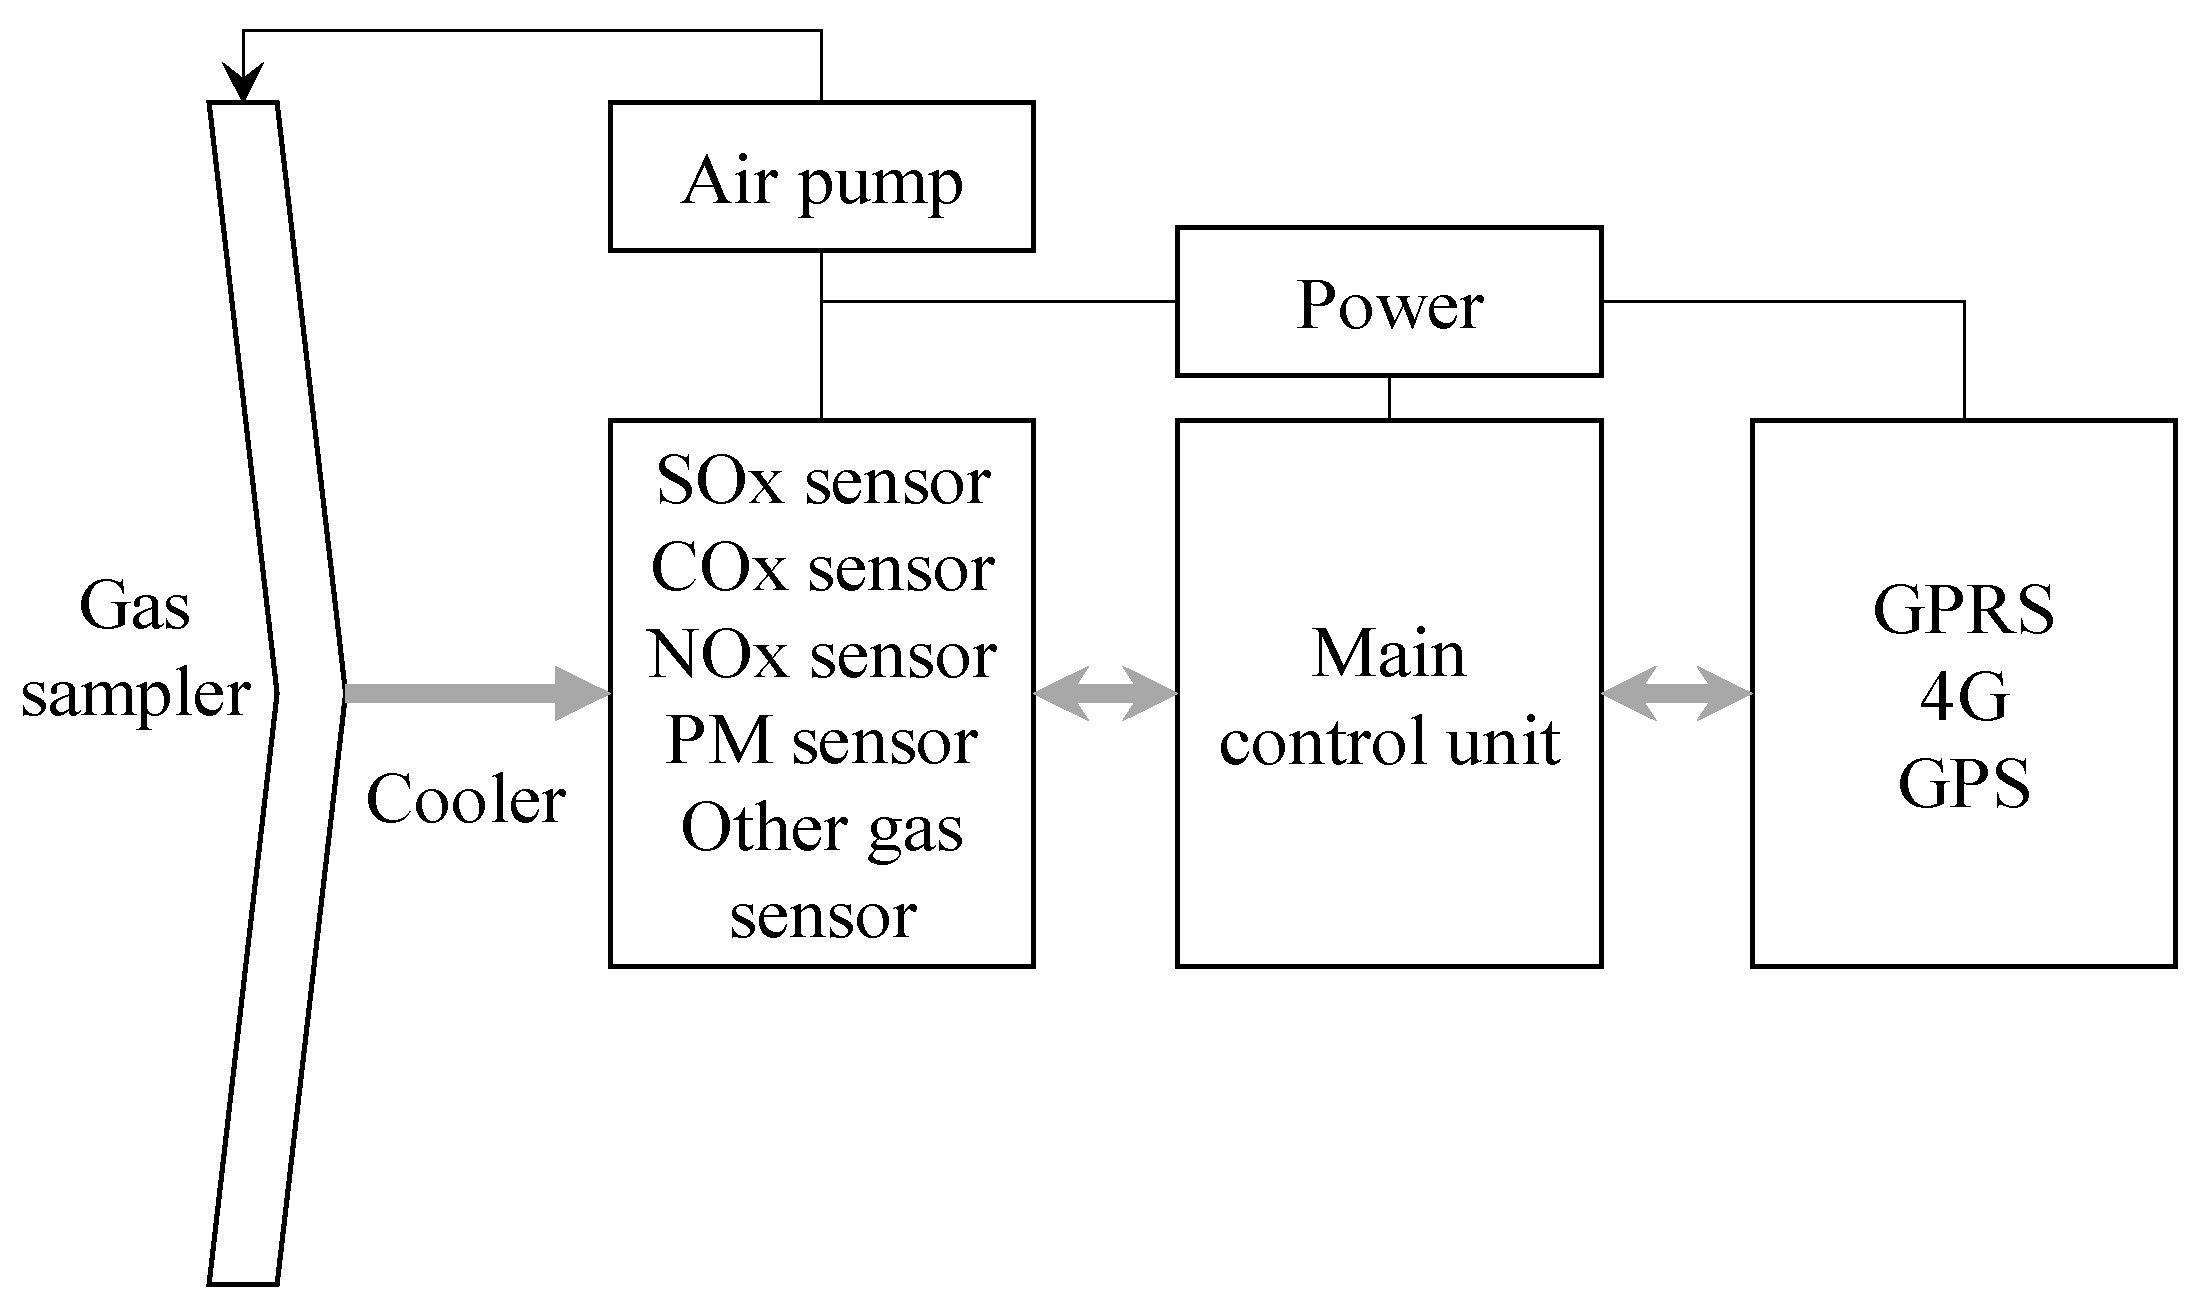
3.3. The Drone Modules

The drone-based system consists of five parts: a drone base, the central control station (radio remote control and telemetry device), a launch system, a collection system, and mission equipment. The central control station can plan the drone’s route, remotely control and telemetry the flight attitude, master the drone’s air attitude and flight status at any time, and perform corresponding tasks. The drones must be recycled and reused, so there must be a launch system and recovery system. They also need to carry related task equipment when performing related tasks, such as maritime patrols, power grid patrols, military applications, etc.
The ship emission detection system comprises an emission sensing module, power supply system, pod shell, exhaust gas data control, processing and transmission system, GPS module, drone control software system, and server system. Users can attach the ship emission detection system to the drone rack and control part of the working state of the monitoring pod system through GSM mode at the remote-control end of the drone during the actual operation of the system. At the same time, the ship emission detection system transmits the monitored emissions data and GPS data to the data server through GPRS.
The ship emission detection system is mainly equipped with NO and CO by the emission sensing modules for detecting NO, CO2, SO2, and NO2. Four kinds of gas density sensors are temperature and humidity, atmospheric pressure, and position sensors.
The ship emission detection system is mainly composed of a six-axis drone, a blade shield, a wind speed and direction detection module, a thermal imaging module, a laser ranging module, a gas sensor group, a gas acquisition module (exhaust cooling collection tube, a dehumidification filter module, and an air pump), etc. The specific ship emission detection system is shown in Figure 4.
The infrared thermal imaging camera module can be installed on the general industrial six-axis drone platform to determine the position of the exhaust chimney of the ship, the laser ranging module can obtain the relative distance between the drone and the ship, and the wind speed and direction detection module can obtain the current wind speed and direction to obtain the downwind area of the ship’s exhaust. Multisensor fusion technology is adopted through the joint action of the thermal imaging and laser ranging modules and the wind speed and direction detection module.
The sensor acquisition group module Is mainly composed of the power module, MCU master control, air pump, various sensors, data radio, GPRS or 4G communication module, and GPS positioning module, as shown in Figure 5.
The sensor module sucks the gas through the negative pressure generated by the air pump, cools the air by the cooling pipe, and passes the cooled air to the gas sampling interface. These processes help improve the detection accuracy of gas pollutants and reduce the impact caused by ship exhaust’s high temperature and humidity. After dehumidification and filtration, the gas enters each gas sensor for density detection, and the gas is discharged through the air outlet.

3.4. Emission Estimation

The sulfur content of the fuel can be calculated according to the principle of sulfur carbon element balance, that is, according to the specific gravity of COx and SOx detected.
The density of gaseous pollutants emitted from ships will gradually decrease when they diffuse in the air. The process of progressively reducing and diluting the density of contaminants can usually be simulated using the Gaussian diffusion model and other models. For ocean-going ships, the distance between the ship chimney and the sea level is generally about 10 m, so the height of the emission source needs to be considered.
To accurately measure the value of SO2 and CO2 in the exhaust gas, it is necessary to locate and find the position of the plume. Currently, the standard method to identify the plume is to install NO sensors in the chimney. Since there is no NO in the air, if the sensor measures the value of NO, it means that it enters the ship’s exhaust plume. However, for areas with large ship flow, such as Shanghai Port, the ship flow density is significant, and it is impossible to accurately determine where the NO comes from. Using an infrared camera as an auxiliary device and using the principle of thermal imaging to identify ship chimneys is necessary.
Estimating the sulfur content in the fuel can provide the basis for law enforcement personnel to improve the efficiency of law enforcement and solve the problem of fuel use supervision on shipboards.

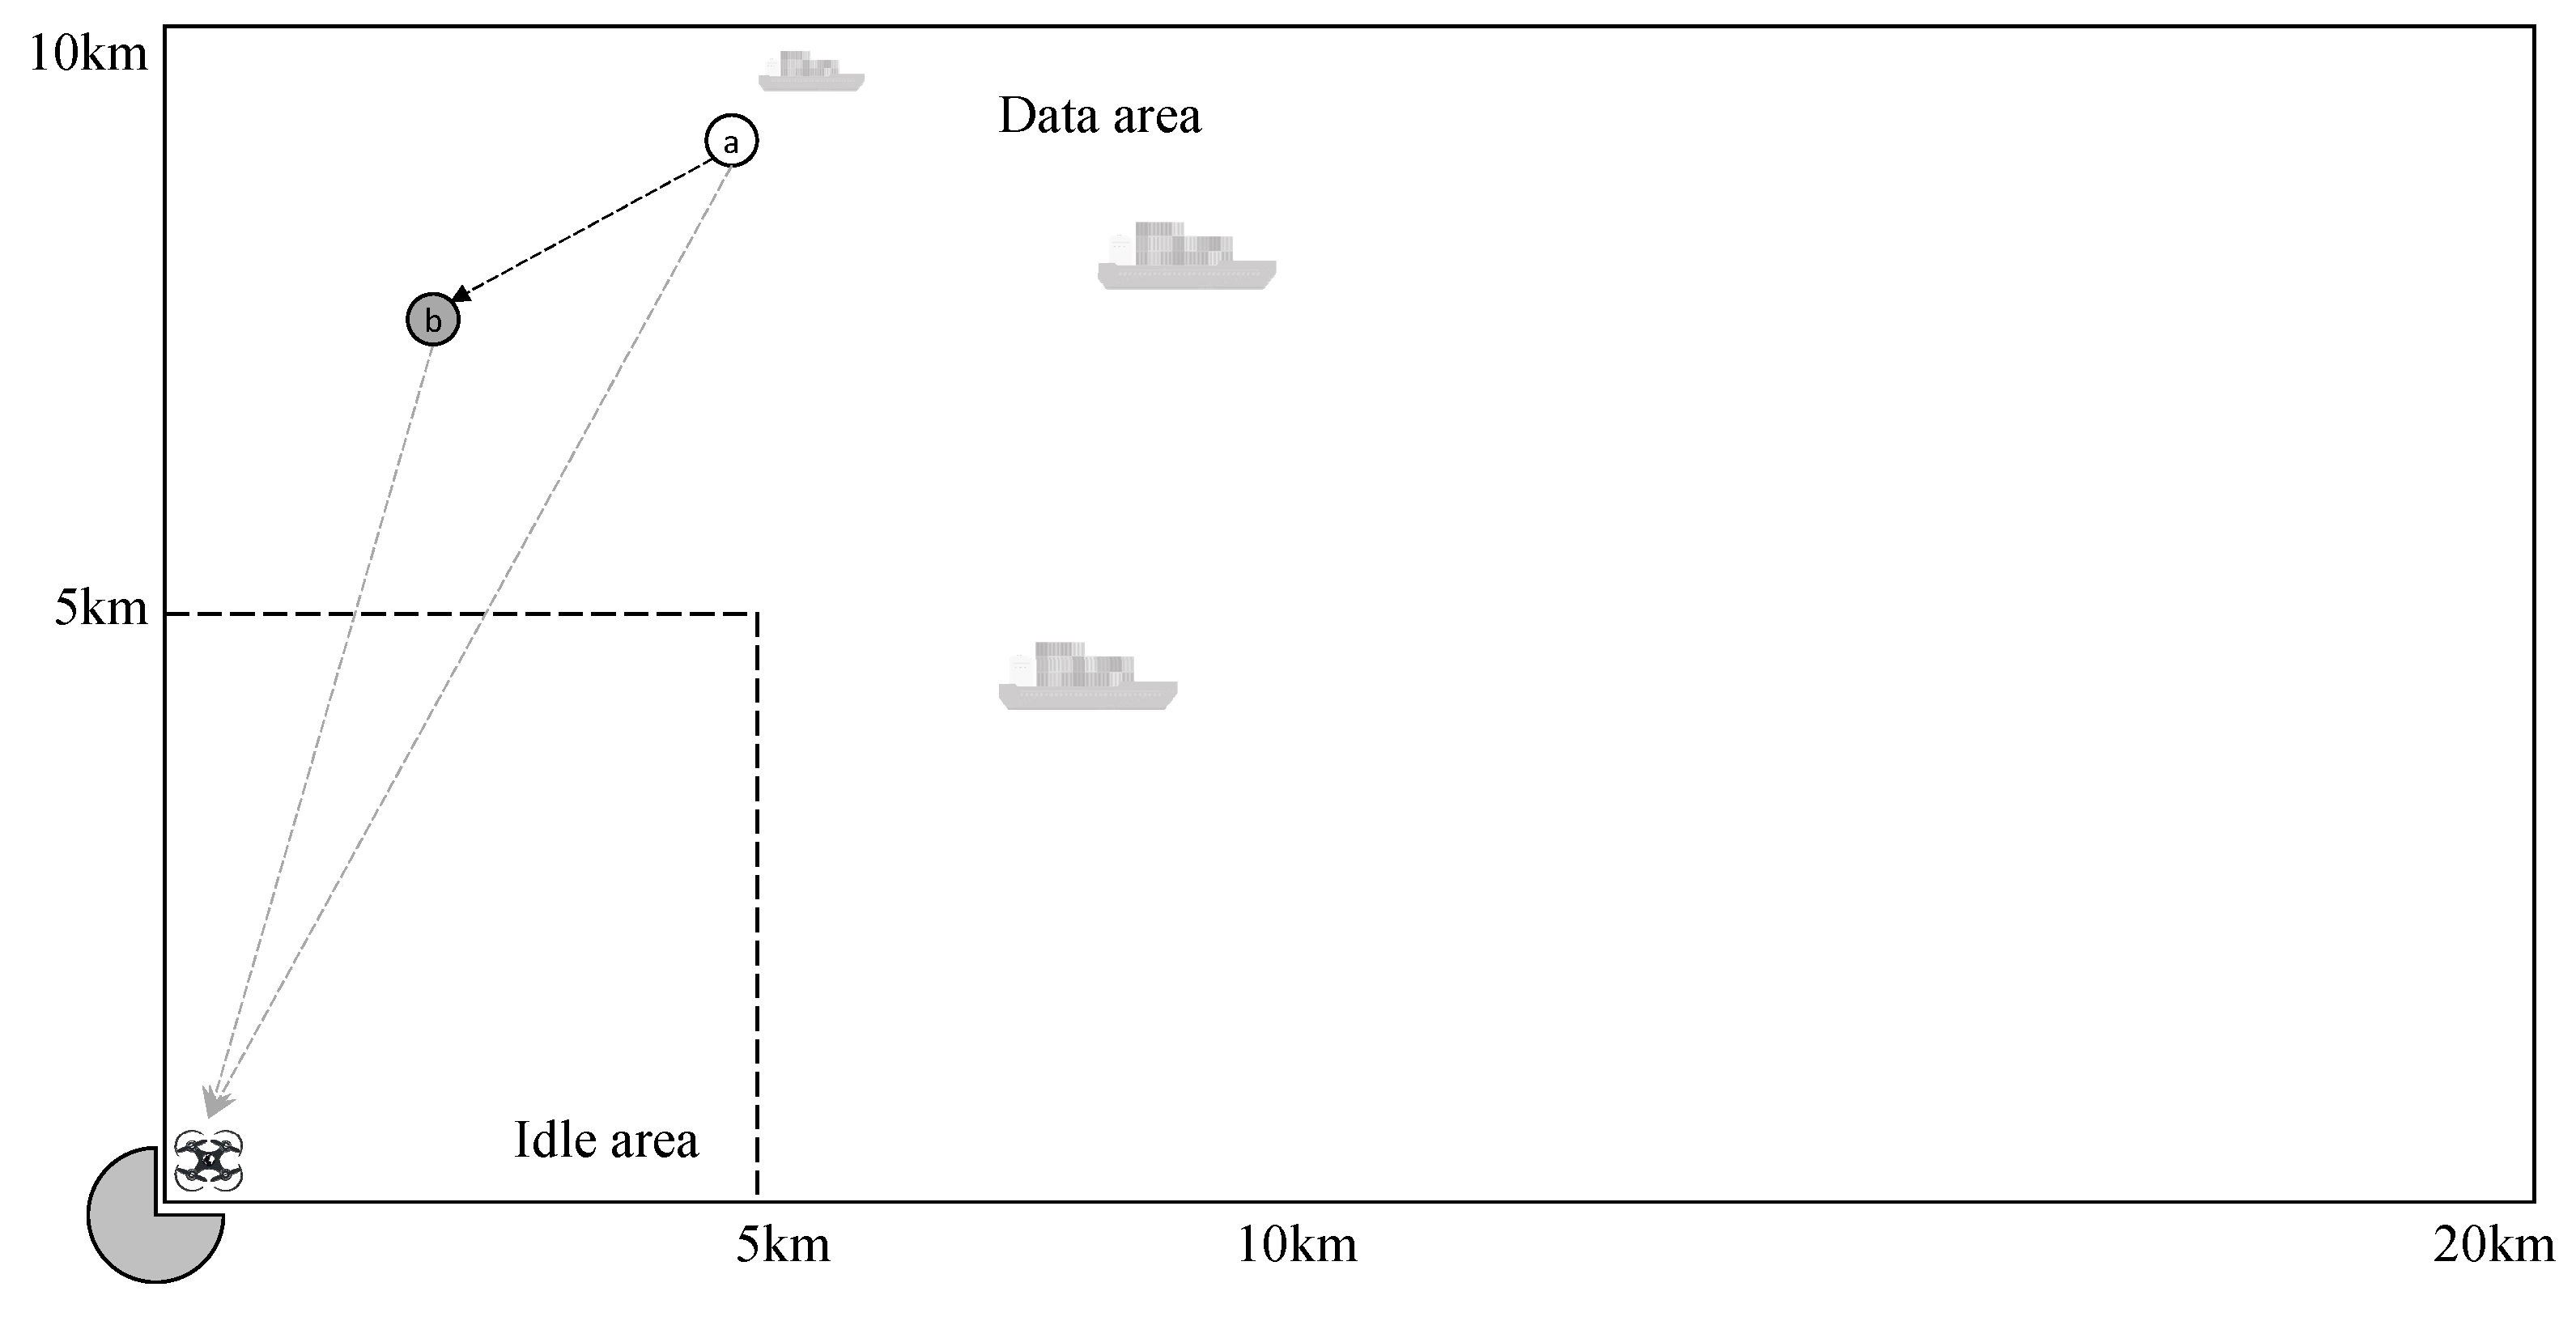
4. The Drone Routing Problem

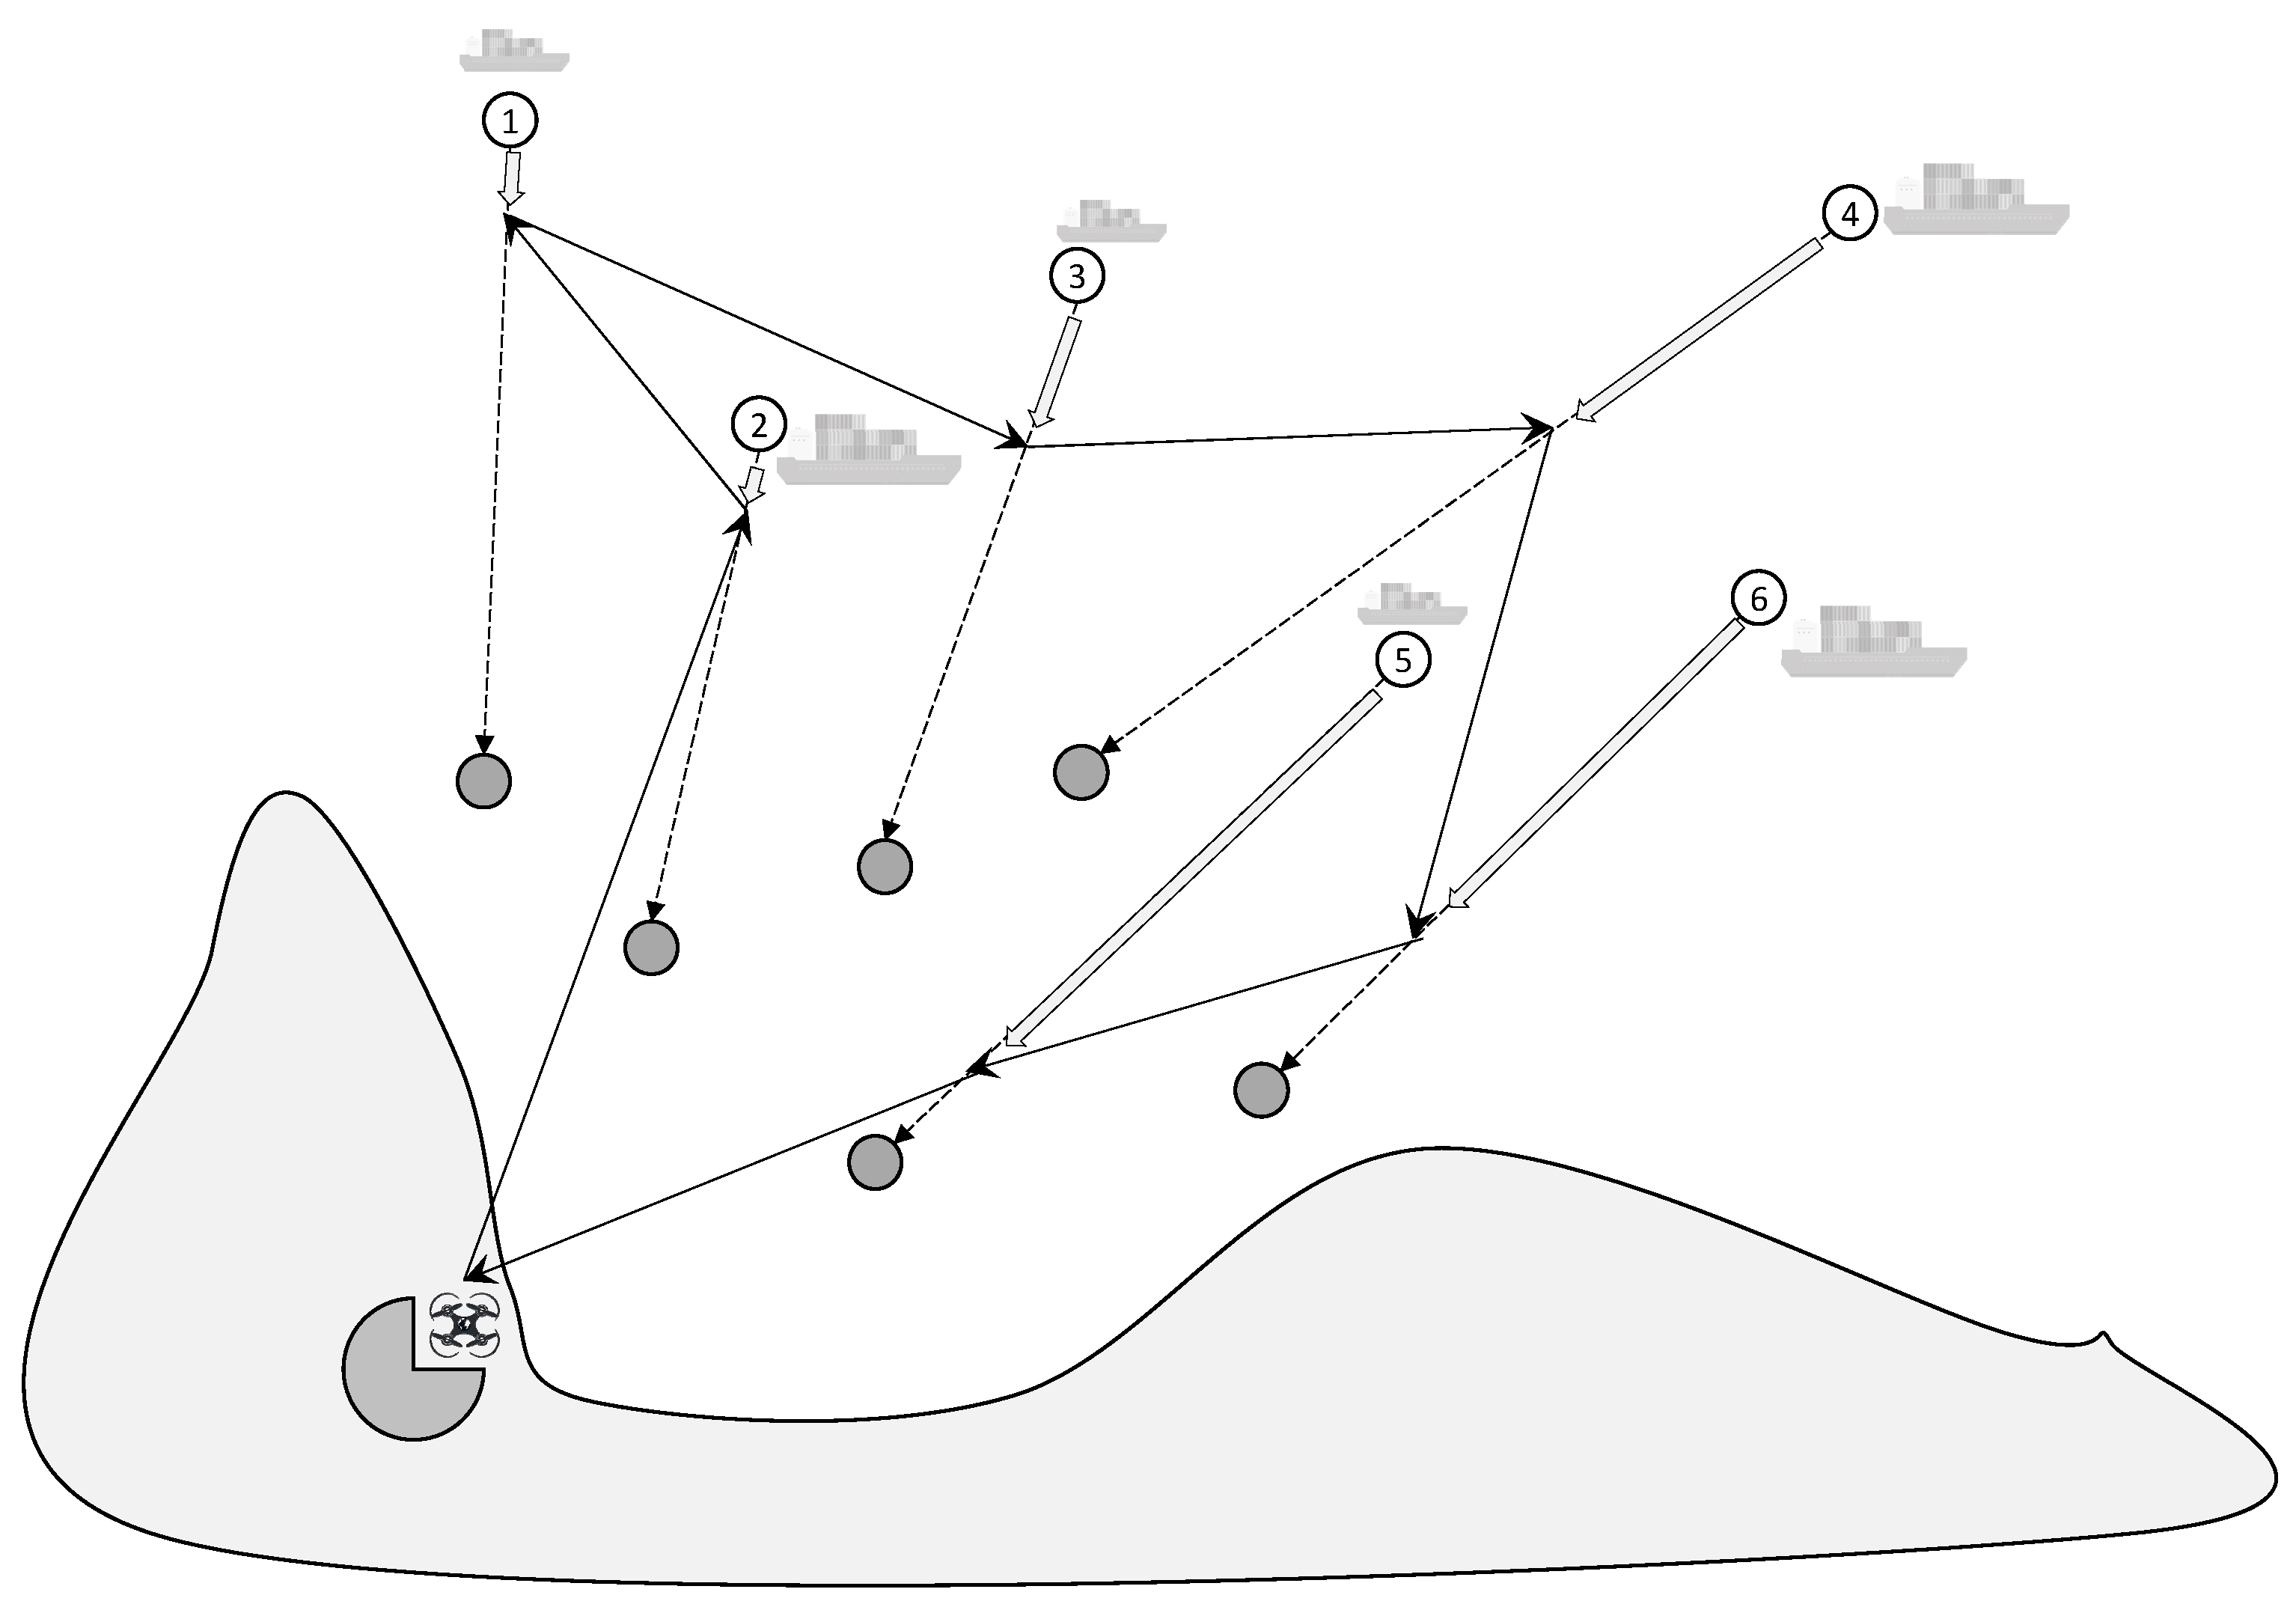
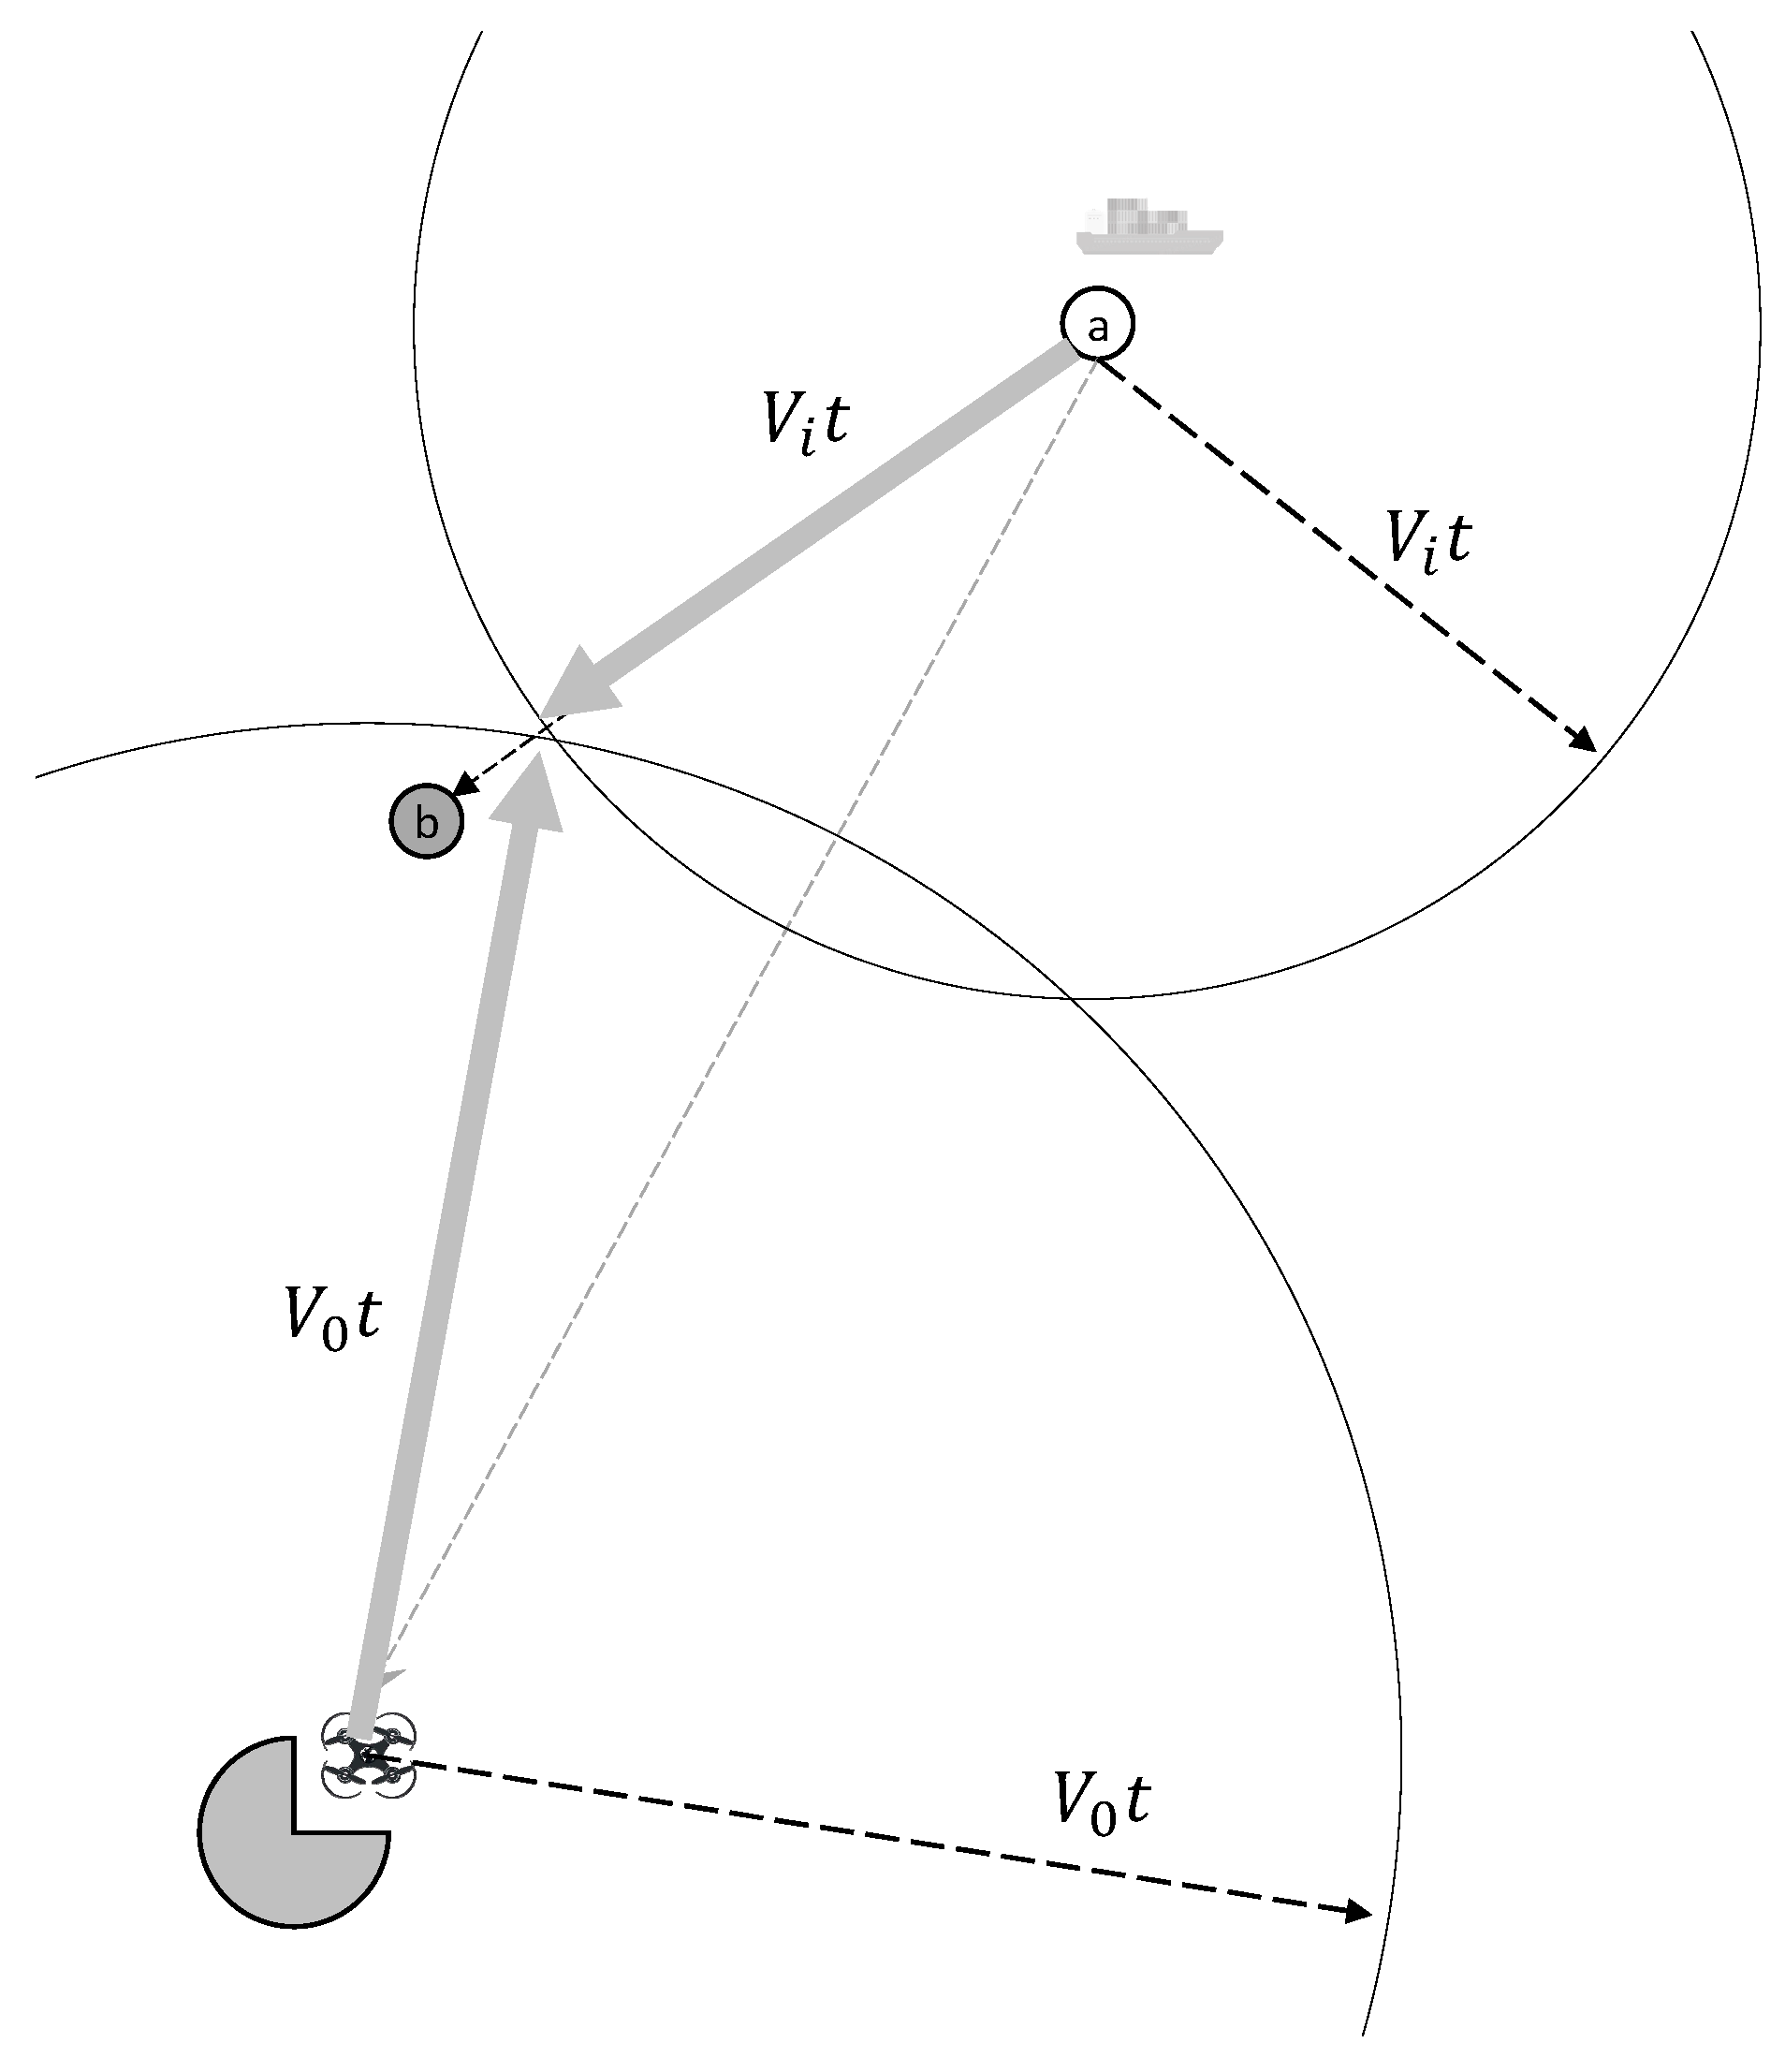
4.1. Problem Statement

Figure 6 depicts the ECA around Shanghai, and Table 3 presents the critical geographical points (marked by 12, 13,14, 15, and 16 in Figure 6) of the ECA. The executive departments can detect the ships entering the ECA by their geographical positions from AIS devices and receivers. As studied above, ships should use cleaner fuels when entering the ECA. As demonstrated in Figure 6, Ship #1 is entering the ECA, while Ship #2 is already in the EAC.
In practical situations of this ECA, there are probably many ships floating in a short period. In a period, by AIS and reports, the ships entering the ECA can be determined, as well as their directions and near destinations. Then, the drone base will schedule the tasks of detecting the ships’ emission status.
Figure 7 depicts a conceptual diagram of the drone routing problem based on the ships’ present positions and moving directions. Six ships (marked by 1, 2, …, 6 in the circles) are depicted with present and target positions in Figure 7, where the circles with digits in while background colors represent the present position and the grey circles are targets. The drone base sends a drone to detect the emission of Ship #2, and then Ships #1, #3, #4, #6, and #5, and, finally, the drone returns to the base. On this journey, the drone visits six ships and completes the emission detection tasks. Generally, the ships’ positions and moving directions may vary during the drone’s detection tasks, and they can be updated by the data returned by AIS devices and maritime departments. As depicted and described above, the drone routing problem is used to schedule a drone to detect the emission status of the ships while these ships are moving in the ECA. Because the drone’s endurance powered by electricity is limited, the drone’s traveling distance should be minimized. The emission status of the ships should be detected as soon as possible because they have entered the ECA. Therefore, the detection tasks should be completed as early as possible.

4.2. Formulation

As studied above, the drone base position is denoted by X 0 , Y 0 , the ship set I = 1 , 2 , , the ship #i’s position X i , Y i , the target position X i t , Y i t , and the speed V i . The speed of the drone is V 0 . To formulate the drone routing problem, we introduce a tri-tuple variable x i , y i , t i , representing the position and time where the detection action occurs. We can order the tuples by t i and to obtain the sequence of visits to the ships, denoted by J , and J + = i , j : i , j J 0 denotes the arc lists starting from the drone base and ending at the base station.
The drone routing problem in [M1] is formulated using the above notations.
M 1 min f = f d i s
where
f d i s = i , j J + x j x i 2 + y j y i 2
subject to
V i t i = X i x i 2 + Y i y i 2 , i I
V 0 t j t i = x j x i 2 + y j y i 2 , i , j J
V 0 t i = X 0 x i 2 + Y 0 y i 2 , i = F i r s t J
x i X i y i Y i = X i t X i Y i t Y i , i I
x i X i , X i t , y i Y i , T i t , t i 0 , T ¯ i , i I
T ¯ i = X i X i t 2 + Y i Y i t 2 V i , i I
Formally, [M1] is a nonlinear program that is not solvable by on-the-shelf solvers, e.g., Cplex and Gurobi. We develop heuristics for solving [M1] in the following section.

5. Solution Methods

5.1. Sequence-Based Construction Algorithm

In the optimization process of the sequential insertion algorithm, given a ship sequence, the time and position when and where the drone detects each ship’s emission can be calculated. The drone starts from the starting point and accesses each ship in turn according to the priority determined by the sequence. The position at which the drone meets the ship is shown in Figure 8, where the circles a and b are the present and target positions of a given ship. The ship travels from point a   X i ,   Y i to point b   X i t ,   Y i t . We can draw two circles, one for the drone with the center X 0 , Y 0 and radius V 0 t , and another for the ship with the center X i , Y i and the radius V i t . The intersection of two circles on line a b is the meeting point. The intersection can be computed by solving the model (8), where V i X , V i Y are given in (10) and (11).
A binary search algorithm is devised to solve (8). First, we select the midpoint x i ,   y i of segment a b , and compare the time ( t ) when the ship and the drone arrive at this point t ¯ i , t i . If t i > t ¯ i , then we select the midpoint d between X i t ,   Y i t and x i ,   y i ; if t i > t ¯ i , then we select the midpoint between X i ,   Y i and x i ,   y i . The specific algorithm is shown in Algorithm 1. The sequential insertion algorithm is shown in Algorithm 2.
x i = X i + t V i X y i = y 1 + t V i Y x i X 0 2 + y i Y 0 2 = t V 0
V i X = V i X i X i t X i X i t 2 + Y i Y i t 2
V i Y = V i Y i Y i t X i X i t 2 + Y i Y i t 2
Algorithm 1 Dichotomy algorithm (DA).
Input X i , Y i : the ship #i’s position;
X i t , Y i t : the ship #i’s target position;
X 0 , Y 0 : the drone base position;
V i : the ship #i’s speed;
V 0 : The speed of the drone.
Output x i , y i , t i : the position and time.
Variable x l , y l , x u , y u : the lower and upper bounds of the intersection position of the drone and ship;
t ¯ i : the time when the ship travels to the intersection point;
δ : tolerance.
Steps
Step 1 Initialize   x l , y l , x u , y u   and   x i , y i .
x u , y u X i , Y i ;
x l , y l X i t , Y i t ;
x i , y i x u + x l 2 , y u + y l 2 .
Step 2Compute t i , t ¯ i
t i X 0 x i 2 + Y 0 y i 2 V 0 t ¯ i X i x i 2 + Y i y i 2 V i .
Step 3 While   t i t ¯ i   δ :
Step 3.1 If   t i > t ¯ i :
x u , y u x i , y i
Step 3.2  Else:
x l , y l x i , y i
 End if
Step 3.3 Update   x i , y i .
x i , y i x u + x l 2 , y u + y l 2 .
Step 3.4 Update t i , t ¯ i
t i X 0 x i 2 + Y 0 y i 2 V 0 t ¯ i X i x i 2 + Y i y i 2 V i .
Step 4 Return   x i , y i ,   t i
Algorithm 2 Sequence-based construction algorithm (SCA).
Input O : A sequence of ships visited by the drone.
Output C : Flying segments of the drone;
T : Flying time.
Variable x i , y i , t i : the position and time.
Steps
Step 1 Initialize   X 0 , Y 0 0 , 0 , x , y X 0 , Y 0 , C , T 0
Step 2 Add   x , y to C
Step 3For i in O :
x i , y i ,   t i D A X i , Y i , X i t , Y i t ,   x , y , V i , V 0  
x , y x i , y i
T T + t i
Add   x , y to C
Step 4 Add   0 , 0 to C
Step 5Update T .
T T + x 0 2 + y 0 2 V 0
Step 6 Return   C ,   T

5.2. A Genetic Algorithm (GA)

Ship emissions detection by a drone is examined here as an extended routing problem, which belongs to discrete combinatorial optimization and is also an NP-hard problem. With the increase of ships, it is not easy to obtain the optimal solution in an acceptable time. Even with the help of intelligent optimization algorithms, it is only possible to obtain an approximate solution close to the optimal route. Among them, the genetic algorithm (GA), as a population-based optimization algorithm, has a variety of search mechanisms and solution transformation mechanisms and is widely used in routing problems. The sequence of ships visited by the drone for emissions detection can be abstracted as a priority-constrained sequencing problem. Using GA to solve it can guarantee its performance advantage.
A GA includes the following points (Algorithm 3): First, the coding scheme should be suitable for the structural characteristics of the problem; second, the crossover and mutation operators are used for transforming the individuals to generate new ones; third, selection strategies are used to screen and retain excellent individuals (also known as elite individuals). The inherent population evolution mode of the algorithm can ensure that the solution evolves in the optimal direction while maintaining diversity and preventing the algorithm from falling into local optimization. The crossover and mutation probabilities ( p x , P m ) are used as parameters to control the exploit and explore optimal solutions.
Algorithm 3 The genetic algorithm.
Input Algorithmic   parameters :   the   population   size   ( P s ) ,   iterated   generations   ( P g ) ,   crossover   probability   ( p x ) ,   mutation   probability   ( P m ).
OutputBest solution
Steps
Step 1 Initialization .   Create   an   initial   population   consisting   of   P s   distinct   chromosomes .   Each   chromosome   is   a   permutation   that   is   generated   randomly .   The   population   is   denoted   by   P n = P i n i = 1 , 2 , , P s ,   of   which   P i n   represents   the   i - th   chromosome .   Let   the   iteration   number   n = 0 .
Step 2Crossover and mutation. Crossover is responsible for exchanging genetic features between selected parents. Position-based crossover [49]   is   applied   to   the   task   sequences .   It   is   essentially   a   kind   of   uniform   crossover   for   permutation   representation .   Inversion   mutation   is   used   to   mutate   the   sequence .   The   crossover   and   mutation   operations   are   performed   on   the   chromosomes   selected   from   P n   based   on   specific   crossover   probability   p x   and   mutation   probability   P m .
Step 3 Fitness   evaluation .   For   each   chromosome   P i n   in   P n i = 1 , 2 , , P s ,   use   Algorithm   2   to   evaluate   the   ship   sequence   represented   by   P i n . Then, f is returned by the algorithm for the task sequence and entitled as a raw fitness score through the fitness scaling method, which is converted to fitness values in a range that is suitable for the selection function. Here, the rand-based fitness scaling method is used. An individual’s rank is its position in the sorted scores: the rank of the best individual is one, the next best one is two, and so on. The rank scaling function assigns scaled values so that: The scaled value of an individual with rank n is proportional to 1 / n ; The sum of the scaled values over the entire population equals the number of parents needed to create the next generation. The rank-based fitness scaling uses the order of the raw scores other than the spread of them.
Step 4 Breed   a   new   population .   Generate   a   population   P n + 1   of   size   P s by using a binary tournament selection method [50] ;   set   n = n + 1 and go to Step 2.
Step 5Termination. The algorithm stops if n   reaches   P g which is an arbitrary generation number, the algorithm terminates.
The problem features are generally incorporated into the encoding and decoding methods of the GA (Algorithm 3). As devised in Algorithm 2, the solution is encoded as a sequence of ships, and the decoder uses this sequence to generate the drone detection time and position for each ship.

6. Numerical Experiments

6.1. Parameter Estimation

As studied in Section 4, there are two key parameters: the drone’s and ships’ velocities. In the experiments, we set V 0 = 25 m/s. The ships travel in the ECA with the velocities V i ~ U n i f o r m 10 , 20 knots/hour, namely, V i ~ U n i f o r m 5 , 10 meters/second, approximately. Consider the ECA at the Yangtze River estuary in a range of 20 km × 10 km. To avoid references to real-world facilities, we use such a virtual area to represent the ECA with generality in methodology. The endurance mileage of the drone depends on battery technology; thus, different types differ. This study assumes that the endurance is adequate, which may affect the ships and the virtual area settings.

6.2. Dataset Generation

The datasets were generated using the following criteria. First, the virtual 10 × 10 ECA is separated into two parts: the data area and the idle area (Figure 9), where the circles a and b represent the present and target positions of the given ship. The ships’ present and target positions are located in the data area. When generating two positions, the far one represents the present position, while the close one is the target.
The n ships’ present and target positions are generated in the range X × Y ( km × km ). A pair of present and target positions determines the moving direction of the ship. The drone’s initial position is 0 , 0 . The dataset name is formatted by “NnVvXxYY”. N represents the number of ships generated; V represents the flying speed of the drone; X represents the horizontal range; Y represents the vertical range. For example, “N5V25X20Y10” indicates that the drone is at ECA of range 20 × 10   km 2 ; five ships’ emissions need to be detected by the drone with speed 25 m/s.

6.3. Experimental Results

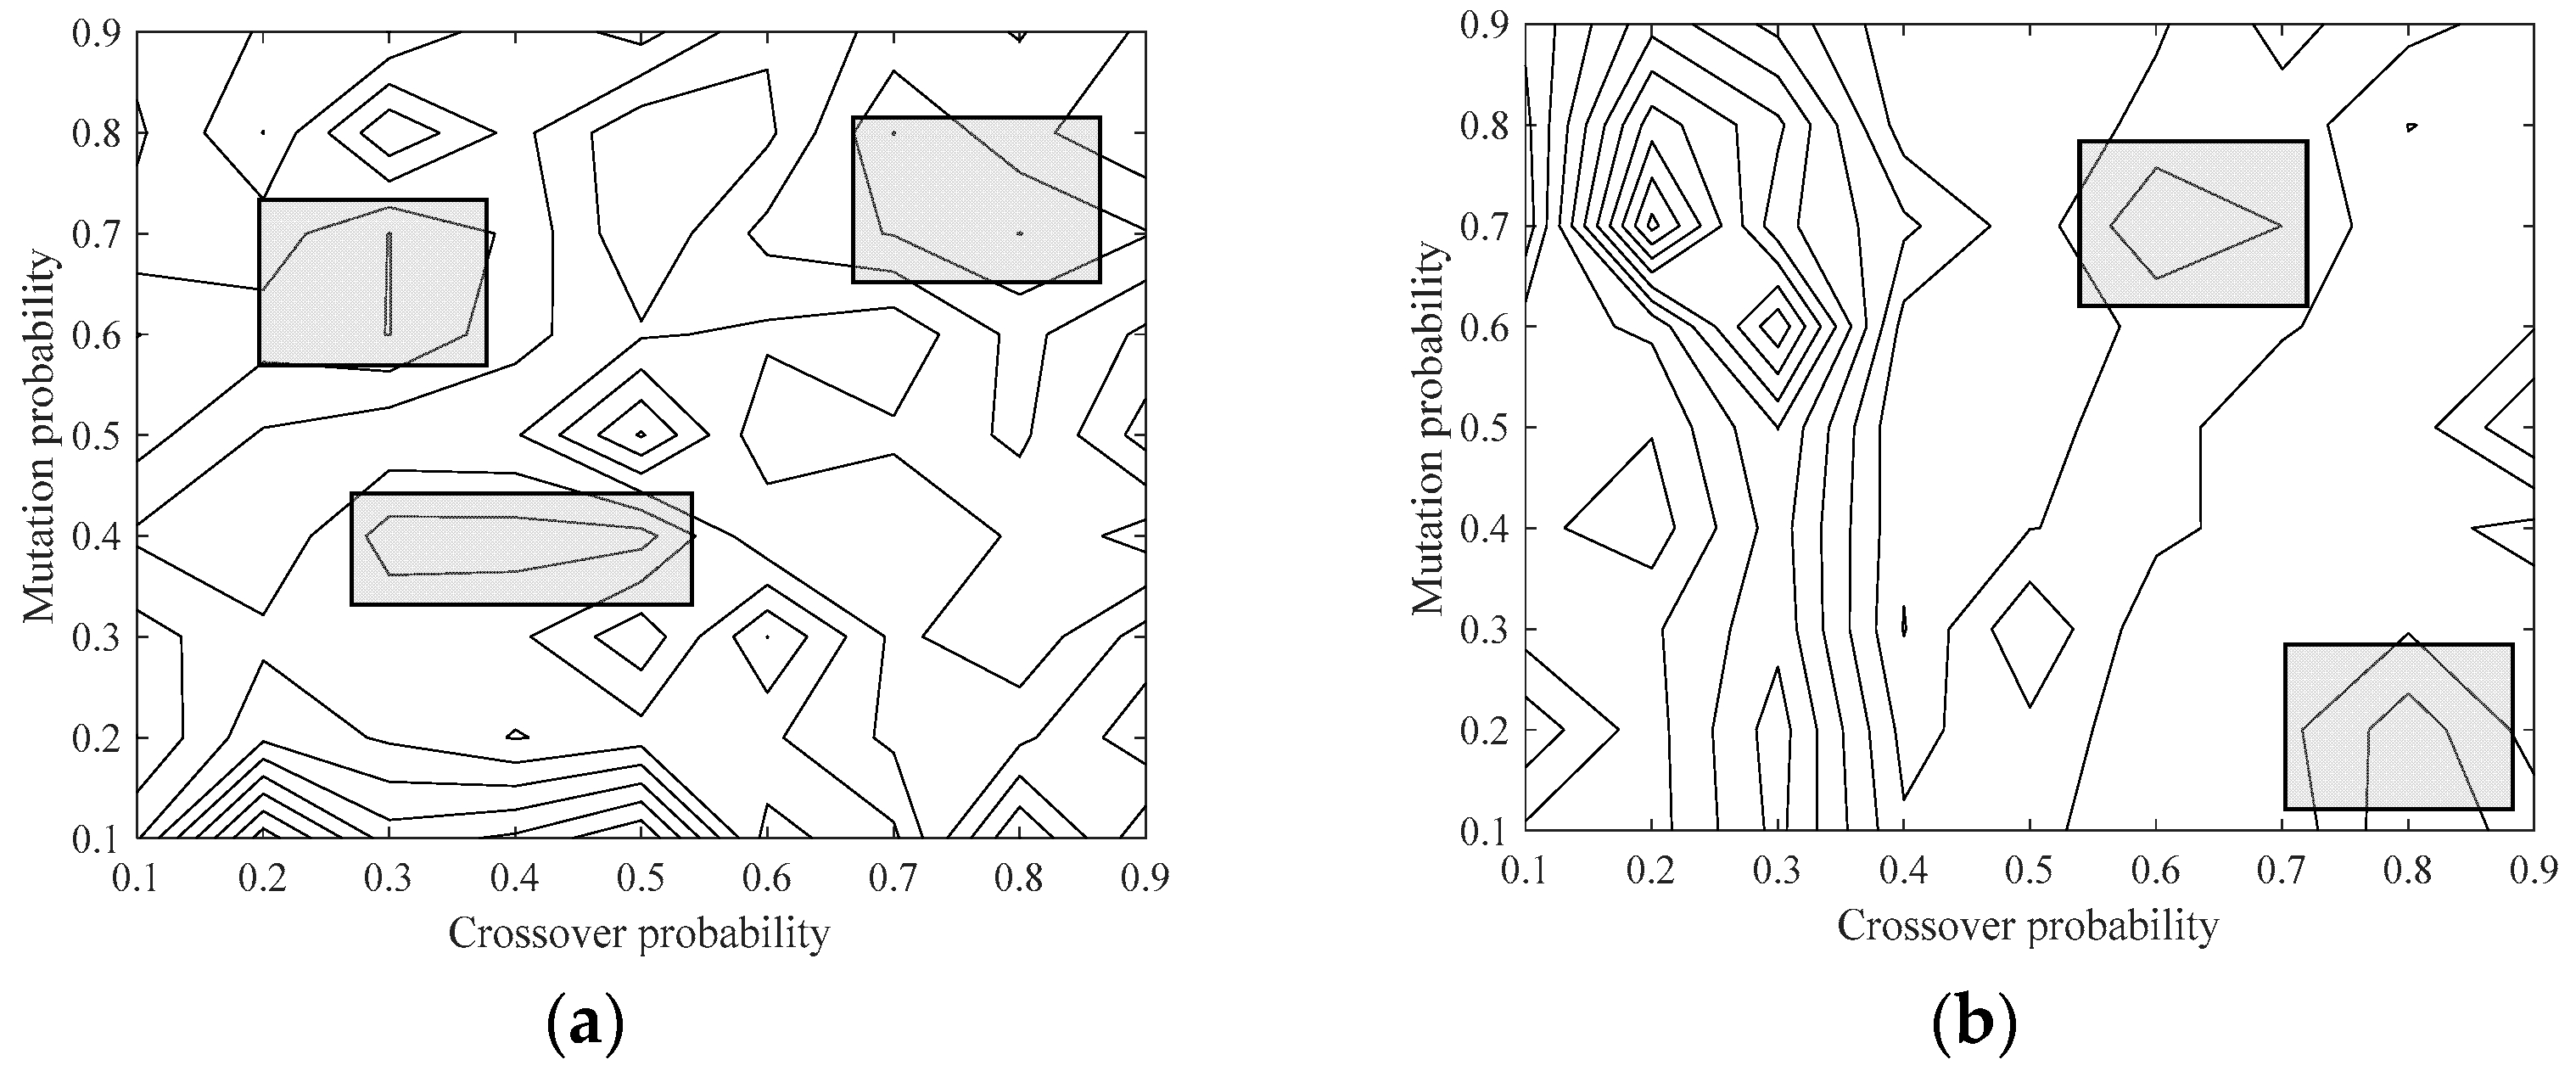
6.3.1. Algorithmic Parameter Tuning

Experiment 1 compares the results under different crossover and mutation probabilities. The crossover probability ( p x ) is set to the values in 0.1 , 0.2 , , 0.9 , and the mutation probability ( p m ) set is 0.1 , 0.2 , , 0.9 . The experimental results are shown in Figure 10. The algorithm has the best solution result under the combination of crossover and mutation probabilities in the gray box in Figure 10a. The change of crossover and mutation probabilities has little effect on the solution time, but the solution time of the algorithm is short when the crossover probability is large (Figure 10b). Further analysis shows that increasing the mutation probability of the GA helps find new solutions, increases the diversity of the population, and helps to jump out of the local optimal solution. However, excessive mutation probability will reduce the optimality of the population. In the subsequent experiments, the crossover and mutation probabilities are set to p x = 0.7 , p m = 0.3 .

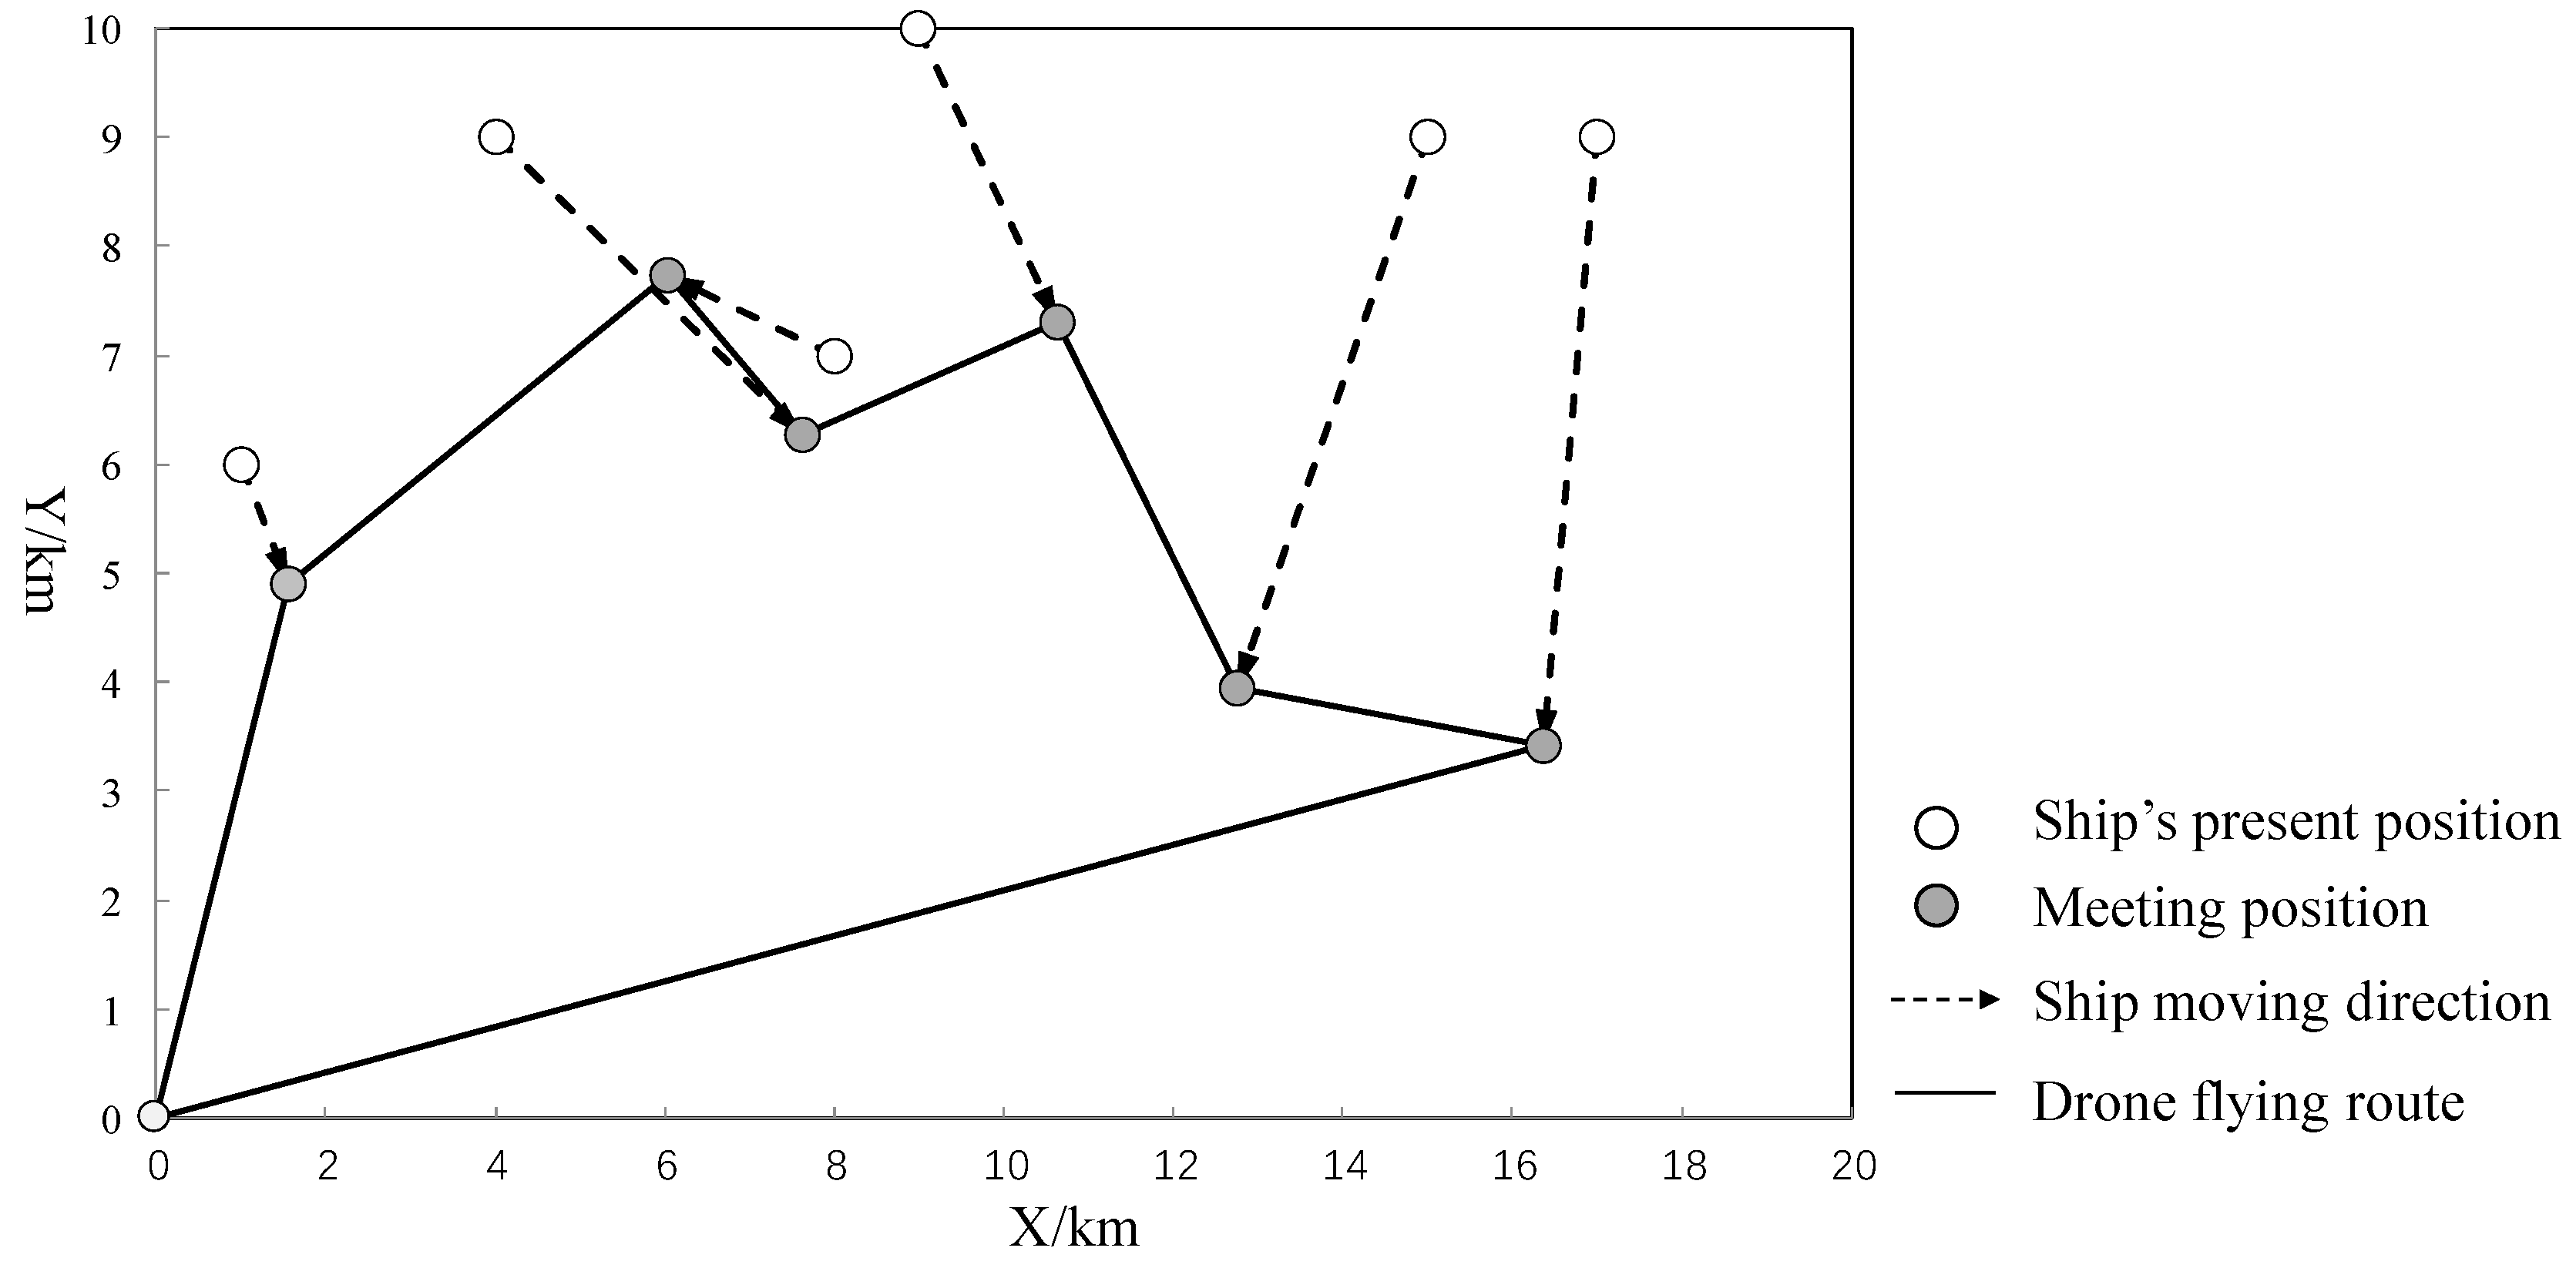
6.3.2. A Demonstration Using the GA

A simple case is developed to demonstrate the drone routing problem, as presented in Table 4 and Figure 11. The drone is located at 0 , 0 , with a flying speed of 25 m/s. Six ships (1, 2, …, 6) are involved in the study. The present positions are given in X i , Y i , and the speed, V i , for each ship i . Using the GA (Algorithm 3) and its embedded decoding algorithm (Algorithm 2), we can solve the problem and obtain the position of detection x i , x j for each ship i .

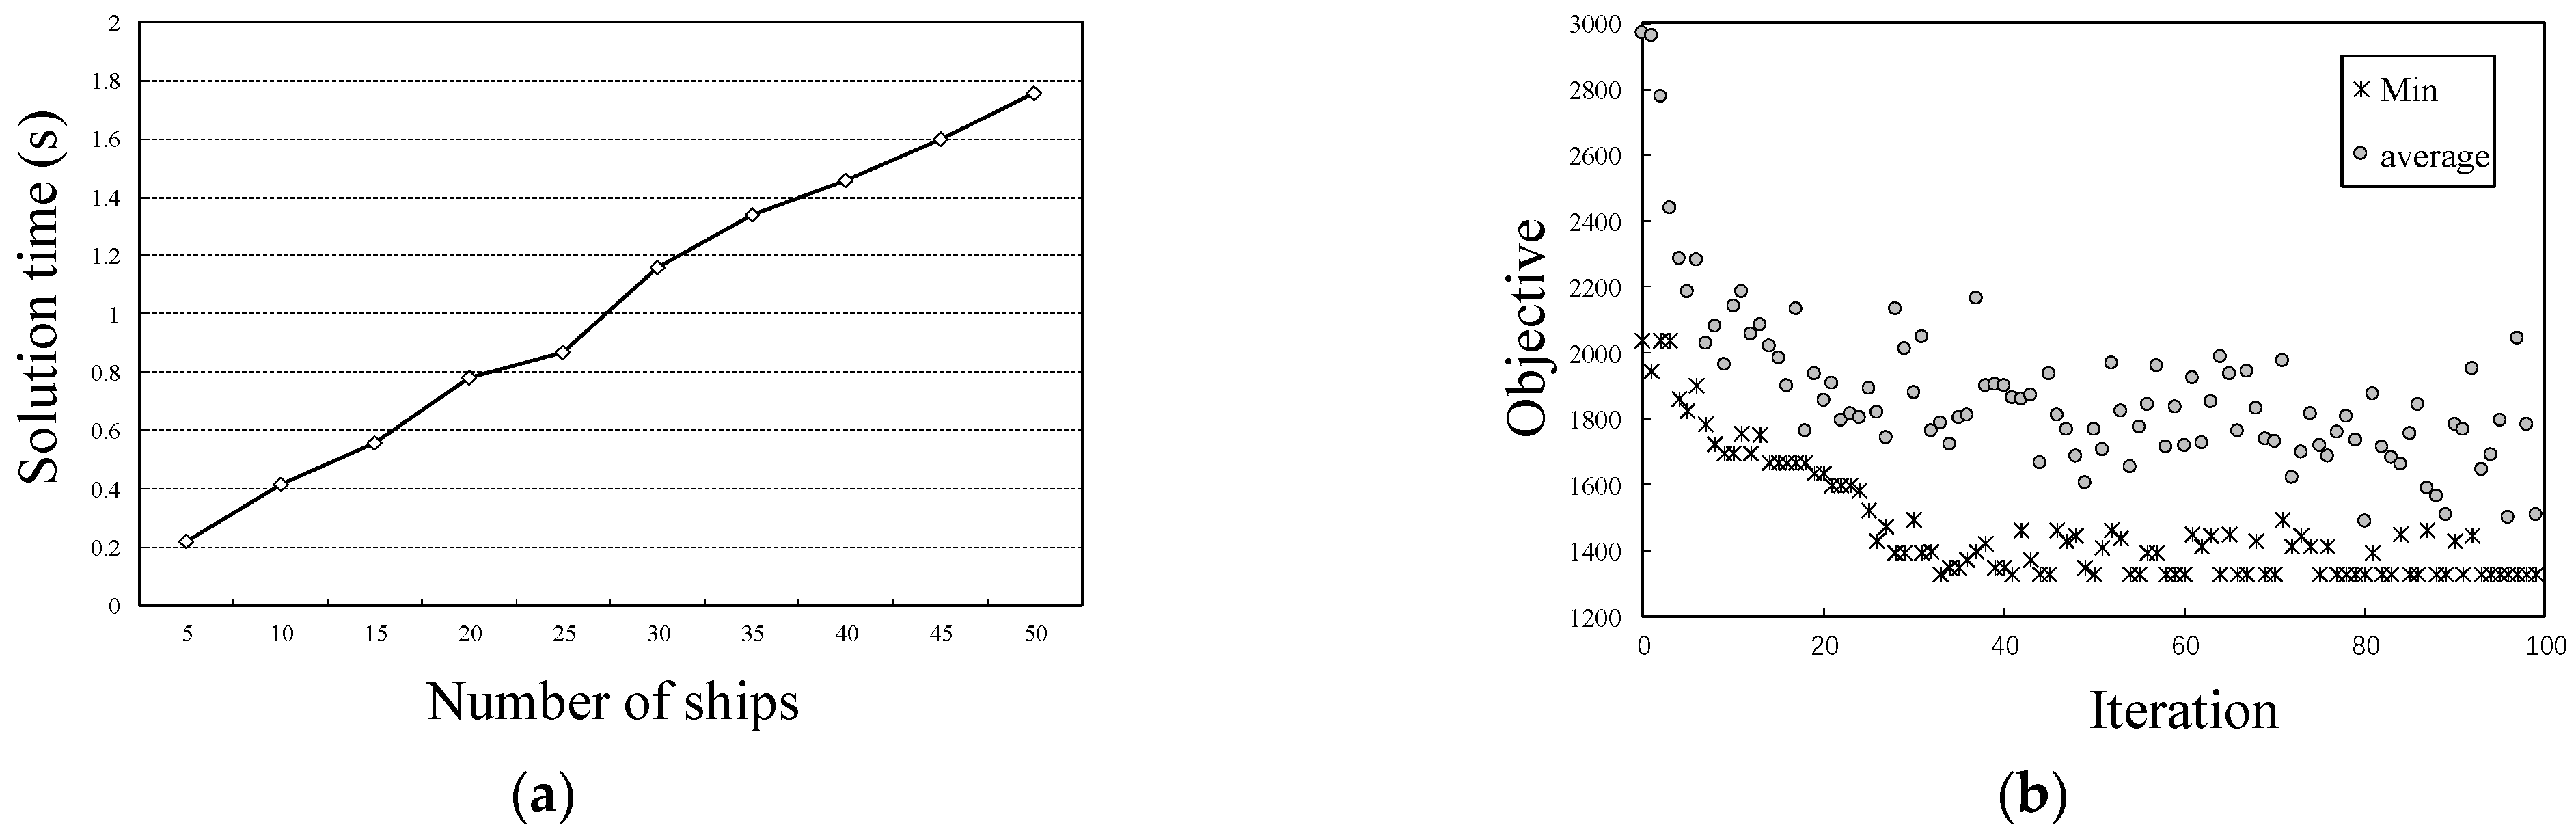
6.3.3. Algorithmic Performance

To study the GA’s performance, we use ten datasets, N i X 20 Y 10 , where i = 5 , 10 , , 50 . The computing times of solving these datasets are linear to the number of ships, as presented in Figure 12a. Using N10V25X20Y10 as an example, we demonstrate the evolutionary processes of the minimum and average values of the objectives, as depicted in Figure 12b. The minimum will be reached after about 40 iterations. In summary, the proposed algorithm can solve the instances efficiently.

6.3.4. Parameter Sensitivity Analysis

In the drone routing problem, the drone flying speed ( V 0 ) may affect the solutions most. The impacts of V 0 on the drone’s travel time and distance are tested using three datasets, N10V25X20Y10, N20V25X20Y10, and N30V25X20Y10. Increasing the drone’s flying speed can reduce the travel time while increasing the distance (Figure 13).

6.4. Discussions and Managerial Implications

In China, the maritime sector is a unique functional department undertaking administrative law enforcement functions such as water safety supervision and ship pollution prevention. The efficiency of marine management is related to many aspects of society, production, and life, as well as the image of the country and the government. In recent years, with the rapid development of the international and domestic shipping economy and the continuous rise of emerging ports, the ship flow has increased significantly, which demands higher and newer requirements for maritime supervision [45]. Maritime cruise is an essential means for marine departments to implement active surveillance. It is responsible for safeguarding national rights and interests according to relevant international conventions and relevant laws and regulations of China, conducting daily law enforcement, navigation safety, emergency rescue, pollution prevention monitoring, maintaining the order of water traffic, protecting the navigation environment on water, and ensuring the security of people’s lives and property. In September 2021, Shanghai Maritime Safety Administration began to use the remote measurement drone system for ship exhaust. Through this system, maritime law enforcement officers can remotely monitor the exhaust of ships on the voyage and efficiently screen ships with high sulfur content in fuel. Applying the ship emission detection system not only improves the efficiency of maritime supervision but also saves costs [37].
Establishing an advanced, long-term, and intensive monitoring mode of ship exhaust gas detection is crucial, considering both economy and effectiveness.
We make the following generations as managerial implications based on the experimental results.
(1) The drone-based ship emission detection system is competitive compared to manned aircraft and patrol ships. As studied in Section 3, the automated detection system should be comprehensive and intelligent enough to cope with complicated situations of ships and offshore climates [39]. Although the fixed and operational costs of drones are much lower than manned aircraft and patrol ships, the system involves research and experiment costs at this stage when the technologies are not mature. Therefore, we suggest that an industrial organization and an R&D (research and development) alliance invest and speed up the development of the system. The maritime sectors and transportation departments also should realize the system’s value and costs.
(2) Many alternatives of technologies and application modes may affect drone routing problems [45]. In this study, we examine a fundamental featured problem. When it can be implemented as expected, the model and algorithms can reduce energy consumption and detection efficiency. Thus, when the maritime sectors start up the projects, it is necessary to develop routing solution methods based on the technologies, especially when the ECA is oversized, and many ships cross the ECA borders quickly.
(3) The ship emission detection system consists of many components, modules, and devices. When we integrate it with existing maritime systems, it will be much more complicated and powerful. However, ocean transportation systems are always dependent [51], so the system must be communicable. The mega companies, industrial organizations, and governments should be conscious of the systemic technology standards, which may dominate the developments and affect the interconnection costs of the systems.

7. Conclusions

Offshore ship emission detection and administration involve various stakeholders, where the ships and the national maritime sector are primary players. The ECA policy is a mediated and phrased solution. However, although the local maritime industries have released various restrictions and even penalties, it is still challenging to verify the pollutants emitted by the ships in the ECAs. A systemic framework, components, and modules are proposed in this study, considering drone-based emission detectors. Specially, we focused on a critical problem: the drone routing problem, which determines the system’s validity and efficiency. The simultaneous movements of the drone and ships make the problem different from general routing problems. Formulations and algorithms were developed to solve the problem. The experimental studies demonstrate the effects and efficiencies of the proposed method.
The study can be extended in the following three aspects, considering the limitations of the study. First, this study considers the single-drone routing problem, while a fleet of drones generally serves for emission detection in an ECA. A drone base may schedule these drones when the ECA is big, or the ships flow is dense. The model can be extended to support multidrone routing problems, an extended one-station, or multistation vehicle routing problems. Second, in this study, the drone and ships move simultaneously, and the moving directions of ships are determined. It is an assumption that the ships will move in the determined directions. Thus, the model can be extended to support ships’ varying moving directions. These directions can be updated using the ships’ AIS data. All these data are uncertain in practice, so the models and solution methods should consider uncertainties. Third, in the detection process, locating the chimney is critical. The chimney should emit NO, so NO sensors can help find the chimney. However, this method will not work when the ships’ flow is dense. Using image recognition and machine learning in the ship emission detection system is beneficial. The ships’ emission detection is a complicated system, wherein drone routing is a crucial problem. It is helpful to consider the whole system and its decision-making and management problems in future studies.

Author Contributions

Conceptualization, Z.-H.H.; methodology, Z.-H.H.; software, X.-D.T.; validation, X.-D.T.; formal analysis, T.-C.L.; investigation, T.-C.L.; resources, T.-C.L.; data curation, X.-D.T.; writing—original draft preparation, Z.-H.H.; writing—review and editing, T.-C.L.; visualization, T.-C.L.; supervision, Z.-H.H.; project administration, Z.-H.H.; funding acquisition, Z.-H.H. All authors have read and agreed to the published version of the manuscript.

Funding

This research was funded by National Social Science Foundation of China (18BGL103).

Institutional Review Board Statement

Not applicable.

Informed Consent Statement

Not applicable.

Data Availability Statement

The model data and its generator can be obtained by contacting the author.

Conflicts of Interest

The authors declare no conflict of interest.

References

  1. Chuah, L.F.; Bokhari, A.; Asif, S.; Klemeš, J.J.; Dailin, D.J.; Enshasy, H.E.; Halim, A.; Yusof, M. A review of performance and emission characteristic of engine diesel fuelled by biodiesel. Chem. Eng. Trans. 2022, 94, 1099–1104. [Google Scholar]
  2. Munir, M.; Saeed, M.; Ahmad, M.; Waseem, A.; Alsaady, M.; Asif, S.; Ahmed, A.; Khan, M.S.; Bokhari, A.; Mubashir, M.; et al. Cleaner production of biodiesel from novel non-edible seed oil (Carthamus lanatus L.) via highly reactive and recyclable green nano CoWO3@rGO composite in context of green energy adaptation. Fuel 2023, 332, 126265. [Google Scholar] [CrossRef]
  3. Air Pollution from Ships. Available online: https://www.transportenvironment.org/what-we-do/shipping/air-pollution-ships (accessed on 20 January 2018).
  4. Zhao, T.T.; Chen, M.W.; Lee, H. A Study on the Framework for Estimating Ship Air Pollutant Emissions-Focusing on Ports of South Korea. Atmosphere 2022, 13, 1141. [Google Scholar] [CrossRef]
  5. Yang, L.; Zhang, Q.J.; Lv, Z.Y.; Zhang, Y.J.; Yang, Z.W.; Fu, F.; Lv, J.H.; Wu, L.; Mao, H.J. Efficiency of DECA on ship emission and urban air quality: A case study of China port. J. Clean. Prod. 2022, 362, 132556. [Google Scholar] [CrossRef]
  6. Lopez-Aparicio, S.; Tonnesen, D.; Thanh, T.N.; Neilson, H. Shipping emissions in a Nordic port: Assessment of mitigation strategies. Transp. Res. Part D Transp. Environ. 2017, 53, 205–216. [Google Scholar] [CrossRef]
  7. Weng, J.X.; Shi, K.; Gan, X.F.; Li, G.R.; Huang, Z. Ship emission estimation with high spatial-temporal resolution in the Yangtze River estuary using AIS data. J. Clean. Prod. 2020, 248, 119297. [Google Scholar] [CrossRef]
  8. Contini, D.; Merico, E. Recent Advances in Studying Air Quality and Health Effects of Shipping Emissions. Atmosphere 2021, 12, 92. [Google Scholar] [CrossRef]
  9. Xu, L.; Wen, Y.T.; Luo, X.Y.; Lu, Z.G.; Guan, X.P. A modified power management algorithm with energy efficiency and GHG emissions limitation for hybrid power ship system? Appl. Energy 2022, 317, 119114. [Google Scholar] [CrossRef]
  10. UNCTAD. Review of Maritime Transport 2022. Available online: https://unctad.org/system/files/official-document/rmt2022_en.pdf (accessed on 27 January 2022).
  11. Li, Y.; Zhang, Y.L.; Cheng, J.X.; Zheng, C.H.; Li, M.J.; Xu, H.L.; Wang, R.J.; Chen, D.S.; Wang, X.T.; Fu, X.Y.; et al. Comparative Analysis, Use Recommendations, and Application Cases of Methods for Develop Ship Emission Inventories. Atmosphere 2022, 13, 1224. [Google Scholar] [CrossRef]
  12. Kosmas, V.; Acciaro, M. Bunker levy schemes for greenhouse gas (GHG) emission reduction in international shipping. Transp. Res. Part D Transp. Environ. 2017, 57, 195–206. [Google Scholar] [CrossRef]
  13. Chen, L.Y.; Yip, T.L.; Mou, J.M. Provision of Emission Control Area and the impact on shipping route choice and ship emissions. Transp. Res. Part D Transp. Environ. 2018, 58, 280–291. [Google Scholar] [CrossRef]
  14. Bouman, E.A.; Lindstad, E.; Rialland, A.I.; Stromman, A.H. State-of-the-art technologies, measures, and potential for reducing GHG emissions from shipping—A review. Transp. Res. Part D Transp. Environ. 2017, 52, 408–421. [Google Scholar] [CrossRef]
  15. Gilbert, P.; Walsh, C.; Traut, M.; Kesieme, U.; Pazouki, K.; Murphy, A. Assessment of full life-cycle air emissions of alternative shipping fuels. J. Clean. Prod. 2018, 172, 855–866. [Google Scholar] [CrossRef]
  16. Tian, Y.J.; Ren, L.L.; Wang, H.Y.; Li, T.; Yuan, Y.P.; Zhang, Y. Impact of AIS Data Thinning on Ship Air Pollutant Emissions Inventories. Atmosphere 2022, 13, 1135. [Google Scholar] [CrossRef]
  17. Gronoff, G.; Robinson, J.; Berkoff, T.; Swap, R.; Farris, B.; Schroeder, J.; Halliday, H.S.; Knepp, T.; Spinei, E.; Carrion, W.; et al. A method for quantifying near range point source induced O-3 titration events using Co-located Lidar and Pandora measurements. Atmos. Environ. 2019, 204, 43–52. [Google Scholar] [CrossRef]
  18. Nguyen, P.N.; Woo, S.H.; Kim, H. Ship emissions in hotelling phase and loading/unloading in Southeast Asia ports. Transp. Res. Part D Transp. Environ. 2022, 105, 103223. [Google Scholar] [CrossRef]
  19. Anand, A.; Wei, P.; Gali, N.K.; Sun, L.; Yang, F.H.; Westerdahl, D.; Zhang, Q.; Deng, Z.Q.; Wang, Y.; Liu, D.G.; et al. Protocol development for real-time ship fuel sulfur content determination using drone based plume sniffing microsensor system. Sci. Total Environ. 2020, 744, 140885. [Google Scholar] [CrossRef] [PubMed]
  20. Sun, P.Z.H.; Luo, X.S.; Zuo, T.Y.; Bao, Y.G.; Sun, Y.N.; Law, R.; Wu, E.Q. Emission Monitoring Dispatching of Drones Under Vessel Speed Fluctuation. IEEE Trans. Intell. Transp. Syst. 2022, 23, 21833–21847. [Google Scholar] [CrossRef]
  21. Xia, J.; Wang, K.; Wang, S.A. Drone scheduling to monitor vessels in emission control areas. Transp. Res. Part B Methodol. 2019, 119, 174–196. [Google Scholar] [CrossRef]
  22. Nikopoulou, Z. Incremental costs for reduction of air pollution from ships: A case study on North European emission control area. Marit. Policy Manag. 2017, 44, 1056–1077. [Google Scholar] [CrossRef]
  23. Gu, Y.W.; Wallace, S.W. Scrubber: A potentially overestimated compliance method for the Emission Control Areas The importance of involving a ship’s sailing pattern in the evaluation. Transp. Res. Part D Transp. Environ. 2017, 55, 51–66. [Google Scholar] [CrossRef]
  24. Dragovic, B.; Tzannatos, E.; Tselentis, V.; Mestrovic, R.; Skuric, M. Ship emissions and their externalities in cruise ports. Transp. Res. Part D Transp. Environ. 2018, 61, 289–300. [Google Scholar] [CrossRef]
  25. Zhen, L.; Li, M.; Hu, Z.; Lv, W.Y.; Zhao, X. The effects of emission control area regulations on cruise shipping. Transp. Res. Part D Transp. Environ. 2018, 62, 47–63. [Google Scholar] [CrossRef]
  26. Linder, A. Explaining shipping company participation in voluntary vessel emission reduction programs. Transp. Res. Part D Transp. Environ. 2018, 61, 234–245. [Google Scholar] [CrossRef]
  27. Huang, L.; Wen, Y.Q.; Geng, X.Q.; Zhou, C.H.; Xiao, C.S. Integrating multi-source maritime information to estimate ship exhaust emissions under wind, wave and current conditions. Transp. Res. Part D Transp. Environ. 2018, 59, 148–159. [Google Scholar] [CrossRef]
  28. Irannezhad, E.; Prato, C.G.; Hickman, M. The effect of cooperation among shipping lines on transport costs and pollutant emissions. Transp. Res. Part D Transp. Environ. 2018, 65, 312–323. [Google Scholar] [CrossRef]
  29. Zhang, Q.; Wan, Z.; Hemmings, B.; Abbasov, F. Reducing black carbon emissions from Arctic shipping: Solutions and policy implications. J. Clean. Prod. 2019, 241, 118261. [Google Scholar] [CrossRef]
  30. Chen, Q.; Ge, Y.E.; Ng, A.K.Y.; Lau, Y.Y.; Tao, X.Z. Implications of Arctic shipping emissions for marine environment. Marit. Policy Manag. 2022, 49, 155–180. [Google Scholar] [CrossRef]
  31. Chen, Q.; Lau, Y.Y.; Ge, Y.E.; Dulebenets, M.A.; Kawasaki, T.; Ng, A.K.Y. Interactions between Arctic passenger ship activities and emissions. Transp. Res. Part D Transp. Environ. 2021, 97, 102925. [Google Scholar] [CrossRef]
  32. Peng, X.; Wen, Y.Q.; Wu, L.C.; Xiao, C.S.; Zhou, C.H.; Han, D. A sampling method for calculating regional ship emission inventories. Transp. Res. Part D Transp. Environ. 2020, 89, 102617. [Google Scholar] [CrossRef]
  33. Poulsen, R.T.; Sampson, H. A swift turnaround? Abating shipping greenhouse gas emissions via port call optimization. Transp. Res. Part D Transp. Environ. 2020, 86, 102460. [Google Scholar] [CrossRef]
  34. Huang, L.; Wen, Y.Q.; Zhang, Y.M.; Zhou, C.H.; Zhang, F.; Yang, T.T. Dynamic calculation of ship exhaust emissions based on real-time AIS data. Transp. Res. Part D Transp. Environ. 2020, 80, 102277. [Google Scholar] [CrossRef]
  35. Xu, H.; Yang, D. LNG-fuelled container ship sailing on the Arctic Sea: Economic and emission assessment. Transp. Res. Part D Transp. Environ. 2020, 87, 102556. [Google Scholar] [CrossRef]
  36. Jiang, H.; Peng, D.; Wang, Y.J.; Fu, M.L. Comparison of Inland Ship Emission Results from a Real-World Test and an AIS-Based Model. Atmosphere 2021, 12, 1611. [Google Scholar] [CrossRef]
  37. Kong, Q.X.; Jiang, C.M.; Ng, A.K.Y. The economic impacts of restricting black carbon emissions on cargo shipping in the Polar Code Area. Transp. Res. Part A Policy Pract. 2021, 147, 159–176. [Google Scholar] [CrossRef]
  38. Cheaitou, A.; Faury, O.; Etienne, L.; Fedi, L.; Rigot-Mueller, P.; Stephenson, S. Impact of CO2 emission taxation and fuel types on Arctic shipping attractiveness. Transp. Res. Part D Transp. Environ. 2022, 112, 103491. [Google Scholar] [CrossRef]
  39. Schwarzkopf, D.A.; Petrik, R.; Matthias, V.; Quante, M.; Yu, G.Y.; Zhang, Y. Comparison of the Impact of Ship Emissions in Northern Europe and Eastern China. Atmosphere 2022, 13, 894. [Google Scholar] [CrossRef]
  40. Doundoulakis, E.; Papaefthimiou, S. A comparative methodological approach for the calculation of ships air emissions and fuel-energy consumption in two major Greek ports. Marit. Policy Manag. 2022, 49, 1135–1154. [Google Scholar] [CrossRef]
  41. Nevalainen, O.; Honkavaara, E.; Tuominen, S.; Viljanen, N.; Hakala, T.; Yu, X.; Hyyppa, J.; Saari, H.; Polonen, I.; Imai, N.N.; et al. Individual Tree Detection and Classification with UAV-Based Photogrammetric Point Clouds and Hyperspectral Imaging. Remote Sens. 2017, 9, 185. [Google Scholar] [CrossRef]
  42. Dabrowski, P.S.; Specht, C.; Specht, M.; Burdziakowski, P.; Makar, A.; Lewicka, O. Integration of Multi-Source Geospatial Data from GNSS Receivers, Terrestrial Laser Scanners, and Unmanned Aerial Vehicles. Can. J. Remote Sens. 2021, 47, 621–634. [Google Scholar] [CrossRef]
  43. Molina, P.; Colomina, I.; Vitoria, T.; Silva, P.F.; Skaloud, J.; Kornus, W.; Prades, R.; Aguilera, C. Searching Lost People with UAVs: The System and Results of the Close-search Project. ISPRS Int. Arch. Photogramm. Remote Sens. Spat. Inf. Sci. 2012, 39, 441–446. [Google Scholar] [CrossRef] [Green Version]
  44. Caric, H.; Cukrov, N.; Omanovic, D. Nautical Tourism in Marine Protected Areas (MPAs): Evaluating an Impact of Copper Emission from Antifouling Coating. Sustainability 2021, 13, 11897. [Google Scholar] [CrossRef]
  45. Kezoudi, M.; Keleshis, C.; Antoniou, P.; Biskos, G.; Bronz, M.; Constantinides, C.; Desservettaz, M.; Gao, R.S.; Girdwood, J.; Harnetiaux, J.; et al. The Unmanned Systems Research Laboratory (USRL): A New Facility for UAV-Based Atmospheric Observations. Atmosphere 2021, 12, 1042. [Google Scholar] [CrossRef]
  46. Zhou, F.; Liu, J.; Zhu, H.; Yang, X.D.; Fan, Y.L. A Real-Time Measurement-Modeling System for Ship Air Pollution Emission Factors. J. Mar. Sci. Eng. 2022, 10, 760. [Google Scholar] [CrossRef]
  47. Sun, Z.H.; Luo, X.S.; Wu, E.D.Q.; Zuo, T.Y.; Tang, Z.R.; Zhuang, Z.L. Monitoring Scheduling of Drones for Emission Control Areas: An Ant Colony-Based Approach. IEEE Trans. Intell. Transp. Syst. 2022, 23, 11699–11709. [Google Scholar] [CrossRef]
  48. Haugen, M.J.; Gkantonas, S.; El Helou, I.; Pathania, R.; Mastorakos, E.; Boies, A.M. Measurements and modelling of the three-dimensional near-field dispersion of particulate matter emitted from passenger ships in a port environment. Atmos. Env. 2022, 290, 119384. [Google Scholar] [CrossRef]
  49. Syswerda, G. Schedule Optimization Using Genetic Algorithms; Van Nostran Reinhold: New York, NY, USA, 1990. [Google Scholar]
  50. Gen, M.; Cheng, R. Genetic Algorithms and Engineering Design; John Wily and Sons: New York, NY, USA, 1997. [Google Scholar]
  51. Ben-Hakoun, E.; Van De Voorde, E.; Shiftan, Y. Marine environmental emission reduction policy in the liner shipping the economic impact from trade lane perspective. Marit. Policy Manag. 2021, 48, 725–753. [Google Scholar] [CrossRef]
Figure 1. A conceptual diagram of the cyber-physical system.
Atmosphere 14 00373 g001
Figure 2. A system framework for drone-based ship management.
Atmosphere 14 00373 g002
Figure 3. The data-entity model.
Atmosphere 14 00373 g003
Figure 4. A drone with modules for emission detection.
Atmosphere 14 00373 g004
Figure 5. A module of emission sensors.
Atmosphere 14 00373 g005
Figure 6. An ECA around Shanghai.
Atmosphere 14 00373 g006
Figure 7. A conceptual diagram of drone routing for emission detection.
Atmosphere 14 00373 g007
Figure 8. A conceptual diagram of the meeting model.
Atmosphere 14 00373 g008
Figure 9. A background diagram for dataset generation.
Atmosphere 14 00373 g009
Figure 10. Influence of crossover and mutation probabilities on solutions. (a) Influence of crossover and mutation probabilities on the solutions; (b) Influence of crossover and mutation probabilities on solving time.
Atmosphere 14 00373 g010
Figure 11. Influence of crossover rate and mutation rate on genetic algorithm.
Atmosphere 14 00373 g011
Figure 12. Performance evaluation of the GA. (a) Influence of ships on solution time; (b) Iterative evolution.
Atmosphere 14 00373 g012
Figure 13. Influence of drone flying speed on time and distance. (a) Travel time; (b) Travel distance.
Atmosphere 14 00373 g013
Table 1. Studies on ship emission and impacts.
StudyResearch ProblemResearch MethodRegion/Port
[6]Assess ship emissions mitigation strategiesComparison analysisOslo Port
[22]Cost of reducing ship emissionsQualitative analysisNorth European
[23]Sulfur emissions and ship sailing patternsLifespan cost evaluationECAs
[24]Estimate ship emissionsActivity-based methodPorts of Dubrovnik and Kotor
[25]Effect of ECA policy on cruise shippingMILP and tabu searchECAs
[26]Voluntary participation in emission reduction programsQualitative analysisPorts of Los Angeles and Long Beach
[27]Estimate ship emissionsActivity-based methodNingbo-Zhoushan Port
[28]Effect of shipping lines cooperation on emissionsSimulationBrisbane Port
[29]Solutions and policy for reducing emissionsComprehensive analysisArctic region
[30]Estimate ship emissionsAIS data-driven analysisArctic region
[31]Interactions between ship activities and pollutantsData-driven analysisArctic region
[32]Regional ship emission inventoriesRandom sampling and activity-based methodYangtze river
[7]Estimate ship emissionsAIS data-driven and the STEAM modelYangtze River
[33]Ship emissions and the ships’ waiting times for berthingReal-time traffic information, Port call optimizationPort area
[34]Dynamic calculation of ship exhaust emissionsActivity-based method, Dynamic inventoryShenzhen Port
[35]Emission reduction of LNG-fueled container shipsProfit model, economic feasibility analysisNorthern Sea Route
[36]Comparison of inland ship emissionsAIS data-driven analysisChina
[37]Economic impacts of restricting emissions on shippingQuantitative analysisArctic sea
[38]Emission taxation policyRisk analysisNorthern Sea Route
[39]Regional comparison of ship emissionsComparison analysisEurope, China
[11]Develop ship emission inventoriesComparison analysisChina ports
[4]Estimate ship emissionsVessel traffic system dataSouth Korea
[40]Estimate ship emissions and fuel-energy consumptionRegression analysisGreek ports
Table 2. Studies on drones applied to ships.
StudyResearch ProblemResearch Methods
[17]Detection and characterization of near-range combustion plume events.The integrated LiDAR-Pandora colocated technique; the combined remote sensing approach.
[21]Monitor ships in ECAs.Model the dynamics of each sailing ship using drones; build a time-expanded network and solve it by the Lagrangian relaxation-based method.
[19]Plume-sniffing microsensor protocol. A drone communication system; measurement accuracy in simulated conditions and real-world scenarios.
[44]Relationship between ship traffic and emission density.A mapping of maritime traffic by counting transits, radar imagery, and drone photography.
[45]The scientific potential of drone-based measurements in the atmospheric sciences.Drone-sensor systems integrated with Earth observation networks.
[46]Measure ship emission factors in various weather scenarios.A real-time monitoring system using drone; a modeling and information system.
[20]Dispatching drones for emission monitoring.Reinforcement learning.
[47]Drone scheduling problem.Heuristics and intelligent algorithms.
[48]Characterize maritime particle emissions in port areas.A Gaussian plume dispersion model; the incompletely stirred reactor network method.
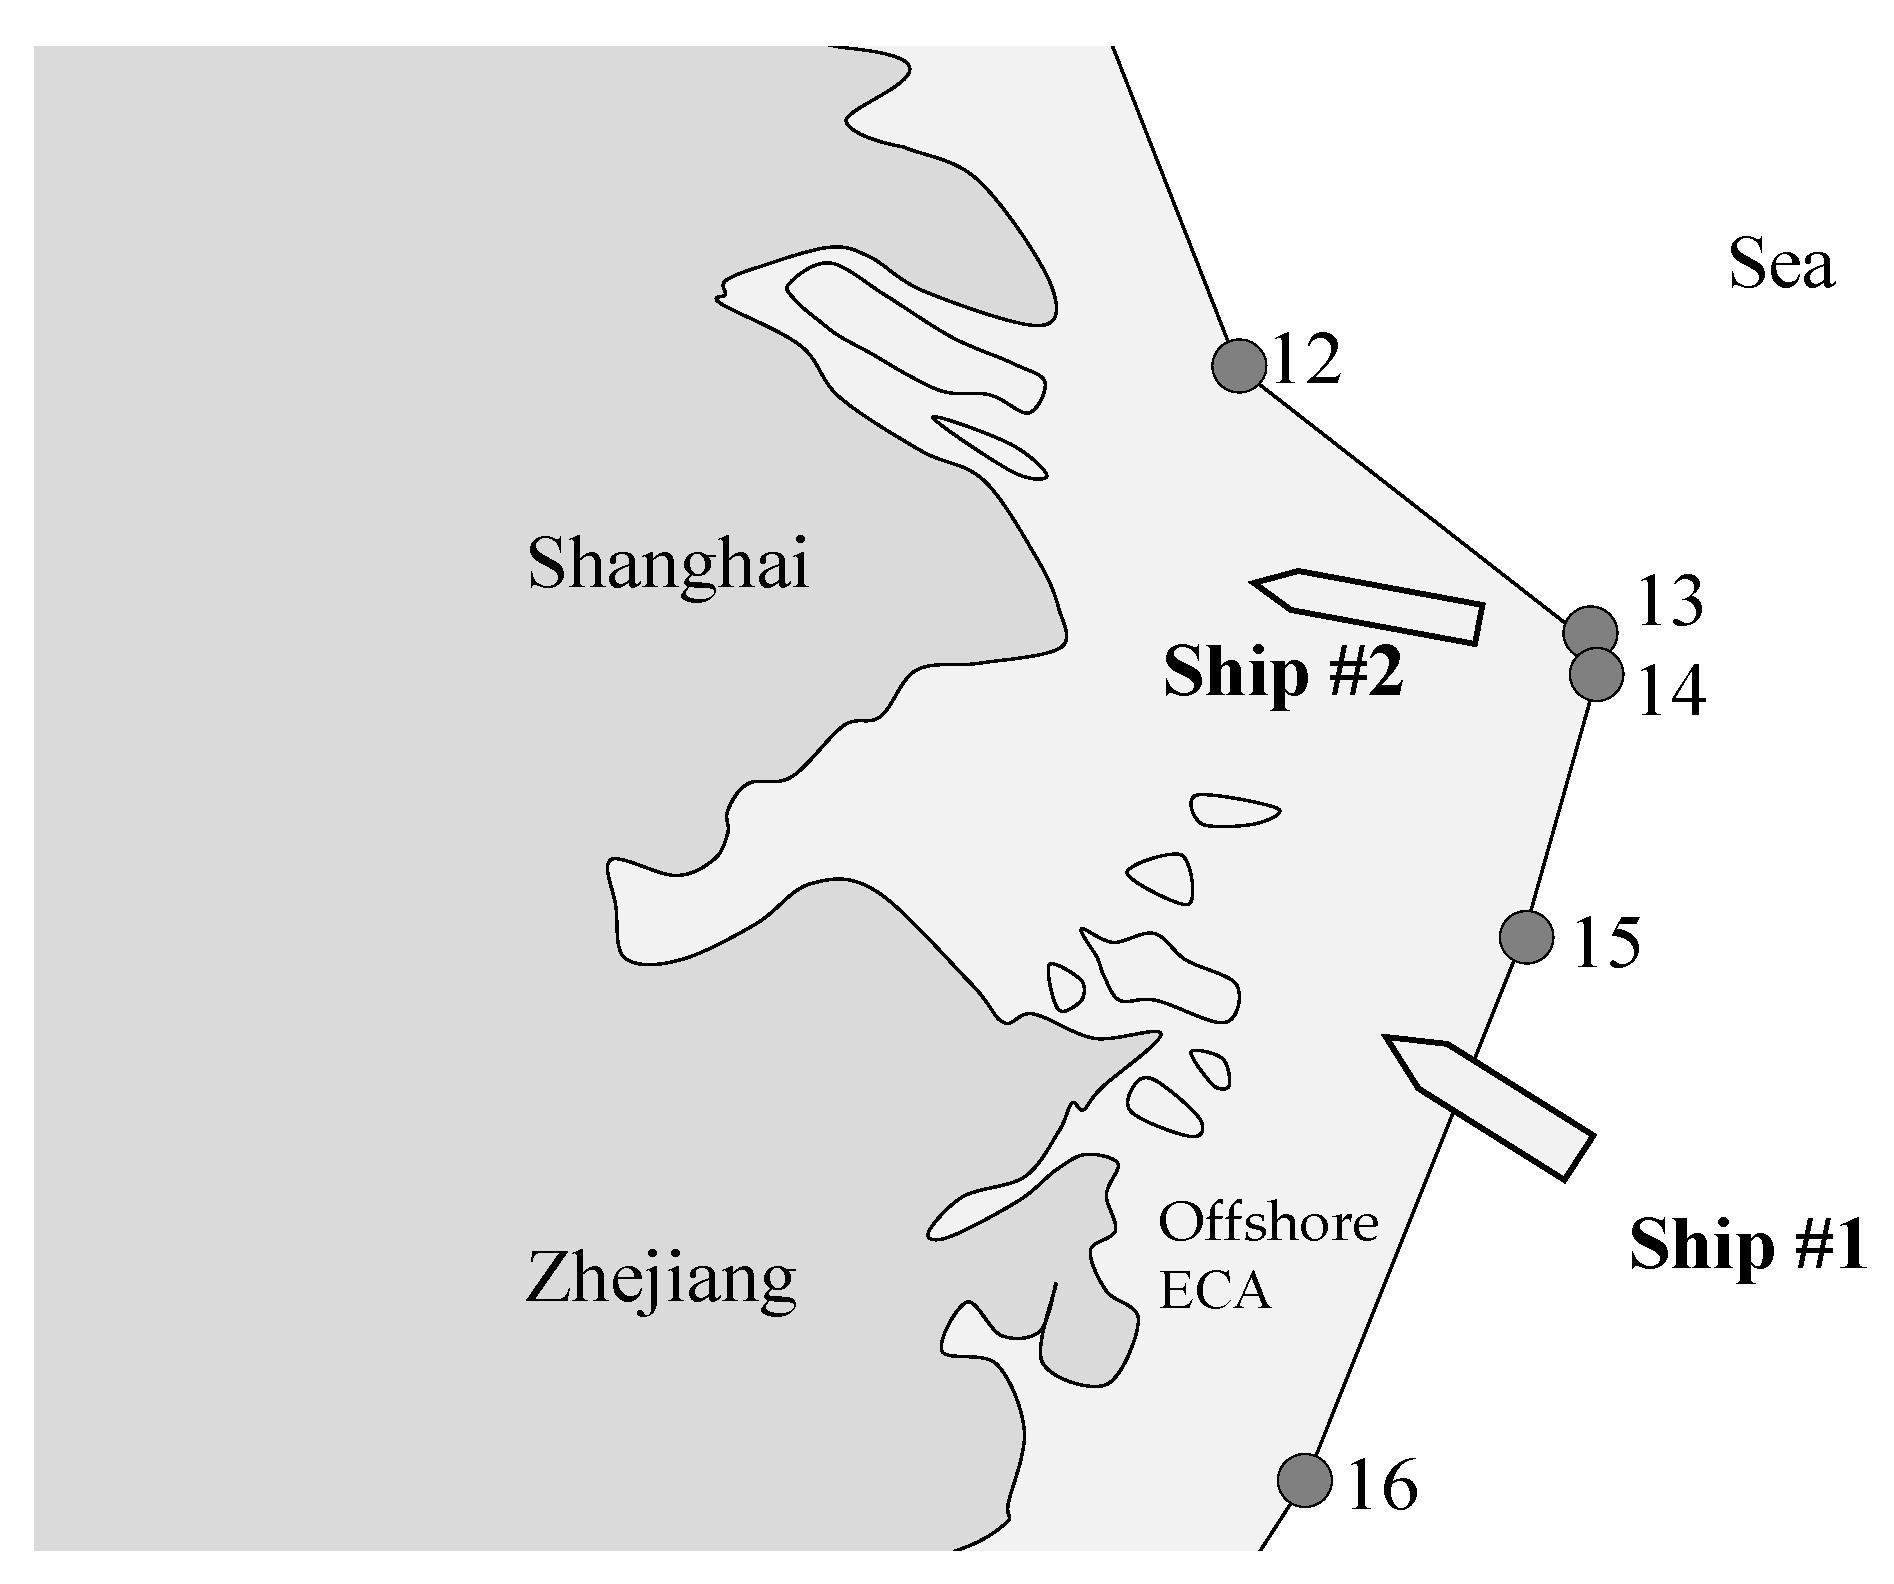
Table 3. Four key geographical points of an ECA.
No.LongitudeLatitude
12122°26′42.00″31°32′08.52′′
13123°23′31.20″30°49′15.96′′
14123°24′36.00″30°45′51.84′′
15123°09′28.80″30°05′43.44′′
Table 4. Demonstrate the results of case-solving.
Ship  i X i (km) Y i (km) X i t (km) Y i t (km) V i (km/s) x i (km) y i (km) t i (s)Sequence
1910150510.62 7.30 126.443
2179160616.38 3.42 146.505
38701056.04 7.73 212.491
44916097.63 6.28 86.132
5159110712.76 3.95 158.714
6164061.55 4.90 205.480
Disclaimer/Publisher’s Note: The statements, opinions and data contained in all publications are solely those of the individual author(s) and contributor(s) and not of MDPI and/or the editor(s). MDPI and/or the editor(s) disclaim responsibility for any injury to people or property resulting from any ideas, methods, instructions or products referred to in the content.

