1. Introduction
Astroclimate is a set of atmospheric parameters that can affect astronomical observations. These include such parameters as the amount of clear time, integral turbulence (also known as seeing), atmospheric transparency, atmospheric extinction, and parameters relevant to adaptive optics performance [
1,
2]. The main purpose of astroclimatic studies (or site testing) is to increase the efficiency of existing observatories and to choose a place with good atmospheric conditions for a future telescope so that it produces valuable scientific output after installation.
Astronomical seeing is a quantity that evaluates the optical turbulence of the atmosphere [
3]. The integral seeing represents the sum of turbulence throughout the atmosphere. Meteorologically, the atmosphere is divided into 3 layers. These layers are the free atmosphere, boundary layer, and ground layer. The meteorological parameters in the ground layer reflect the processes in the lowermost layer of the atmosphere. Therefore, they can affect astronomical seeing, i.e., atmospheric surface turbulence and meteorological parameters are interrelated. By measuring meteorological parameters in the ground layer, we can study its effect on seeing since a part of the near-ground turbulence contributes to overall seeing.
The previous period of site testing at Maidanak Observatory took place in the period from 1996–2003 [
4,
5]. The seeing in comparison to the La Silla and Paranal observatories, high-altitude wind speed, optical turbulence in the free atmosphere, and extinction, were a few of the atmospheric characteristics that were investigated [
6,
7,
8,
9].
New small-to-medium-size telescopes are going to be installed at Maidanak observatory. The largest of these, a 4-m telescope project started in 2017, gave a strong reason to reassess atmospheric factors important to optical astronomy, including the integral turbulence above the observatory. At the observatory, measurements of seeing and meteorological parameters started in 2018 [
10,
11,
12]. This makes it possible to study astronomical seeing and the negative impact of meteorological parameters on astronomical seeing.
Studying the relationship between meteorological characteristics and astronomical seeing is very important. For example, the relationship between ground layer seeing and ground wind speed, as well as the tropopause, was investigated above Cerro Tololo Observatory [
13]. The article [
14] describes the results of the analysis of astroclimatic conditions in the Big Telescope Alt-azimuthal (BTA) region in terms of cloud cover, components of wind speed, and optical turbulence. Similar long-term studies of the astroclimate are also carried out in other mountain observatories at the Sayan Ridge, Lake Baikal, the Altay, and the North Caucasus [
15,
16].
This article provides detailed information about site testing at Maidanak observatory. The data obtained from the observations were analyzed to study the correlation of seeing with meteorological parameters: temperature; temperature variance; wind speed; wind direction.
Section 2 provides information about a new analysis of the amount of clear nighttime.
Section 3 describes the method of differential measurements of seeing.
Section 4 is devoted to the correlations between seeing and meteorological parameters.
2. Amount of Clear Time
The duration of astronomical observations of celestial bodies directly depends on the quantity of cloudless time, making it one of the most crucial factors for an astronomical observatory’s operation. This characteristic is typically first established when selecting a location for a new observatory or building a telescope based on observations of the cloudiness of the available nearby meteorological stations. Since global climate change is an indisputable fact, it became necessary to study the influence of this change on each parameter of the astroclimate of the area. If such a factor is found, it will be necessary to quantify how much cloudiness contributed to the alteration in the astroclimate.
A statistical analysis of cloudiness was conducted based on ground-based observations of the Minchukur meteorological station, which is close to the Maidanak Astronomical Observatory, to search the cloudiness regime over the Maidanak observatory for the presence of long-term trends. The time interval covers the period between 1991–2017. Only the nighttime data between the astronomical twilights were used for this analysis.
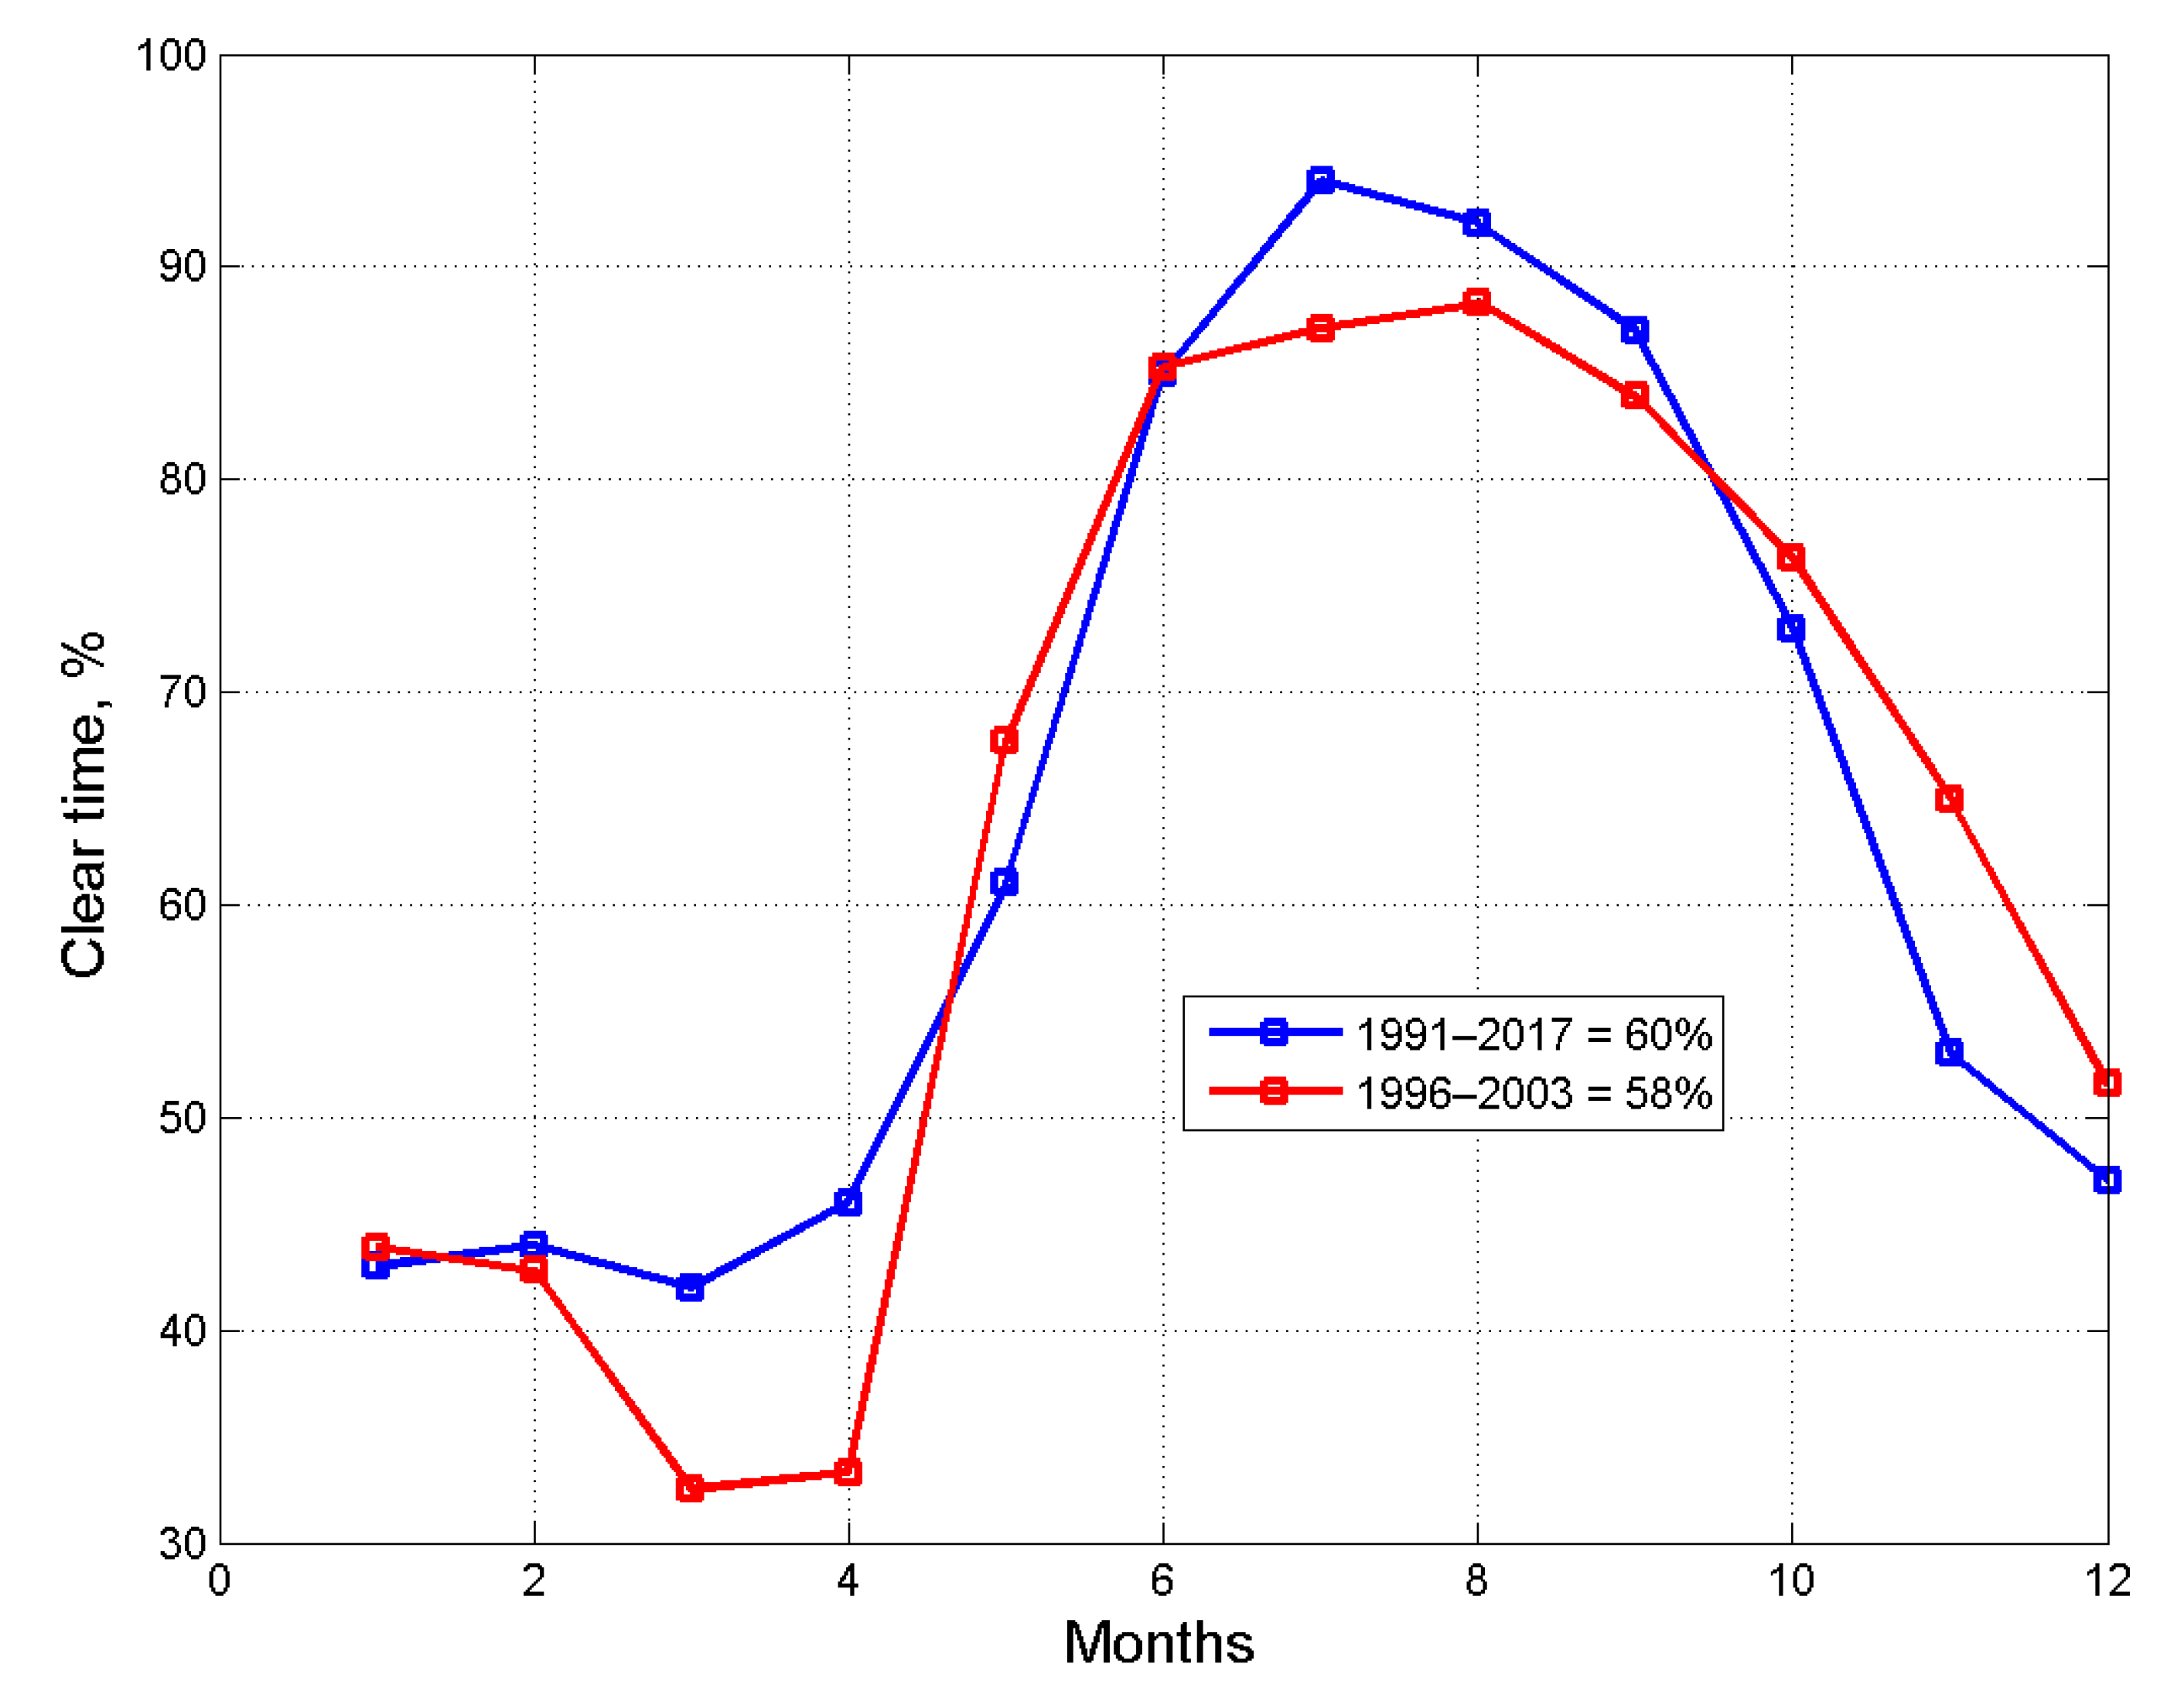
Figure 1 shows the amount of clear time in percent to the maximum possible nighttime for two periods. The blue line represents the 27-year-long meteorological data of Munchukur station monthly. The data of the previous period (shown in red) was compiled according to the observation logbook of seeing measurements in 1996–2003, and it is the quantity of observational night hours.
The blue curve demonstrates that the observatory has a good amount of clear time between May and October, whereas the rest of the year is around 50% or lower. The slight difference between the two curves is caused by (a) the length of the periods are different, and (b) the fact that the series in the period 1996–2003 does not take into account the absence of the observation due to technical aspects, for example, electricity problems or other technical maintenance.
A search for a long-term trend revealed that the time series of the amount of clear time has slight decrease over decades, which might be the influence of global climate changes.
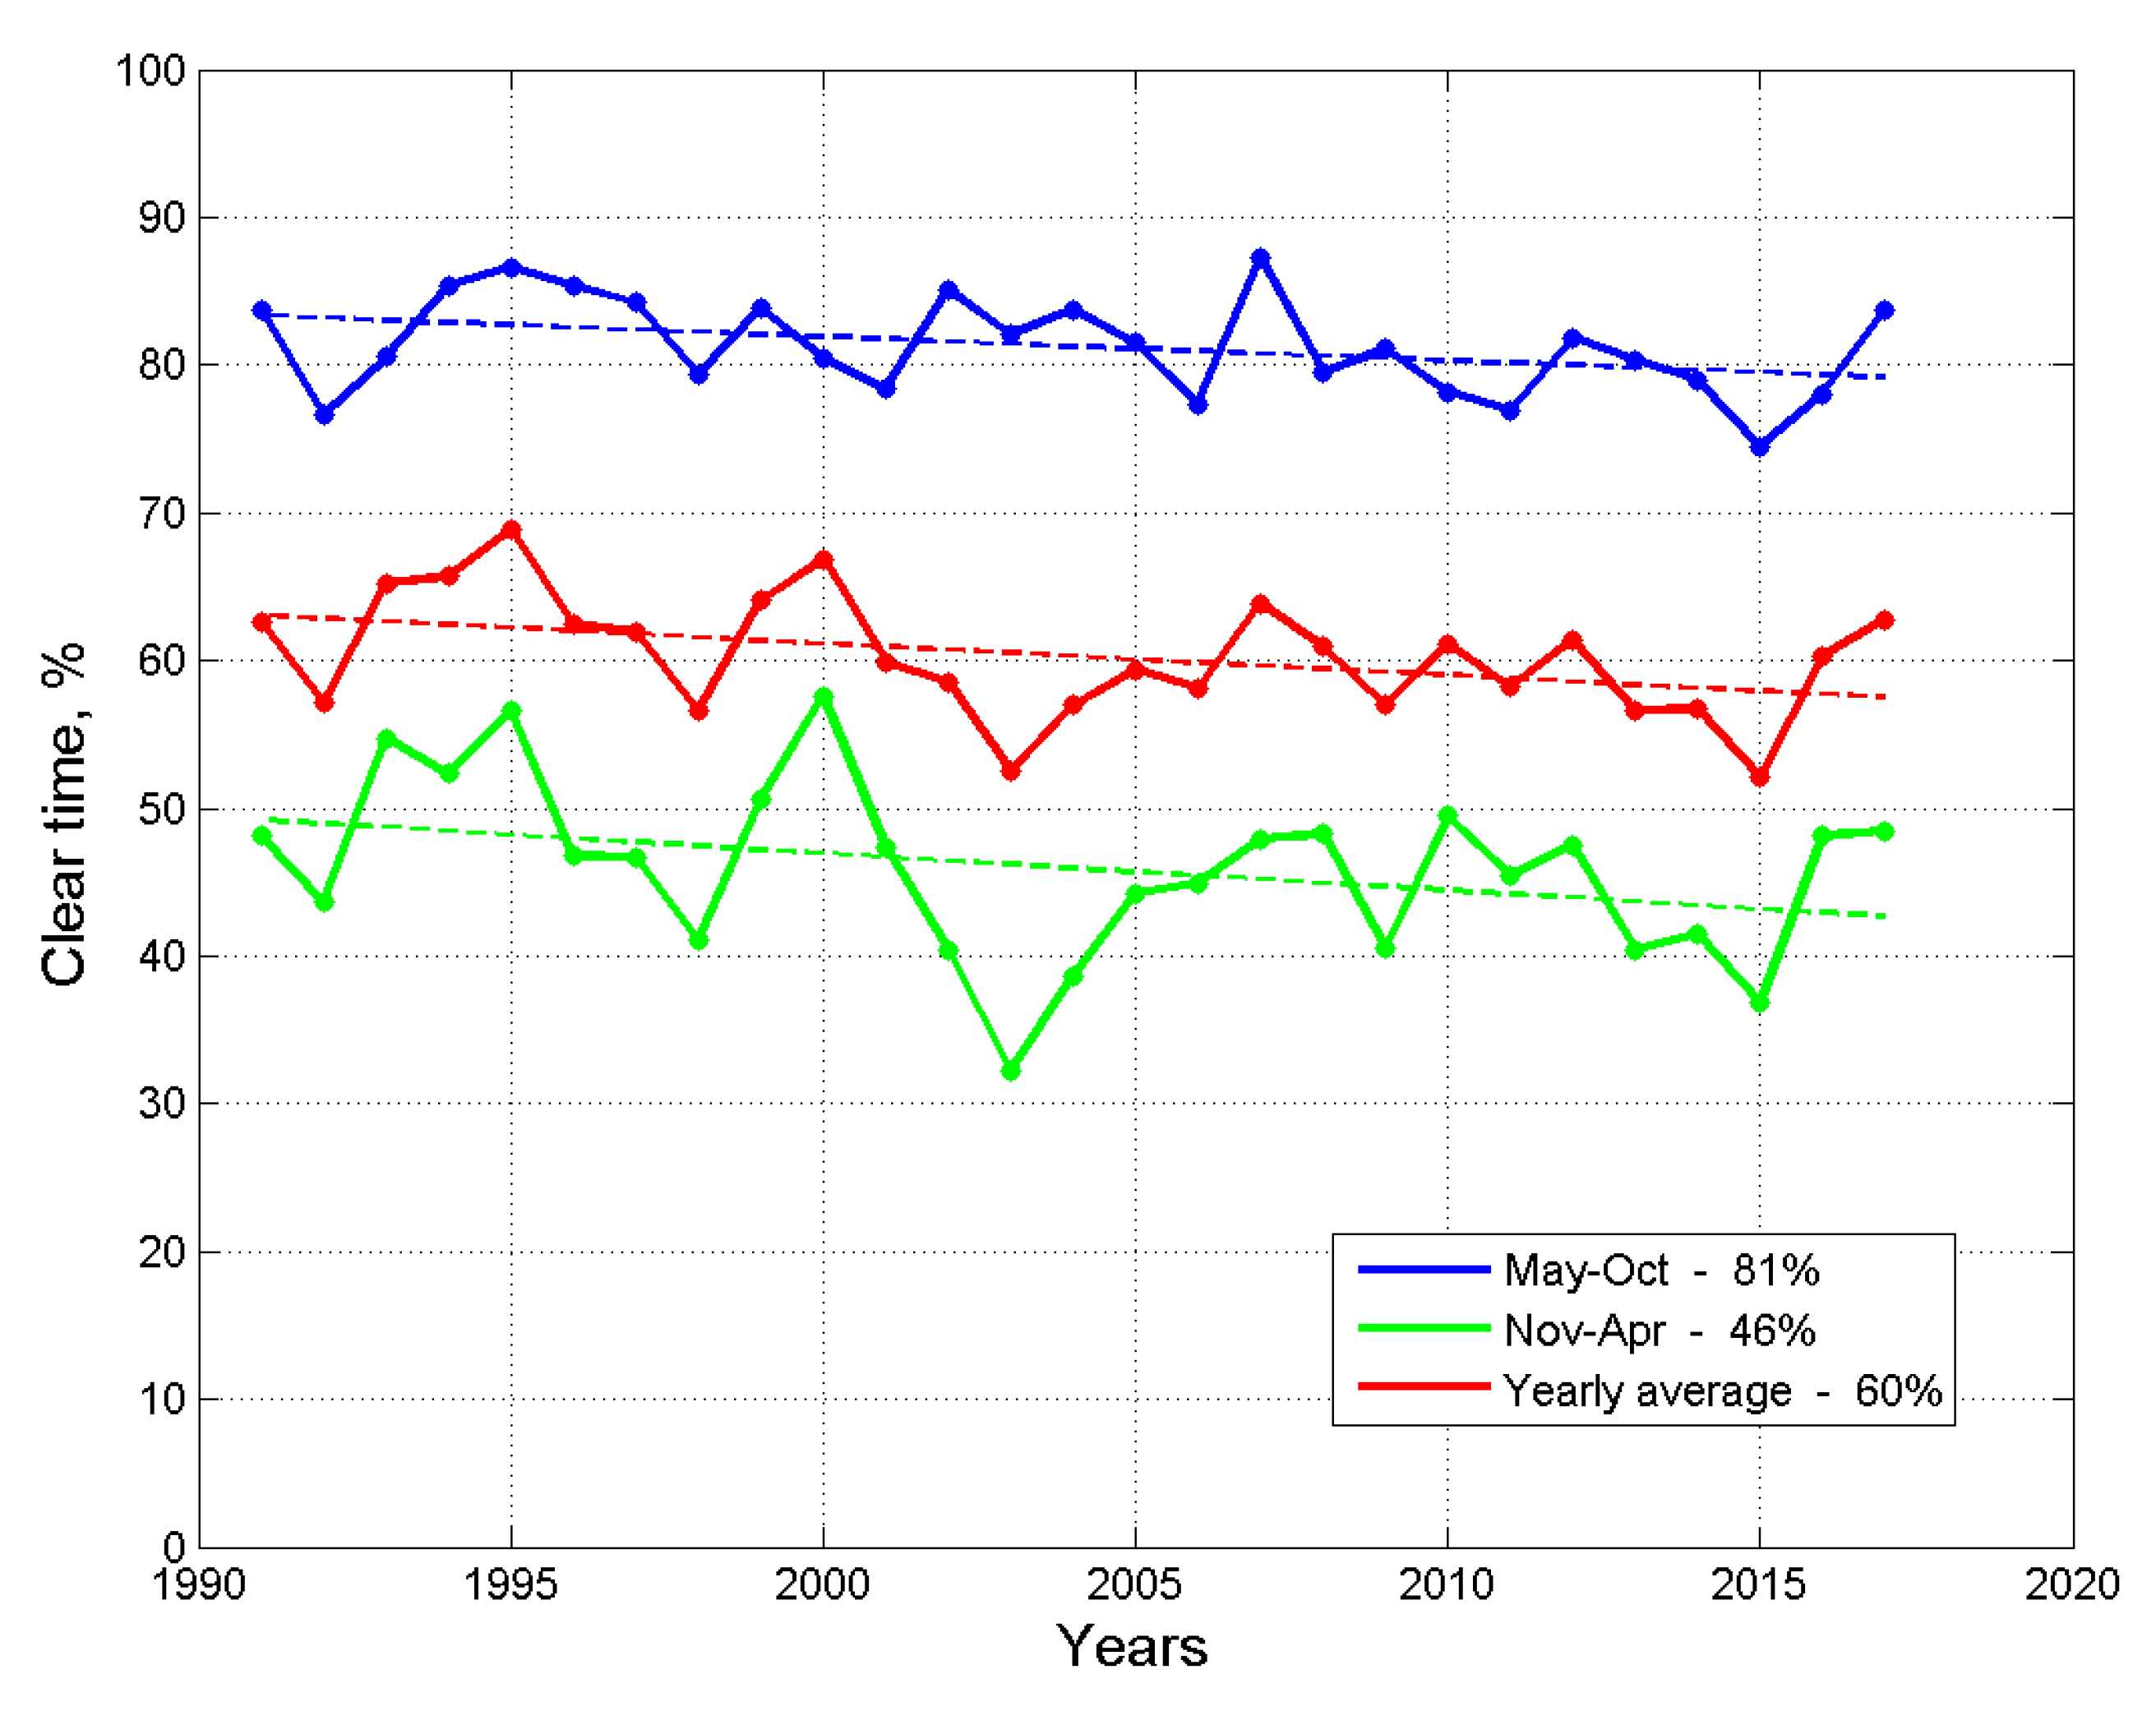
Figure 2 shows the warm and cold periods of the year separated: the period May–October in blue; November–April in green; the yearly average value in red. It should be noted that all 3 quantities have a negative trend of 5–7% for 27 years.
3. Method of Differential Measurements of Seeing
One of the most important optical parameters of the atmosphere that affects the performance of telescopes is the seeing. When comparing observatories with each other, seeing is taken into account first. There are several methods of measuring seeing, the most common of which is the differential method. The full name of the modern standard equipment based on this method is called the Differential Image Motion Monitor (DIMM) [
17]. The astronomical seeing is a measure of integral atmospheric turbulence in arc seconds. It is a full width at half-maximum (FWHM) diameter of a star, measured with a long exposure in the wavelength of 500 nm in zenith using a big telescope. The atmospheric conditions with less turbulence correspond to a smaller value of seeing in arc seconds. The magnitude of the seeing is calculated by observing standard and bright stars using a telescope. Two images of the star are created using a wedge prism installed on the entrance of one of two subapertures. A series of 500 measurements of the distance in longitudinal and transversal directions make up one set. Then variances of distances are used for seeing calculation according to a well-known theory [
18].
Meteorological parameters are of particular importance in studying the characteristics of the atmosphere above the observatory. The main meteorological parameters include air temperature, pressure, wind speed, and direction. In September 2021, a new weather station was installed next to the DIMM equipment located on a 6-m platform to continuously record and monitor these meteorological parameters, as well as to study their impact on seeing. It is a medium-class wireless meteorological station (HP2550) previously calibrated with the meteorological station operating at Maidanak observatory [
19].
The DIMM telescope is installed on a 6-m platform located around 100 m south of the AZT-22 telescope at the Maidanak observatory (
Figure 3). The weather station was also installed on the same platform next to the DIMM instrument at the same height.
The weather station records one value of meteorological parameters every 5 min throughout the day. And the DIMM receives 3 values every minute. Due to the difference in the data recording time of both devices, the seeing values were adjusted to the time of the meteorological parameters, and the intermediate seeing values were averaged. Thus, seeing and meteorological parameters were synchronized. These results were processed and analyzed using MatLab software (
https://www.mathworks.com/products/matlab.html).
4. Seeing Measurements and Statistics
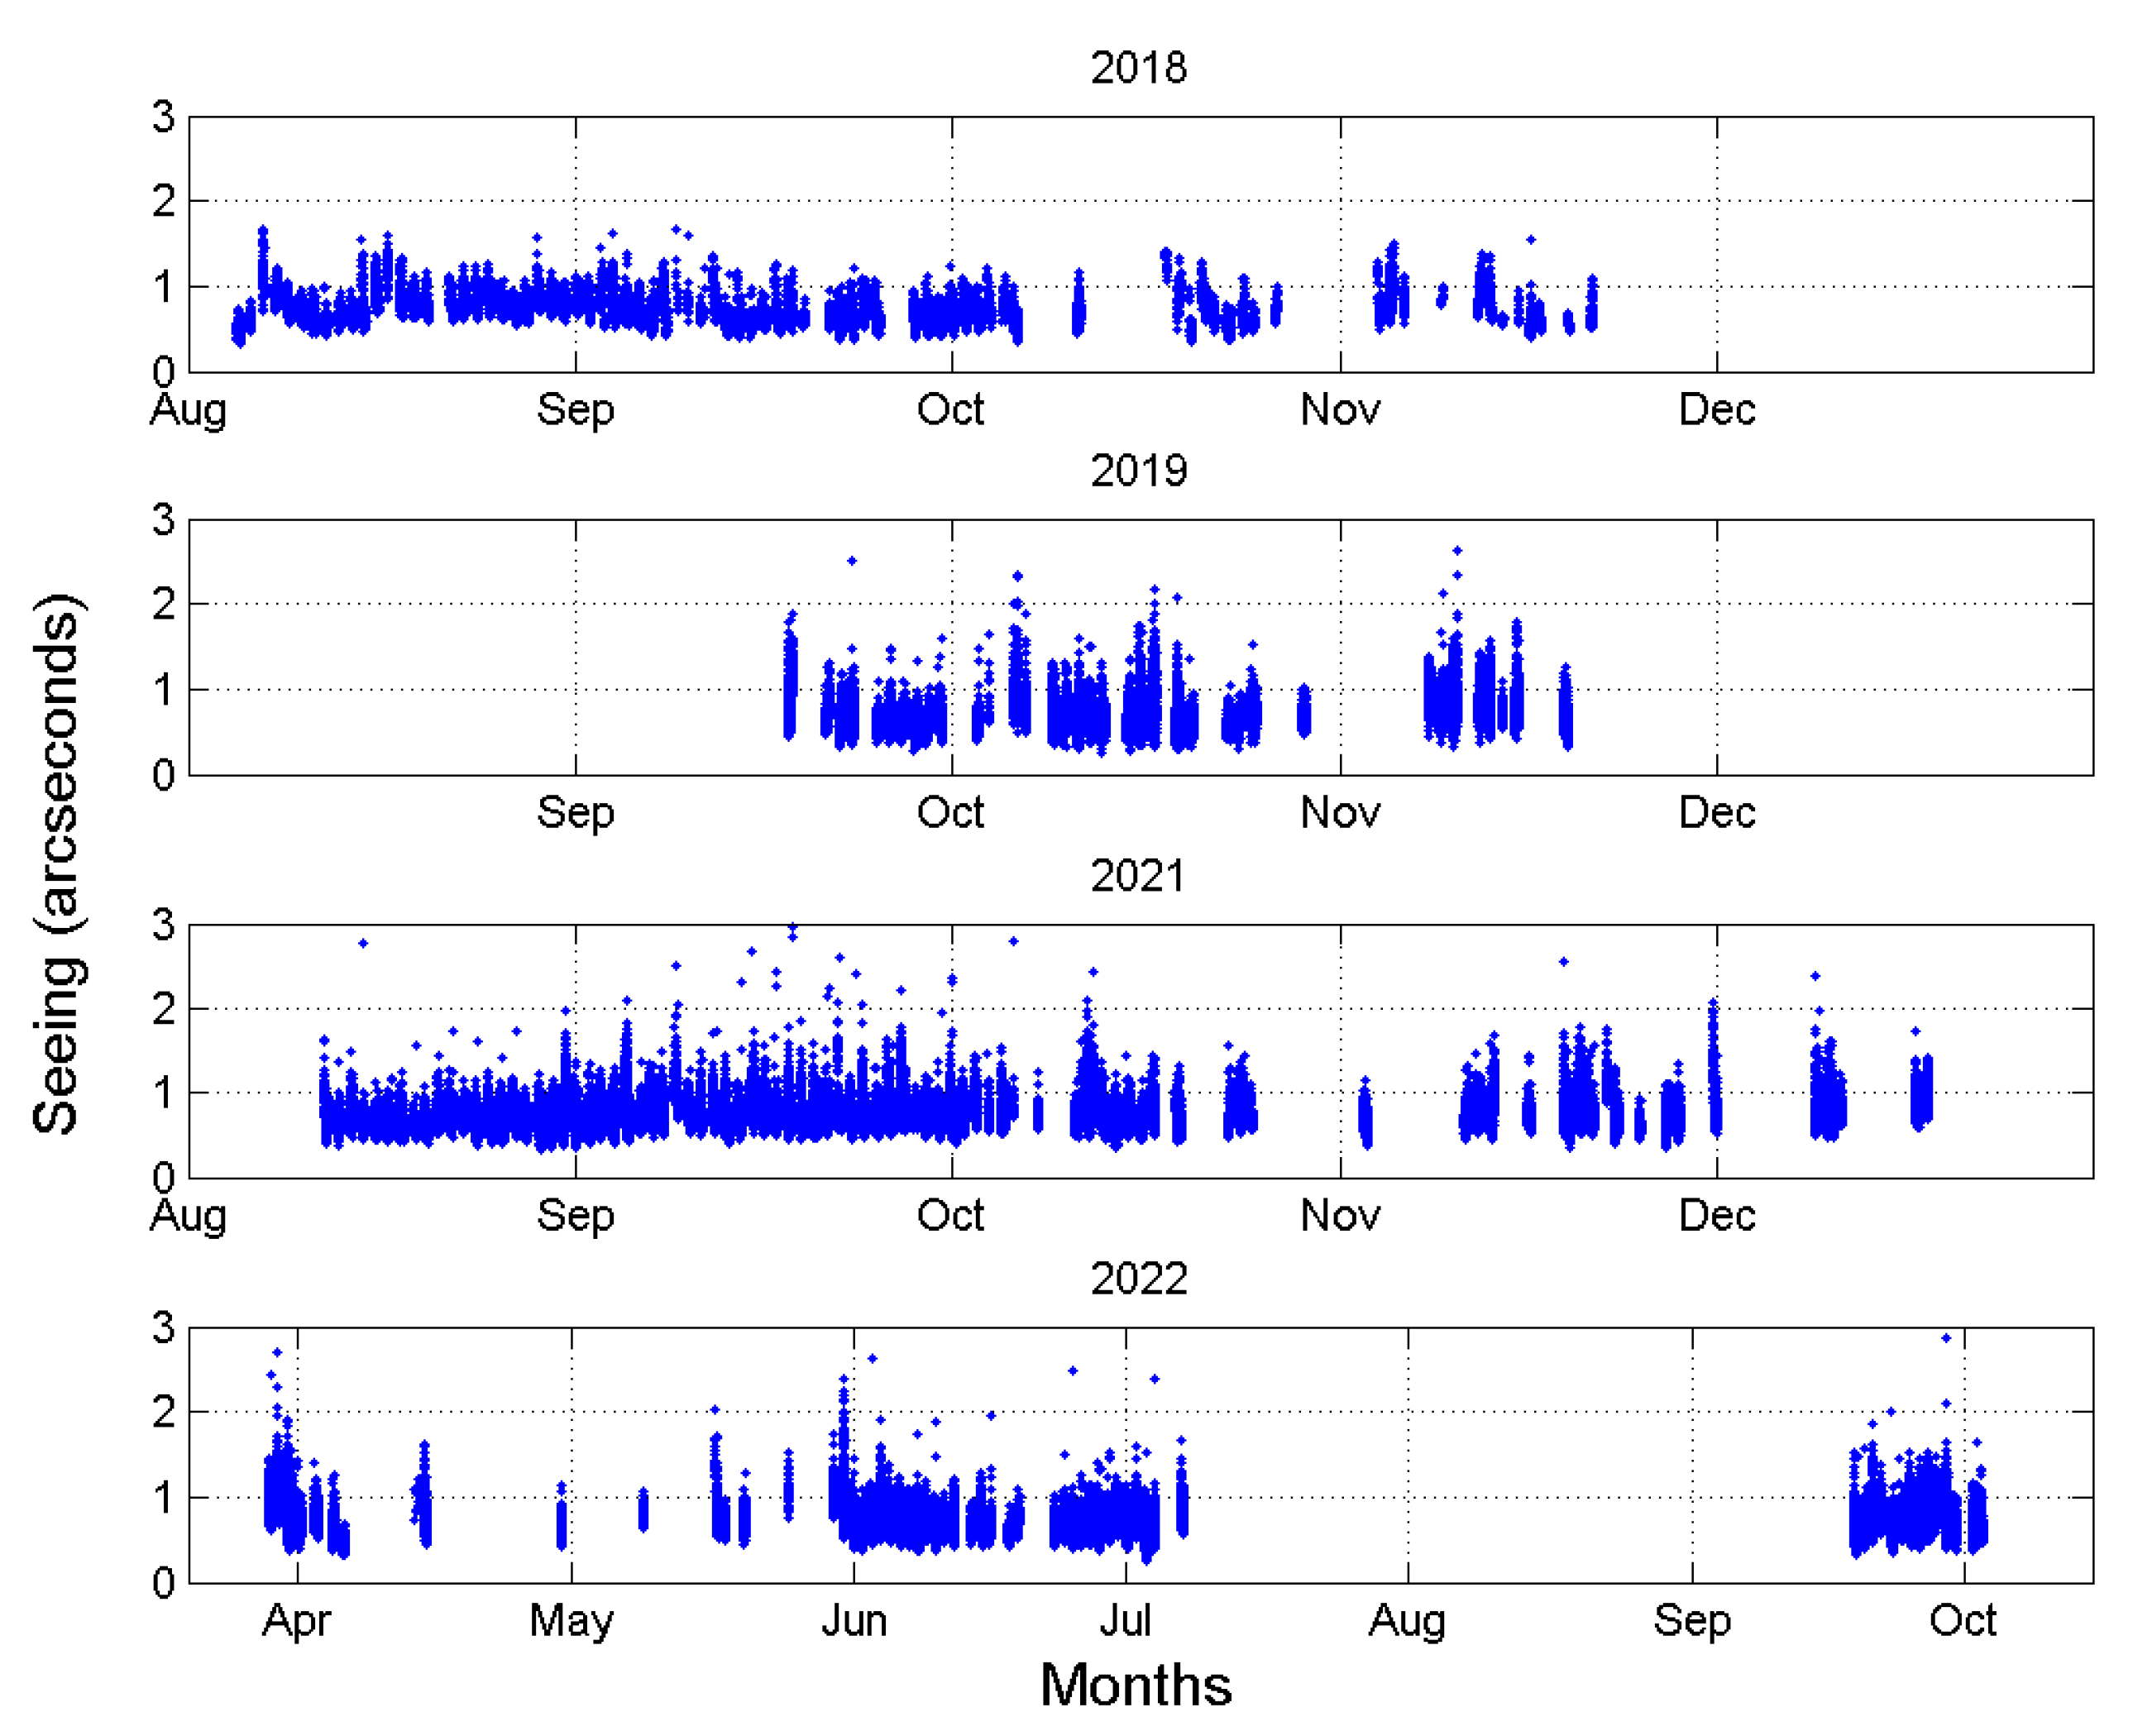
The astronomical seeing observations covered four years in the period 2018–2022 with a total number of 266 nights.
Table 1 summarizes the early numbers of nights, measurements, and percentile values of seeing, as well as average and standard deviations. The data gaps are caused by technical maintenance and Covid-19 restrictions (2020–2021).
Figure 4 shows the seeing time series for all four years.
A total of 133,420 measurements of seeing were acquired during the observations (
Table 1).
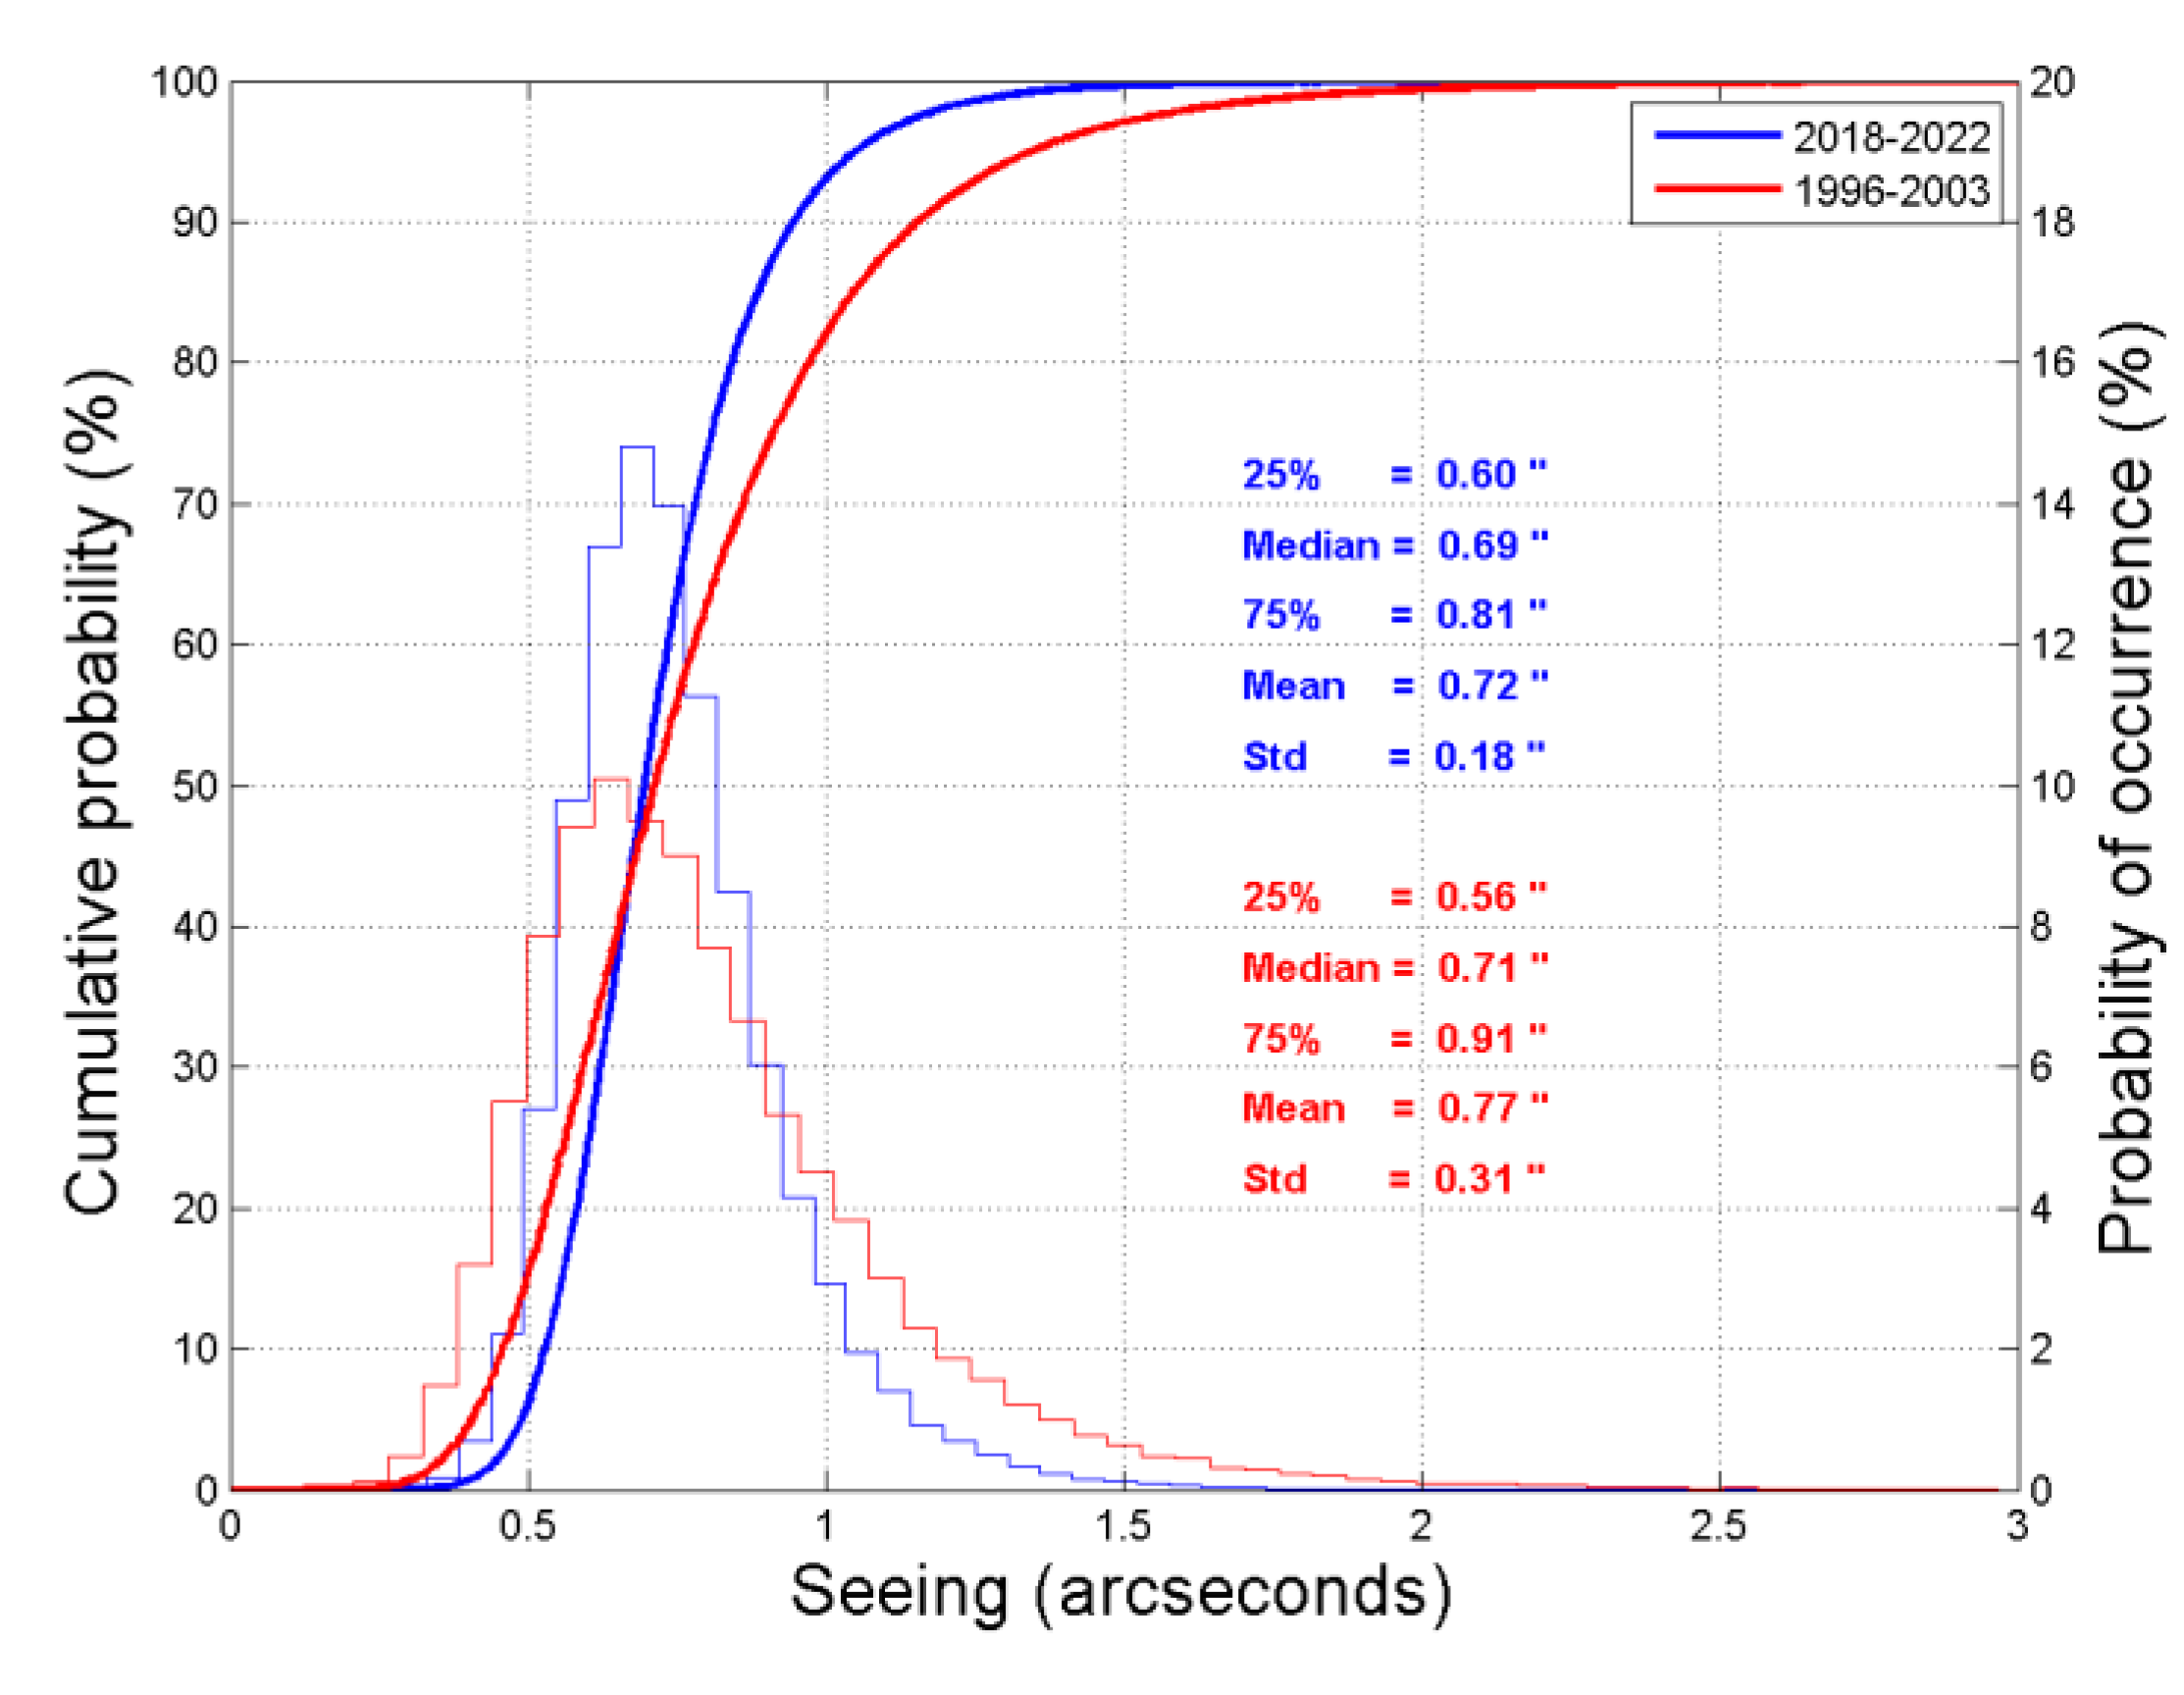
Figure 5 displays the cumulative distribution of seeing for two distinct period observations. The median seeing value for the full observation period was 0.69′′. For comparison, the red line displays the seeing distribution from 1996 to 2003, where the median value of the seeing was 0.71. It was discovered that the annual median value of seeing was 0.70′′ in 2018, 0.65′′ in 2019, 0.71′′ in 2021, and 0.69′′ in 2022.
From the recent measurements of the seeing acquired at the Maidanak Observatory, monthly statistics were also examined.
Table 2 displays these values. The overall standard deviation period was found to be 0.18. The seeing results for the comparable months of 1996–2003 are also displayed for comparison. The new survey results show that October is the best month and December is the worst. From 1996 through 2003, November and February were the best and worst months, respectively.
5. Correlation between Seeing and Meteorological Parameters
The correlation between seeing and meteorological parameters was analyzed based on the data obtained in 2021. The correlation coefficient was determined for 3 main meteorological parameters—temperature, wind speed, and direction.
5.1. Seeing Versus Wind Speed and Direction
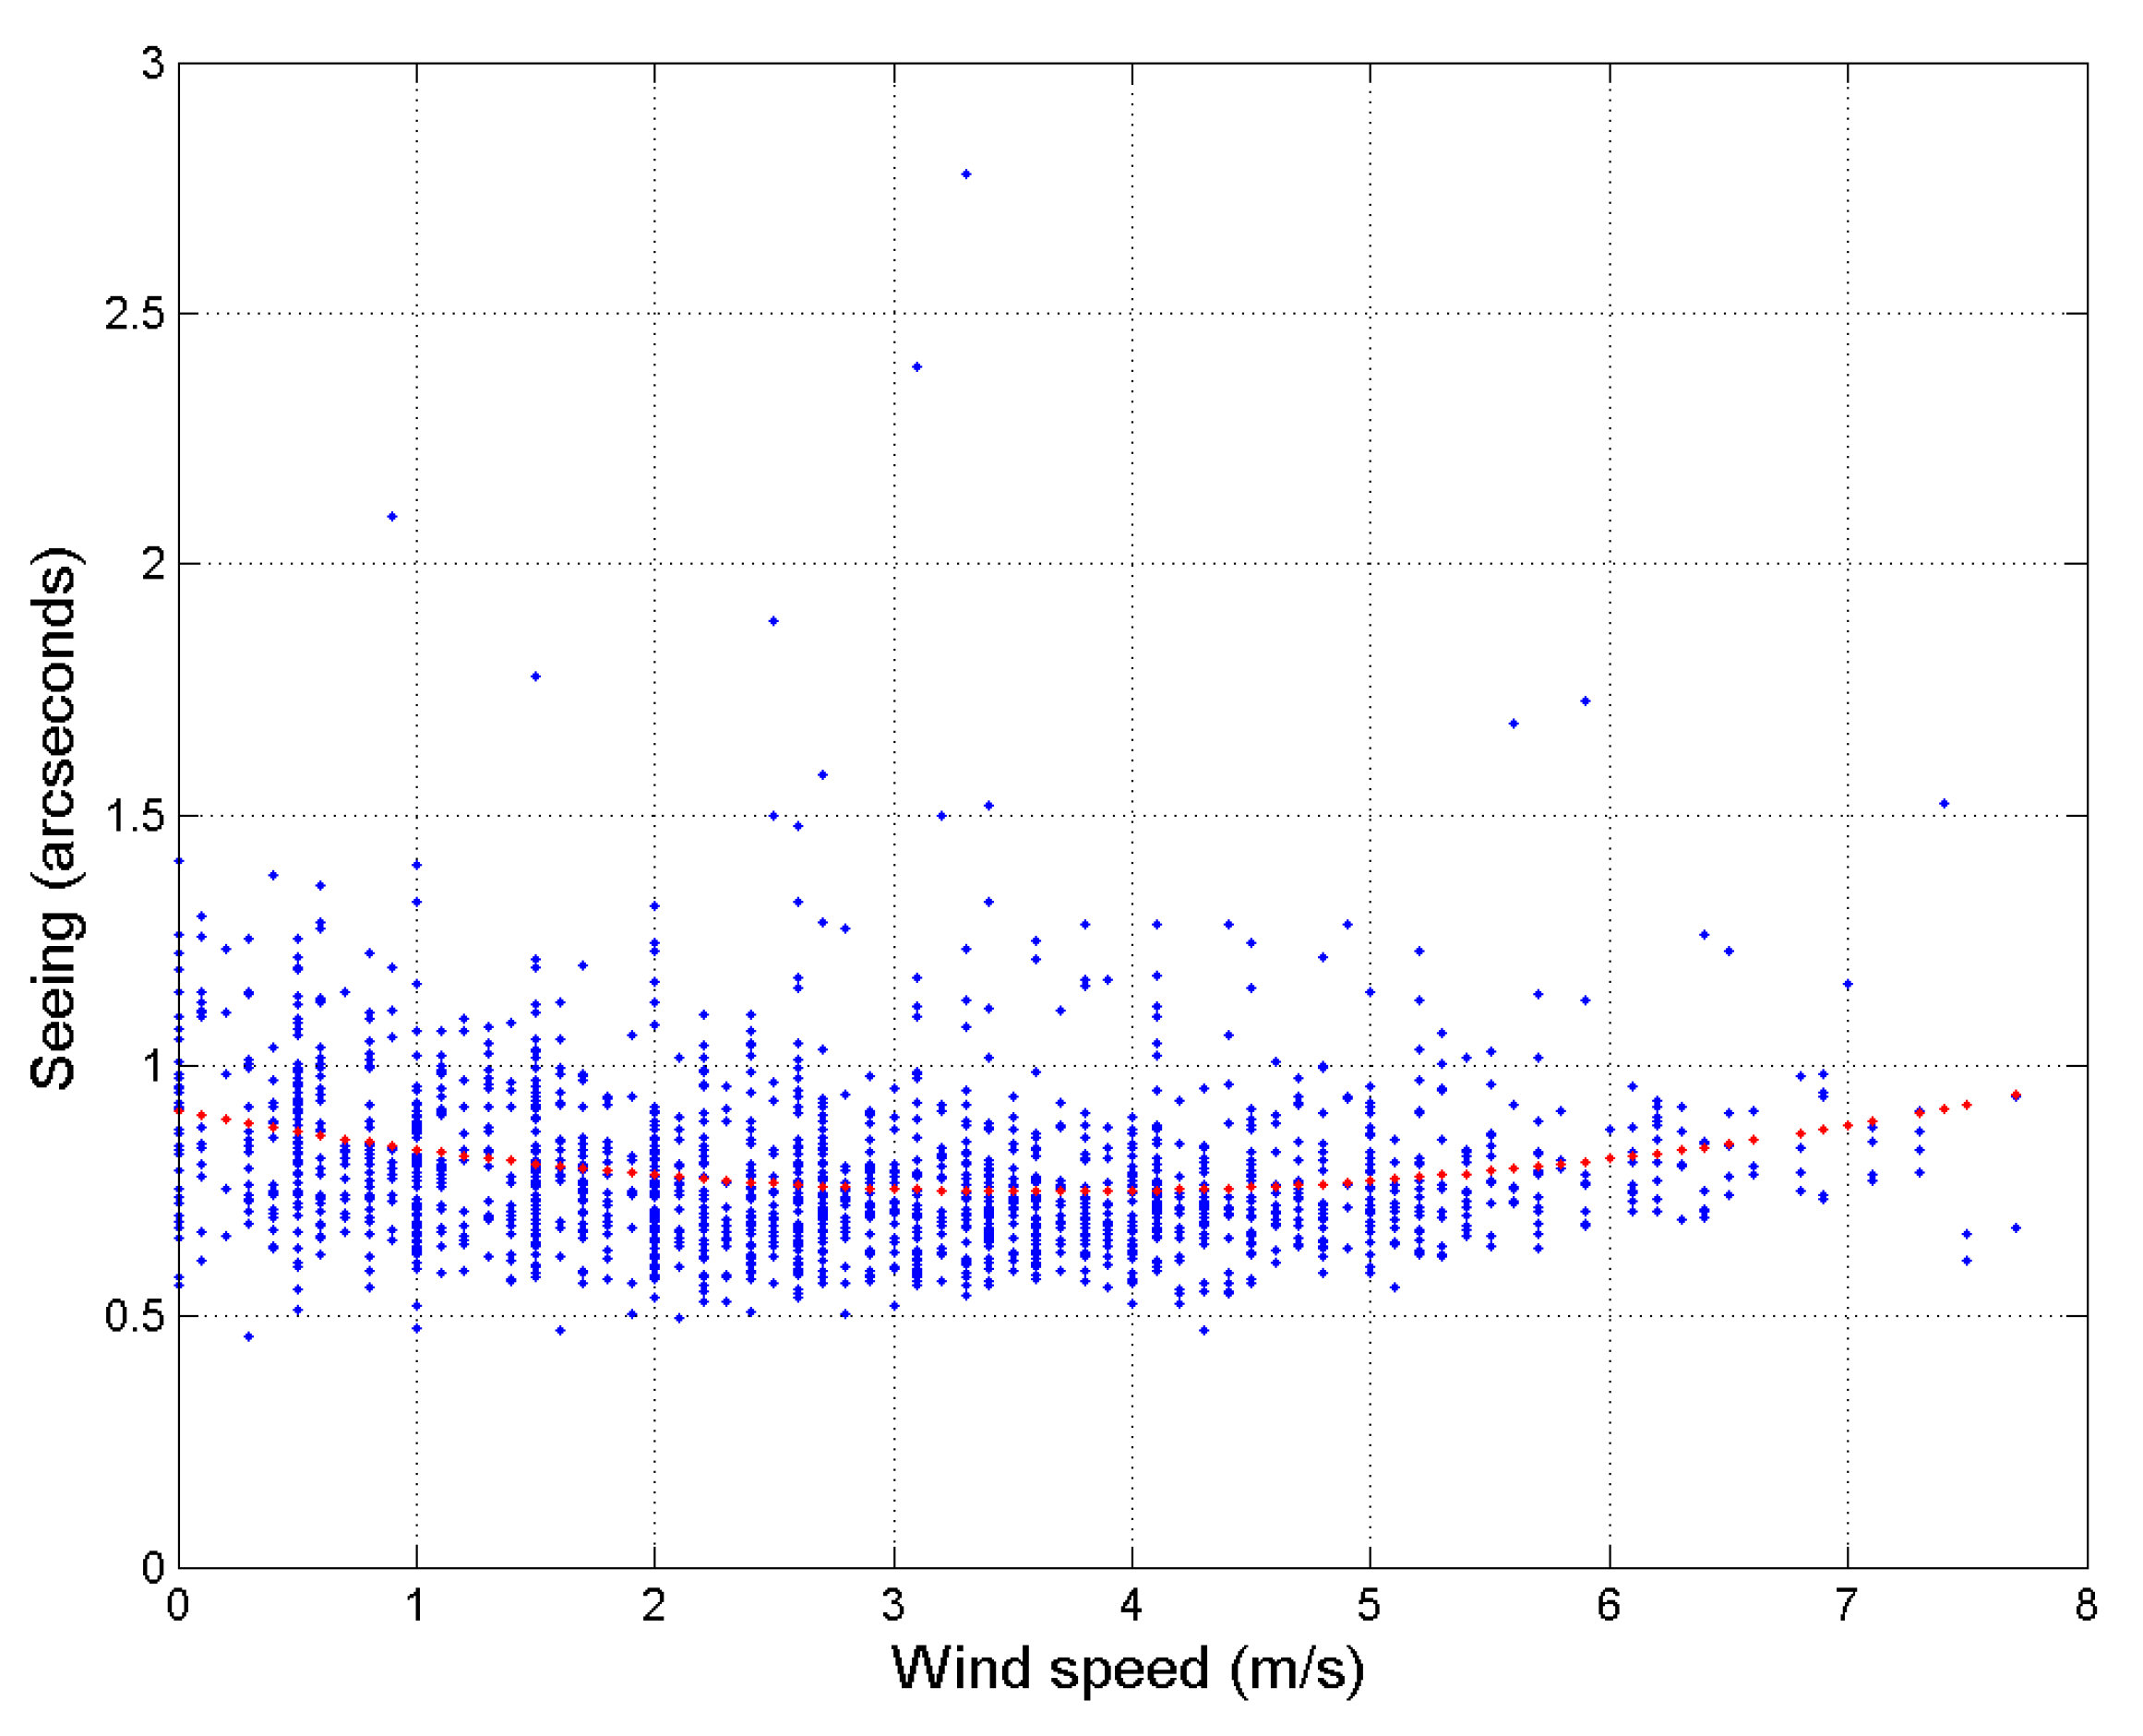
The simultaneously measured seeing and wind speed are shown in
Figure 6, where wind speed is placed on the x-axis and seeing on the y-axis, and these values are shown in blue. The red color in the graph is the regression line for both quantities. Through this line, you can see how both quantities are connected. The correlation coefficient between wind speed and seeing was −13%. As can be seen from the graph, the seeing is inversely related to the wind speed in the range of 0–4 m/s. That is, as the wind speed increases in this interval, the seeing decreases. Also, when there is no wind at all, that is, when the speed is zero, the seeing will be bad. As the wind speed increases from 4 m/s, the value of seeing also increases. The best value of the seeing occurred when the wind speed was 3–4 m/s.
At the Maidanak observatory, the main part of the wind blows from the south and adjacent directions (120–200°). This can be seen in
Figure 7. In the graph, the north point is 0°, the south point is 180°, and the east and west directions correspond to 90° and 270°, respectively. The wind blows mainly from the south at night at Maidanak observatory. In other directions, relatively little wind blows. The seeing has the best value when the wind blows from the south. When it blows in other directions, the seeing will have a relatively high value. The worst value of seeing occurs when the wind blows from the north. Generally, the correlation coefficient between seeing and wind direction is −11%.
5.2. Seeing Versus Temperature
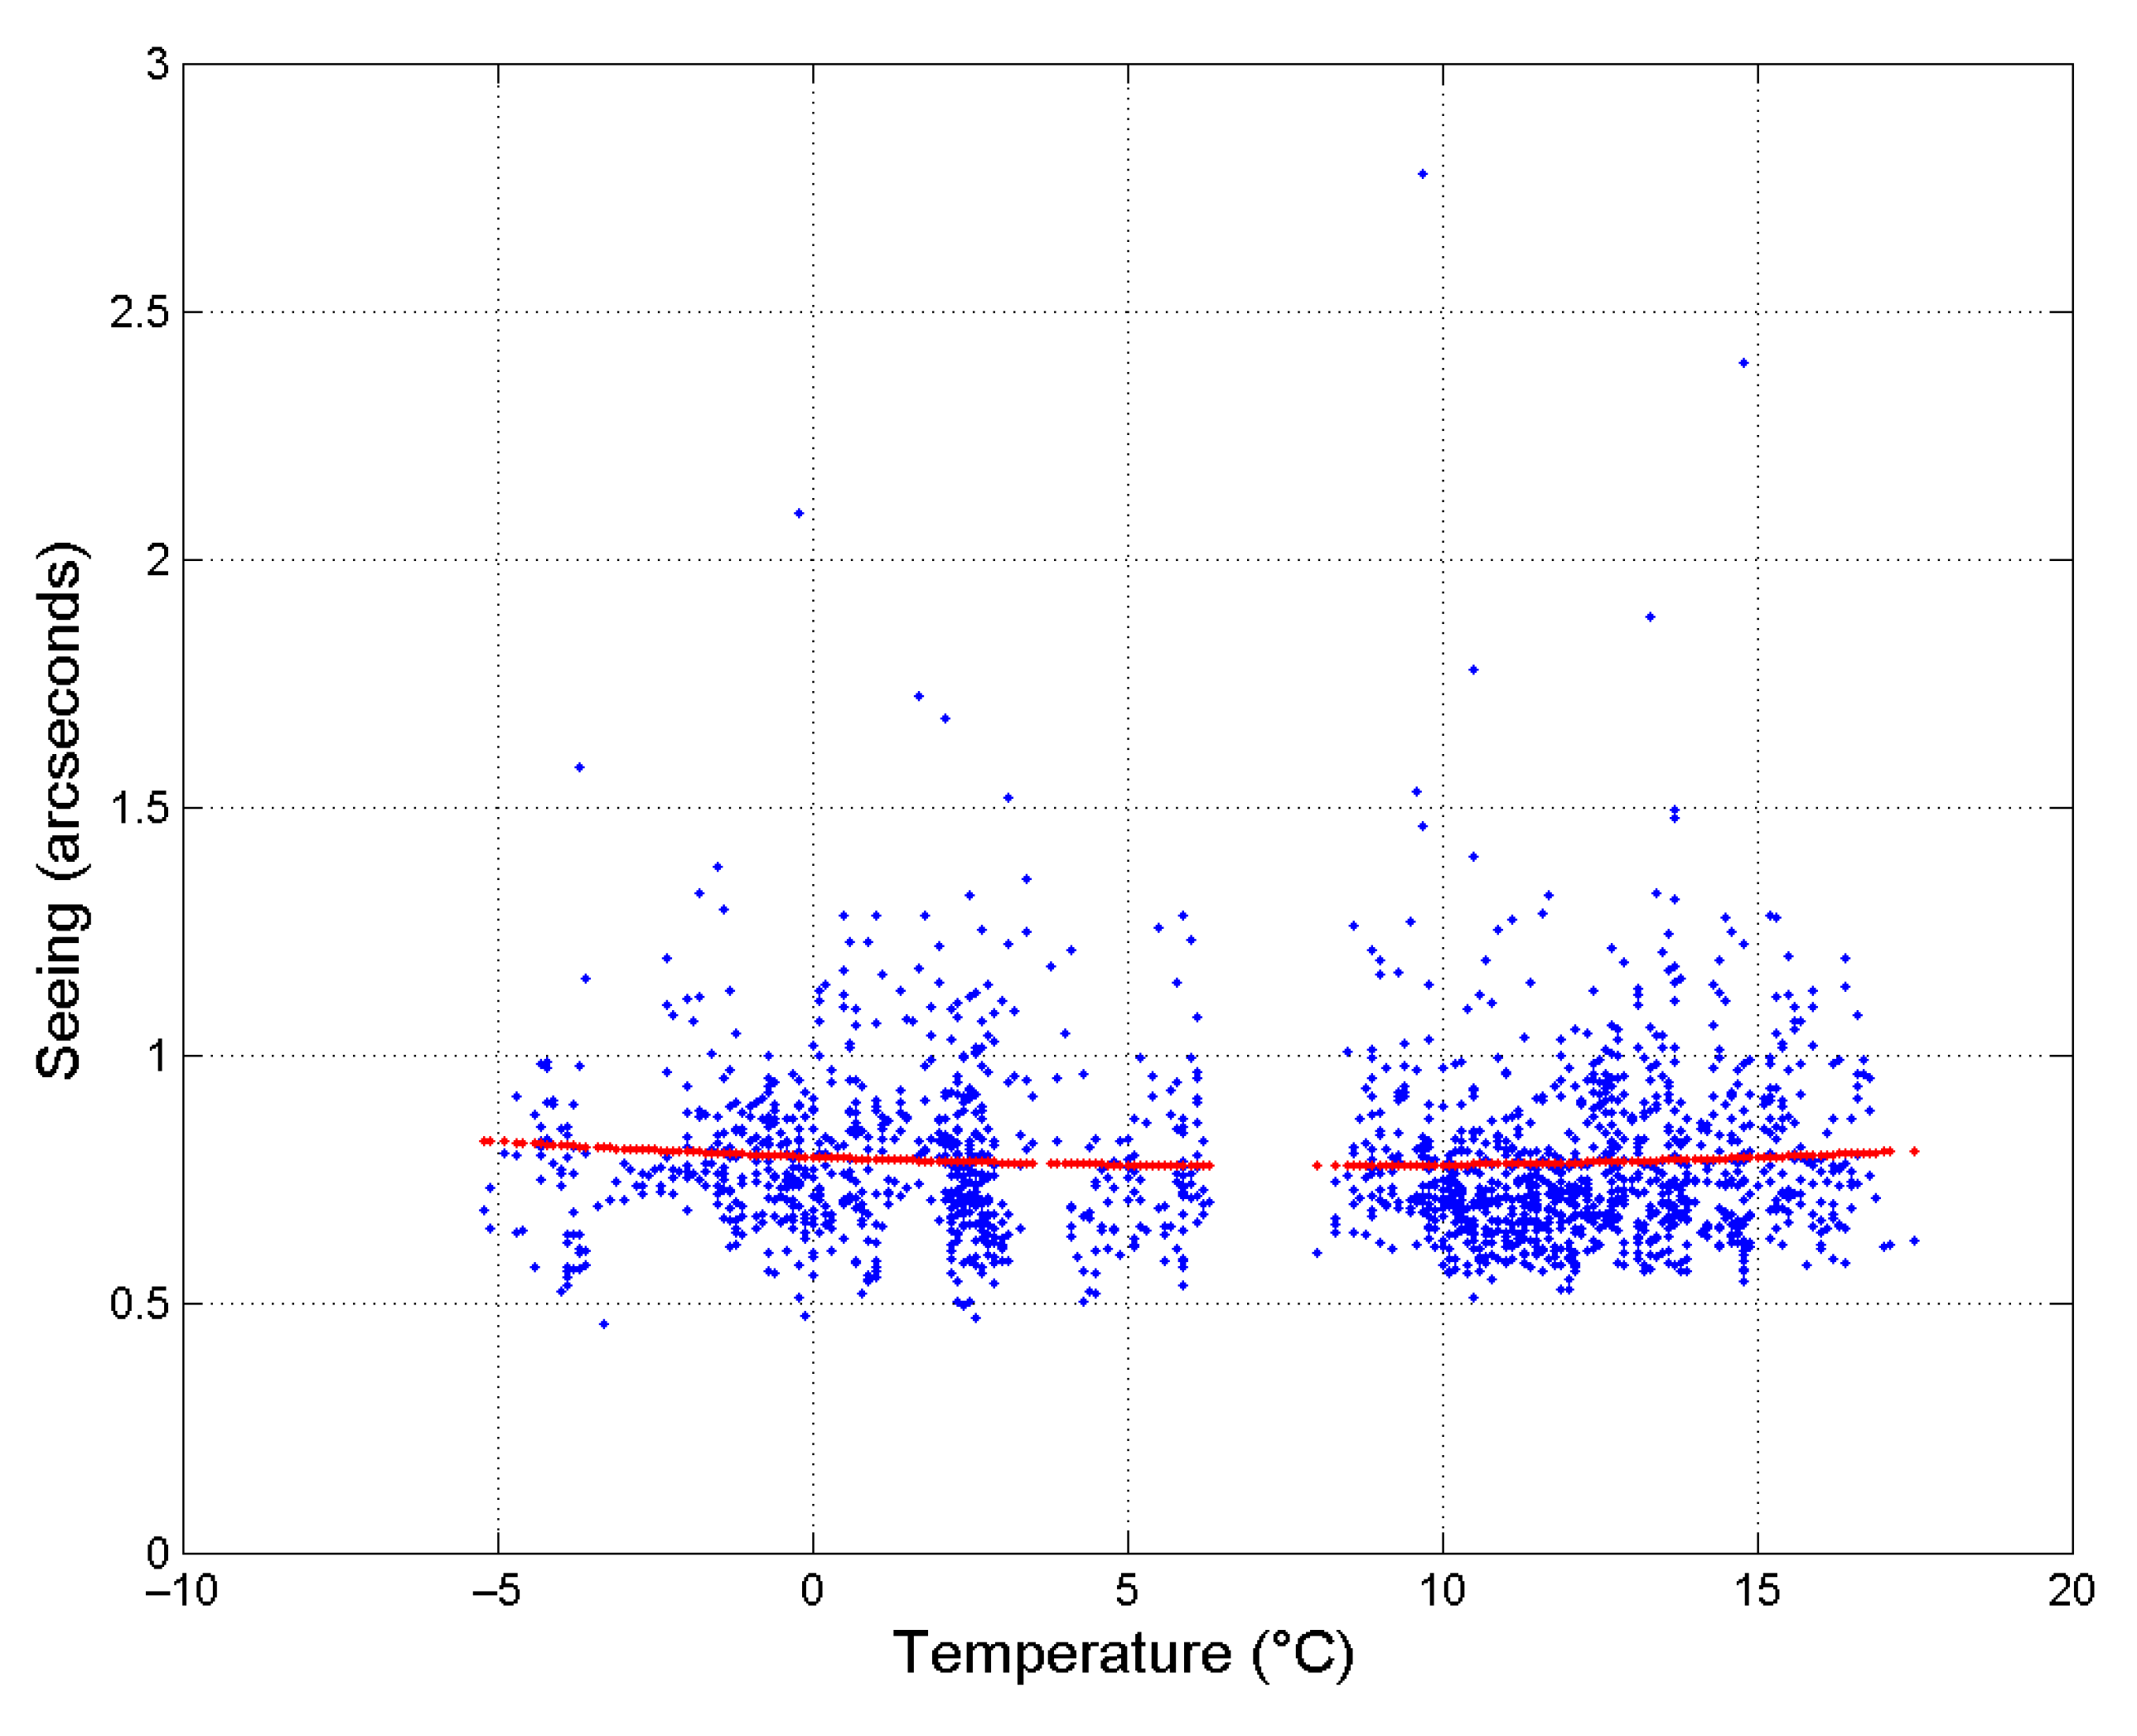
The refractive index of air depends on temperature. The air temperature in the Maidanak observatory is 10–15 degrees lower than in residential areas. The air temperature is very low in winter in the observatory; that is, it can decrease to −15°C. The maximum temperature at night is around 25–30 °C. The correlation coefficient for seeing and temperature was only 2%. This means that the correlation between both quantities is very small. It can be shown in
Figure 8 that the temperature is very low; that is, the seeing is relatively worse at minus and large values of temperature. The seeing will be relatively better at temperatures between 5–10 °C.
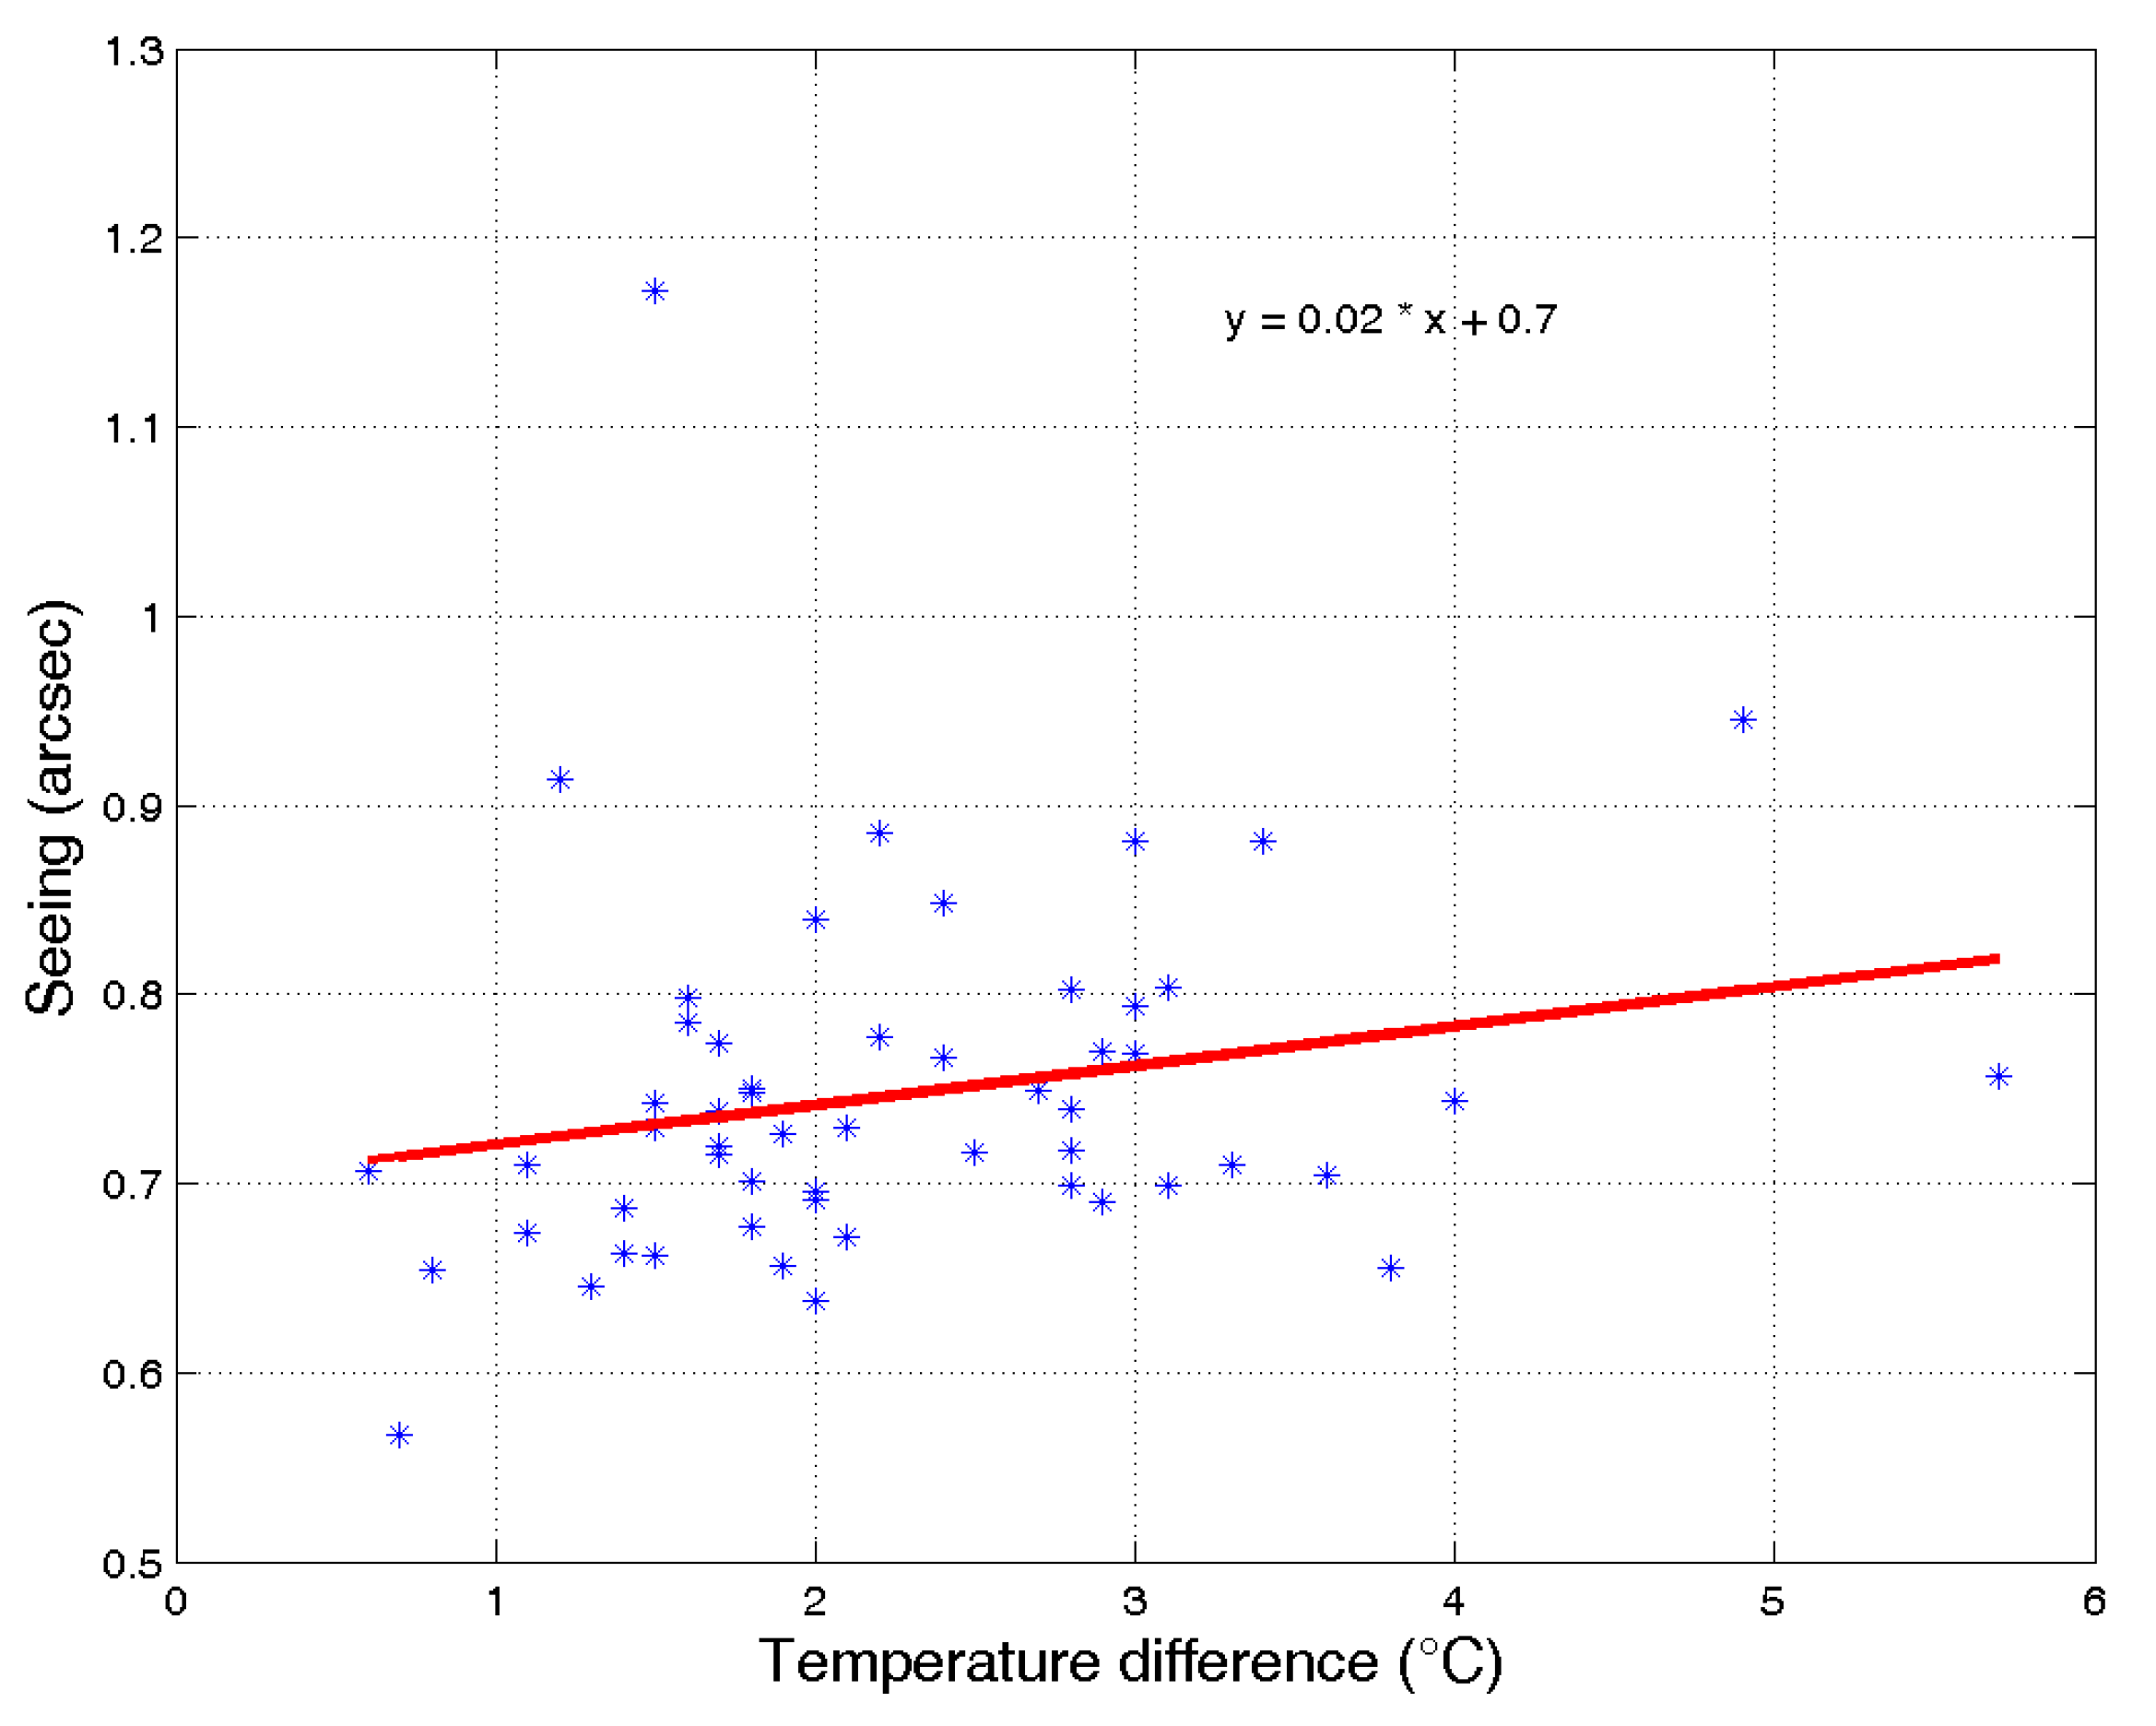
Table 3 shows correlation coefficients between seeing and meteorological parameters. During the research, we also studied how temperature variance over time affects seeing. First, the maximum and minimum temperature values during the night were found. The maximum and minimum temperature values mainly correspond to the sunset and sunrise, respectively. Using the average value of seeing during the whole night and the difference between the maximum and minimum values of the temperature during the night, the relationship between both quantities was calculated. The obtained results showed there is a weak connection between the seeing and the temperature variance (
Figure 9). The value of this link is +0.21. That is, the temperature variance and its increase negatively affect the seeing.
6. Conclusions
New statistically significant seasonal values of clear time were obtained. The observatory had more than 60% clear time between May and October, and was lower for the rest of the year. The statistical analysis of the amount of clear time revealed a long-term trend to decrease at the rate of ~7 percent in 27 years.
The first observations of seeing were made at the Maidanak Observatory in 1996–2003. The seeing observations resumed after 15 years. New observations at the Maidanak Observatory began in August of 2018 and covered the second half of the years 2018, 2019, and 2021, and the period from March–November 2022. The median value of the seeing for the entire observation period was 0.69″.
The results showed that global climate change, and other global processes, did not significantly affect the seeing. It means that the optical turbulence properties of the atmosphere of the Maidanak Observatory remained almost unchanged.
The correlation between seeing and meteorological parameters is very weak. In particular, among meteorological parameters, it was found that wind speed has the greatest correlation to seeing. Seeing is good when wind speed is up to 4–5 m/s. This may be because the persistence of a small wind prevents the formation of local turbulence. The seeing is worse if the wind speed is zero or greater than 5 m/s.
If the wind blows from the south (dominant direction), the seeing values are better, and if it blows from the other direction, the seeing values increase. The highest value of seeing occurs when the wind blows from the north.
The correlation between the absolute value of temperature and seeing is very small (−0.02), though the temperature variance has a negative effect on the seeing. There is a weak (+0.21) correlation between seeing and temperature variance. A sharp change in temperature during the night causes the deterioration of turbulence on the surface layer.
This research confirms the suitability of the Maidanak Observatory for the installation of a new telescope. Once installed, it can be effectively used for astronomical observations requiring high-angular resolution.
Author Contributions
A.A. participated in observations, data processing, and article writing. Y.T. participated in the writing of the article and data processing. S.E. and S.I. participated in the writing of the article. All authors have read and agreed to the published version of the manuscript.
Funding
A part of this research was funded by ERASMUS+ project 608715-EPP-1-2019-1-UZ-EPPKA2-JP (SPACECOM).
Institutional Review Board Statement
Not applicable.
Informed Consent Statement
Not applicable.
Data Availability Statement
We will post the information on our website and follow the link.
Acknowledgments
We would like to thank S.B. Tursunkulov and observers R. Murtazin, O. Abdullayev, R. Xazratov, A. Hafizov, and O. Yuldashev for their help in conducting this research work.
Conflicts of Interest
The authors declare no conflict of interest.
References
- Roddier, F.V. The effects of atmospheric turbulence in optical astronomy. Prog. Opt. 1981, 19, 281–376. [Google Scholar]
- Shcheglov, P.V. The modern concept of the astroclimate. In Atmospheric Optics; Nauka: Moscow, Russia, 1970; pp. 3–8. [Google Scholar]
- Vernin, J.; Munoz-Tunon, C. Measuring Astronomical Seeing: The DA/IAC DIMM. Astron. Soc. Pac. 1995, 107, 265–272. [Google Scholar] [CrossRef]
- Ehgamberdiev, S.A.; Baijumanov, A.K.; Ilyasov, S.P.; Sarazin, M.; Tillayev, Y.A.; Tokovinin, A.A.; Ziad, A.J.A.A.S.S. The astroclimate of Maidanak Observatory in Uzbekistan. Astron. Astrophys. Suppl. Ser. 2000, 145, 93–304. [Google Scholar] [CrossRef]
- Ilyasov, S.; Tillayev, Y. The atmospheric conditions of the Maidanak Observatory in Uzbekistan for ground-based observations. Int. Conf. Space Inf. Technol. 2009, 7651, 408–414. [Google Scholar] [CrossRef]
- Ilyasov, S.; Ehgamberdiev, S.; Sarazin, M.S.; Tillayev, Y. Comparison of seeing at mounts Maidanak, La Silla, and Paranal. Sixth Int. Symp. Atmos. Ocean. Opt. 1999, 3983, 49–53. [Google Scholar] [CrossRef]
- Ilyasov, S.; Tillayev, Y.; Ehgamberdiev, S. High-altitude wind speed above Mount Maidanak. Seventh Int. Symp. Atmos. Ocean. Opt. 2000, 4341, 181–184. [Google Scholar] [CrossRef]
- Kornilov, V.; Ilyasov, S.; Vozyakova, O.; Tillaev, Y.; Safonov, B.; Ibragimov, M.; Shatsky, N.; Egamberdiev, S. Measurements of optical turbulence in the free atmosphere above Mount Maidanak in 2005–2007. Astron. Lett. 2009, 35, 547–554. [Google Scholar] [CrossRef]
- Artamonov, B.P.; Bruevich, V.V.; Gusev, A.S.; Ezhkova, O.V.; Ibrahimov, M.A.; Ilyasov, S.P.; Potanin, S.A.; Tillaev, Y.A.; Ehgamberdiev, S.A. Seeing and atmospheric extinction at Mt. Maidanak observatory from observations with the 1.5-m AZT-22 telescope. Astron. Rep. 2010, 54, 1019–1031. [Google Scholar] [CrossRef]
- Tillayev, Y.; Azimov, A.; Hafizov, A. Astronomical Seeing at Maidanak Observatory during the year 2018. Galaxies 2021, 9, 38. [Google Scholar] [CrossRef]
- Shikhovtsev, A.Y.; Kovadlo, P.G.; Kopylov, E.A.; Ibrahimov, M.A.; Ehgamberdiev, S.A.; Tillayev, Y.A. Energy Spectra of Atmospheric Turbulence for Calculating C2n Parameter. I. Maidanak and Suffa Observatories in Uzbekistan. Atmosphere 2021, 12, 1614. [Google Scholar] [CrossRef]
- Azimov, A.M.; Tillayev, Y.A.; Ehgamberdiev, S.A.; Ilyasov, S.P. Astronomical seeing at Maidanak Observatory with differential image motion monitor. J. Astron. Telesc. Instrum. Syst. 2022, 8, 047002. [Google Scholar] [CrossRef]
- Tokovinin, A.; Baumont, S.; Vasquez, J. Statistics of turbulence profile at Cerro Tololo. Mon. Not. R. Astron. Soc. 2003, 340, 52–58. [Google Scholar] [CrossRef]
- Shikhovtsev, A.Y.; Kovadlo, P.G.; Khaikin, V.B.; Nosov, V.V.; Lukin, V.P.; Nosov, E.V.; Torgaev, A.V.; Kiselev, A.V.; Shikhovtsev, M.Y. Atmospheric Conditions within Big Telescope Alt-Azimuthal Region and Possibilities of Astronomical Observations. Remote Sens. 2022, 14, 1833. [Google Scholar] [CrossRef]
- Nosov, V.V.; Lukin, V.P.; Nosov, E.V.; Torgaev, A.V.; Afanas’ev, V.L.; Balega, Y.U.; Vlasyuk, V.V.; Panchuk, V.E.; Yakopov, G.V. Astroclimate Studies in the Special Astrophysical Observatory of the Russian Academy of Sciences. Atmos. Ocean. Opt. 2019, 32, 8–18. [Google Scholar] [CrossRef]
- Nosov, V.V.; Lukin, V.P.; Nosov, E.V.; Torgaev, A.V. Formation of Turbulence at Astronomical Observatories in Southern Siberia and North Caucasus. Atmos. Ocean. Opt. 2019, 32, 464–482. [Google Scholar] [CrossRef]
- Sarazin, M.; Roddier, F. The ESO differential image motion monitor. Astron. Astrophys. 1990, 227, 294–300. [Google Scholar]
- Tokovinin, A.; Kornilov, V. Accurate seeing measurements with MASS and DIMM. Mon. Not. R. Astron. Soc. 2007, 381, 1179–1189. [Google Scholar] [CrossRef]
- Zech, C.; Schöne, T.; Illigner, J.; Stolarczuk, N.; Queißer, T.; Köppl, M.; Thoss, H.; Zubovich, A.; Sharshebaev, A.; Zakhidov, K.; et al. Hydrometeorological data from a Remotely Operated Multi-Parameter Station network in Central Asia. Earth Syst. Sci. Data 2021, 13, 1289–1306. [Google Scholar] [CrossRef]
| Disclaimer/Publisher’s Note: The statements, opinions and data contained in all publications are solely those of the individual author(s) and contributor(s) and not of MDPI and/or the editor(s). MDPI and/or the editor(s) disclaim responsibility for any injury to people or property resulting from any ideas, methods, instructions or products referred to in the content. |
© 2023 by the authors. Licensee MDPI, Basel, Switzerland. This article is an open access article distributed under the terms and conditions of the Creative Commons Attribution (CC BY) license (https://creativecommons.org/licenses/by/4.0/).


