Abstract
If we collect aerosols containing SARS-CoV-2 with condensed water and obtain the solution, a sensing device can detect the viruses, and we can easily take prompt countermeasures. First, we predicted a condensation mass flow rate on a cooling surface. Next, we sprayed saltwater in a chamber and collected the aerosols using a collector equipped with a cooling unit and a fan. We defined Δt′ based on the difference between the dew point and cooling surface temperatures. The collected liquid mass had a linear relation with Δt′. There were slight differences related to the airflow rate. For evaluating the collection efficiency, ηc was determined as the ratio of the salt concentration of the collected liquid to that of the sprayed. As the liquid mass reduced, ηc increased. When the airflow rate increased by 40 m3/h, ηc increased from 10% to 28%. The airflow rates did not affect the one-pass collection efficiencies much. We also confirmed that the condensation prediction was accurate. When the airflow rate was 140 m3/h, the coefficient of determination was 0.97, and the maximum residual error was −0.85 mg/s. Based on the prediction, the concentration of test substances can increase by controlling the cooling capacity.
1. Introduction
At the early stage of the COVID-19 pandemic, a person was considered infected with COVID-19 mainly via direct contact with the infected person’s respiratory droplets, such as saliva, or breathing in the droplets. However, several studies indicated that aerosols containing SARS-CoV-2 continued floating for a certain time, and infection might spread by inhaling aerosols containing the viruses [1,2,3,4]. The floating time ranged from a few minutes to hours; the time was affected by the ventilation rate, humidity, and aerosol diameter [5,6,7,8,9]. In the study of the COVID-19 outbreak with three infected families in a restaurant, the researchers reported that they did not identify close or fomite contacts between the infected families. The analysis of their movement and the ventilation conditions of the restaurant indicated that infection via aerosols might have occurred in a crowded and poorly ventilated room [10].
The WHO recommends that a minimum ventilation rate should be 36 m3 per hour per person in indoor spaces such as workplaces and schools for the infection control of COVID-19 [11]. According to a retrospective cohort study in SARS-CoV-2 transmission in schools, with mechanical ventilation systems operated at a rate of over 36 m3 per hour per person, the relative risk reduction was 80% compared with the case that installed only natural ventilation [12]. Furthermore, ASHRAE announced the equivalent clean airflow rates for the airborne infection risk mitigation standard for buildings [13]. These rates are 36–162 m3 per hour per person depending on the occupancy categories, which are larger than the other regulations. The Japanese governmental subcommittee proposed effective ventilation methods to prevent airborne infection [14]. They recommended that the required ventilation rate be 30 m3 per hour per person or more. The rate is based on the Law for Environmental Health in Buildings (LEHB) and is enough to keep indoor carbon dioxide less than or equal to 1000 ppm [15]. Even so, the propriety of the required ventilation rate is uncertain for infection control. Quantifying a virus concentration in a room is necessary for a proper infection risk assessment.
Researchers have already succeeded in detecting viruses and bacteria in indoor air. Blachere et al. [16] demonstrated the presence of the influenza virus in the air using stationary and personal samplers in a hospital emergency department. Narihata et al. [17] used a bioaerosol sampler to successfully collect and detect the influenza virus in a lobby of the university facility. In sampling devices, Yu et al. [18] and Chen et al. [19] improved the collection efficiencies of the liquid impingers, making the viral aerosol sampling significantly effective. Some researchers compared the efficiency of several wastewater virus concentration methods to investigate SARS-CoV-2 in wastewater [20,21]. Ando et al. [22] combined the detection results of SARS-CoV-2 in wastewater with a mathematical model, and they demonstrated that the method was powerful for predicting the number of infected persons. That is promising as a monitoring method for spreading COVID-19 infection.
These conventional methods take time to detect viruses because researchers need laboratory techniques such as RT-PCR. If the increase in the infection risk becomes obvious by promptly confirming viruses in indoor air, an administrator can immediately take countermeasures, such as the activation of air purifiers and the behavioral control of people.
In May 2021, an artificial DNA aptamer was developed [23]. The aptamer can recognize the protein structure of SARS-CoV-2 and bond to it. Efforts are underway to detect the virus in an aqueous solution by combining the aptamer with a membrane-type surface stress sensor [24]. If the sensor is incorporated into an air conditioner and utilizes condensation, it can effectively monitor a space. Since the denaturation of a target protein of a virus can occur in water at a high temperature, cooling air is necessary for obtaining condensed water. Since the aptamer in the sensor directly binds to viruses in the condensation, the detection time is significantly reduced compared to the conventional methods.
Figure 1 shows an idea of the sensor application. The cooling coil generates condensed water from water vapor in the air and captures aerosol with viruses on its wet surface. When the condensation is not enough for the solution containing viruses to drip down, humidifying improves that. Then, the solution drips down, and the sensor detects the virus. Although some aerosols could have no virus, the sensor detects the viruses directly in the dripped solution. Aerosols without viruses would not affect the detection. In this paper, we call the dripped solution the collected liquid, composed of condensed water and aerosols containing test substances, such as viruses.
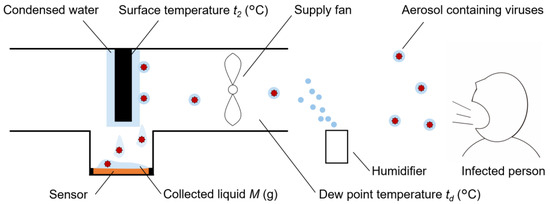
Figure 1.
Sensor application diagram.
Some studies reported success in detecting viruses in condensed water using a dehumidifier. Udagawa et al. [25] installed dehumidifiers in a hospital and typical housing. They detected viruses and bacteria causing respiratory infections in the condensed water. Moitra et al. [26] successfully detected SARS-CoV-2 RNA via photophysical means from spiked dehumidifier samples. However, no viral RNA was detected in actual samples because the extensive dilution of the SARS-CoV-2 virus might have occurred in the dehumidifier condensate samples. Controlling the mass of condensed water is presumed to be necessary to ease virus detection via the sensor.
The saliva and epithelial lining fluid contain over 20 substances [27]. Otherwise, the main components are NaCl and water [28]. In this study, we sprayed salt water instead of a virus solution to generate aerosols in a chamber and established a method for collecting the aerosols. Using an aerosol collector equipped with a cooling unit, we collected salt that dripped down with condensed water when aerosols containing salt adhered to the wet surface of the unit. In terms of aerosol diameter, researchers have already found that an aerosol ≤ 1 μm accounts for most of the total number of droplets generated by talking and coughing [29,30]. Regarding the COVID-19 infection, an aerosol ≤ 1 μm containing viruses is possible to exist in the air [31] and remain infectious for a relatively long time [32]. Therefore, we considered the captured aerosols ≤ 1 μm to discuss collection efficiency. We also suggested the condensation mass control flowchart to make the concentration higher.
2. Materials and Methods
2.1. Predict the Mass of Condensed Water
Condensation on the cooling unit surface occurs by setting the surface temperature t2 lower than the dew point temperature of the inhaled air td. On the other hand, when more water vapor in the air condenses, the salt concentration of the collected liquid significantly decreases. Predicting the condensed water mass is necessary to obtain the collected liquid with a higher salt concentration than that in the case of non-condensation control. A simplified equation for estimating the mass is composed of the convective heat transfer coefficient on the cooling unit surface αc2 (W/(m2K)) and water vapor contents.
First, when water flows through a circular tube, the inside surface temperature of a tube t1 was determined. Equation (1) expresses the heat loss from water passing through a tube. Equations (2) and (3) show the heat transfer from water to the tube surface.
where tw is the average temperature between tout and tin.
When water is cooled in the tube, the Dittus–Boelter equation evaluates Nu1.
Nu1, Re1, and Pr1 are defined as follows, and we obtained t2 using Equations (1)–(7).
Next, we calculated the convective heat transfer coefficient on the tube surface αc2 (W/(m2K)). In this study, we used the serpentine coil shown in Figure 2 to generate condensation and capture aerosols. However, to simplify the calculation, the coil was viewed as a straight tube d (m) in diameter and L (m) in total length because the curving parts of the tube hardly face the flowing air. Although the water temperature tw decreased during the passage of the coil, the temperature was treated as uniform in the area where condensation occurred. Nu2 is defined as a function of Re2 and Pr2.
where k and l are determined using the value of Re2 [33]. The Nu2, Re2, and Pr2 are obtained using Equations (5)–(7), replacing the subscript a with w and λc with λa. In addition, va is roughly calculated using Equation (9); 2πr1 (m2) is the air passage area, and α is the airflow rate coefficient.
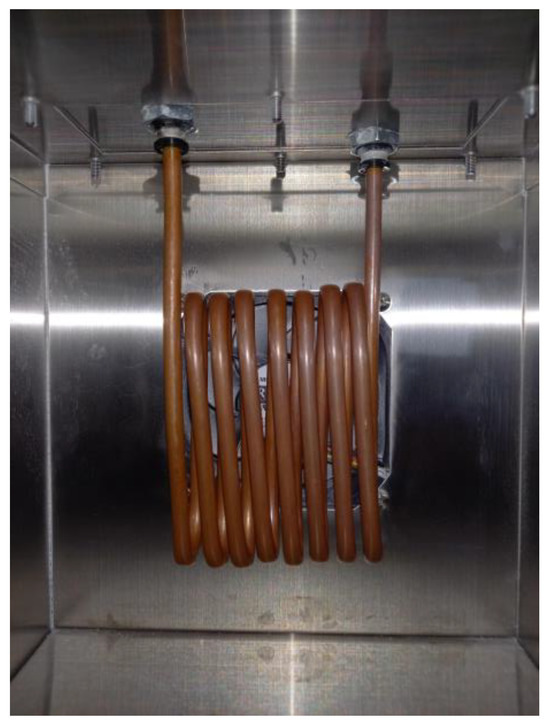
Figure 2.
Cooling coil shape of the collector.
Equation (10) evaluates αc2, and Equation (11) shows the heat flux qf (W/m2) from the cooling coil surface to the air is composed of αc2 and temperatures.
From Lewis’ relation, the moisture transfer on the coil surface has a similar equation. Equation (12) expresses the mass transfer rate per surface area W (g/(m2s)).
where x (g/kg’) is obtained from the water vapor partial pressure calculated from the Sonntag equation.
Using Equations (10) and (12), Equation (14) expresses the condensation mass flow rate on a tube surface Mp (g/s).
The actual mass of the collected liquid includes the condensed water and the collected aerosols containing salt. The collected liquid is almost entirely accounted for the former. Therefore, the mass of the collected liquid is predictable by multiplying Mp (g/s) by the collection time (s).
If the conditions of a collection device, such as the shape of the cooling coil and the airflow rate, are set in advance, Mp depends only on the AH change. In other words, the mass of the collected liquid can be predicted by measuring the temperature and relative humidity (RH) around the cooling coil and in a room. Here, since the physical properties of air did not significantly affect Mp within the range of temperature based on LEHB, we used the properties as constants.
2.2. Outline of the Aerosol Collection Experiment
We prepared 1% salt water (H2O: 396 g, NaCl: 4 g) and sprayed an average of about 300 g with a humidifier (Ultrasonic humidifier 3R-UHT03, KISHIMA Co., Ltd., Hyogo, Japan) in a walk-in constant temperature humidity test chamber. The chamber has a volume of 21 m3 (length of 2500 mm, width of 3000 mm, and height of 2800 mm). Figure 3 shows the chamber floor plan, placement of each instrument, and airflow directions. Probe thermo-hygrometers (Model 2119A, Etodenki Co., Ltd., Tokyo, Japan) and handheld particle counters (Model 3889, KANOMAX JAPAN INC., Osaka, Japan) were placed at four locations. The supplied outside air is heated with the package air conditioner placed outside of the chamber and circulated in the pre-chamber to keep its temperature and RH constant. When the supply air (SA) flow rate to the chamber exceeds the exhaust air (EA) flow rate, the air supplied to the pre-chamber is recirculated. The air supplied to the chamber does not return to the pre-chamber. The air is exhausted directly to the outside via the EA fan.
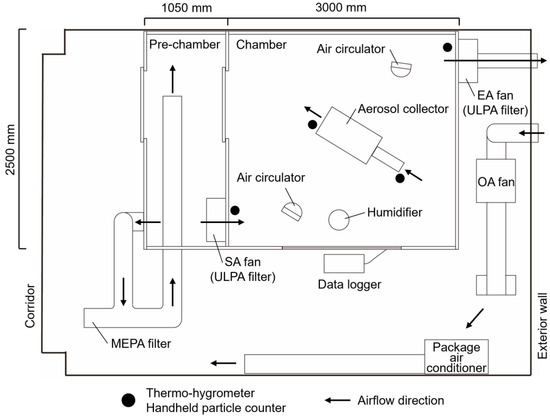
Figure 3.
Floor plan of the room placing the walk-in constant temperature humidity test chamber and the placement of equipment.
We manufactured the aerosol collector shown in Figure 4. The collector is connected to the chiller (Precision Closed Cooling Circulators CFA302, Yamato Scientific Co., Ltd., Tokyo, Japan) placed outside of the chamber. The outlet temperature of the cooling water tout and the airflow rate Q are changeable. Using the collector, we collected aerosols containing salt with condensed water. The interior surfaces of the chamber and the collector are smooth, so aerosols hardly stick to them. Therefore, we were able to accurately measure the change in the aerosol number concentration in the chamber.
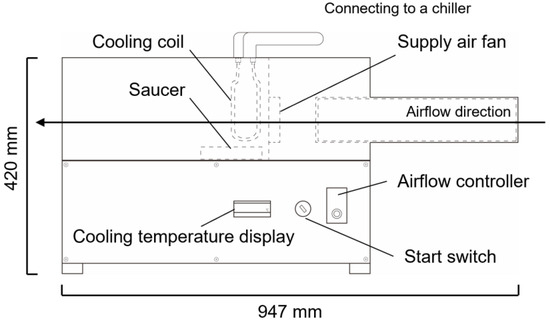
Figure 4.
Control panel side of the aerosol collector.
2.3. Experimental Procedure
We conducted the aerosol collection experiment using the following procedure.
- Set the temperature and RH of the pre-chamber air and the rotation speed of the SA/EA fan.
- Activate chamber fans and keep the chamber air temperature and RH uniform. After starting the particle counters, confirm that the current aerosol concentration is low enough not to affect the experimental results.
- Activate the cooling unit of the aerosol collector, and the cooling water temperature reaches tout. Start spraying saltwater and activate two air circulators in the chamber. Ten minutes later, activate the collector fan.
- Operate the collector for 60 min to measure the mass of the collected liquid with a scale and the salt concentration of the collected liquid with a salinometer. The measuring instruments installed in the chamber get the temperature, RH, and aerosol number concentration.
2.4. Experimental Conditions
Table 1 shows the experimental conditions. In all cases, the air change rates of the chamber were ten times/h (equal to the ventilation rate at 210 m3/h). The airflow rate of the aerosol collector Q was 100 m3/h for Cases 1 and 2, and 140 m3/h for Case 3. Table A1 shows the details of the conditions and results.

Table 1.
Experimental conditions.
The air supplied to the chamber from the pre-chamber was humidified by spraying saltwater, resulting in a 1 °C–2 °C decrease in temperature and a 5%–10% increase in RH. Based on the standards in LEHB (18 °C–28 °C for temperature and 40%–70% for RH), the temperature and RH in the pre-chamber had the range of 23 °C–26 °C and 40%–65%, respectively. In this study, we did not strictly aim to control the temperature and RH in the chamber because the humidification caused by spraying saltwater was unstable.
To obtain the various results of the collected liquid, we set the cooling coil temperature tout, corresponding to the dew point temperature of the inhaled air td. We predicted that more aerosols and salt were captured by increasing the airflow rate Q and conducted the most experiments in Case 3. Therefore, the number of experiments in each case differed. We also expected Cases 1 and 2 results to strengthen our hypothesis regarding the effects of increased airflow.
3. Results
Table 2 shows the collection results, indicating that the mass of the collected salt decreases as the mass of the collected liquid M increases. Compared with the collected salt results of the same M, the mass was higher when the airflow rate was 140 m3/h than when that was 100 m3/h. More aerosols seemed to have been collected because of the increase in the airflow rate.

Table 2.
Experimental results.
The relation between M and temperature is explained below. Based on the difference between td and t2, the corrected temperature difference Δt′ (°C) was determined using Equation (15).
When the temperature differences of the results are the same, the higher the temperature becomes, and the greater the saturated water vapor mass in the air is. Since the condensed water is mainly composed of M, it is significantly affected by the changes in the water vapor. The temperature difference is not suitable for comparing the collection results. Therefore, we corrected the temperature difference. The correction factor was determined based on the approximation equation for the saturated water vapor pressure obtained from the Sonntag equation at the surface temperature t2.
Figure 5 shows that the correlation between M and Δt′ was positive. The airflow rate of collector Q had a slight effect on M. The increase in Δt′ made the difference between the result of Case 3 (140 m3/h) and that of Cases 1 and 2 (100 m3/h) larger.
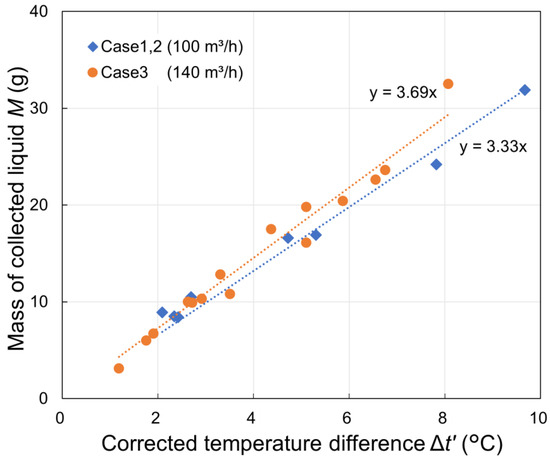
Figure 5.
Mass of collected liquid M for each Δt′.
The collection efficiency ηc (%) was defined to quantify the salt collection. Equation (16) shows the ηc using the mass percent salt concentration cs (%) of the sprayed solution and cc (%) of the collected one. A higher ηc indicates that M was collected at a higher salt concentration. In other words, more aerosols containing salt were collected with less condensation of water vapor in the air.
Table 3 shows that the ηc increased as Δt′ decreased in all Cases. In Cases 1 and 2, Δt′ decreased from 7.8 °C to 2.7 °C, and ηc increased by 4%. In Case 3, Δt′ decreased from 8.1 °C to 2.7 °C, and ηc increased by 18%. Though Δt′ reductions were almost the same, the ηc increments were different in the airflow rate Q. Comparing the results for roughly the same value of Δt′, ηc increased by 4%–18% with a 40 m3/h increase in the airflow rate Q. Increasing Q and reducing Δt′ made the ηc larger.

Table 3.
ηc for each airflow and ∆t′.
Table 4 shows the number of collected aerosols and their total volume for each diameter. The intake/exhaust difference is the number concentration of the collected aerosols. In this study, the cooling time was 70 min. The condensed water did not appear on the cooling surface until approximately 25 min after the start of the experiment. Therefore, we presumed that the aerosols had been collected for 45 min on the surface. The number of collected aerosols with all diameters increased when Q increased. The number of aerosols with a diameter of 0.5 μm collected in Case 3 was approximately 4.7 times higher than the number of them in Case 2. On the other hand, the volume of aerosols with a diameter of 1 μm was over 95% of the total volume. Therefore, the increase in 1 μm aerosols was dominant in the collected aerosol volume.

Table 4.
Number of collected aerosols and their total volume in 45 min.
For evaluating the aerosol collection ability, the one-pass collection efficiency ηoc (%) was determined using Equation (17).
Table 5 shows the 45 min intake/exhaust difference averages and ηoc for Cases 2 and 3. The largest intake/exhaust difference was for the aerosols with a diameter of 1 μm; for the 0.5 μm, aerosols of the number concentration 4.7 × 10⁶/m3 were collected in Case 2, and those of 16 × 106/m3 were in Case 3. The ηoc of the aerosols with a diameter of 0.5 μm increased by about 11%. The ηoc of 0.3 μm and 1 μm in Case 2 was slightly higher than the ηoc in Case 3.

Table 5.
Average intake/exhaust difference and ηoc in 45 min.
4. Discussion
4.1. Factors Affecting the Results
The correlation between the mass of the collected liquid M and the corrected temperature difference Δt′ was positive. When the temperature increases, the saturated water vapor does. Therefore, the amount of condensation increased due to the larger Δt′, contributing to the increase in M. On the other hand, as M increased, ηc became low. Raising the airflow rate of the aerosol collector Q, the number of aerosols per hour touching the coil surface increased, making it easier to collect salt.
The one-pass collection efficiency ηoc of 0.3 μm and 1 μm aerosols decreased by a 40 m3/h increase in Q because the aerosols were considered to have easily passed through the gaps between the coil tubes. Here, the ηoc calculated by summing the aerosol number of the three sizes was 10% in Cases 2 and 3. These results indicate that increased airflow did not significantly affect ηoc although that raised the number of collected aerosols.
Here, we estimated the collected salt mass by multiplying the aerosol volume shown in Table 4 by the 1% saltwater density. The estimated mass was smaller than the measured one in both cases. Their diameter changed due to aerosols’ evaporation, and the salt concentration seemed to become higher than the sprayed one. In our experiment, a particle counter measured the aerosol diameter after its evaporation. The aerosol diameter ratio to the initial ranges between 0.19 and 1 with RH and its contents [34]. Liu et al. [35] predicted that the dried droplet nuclei size was 32% of the original diameter. Using the shrinkage rate, we estimated the original diameter after spraying aerosols with a humidifier. Furthermore, when we hypothesized that the droplets evaporated during aerosol spraying and the salt concentration increased from 1% to 24%, the estimated salt mass was 26 mg in Case 2 and 34 mg in Case 3, respectively. The result of the estimated salt mass in Case 2 was larger than the measured value of 11 mg.
When aerosols contain SARS-CoV-2, the evaporation conditions might cause some different results, especially in the number of collected aerosols and ηoc. However, since the collected liquid is almost condensed water, it was produced mostly from the water vapor in the air. Thus, there would be a few differences in the relationship between the liquid mass and Δt′. On these issues, the differences in the one-pass collection efficiencies and the effect of aerosol evaporation changes by particle sizes should be further addressed in future studies.
4.2. Accuracy of the Prediction Equation
Table 6 shows the calculation conditions and the prediction results of the convective heat transfer rates and the surface temperature. In this study, we used the serpentine coil (mainly composed of copper, λc = 372 (W/(mK)), total length facing the air L = 1.6 (m), inner diameter of 5.5 mm, and outer diameter of 7.5 mm) to generate condensed water. The cooling material is 60% ethylene glycol solution, and the physical properties are the following: ρw = 1070 (kg/m3), Cpw = 3360 (J/(kgK)), and μw = 5.3 (10−3 kg/(ms)). The physical properties of air do not change significantly over the temperature range of this experiment, so we used them at 23 °C: ρa = 1.19 (kg/m3), Cpa = 1006 (J/(kgK)), μa = 18 (10−6 kg/(ms)), and λa = 0.026 (W/(mK)).

Table 6.
Calculation results to estimate condensation mass flow rates.
To estimate the actual condensation mass flow rate, the mass of the measured collected liquid was divided by the collection time. Figure 6 shows the relation between the predicted condensation mass flow rate and the actual one. In both cases, a linear relation between the predicted and actual rate holds. In Cases 1 and 2, the slope of the regression equation was 0.85, the intercept of that was 1.1, and the coefficient of determination was 0.99. In Case 3, the slope was 1.03, the intercept was −0.047, and the coefficient of determination was 0.97. The maximum residual error was approximately −0.85 mg/s, and the root-mean-square error was 0.50 mg/s. Thus, Equation (14) was valid for predicting the condensation mass flow rate.
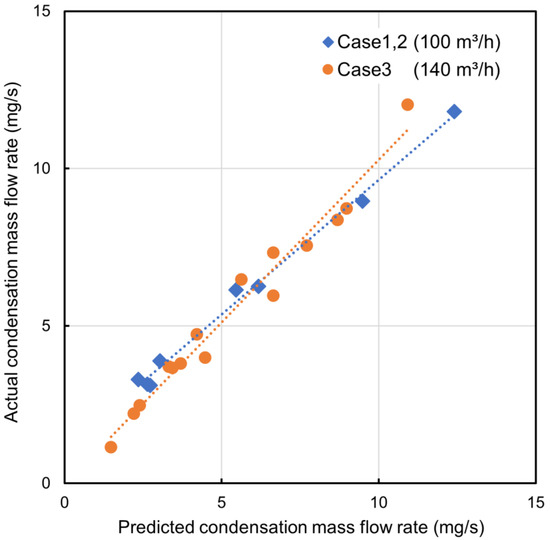
Figure 6.
Predicted condensation mass flow rate versus actual one.
4.3. Control the Mass of Condensed Water
The experimental results indicated that reducing the mass of the collected liquid contributed to the high salt concentration of the liquid. We predicted the condensation mass flow rate using Equation (14). Controlling the mass of condensed water is essential for establishing a more effective salt (or virus) collection method.
In this experiment, a humidifier sprayed saltwater, and the aerosol collector shown in Figure 4 collected the aerosols containing salt. The thermos-hygrometers were installed independently on the device. Figure 7 shows the conceptual figure of the improved aerosol collector. The collector has thermo-hygrometers on the upstream and downstream sides. The cooling device has a thermo-meter on its surface. The aerosol collector has a control unit and a humidifier performed via manual or semi-automatic operation. In practice, the collector can collect aerosols containing viruses instead of salt. The humidifier is operated so that condensation occurs when the AH of the indoor air is smaller than that of the air near the cooling device.
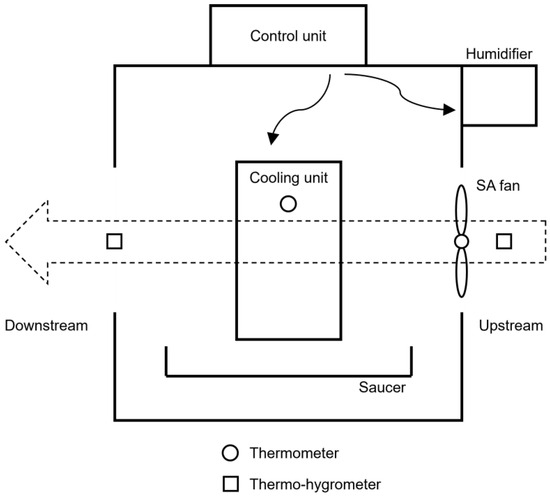
Figure 7.
Improved aerosol collector.
Figure 8 shows the condensation control flowchart. After starting the aerosol collector, the water vapor mass (AH) is calculated from the upstream and downstream temperature and humidity. First, if the AH difference between the upstream and downstream sides is less than the lower limit of AH for condensation, the collector increases the cooling capacity and humidifies further. That is equivalent to determining whether the condensation rate on the cooling unit surface is insufficient. Next, if the AH difference is larger than the upper limit of AH, the collector reduces the cooling capacity to keep the air temperature over tth. That keeps the concentration of test substances, such as viruses, from diluting due to too much condensation.
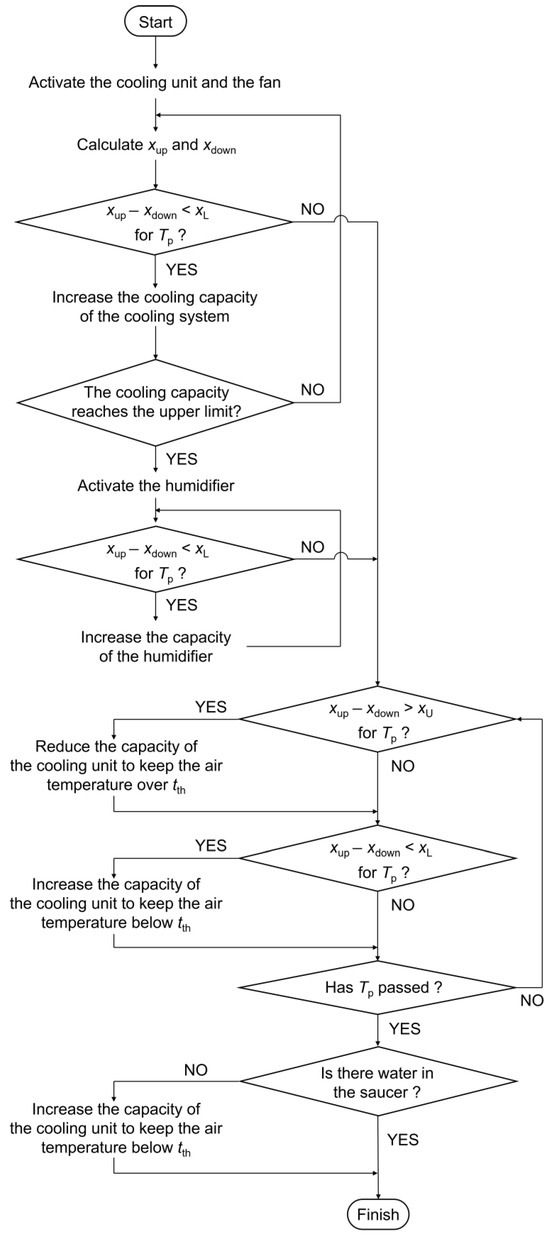
Figure 8.
Condensation control flowchart.
4.4. Limitations
While this study successfully indicated the improving collection efficiency and predicting the condensation, we present some limitations below.
First, we used salt water to generate aerosols and confirmed the collection principle. The initial salt concentration of aerosols was presumed to be the same in every diameter. When we hypothesize that the virus concentration depends on the aerosol diameter, the collection efficiencies can be almost the same between viral and salt aerosols. However, the aerosol evaporation and diameter changes depend on the contents [35,36]. Additionally, an aerosol with a diameter of 1μm could contain over 700 pathogen copies [37] at the virus concentration of 1011 copies/cm3 [38], while the aerosols are smaller than SARS-CoV-2, approximately 0.1 μm, would not have viruses. We should note the conditions would be different for an aerosol with viruses. Future studies should address the collection results when using viral aerosols expelled from a human.
Second, the aerosol collector has a serpentine coil, and we predicted the condensation mass flow rates on the surface. In contrast, the general air conditioner has a radiator-type coil. It has a different airflow path and formulas. These calculation conditions must be reconsidered when the collection method is applied to other collectors to predict the mass of the condensation or collected liquid.
5. Conclusions
We conducted the aerosol collection experiment in the indoor environment based on the Law for Environmental Health in Buildings (LEHB) regulations. The following are the essential points of the aerosol collecting method and its efficiency.
- We were able to predict the condensation mass flow rate according to the changes in AH when setting the cooling coil shape, the airflow rate, the cooling temperature, and the physical properties of air in advance.
- By increasing the airflow rate of the aerosol collector Q and decreasing the corrected temperature difference Δt′, M reduces, and the mass of collected salt increases. When Δt′ was about 3 °C, a Q increase of 40 m3/h improved the collection efficiency ηc by 18%. When Q was 140 m3/h and Δt′ decreased by 5.4 °C, the ηc increased by 18%.
- The one-pass collection efficiency ηoc differed for each particle size; aerosols with a diameter of 0.5 μm were most easily collected. When Q increased by 40 m3/h, the ηoc only of 0.5 μm increased by 11%. Although the increased Q raised the number of collected aerosols, it did not significantly affect the ηoc of the total.
- Controlling the cooling capacity of the aerosol collector is essential to suppress the mass of the condensed water in the collected solution and increase the salt concentration.
In addition to the above points, it was also necessary to circulate the air in the chamber and start collection after the distribution of the sprayed aerosol became uniform. Moreover, we should control the condensation with humidification or dehumidification following the flowchart shown in Figure 8 if the experimental environment does not conform to LEHB.
6. Patents
Our method for collecting aerosols is the joint patent pending: “The collection device, control device, collection method, control method, and its computer program”. The application number is 2022-191153, and the filing date is 30 November 2022.
Author Contributions
Conceptualization, K.M. (Kosuke Minakuchi), K.K. and M.H.; methodology, K.M. (Kosuke Minakuchi), K.K. and M.H.; validation, K.K. and M.H.; investigation, K.M. (Kosuke Minakuchi); Resources, H.H. and K.M. (Kenji Miyazaki); Data Curation, K.M. (Kosuke Minakuchi); writing—original draft preparation, K.M. (Kosuke Minakuchi), K.K. and M.H.; writing—review and editing, K.M. (Kosuke Minakuchi), K.K., H.H., K.M. (Kenji Miyazaki) and M.H.; Visualization, K.M. (Kosuke Minakuchi); Supervision, K.K. and M.H. All authors have read and agreed to the published version of the manuscript.
Funding
This research received no external funding.
Institutional Review Board Statement
Not applicable.
Informed Consent Statement
Not applicable.
Data Availability Statement
The data used to support the findings of this study are available from the corresponding authors upon request.
Acknowledgments
This research was conducted in collaboration with NEC Corporation as part of the “Research on aerosol collection and liquefaction mechanisms and spatial monitoring methods using biosensor instrumentation”.
Conflicts of Interest
The authors declare no conflict of interest.
Nomenclature
| Symbols | |
| Cm | Specific heat capacity of moist air (J/(kgK)) |
| Cp | Specific heat capacity (J/(kgK)) |
| cs | Concentration of sprayed salt water (%) |
| cc | Concentration of collected salt water (%) |
| L | Length of a tube (m) |
| M | Measured mass of collected liquid (g) |
| Mp | Predicted condensation mass flow rate (g/s) |
| Nu | Nusselt number (-) |
| Pe | Exhaust aerosol number concentration (/m3) |
| Pi | Intake aerosol number concentration (/m3) |
| Pr | Prandtl number (-) |
| Q | Airflow rate of the aerosol collector (m3/h) |
| qf | Heat flux (W/m2) |
| qt | Heat transfer (W) |
| Re | Reynolds number (-) |
| r | Radius of a tube (m) |
| S | Total outside surface area of a tube (m2) |
| Tp | Persistent time (s) |
| t | Temperature (°C) |
| td | Dew point temperature of inhaled air (°C) |
| V | Waterflow rate (m3/s) |
| v | Velocity (m/s) |
| W | Mass transfer rate per surface area (g/(m2s)) |
| x | Absolute humidity (g/kg’) |
| Greek symbols | |
| α | Airflow rate coefficient (-) |
| αc | Convective heat transfer coefficient (W/(m2K)) |
| ηc | Collection efficiency (%) |
| ηoc | One-pass collection efficiency (%) |
| λ | Thermal conductivity (W/(mK)) |
| λc | Thermal conductivity of a copper tube (W/(mK)) |
| μ | Viscosity (kg/(ms)) |
| ρ | Density (kg/m3) |
| Subscripts | |
| 1 | Inside surface of a tube |
| 2 | Outside surface of a tube |
| a | Air passing near a tube |
| down | Downstream on a collector |
| in | Inlet water |
| L | Lower limit |
| out | Outlet water |
| th | Threshold |
| U | Upper limit |
| up | Upstream on a collector |
| w | Water flowing in a tube |
Appendix A

Table A1.
Experimental conditions and results.
Table A1.
Experimental conditions and results.
| Case | Q (m3/h) | tout (°C) | t2 (°C) | Chamber | Collected | |||||
|---|---|---|---|---|---|---|---|---|---|---|
| td (°C) | ta (°C) | RH (°C) | Δt′ (°C) | M (g) | cc (%) | ηc (%) | ||||
| 1 | 100 | 6 | 8.2 | 13.0 | 21.4 | 59 | 7.8 | 24 | 0.06 | 6 |
| 14.1 | 22.8 | 58 | 9.7 | 32 | 0.03 | 3 | ||||
| 2 | 100 | 10 | 12.3 | 13.3 | 21.9 | 58 | 2.1 | 8.9 | 0.18 | 19 |
| 13.4 | 22.0 | 58 | 2.3 | 8.5 | 0.13 | 14 | ||||
| 13.5 | 21.9 | 59 | 2.4 | 8.4 | 0.12 | 13 | ||||
| 13.6 | 21.9 | 59 | 2.7 | 11 | 0.1 | 10 | ||||
| 14.6 | 21.5 | 65 | 4.7 | 17 | 0.06 | 6 | ||||
| 14.8 | 22.9 | 61 | 5.3 | 17 | 0.07 | 7 | ||||
| 3 | 140 | 10 | 12.3 | 12.9 | 23.7 | 51 | 1.2 | 3.1 | 0.29 | 30 |
| 13.2 | 21.3 | 60 | 1.8 | 6.0 | 0.32 | 34 | ||||
| 13.2 | 21.9 | 58 | 1.9 | 6.7 | 0.28 | 30 | ||||
| 13.6 | 21.8 | 60 | 2.6 | 10 | 0.24 | 25 | ||||
| 13.6 | 21.9 | 59 | 2.7 | 9.9 | 0.26 | 28 | ||||
| 13.7 | 21.7 | 61 | 2.9 | 10 | 0.3 | 31 | ||||
| 13.9 | 21.8 | 61 | 3.3 | 13 | 0.28 | 29 | ||||
| 14.0 | 22.1 | 60 | 3.5 | 11 | 0.31 | 32 | ||||
| 14.4 | 21.9 | 63 | 4.4 | 18 | 0.26 | 27 | ||||
| 14.8 | 21.9 | 64 | 5.1 | 20 | 0.24 | 25 | ||||
| 14.8 | 21.9 | 64 | 5.1 | 16 | 0.17 | 18 | ||||
| 15.1 | 21.7 | 66 | 5.9 | 20 | 0.15 | 15 | ||||
| 15.4 | 21.9 | 67 | 6.6 | 23 | 0.09 | 9 | ||||
| 15.5 | 23.7 | 60 | 6.8 | 24 | 0.1 | 10 | ||||
| 16.2 | 21.9 | 70 | 8.1 | 33 | 0.1 | 10 | ||||
References
- World Health Organization. Coronavirus Disease (COVID-19): How Is It Transmitted? Available online: https://www.who.int/news-room/questions-and-answers/item/coronavirus-disease-covid-19-how-is-it-transmitted (accessed on 4 October 2023).
- Miller, S.L.; Nazaroff, W.W.; Jimenez, J.L.; Boerstra, A.; Buonanno, G.; Dancer, S.J.; Kurnitski, J.; Marr, L.C.; Morawska, L.; Noakes, C. Transmission of SARS-CoV-2 by inhalation of respiratory aerosol in the Skagit Valley Chorale superspreading event. Indoor Air 2021, 31, 314–323. [Google Scholar] [CrossRef] [PubMed]
- Lewis, D. Superspreading drives the COVID pandemic—And could help to tame it. Nature 2021, 590, 544–546. [Google Scholar] [CrossRef] [PubMed]
- Azimi, P.; Keshavarz, Z.; Laurent, J.G.C.; Stephens, B.; Allen, J.G. Mechanistic transmission modeling of COVID-19 on the Diamond Princess cruise ship demonstrates the importance of aerosol transmission. Proc. Natl. Acad. Sci. USA 2021, 118, e2015482118. [Google Scholar] [CrossRef] [PubMed]
- Van Doremalen, N.; Bushmaker, T.; Morris, D.H.; Holbrook, M.G.; Gamble, A.; Williamson, B.N.; Tamin, A.; Harcourt, J.L.; Thornburg, N.J.; Gerber, S.I.; et al. Aerosol and Surface Stability of SARS-CoV-2 as Compared with SARS-CoV-1. N. Engl. J. Med. 2020, 382, 1564–1567. [Google Scholar] [CrossRef] [PubMed]
- Stadnytskyi, V.; Bax, C.E.; Bax, A.; Anfinrud, P. The airborne lifetime of small speech droplets and their potential importance in SARS-CoV-2 transmission. Proc. Natl. Acad. Sci. USA 2020, 117, 11875–11877. [Google Scholar] [CrossRef]
- Smither, S.J.; Eastaugh, L.S.; Findlay, J.S.; Lever, M.S. Experimental aerosol survival of SARS-CoV-2 in artificial saliva and tissue culture media at medium and high humidity. Emerg. Microbes Infect. 2020, 9, 1415–1417. [Google Scholar] [CrossRef] [PubMed]
- Schuit, M.; Ratnesar-Shumate, S.; Yolitz, J.; Williams, G.; Weaver, W.; Green, B.; Miller, D.; Krause, M.; Beck, K.; Wood, S.; et al. Airborne SARS-CoV-2 Is Rapidly Inactivated by Simulated Sunlight. J. Infect. Dis. 2020, 222, 564–571. [Google Scholar] [CrossRef]
- Vuorinen, V.; Aarnio, M.; Alava, M.; Alopaeus, V.; Atanasova, N.; Auvinen, M.; Balasubramanian, N.; Bordbar, H.; Erästö, P.; Grande, R.; et al. Modeling aerosol transport and virus exposure with numerical simulations in relation to SARS-CoV-2 transmission by inhalation indoors. Saf. Sci. 2020, 130, 104866. [Google Scholar] [CrossRef]
- Li, Y.; Qian, H.; Hang, J.; Chen, X.; Cheng, P.; Ling, H.; Wang, S.; Liang, P.; Li, J.; Xiao, S.; et al. Probable airborne transmission of SARS-CoV-2 in a poorly ventilated restaurant. Build Environ. 2021, 196, 107788. [Google Scholar] [CrossRef]
- World Health Organization. Roadmap to Improve and Ensure Good Indoor Ventilation in Context of COVID-19. Available online: https://www.who.int/publications/i/item/9789240021280 (accessed on 4 October 2023).
- Buonanno, G.; Ricolfi, L.; Morawska, L.; Stabile, L. Increasing ventilation reduces SARS-CoV-2 airborne transmission in schools: A retrospective cohort study in Italy’s Marche region. Front. Public Health 2022, 10, 1087087. [Google Scholar] [CrossRef]
- ASHRAE Standard 241-2023; Control of Infectious Aerosols. American Society of Heating, Refrigerating and Air-Conditioning Engineers: Peachtree Corners, GA, USA, 2023; pp. 3–7.
- Hayashi, M.; Yanagi, U.; Honma, Y.; Yamamoto, Y.; Ogata, M.; Kikuta, K.; Kagi, N.; Tanabe, S. Ventilation Methods against Indoor Aerosol Infection of COVID-19 in Japan. Atmosphere 2023, 14, 150. [Google Scholar] [CrossRef]
- Hayashi, M.; Kobayashi, K.; Kim, H.; Kaihara, N. The state of the indoor air environment in buildings and related tasks in Japan. J. Natl. Inst. Public Health. 2020, 69, 63–72. [Google Scholar]
- Blachere, F.M.; Lindsley, W.G.; Pearce, T.A.; Anderson, S.E.; Fisher, M.; Khakoo, R.; Meade, B.J.; Lander, O.; Davis, S.; Thewlis, R.E.; et al. Measurement of Airborne Influenza Virus in a Hospital Emergency Department. Clin. Infect. Dis. 2009, 48, 438–440. [Google Scholar] [CrossRef] [PubMed]
- Narihata, K.; Sakamoto, S.; Miki, S.; Sakai, H. Studies on Measuring Viruses as Airborne Microorganisms and Future Vision. Earozoru Kenkyu 2019, 34, 219–225. (In Japanese) [Google Scholar]
- Yu, K.P.; Chen, Y.P.; Gong, J.Y.; Chen, Y.C.; Cheng, C.C. Improving the collection efficiency of the liquid impinger for ultrafine particles and viral aerosols by applying granular bed filtration. J. Aerosol Sci. 2016, 101, 133–143. [Google Scholar] [CrossRef] [PubMed]
- Chen, Y.C.; Wang, I.J.; Cheng, C.C.; Wu, Y.C.; Bai, C.H.; Yu, K.P. Effect of selected sampling media, flow rate, and time on the sampling efficiency of a liquid impinger packed with glass beads for the collection of airborne viruses. Aerobiologia 2021, 37, 243–252. [Google Scholar] [CrossRef] [PubMed]
- Forés, E.; Bofill-Mas, S.; Itarte, M.; Martínez-Puchol, S.; Hundesa, A.; Calvo, M.; Borrego, C.M.; Corominas, L.L.; Girones, R.; Rusiñol, M. Evaluation of two rapid ultrafiltration-based methods for SARS-CoV-2 concentration from wastewater. Sci. Total Environ. 2021, 768, 144786. [Google Scholar] [CrossRef]
- Ahmed, W.; Bertsch, P.M.; Bivins, A.; Bibby, K.; Farkas, K.; Gathercole, A.; Haramoto, E.; Gyawali, P.; Korajkic, A.; McMinn, B.R.; et al. Comparison of virus concentration methods for the RT-qPCR-based recovery of murine hepatitis virus, a surrogate for SARS-CoV-2 from untreated wastewater. Sci. Total Environ. 2020, 739, 139960. [Google Scholar] [CrossRef]
- Ando, H.; Murakami, M.; Ahmed, W.; Iwamoto, R.; Okabe, S.; Kitajima, M. Wastewater-based prediction of COVID-19 cases using a highly sensitive SARS-CoV-2 RNA detection method combined with mathematical modeling. Environ. Int. 2023, 173, 107743. [Google Scholar] [CrossRef]
- NEC Corporation, and NEC Solution Innovators, Ltd. Success in Development of Artificial DNA Aptamer that Binds to SARS-CoV-2. Available online: https://jpn.nec.com/press/202105/20210506_02.html (accessed on 4 October 2023). (In Japanese).
- Minagawa, H.; Sawa, H.; Fujita, T.; Kato, S.; Inaguma, A.; Hirose, M.; Orba, Y.; Sasaki, M.; Tabata, K.; Nomura, N.; et al. A high-affinity aptamer with base-appended base-modified DNA bound to isolated authentic SARS-CoV-2 strains wild-type and B.1.617.2 (delta variant). Biochem. Biophys. Res. Commun. 2022, 614, 207–212. [Google Scholar] [CrossRef]
- Udagawa, Y.; Takatsuka, T.; Kitajima, M. A Study on Trapping of Air-borne Virus by Dehumidification and Humidification Process. Tech. Pap. Annu. Meet. Soc. Heat. Air-Cond. Sanit. Eng. Jpn. 2019, 7, 85–88. (In Japanese) [Google Scholar]
- Moitra, P.; Alafeef, M.; Dighe, K.; Ray, P.; Chang, J.; Thole, A.; Punshon-Smith, B.; Tolosa, M.; Ramamurthy, S.S.; Ge, X. Rapid and low-cost sampling for detection of airborne SARS-CoV-2 in dehumidifier condensate. Biotechnol. Bioeng. 2021, 118, 3029–3036. [Google Scholar] [CrossRef] [PubMed]
- Pöhlker, M.L.; Pöhlker, C.; Krüger, O.O.; Förster, J.D.; Berkemeier, T.; Elbert, W.; Fröhlich-Nowoisky, J.; Pöschl, U.; Bagheri, G.; Bodenschatz, E.; et al. Respiratory aerosols and droplets in the transmission of infectious diseases. Rev. Mod. Phys. 2023, 95, 045001. [Google Scholar] [CrossRef]
- Effros, R.M.; Hoagland, K.W.; Bosbous, M.; Castillo, D.; Foss, B.; Dunning, M.; Gare, M.; Lin, W.; Sun, F. Dilution of Respiratory Solutes in Exhaled Condensates. Am. J. Respir. Crit. Care Med. 2002, 165, 663–669. [Google Scholar] [CrossRef] [PubMed]
- Liu, Y.; Ning, Z.; Chen, Y.; Guo, M.; Liu, Y.; Gali, N.K.; Sun, L.; Duan, Y.; Cai, J.; Westerdahl, D.; et al. Aerodynamic analysis of SARS-CoV-2 in two Wuhan hospitals. Nature 2020, 582, 557–560. [Google Scholar] [CrossRef]
- Morawska, L.; Johnson, G.R.; Ristovski, Z.D.; Hargreaves, M.; Mengersen, K.; Corbett, S.; Chao, C.Y.H.; Li, Y.; Katoshevski, D. Size distribution and sites of origin of droplets expelled from the human respiratory tract during expiratory activities. J. Aerosol Sci. 2009, 40, 256–269. [Google Scholar] [CrossRef]
- Zayas, G.; Chiang, M.C.; Wong, E.; MacDonald, F.; Lange, C.F.; Senthilselvan, A.; King, M. Cough aerosol in healthy participants: Fundamental knowledge to optimize droplet-spread infectious respiratory disease management. BMC Pulm. Med. 2012, 12, 11. [Google Scholar] [CrossRef]
- Santarpia, J.L.; Herrera, V.L.; Rivera, D.N.; Ratnesar-Shumate, S.; St. Reid, P.; Ackerman, D.N.; Denton, P.W.; Martens, J.W.S.; Fang, Y.; Conoan, N.; et al. The size and culturability of patient-generated SARS-CoV-2 aerosol. J. Expo. Sci. Environ. Epidemiol. 2022, 32, 706–711. [Google Scholar] [CrossRef]
- Knudsen, J.G.; Katz, D.L. Fluid Dynamics and Heat Transfer; McGraw-Hill Book Company, Inc.: New York, NY, USA, 1958; p. 505. [Google Scholar]
- Marr, L.C.; Tang, J.W.; Mullekom, J.V.; Lakdawala, S.S. Mechanistic insights into the effect of humidity on airborne influenza virus survival, transmission and incidence. J. R. Soc. Interface 2019, 16, 20180298. [Google Scholar] [CrossRef] [PubMed]
- Liu, L.; Wei, J.; Li, Y.; Ooi, A. Evaporation and dispersion of respiratory droplets from coughing. Indoor Air 2017, 27, 179–190. [Google Scholar] [CrossRef] [PubMed]
- Walker, J.S.; Archer, J.; Gregson, F.K.A.; Michel, S.E.S.; Bzdek, B.R.; Reid, J.P. Accurate Representations of the Microphysical Processes Occurring during the Transport of Exhaled Aerosols and Droplets. ACS Cent. Sci. 2021, 7, 200–209. [Google Scholar] [CrossRef] [PubMed]
- Nordsiek, F.; Bodenschatz, E.; Bagheri, G. Risk assessment for airborne disease transmission by poly-pathogen aerosols. PLoS ONE 2021, 16, e0248004. [Google Scholar] [CrossRef] [PubMed]
- Pan, Y.; Zhang, D.; Yang, P.; Poon, L.L.M.; Wang, Q. Viral load of SARS-CoV-2 in clinical samples. Lancet Infect. Dis. 2020, 20, 411–412. [Google Scholar] [CrossRef] [PubMed]
Disclaimer/Publisher’s Note: The statements, opinions and data contained in all publications are solely those of the individual author(s) and contributor(s) and not of MDPI and/or the editor(s). MDPI and/or the editor(s) disclaim responsibility for any injury to people or property resulting from any ideas, methods, instructions or products referred to in the content. |
© 2023 by the authors. Licensee MDPI, Basel, Switzerland. This article is an open access article distributed under the terms and conditions of the Creative Commons Attribution (CC BY) license (https://creativecommons.org/licenses/by/4.0/).