
Spatiotemporal Distribution Characteristics and Multi-Factor Analysis of Near-Surface PM2.5 Concentration in Local-Scale Urban Areas


Abstract
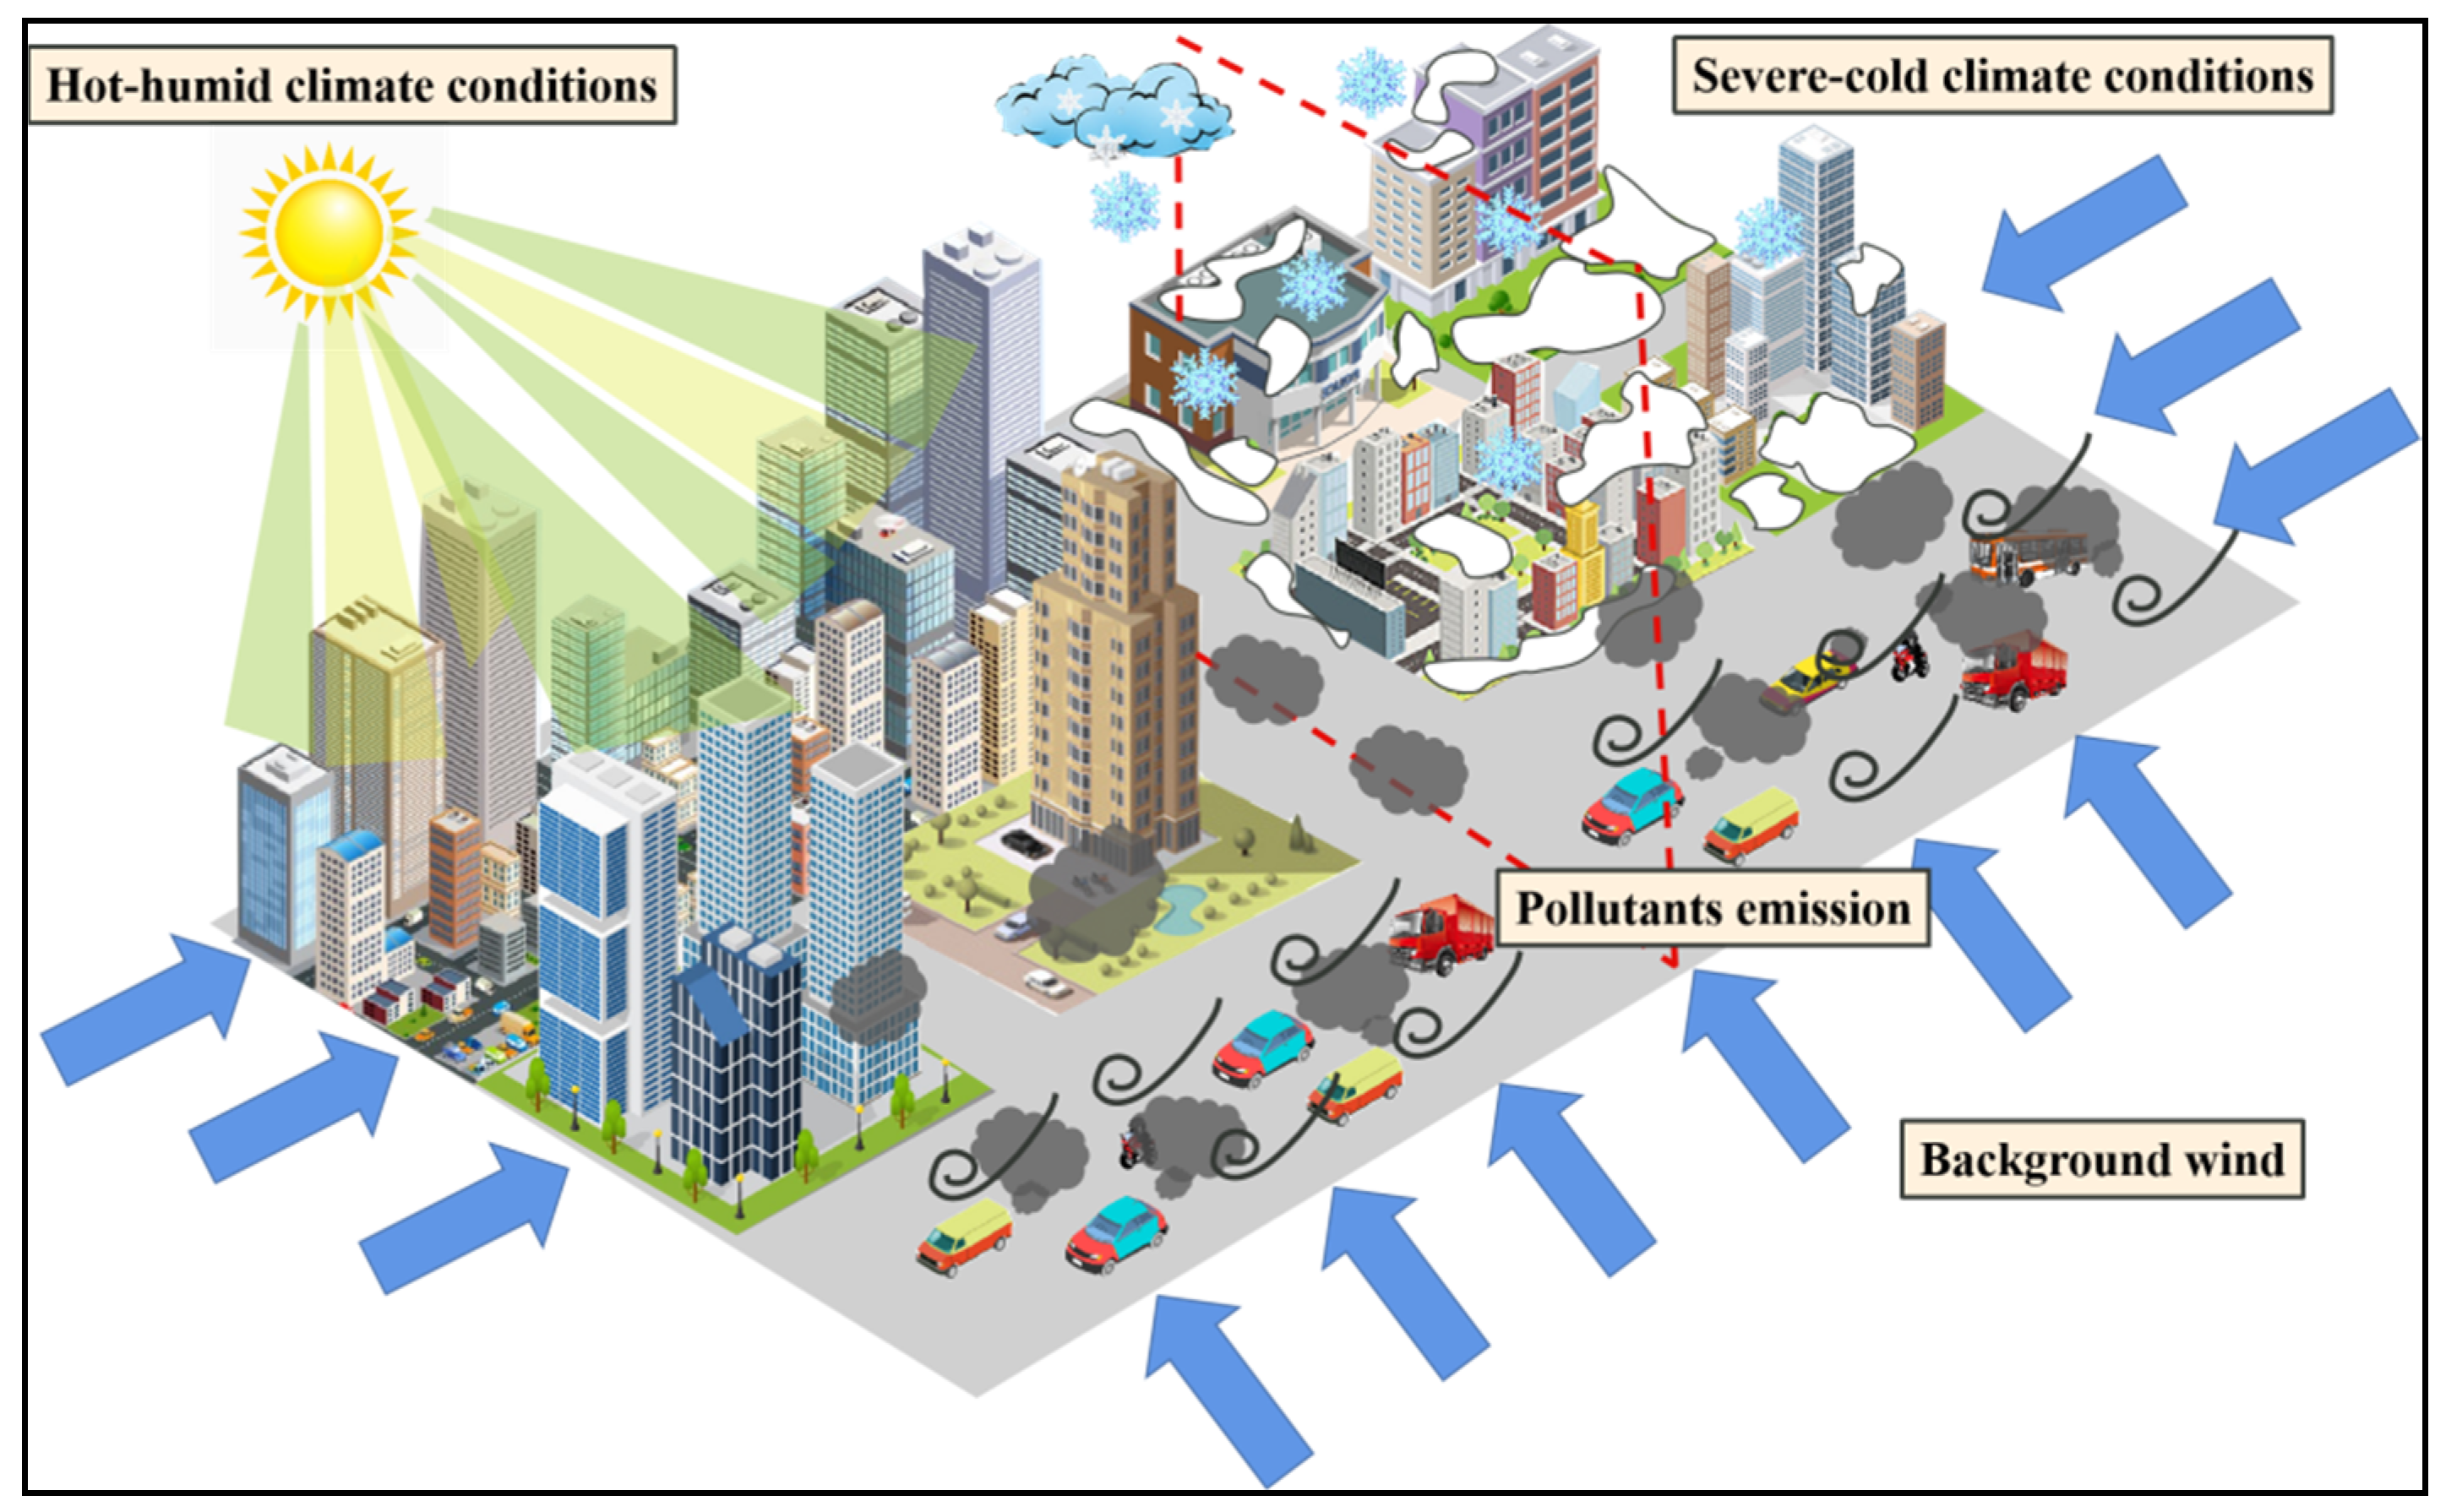
:1. Introduction
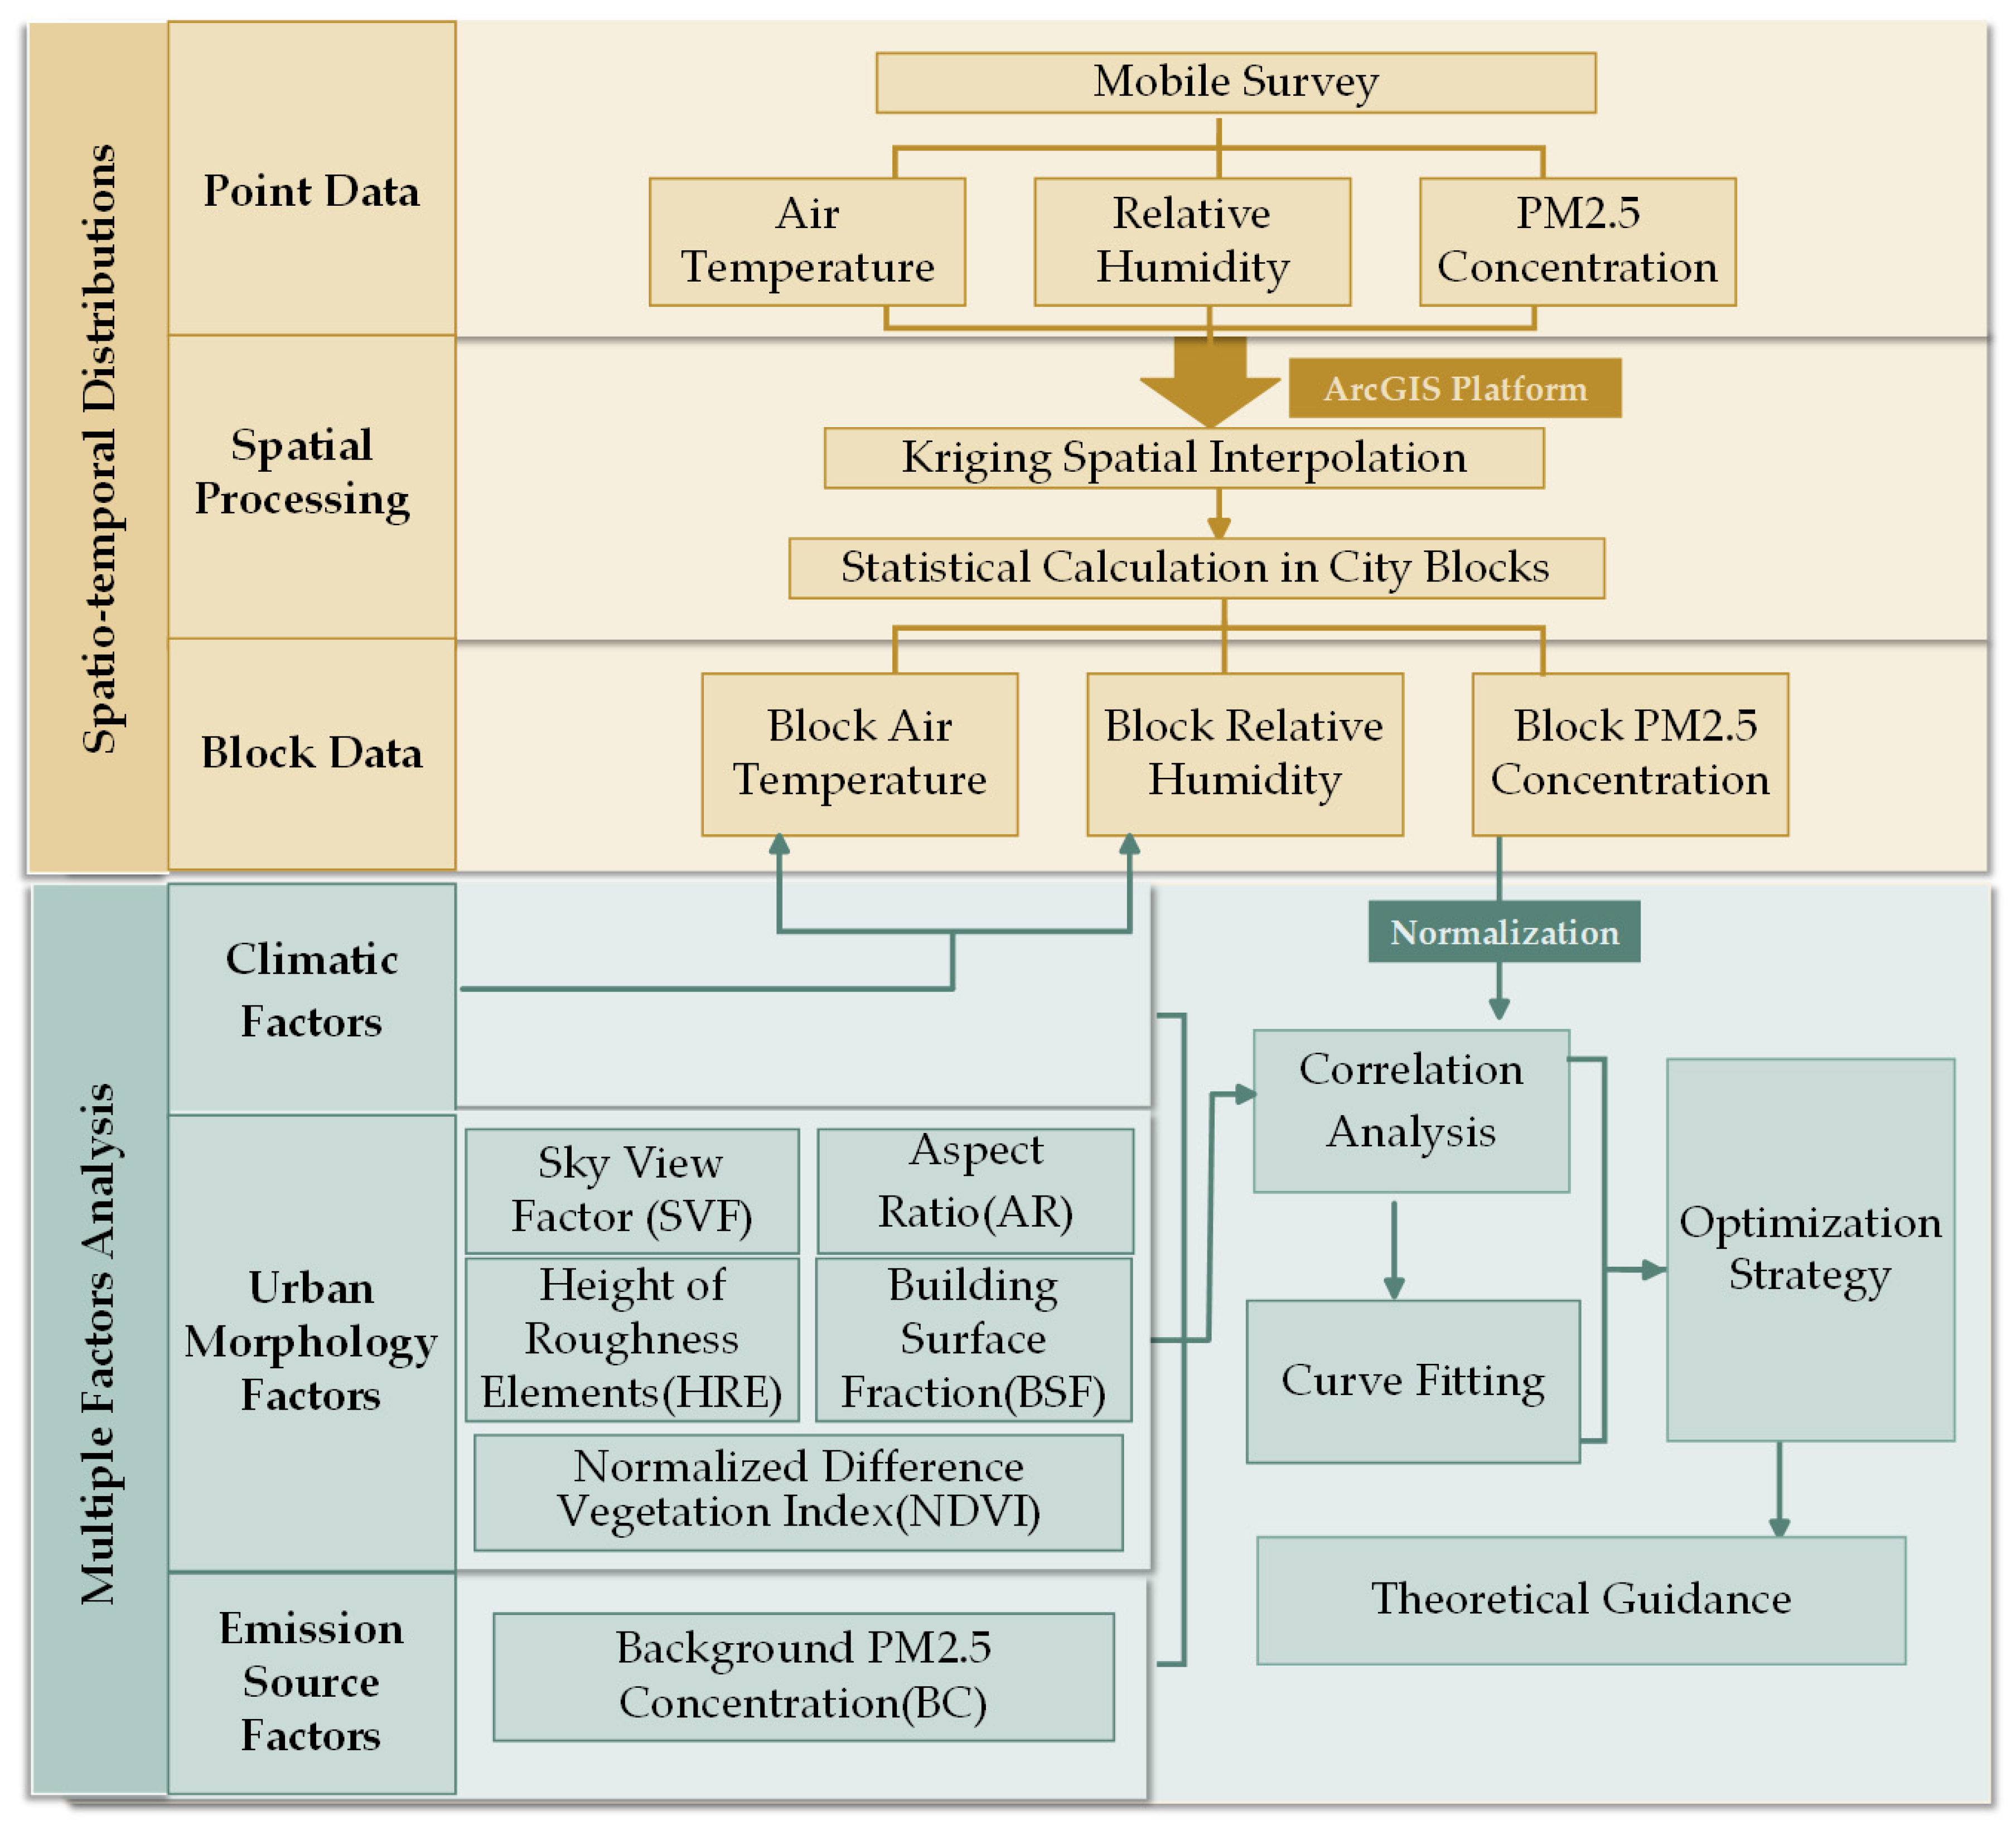
2. Methodology
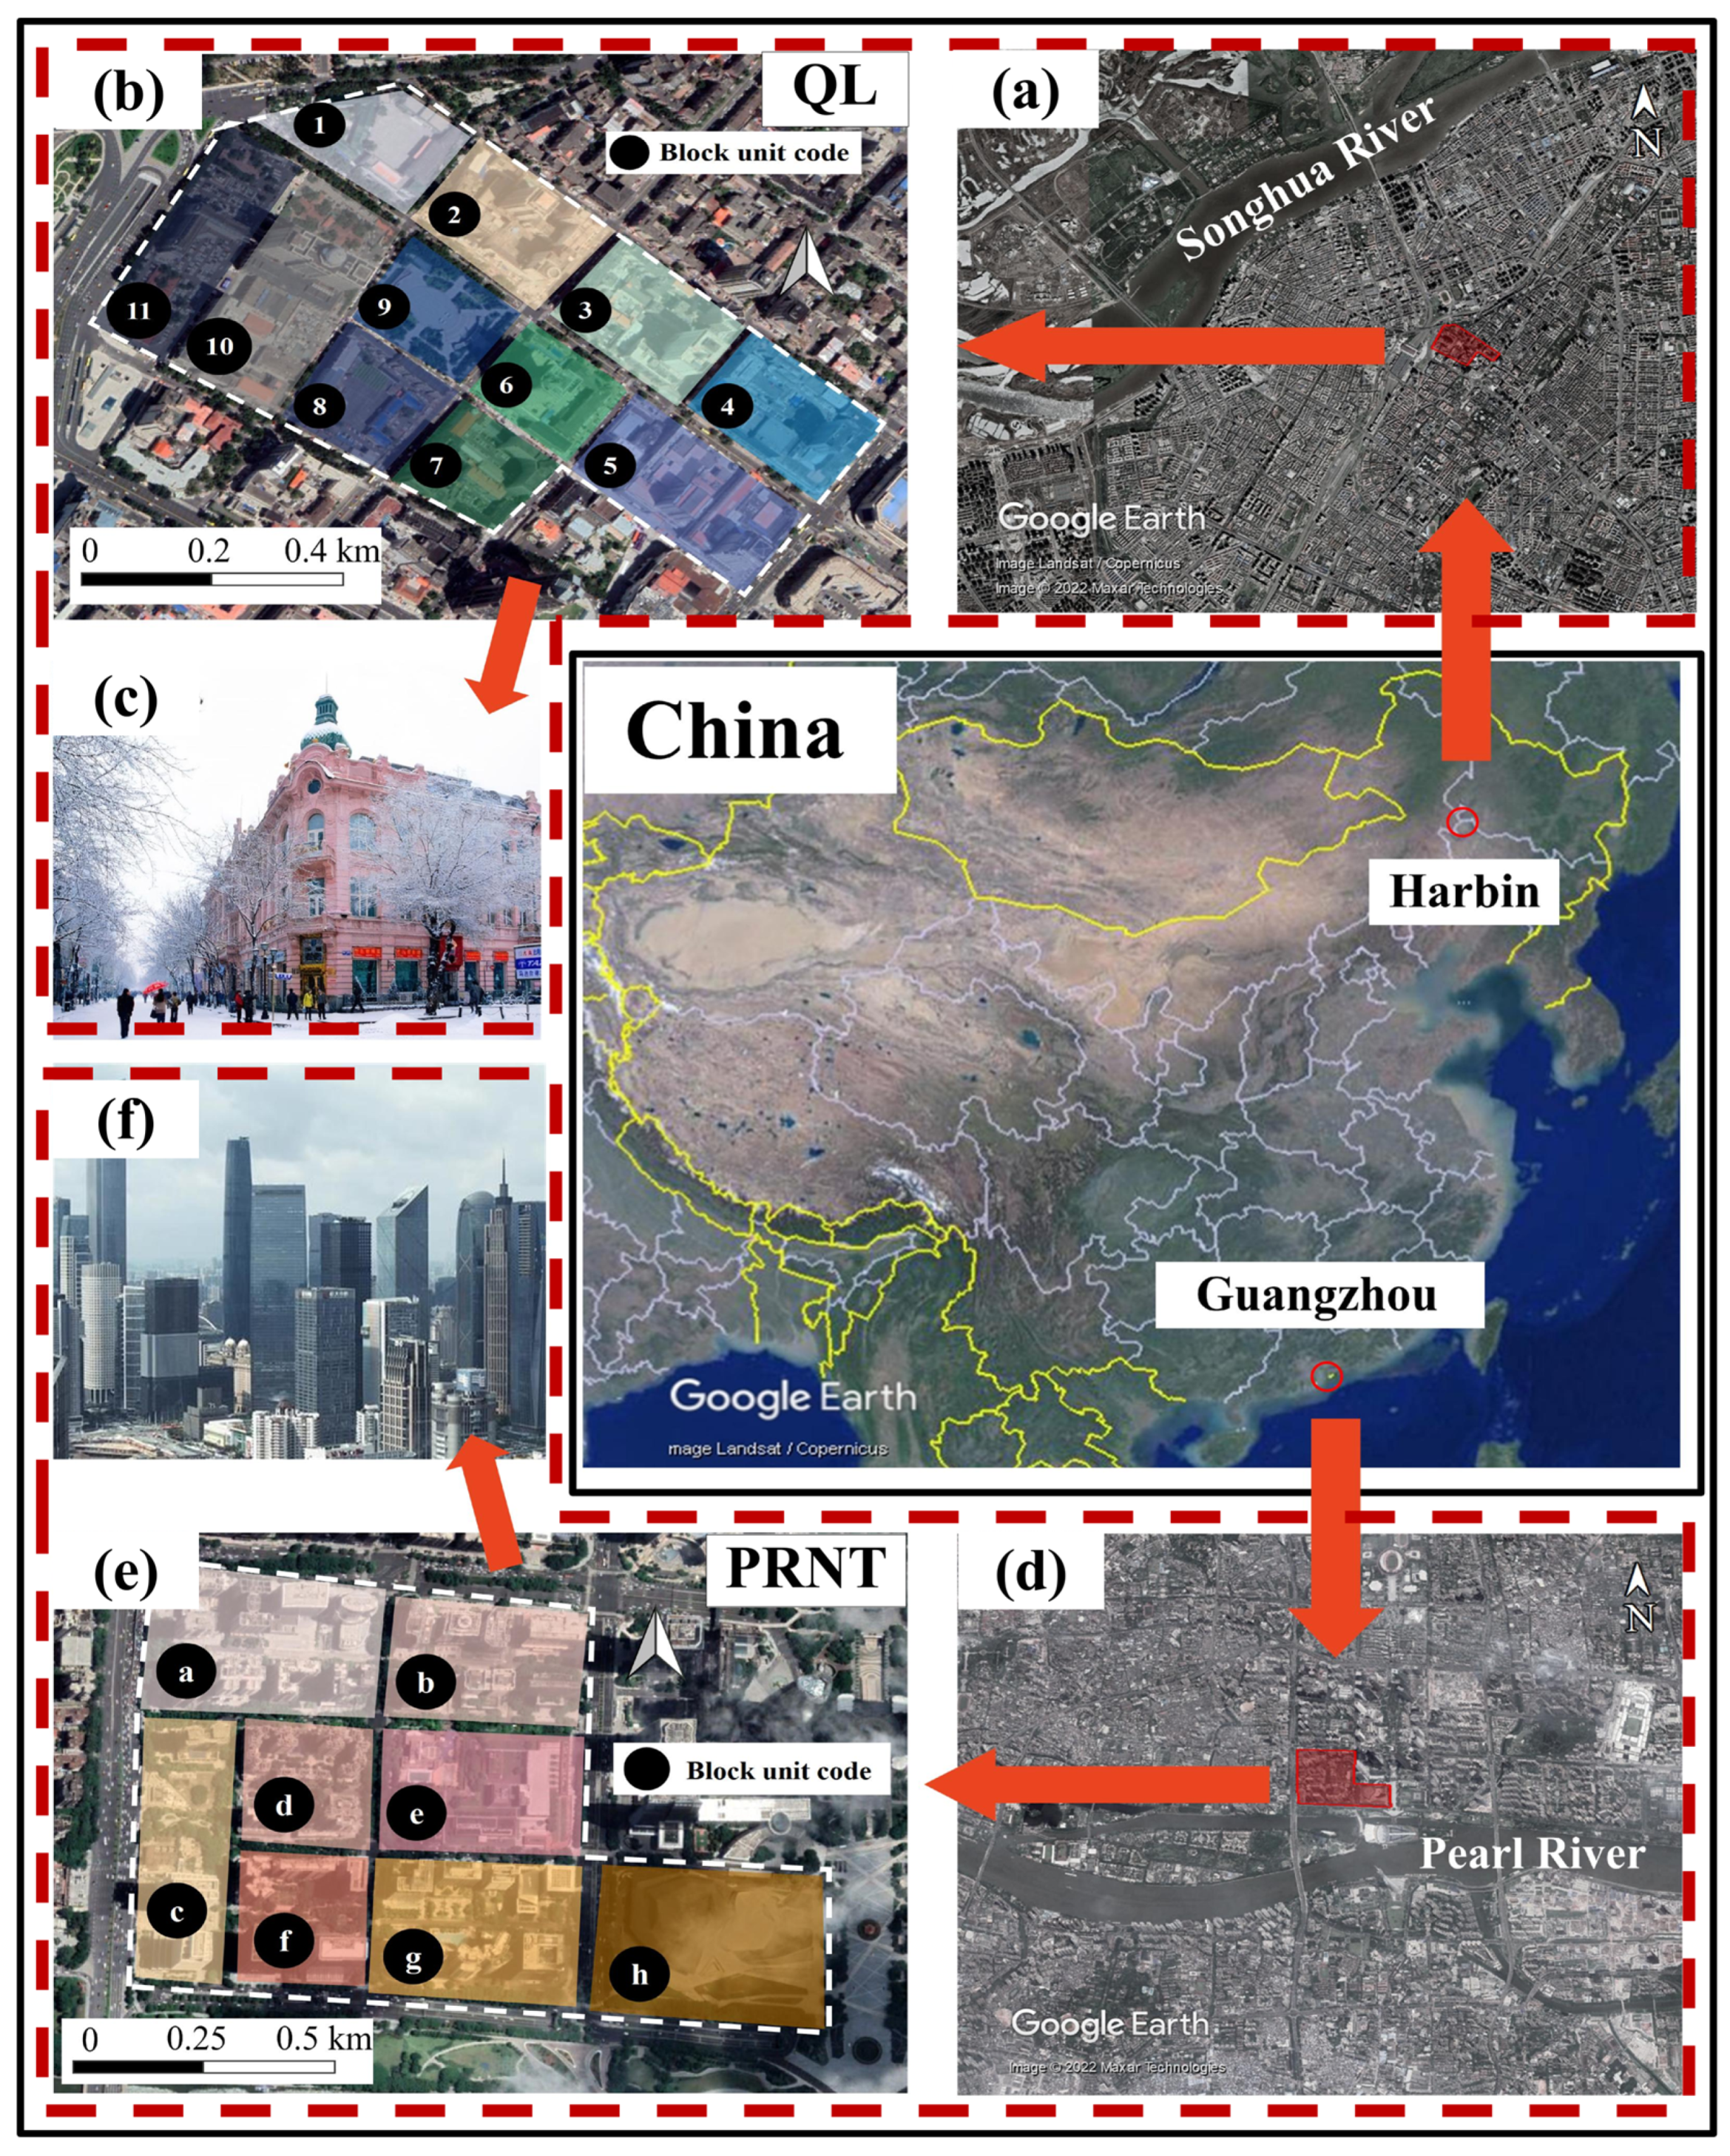
2.1. Study Area
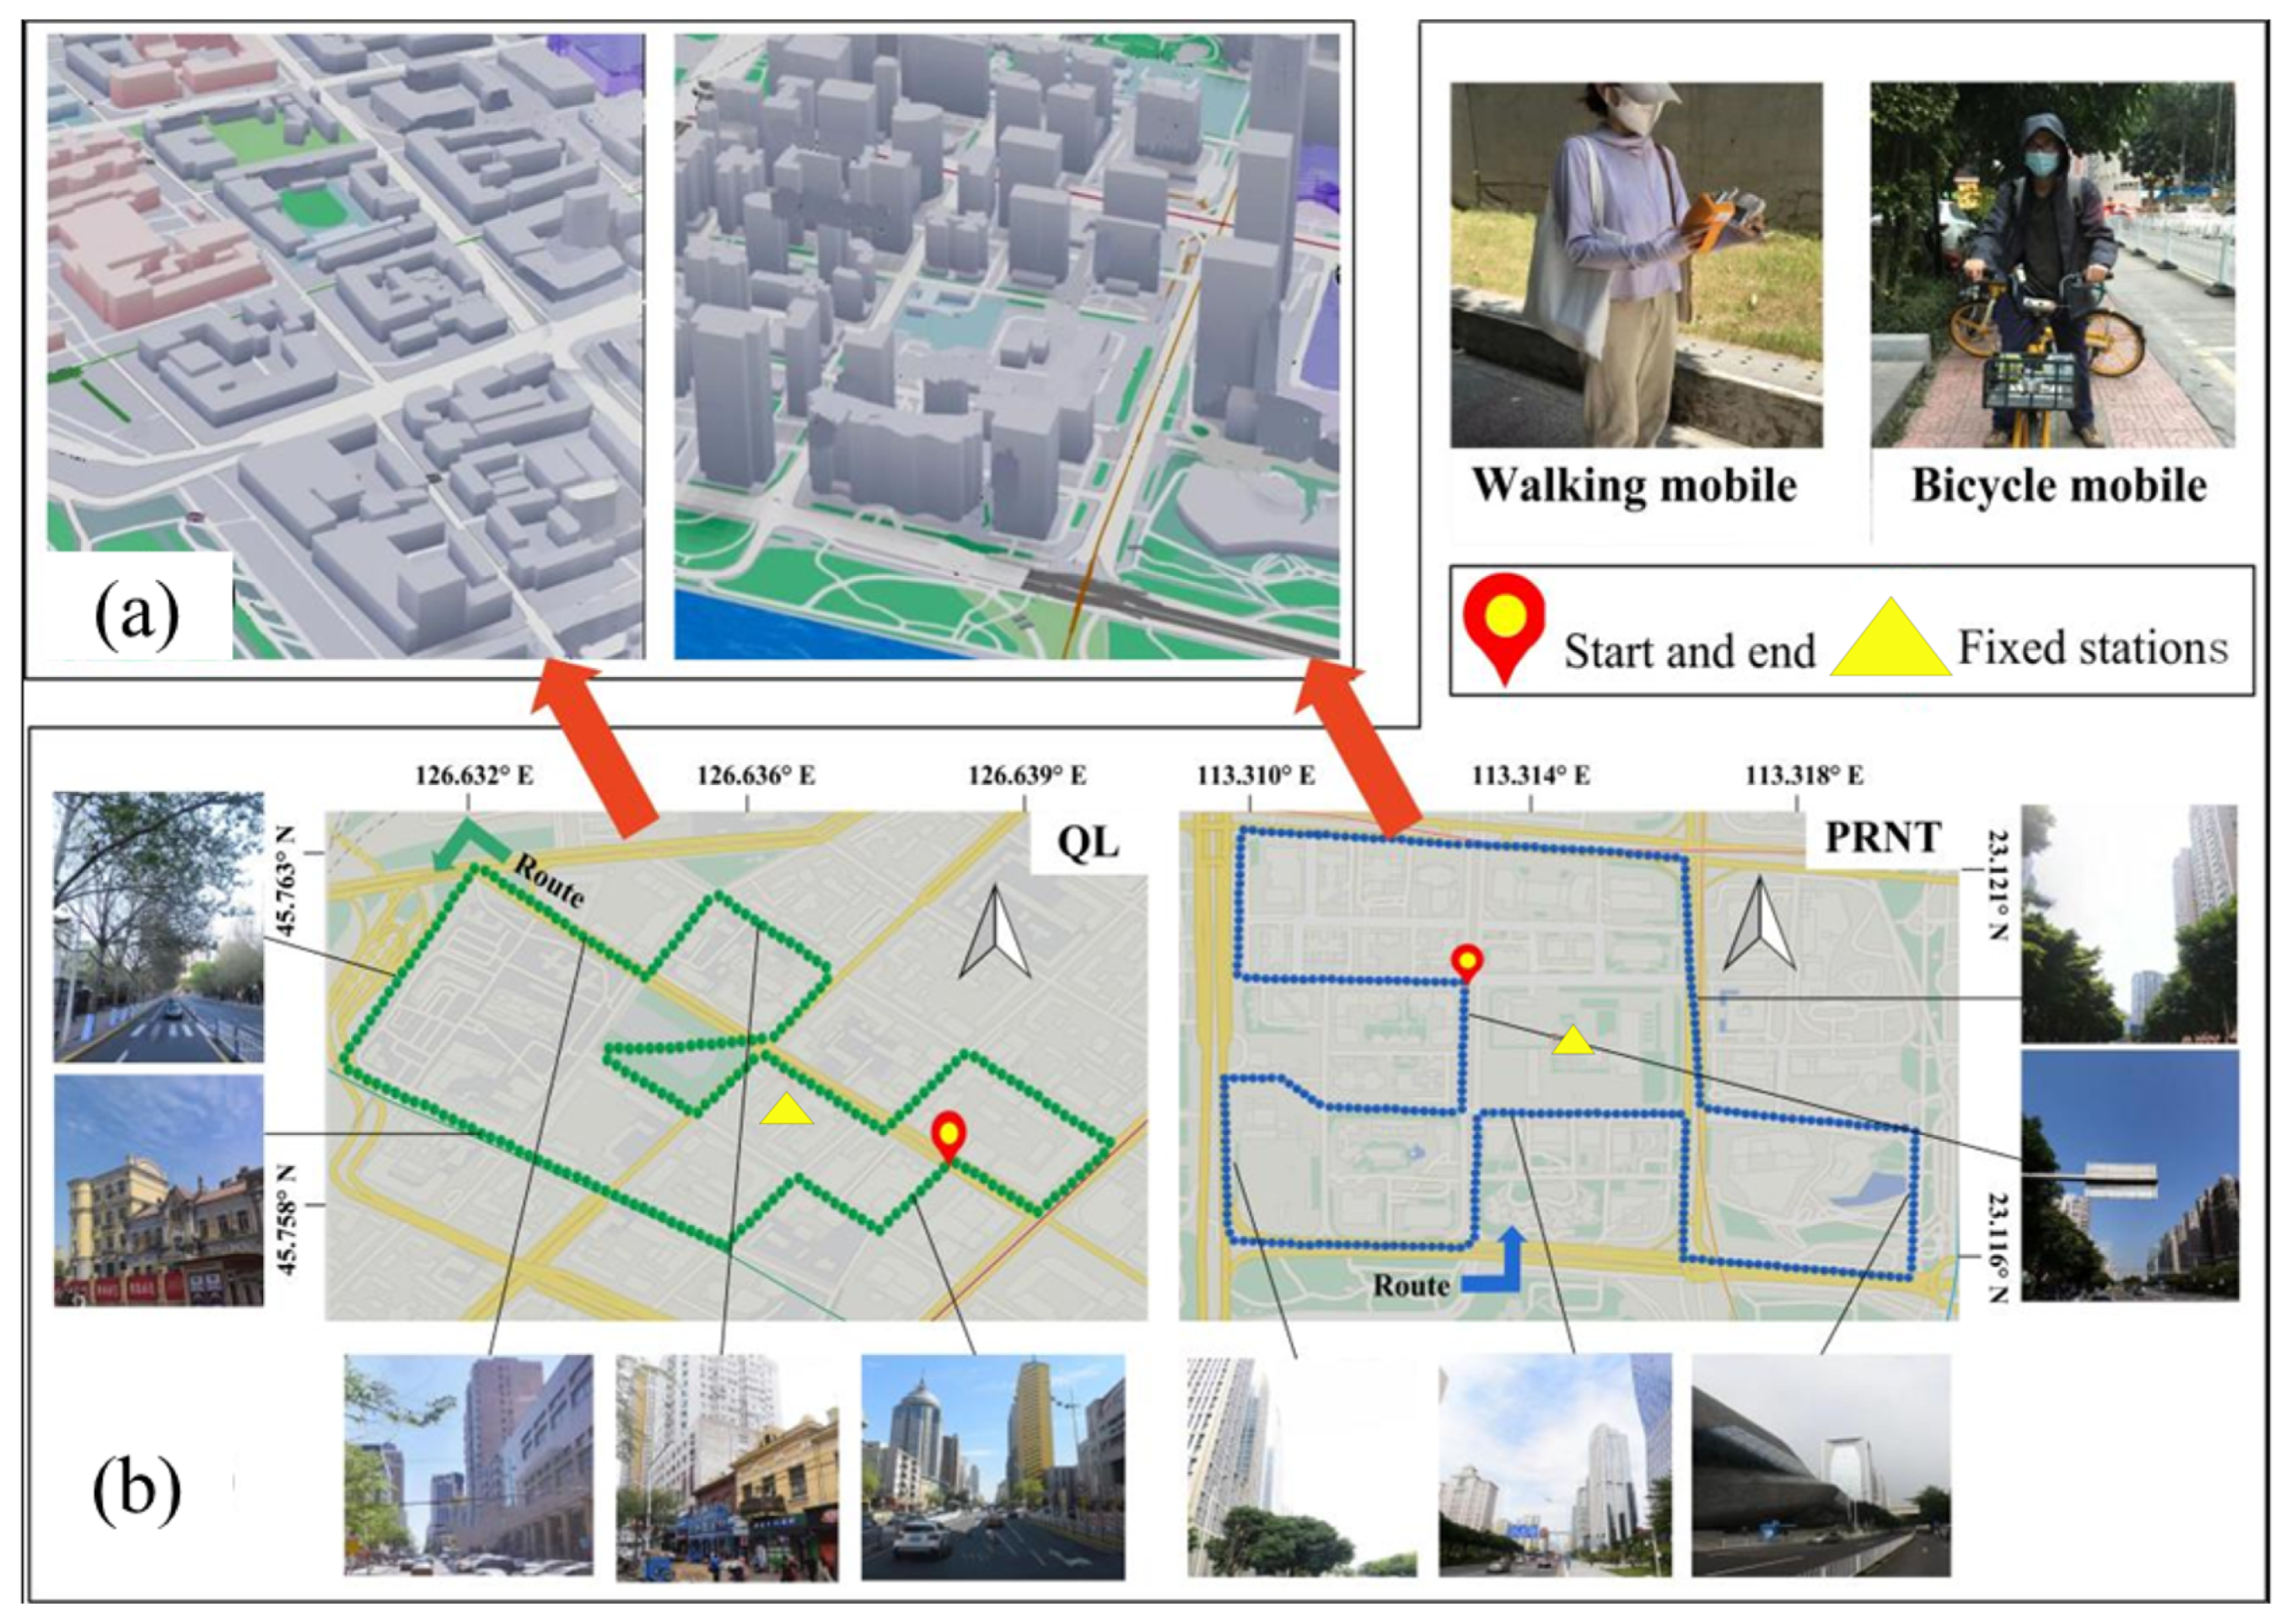
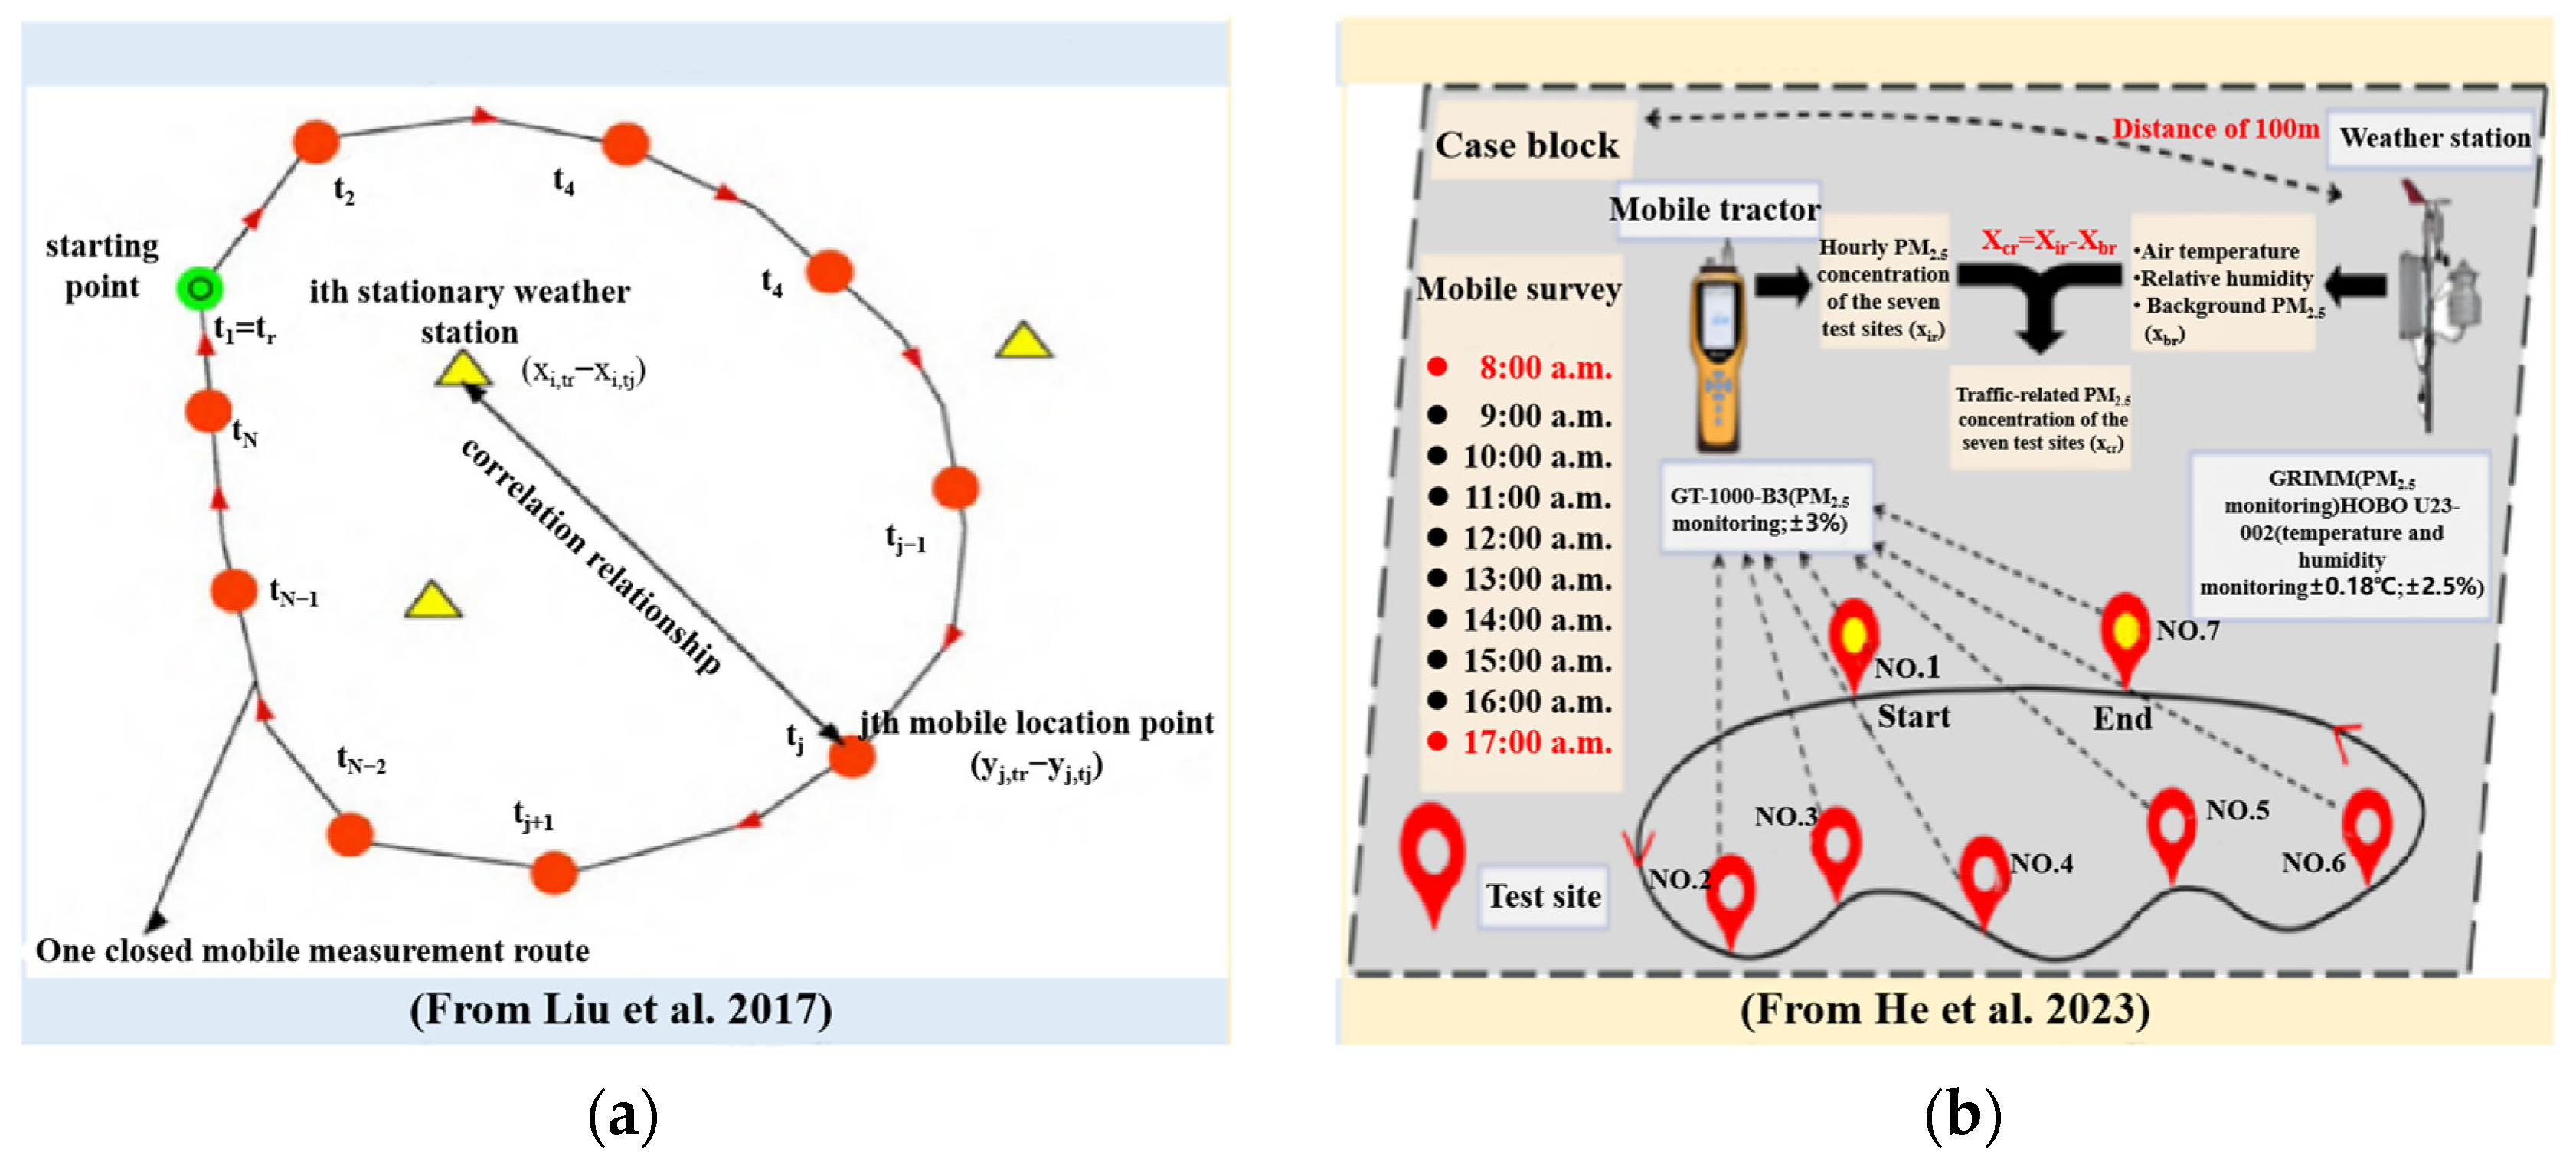
2.2. Mobile Monitoring Routes and Instrument Settings
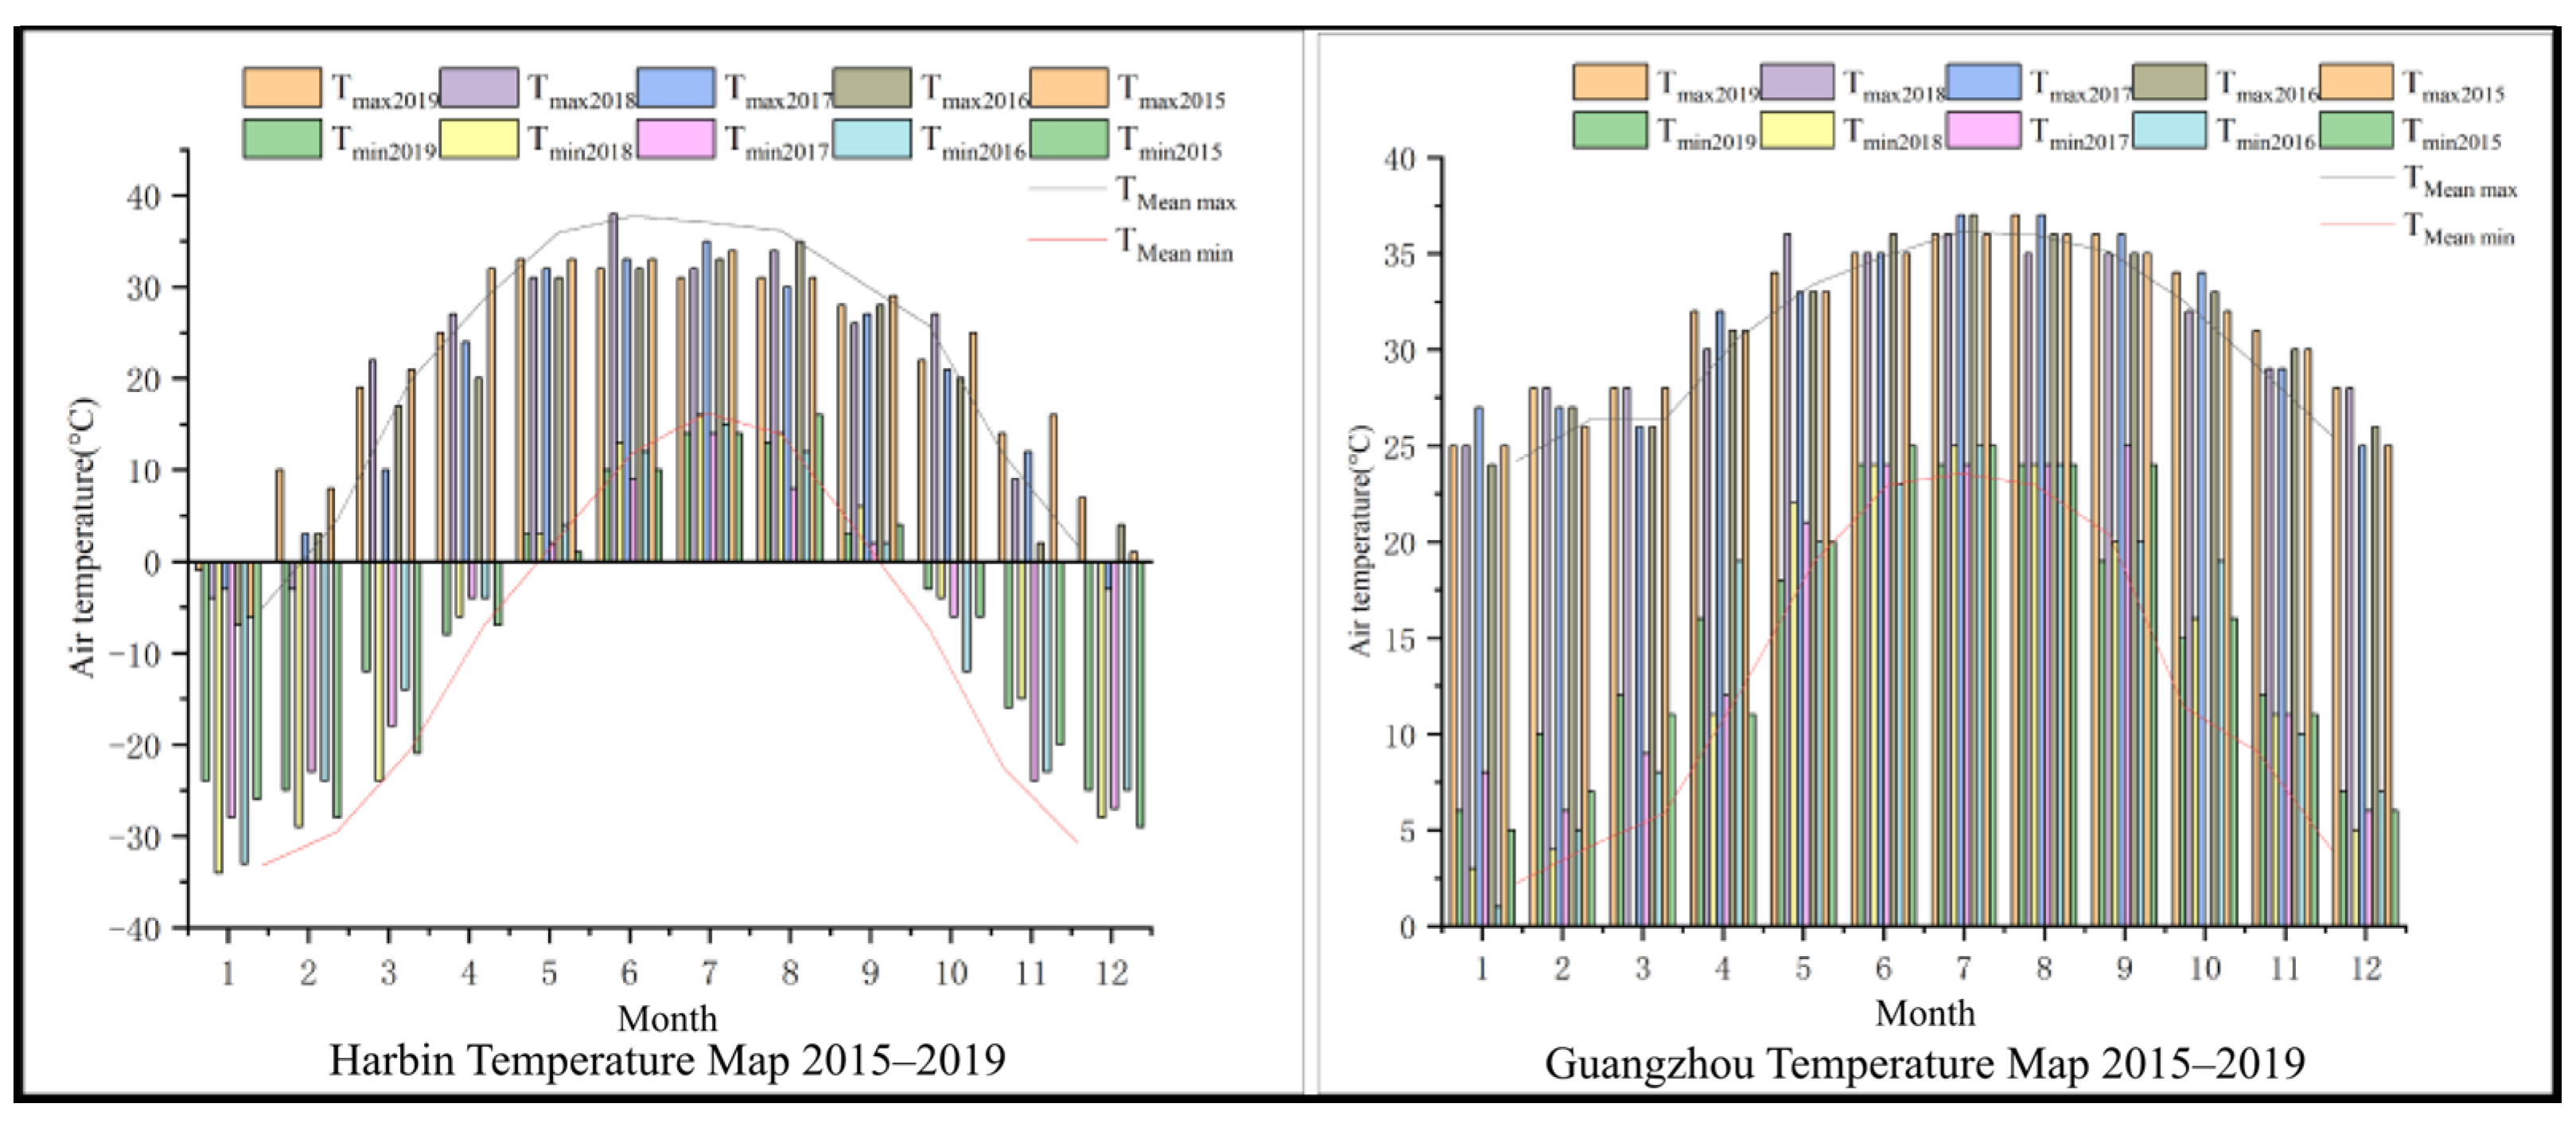
2.3. Climatic Conditions on Measurement Days and Data Processing
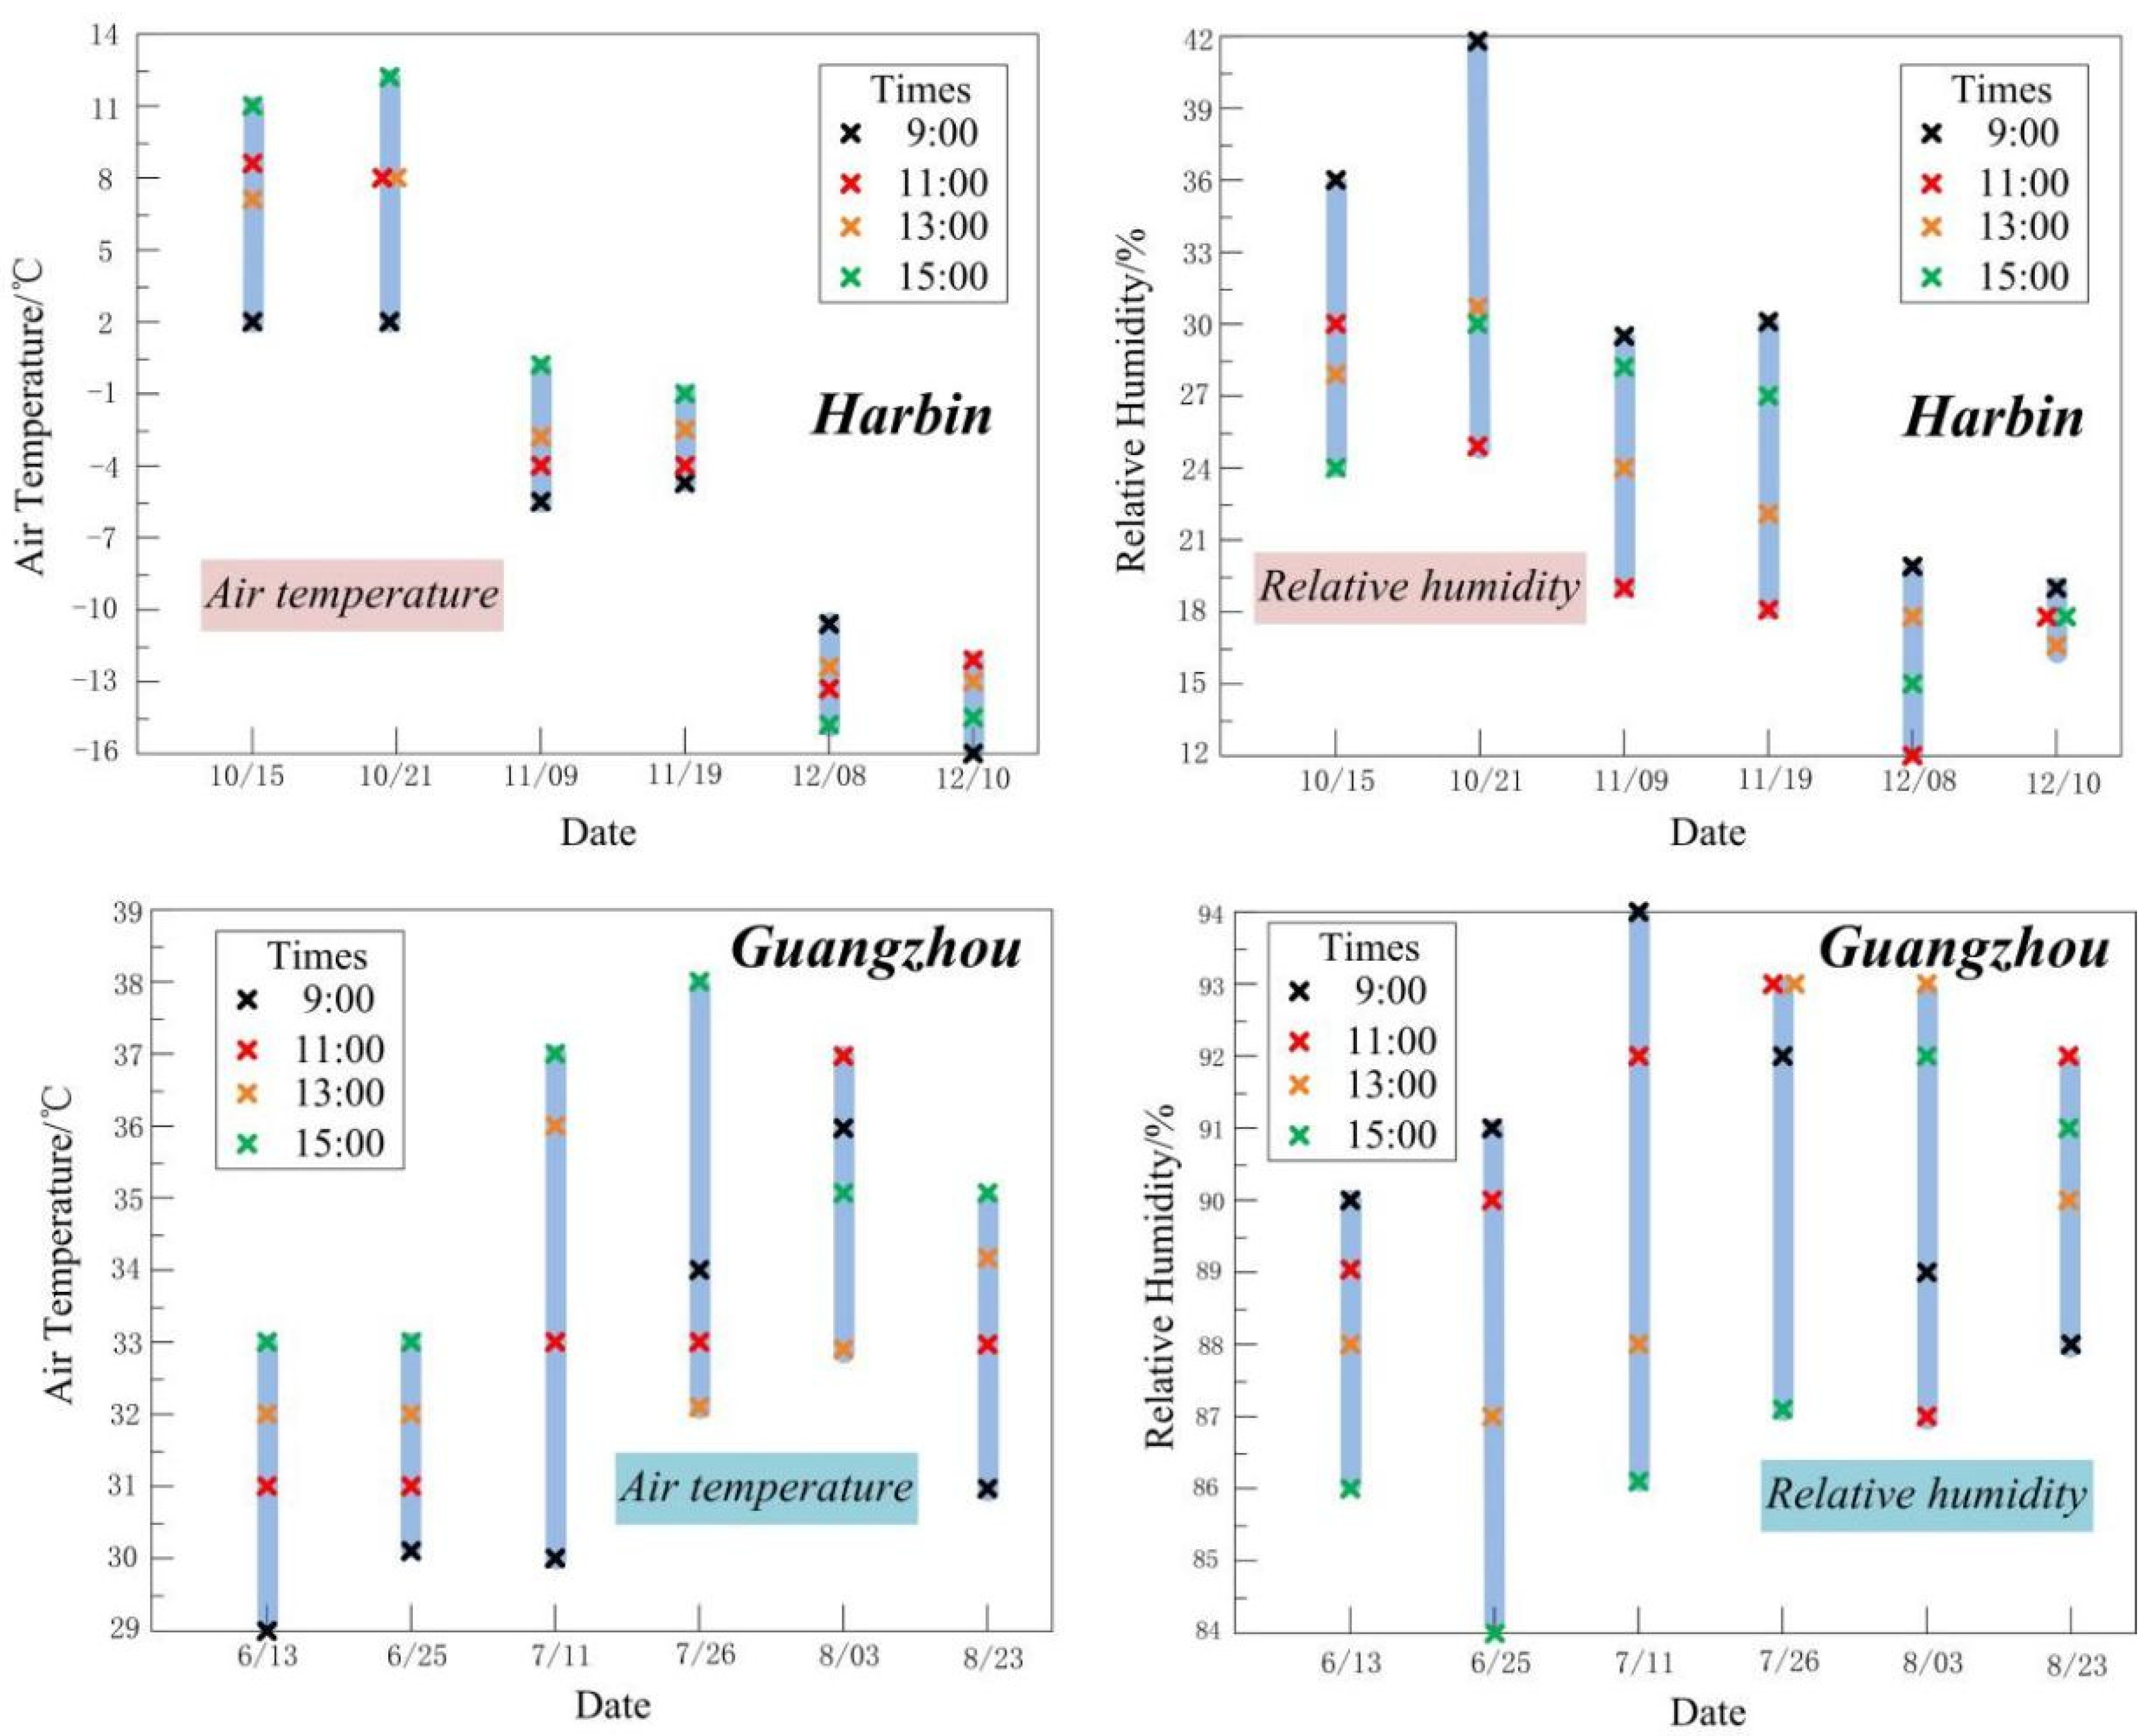
- Background climatic conditions
- Mobile data calibration
- Factor collection
- Data processing
3. Results
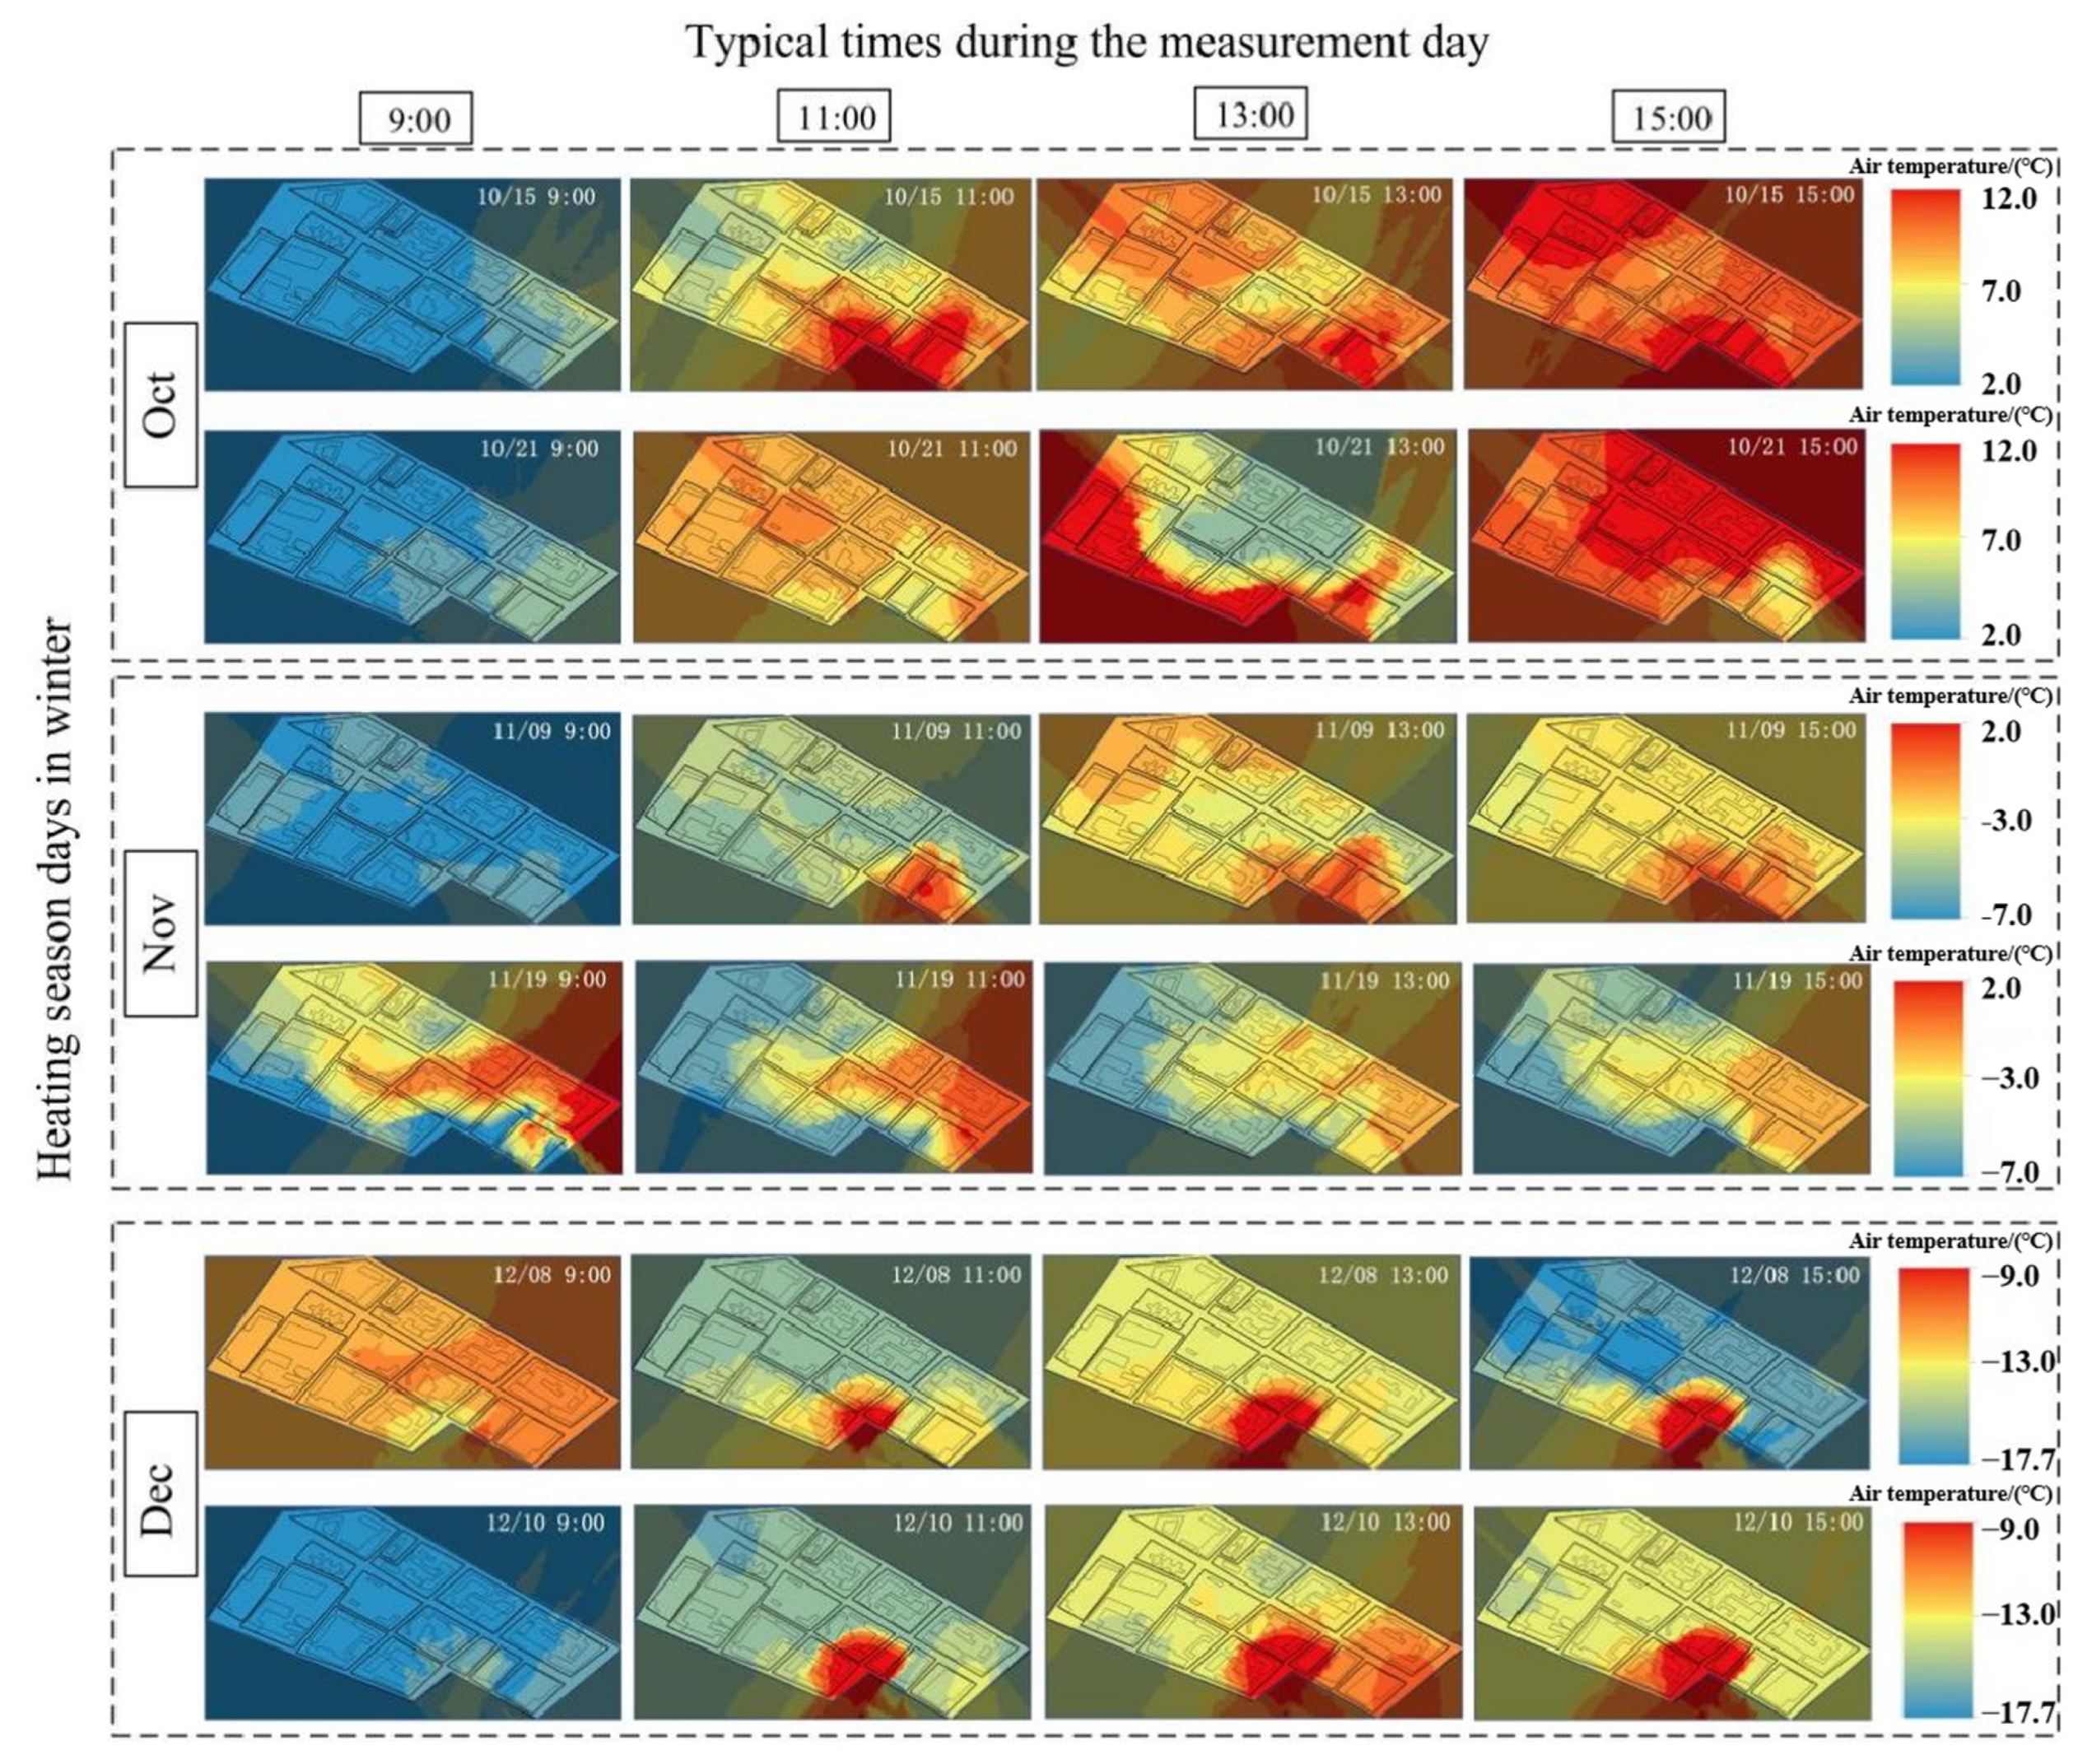
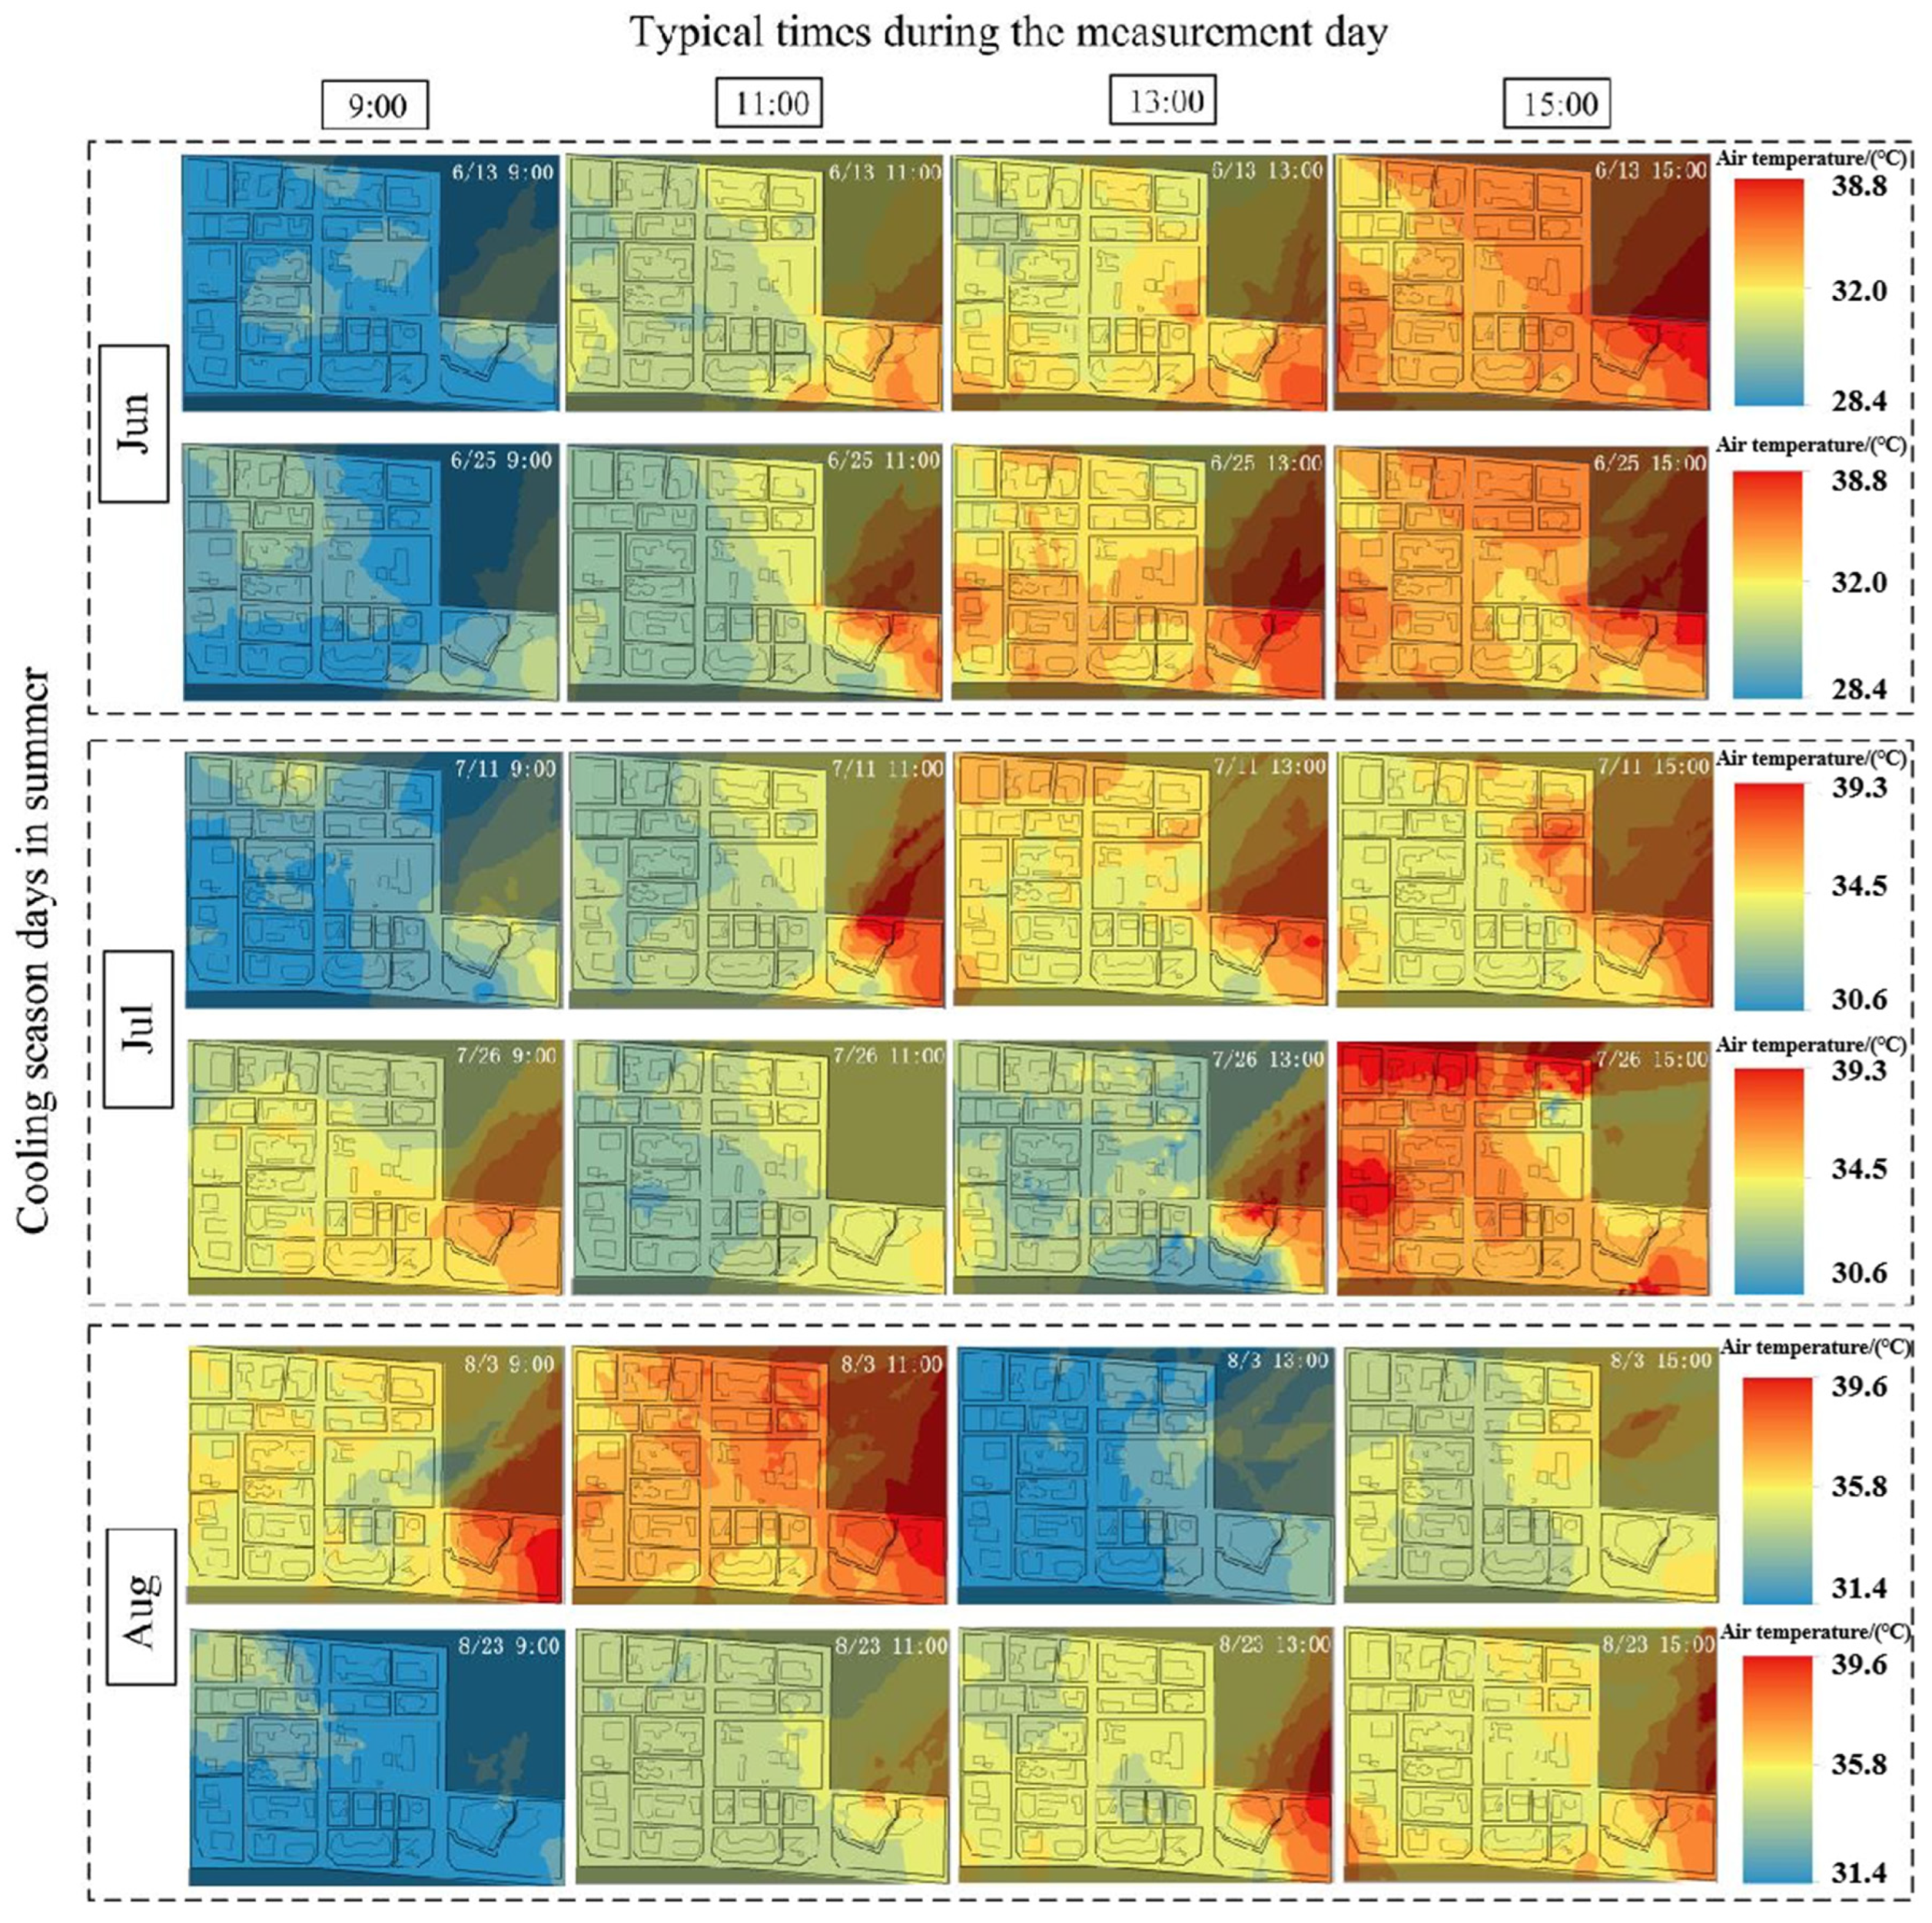
3.1. Spatiotemporal Characteristic Distributions of Air Temperature
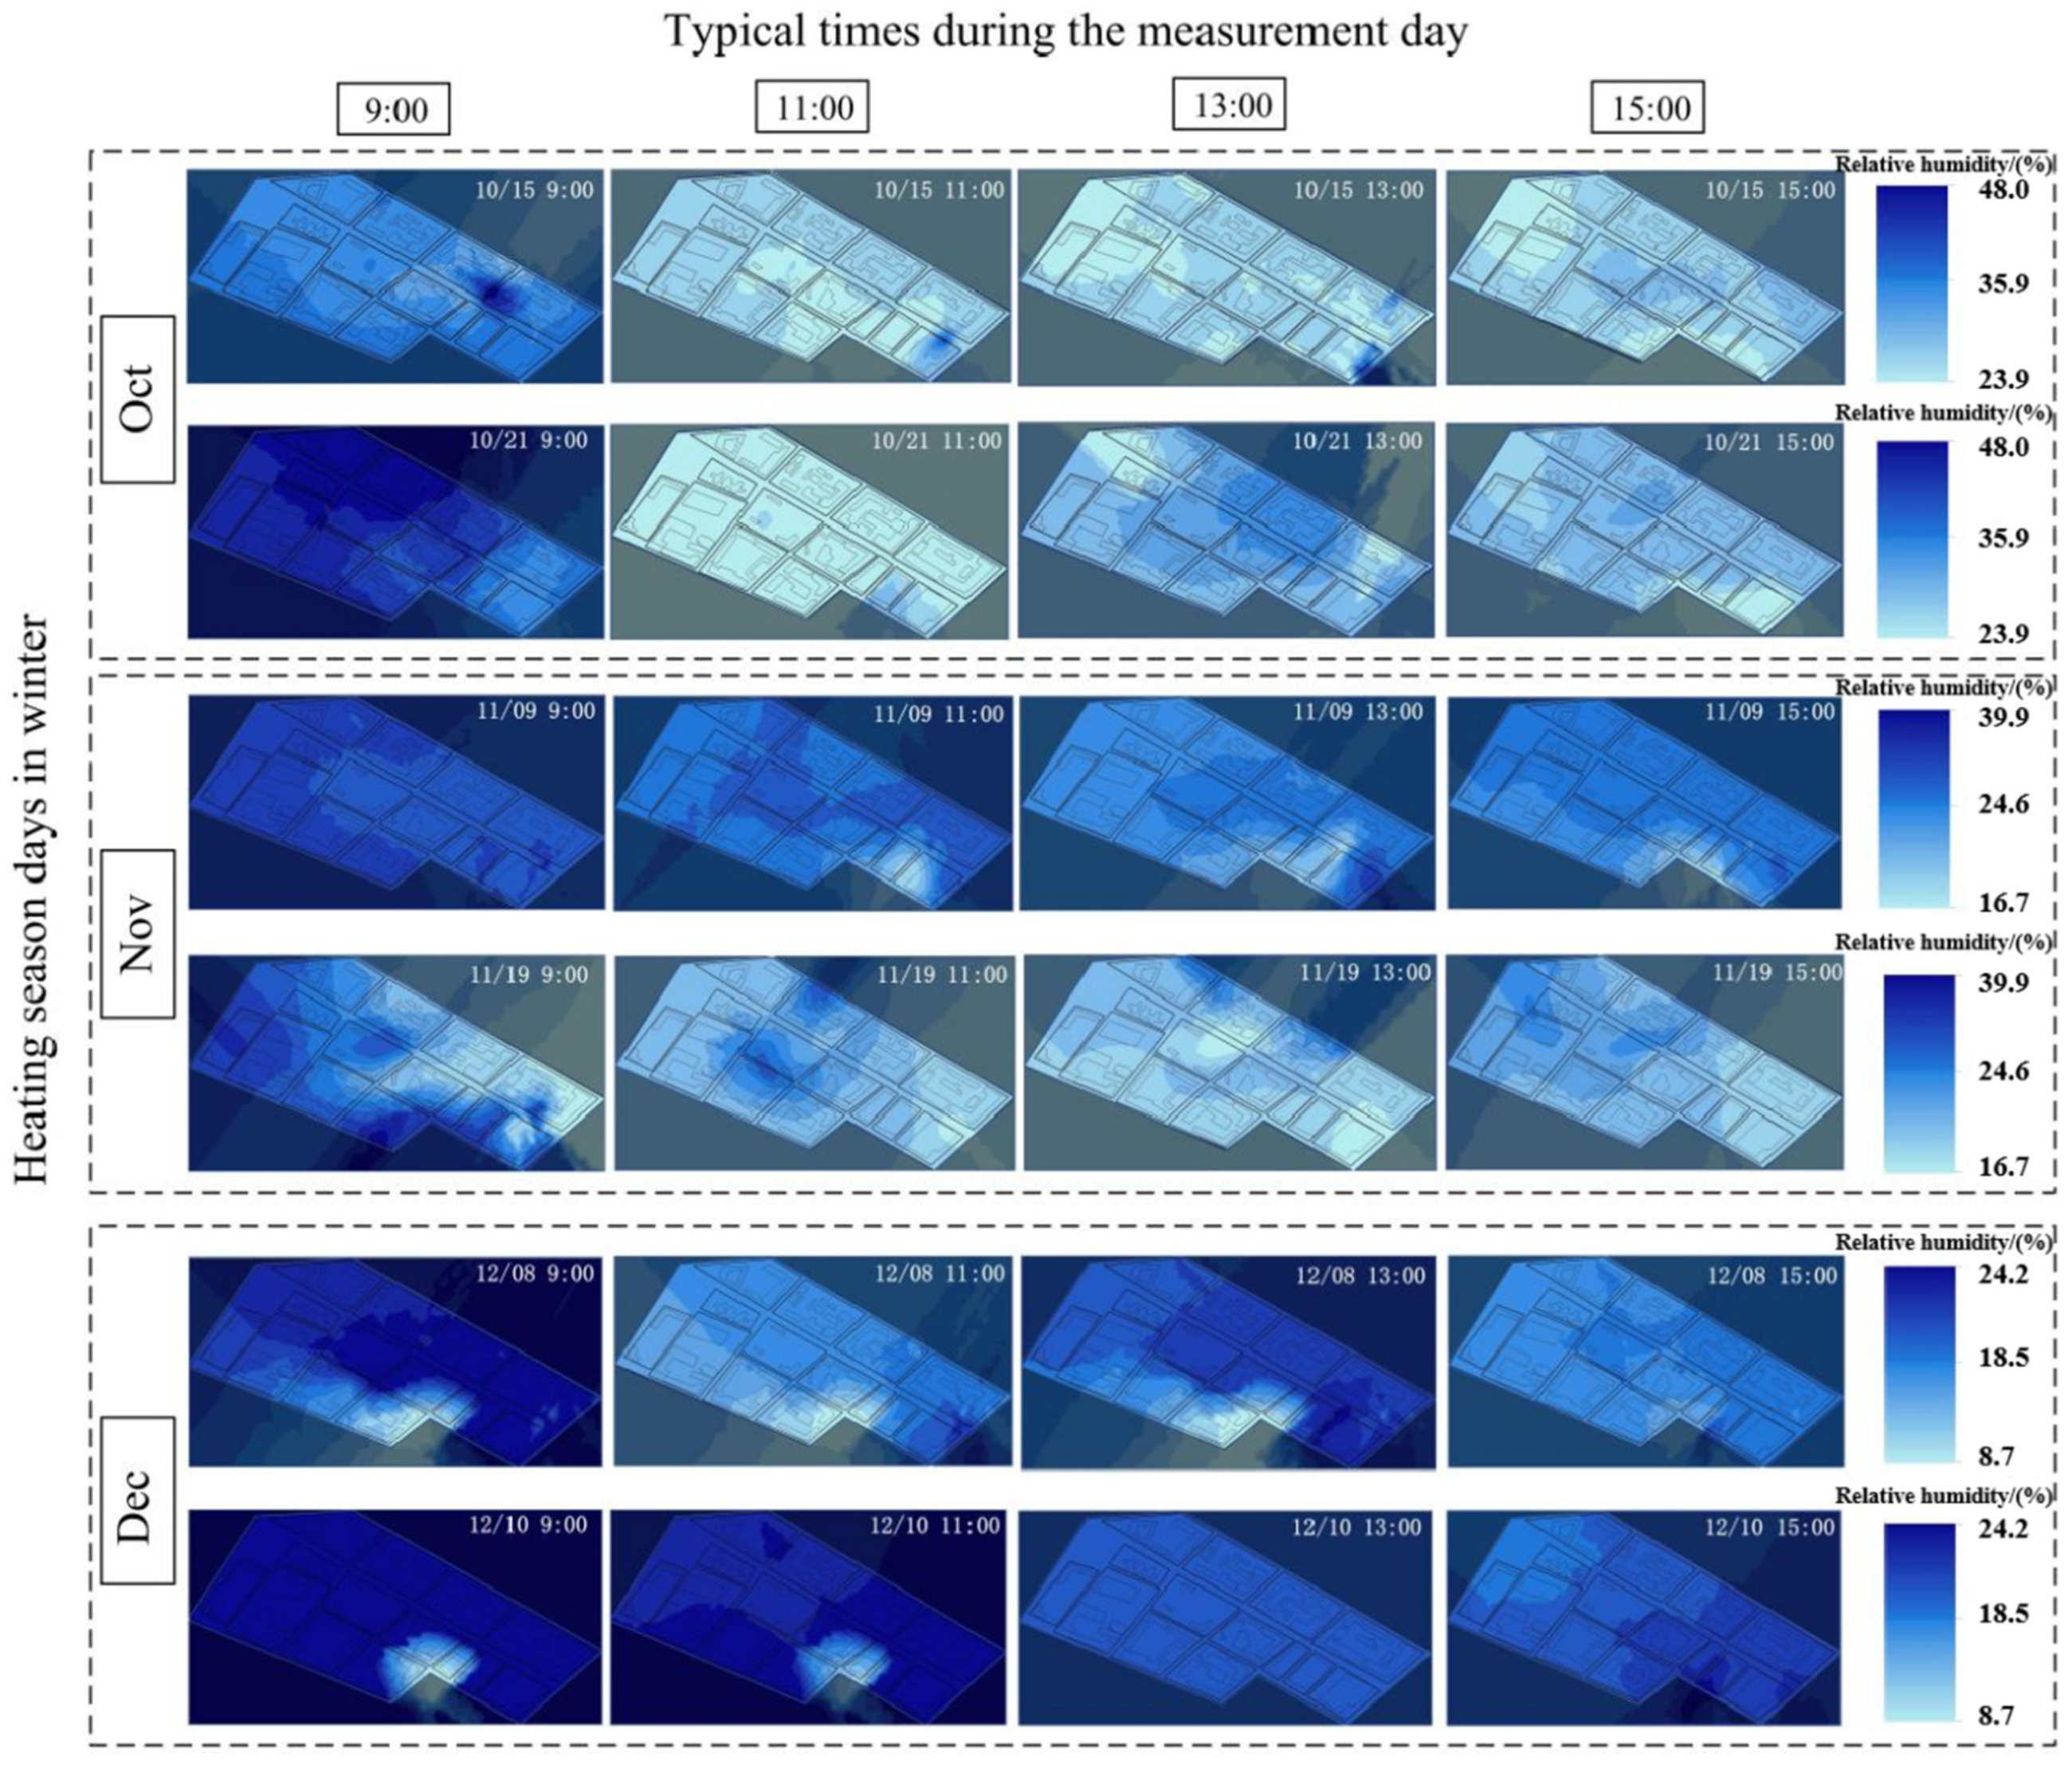
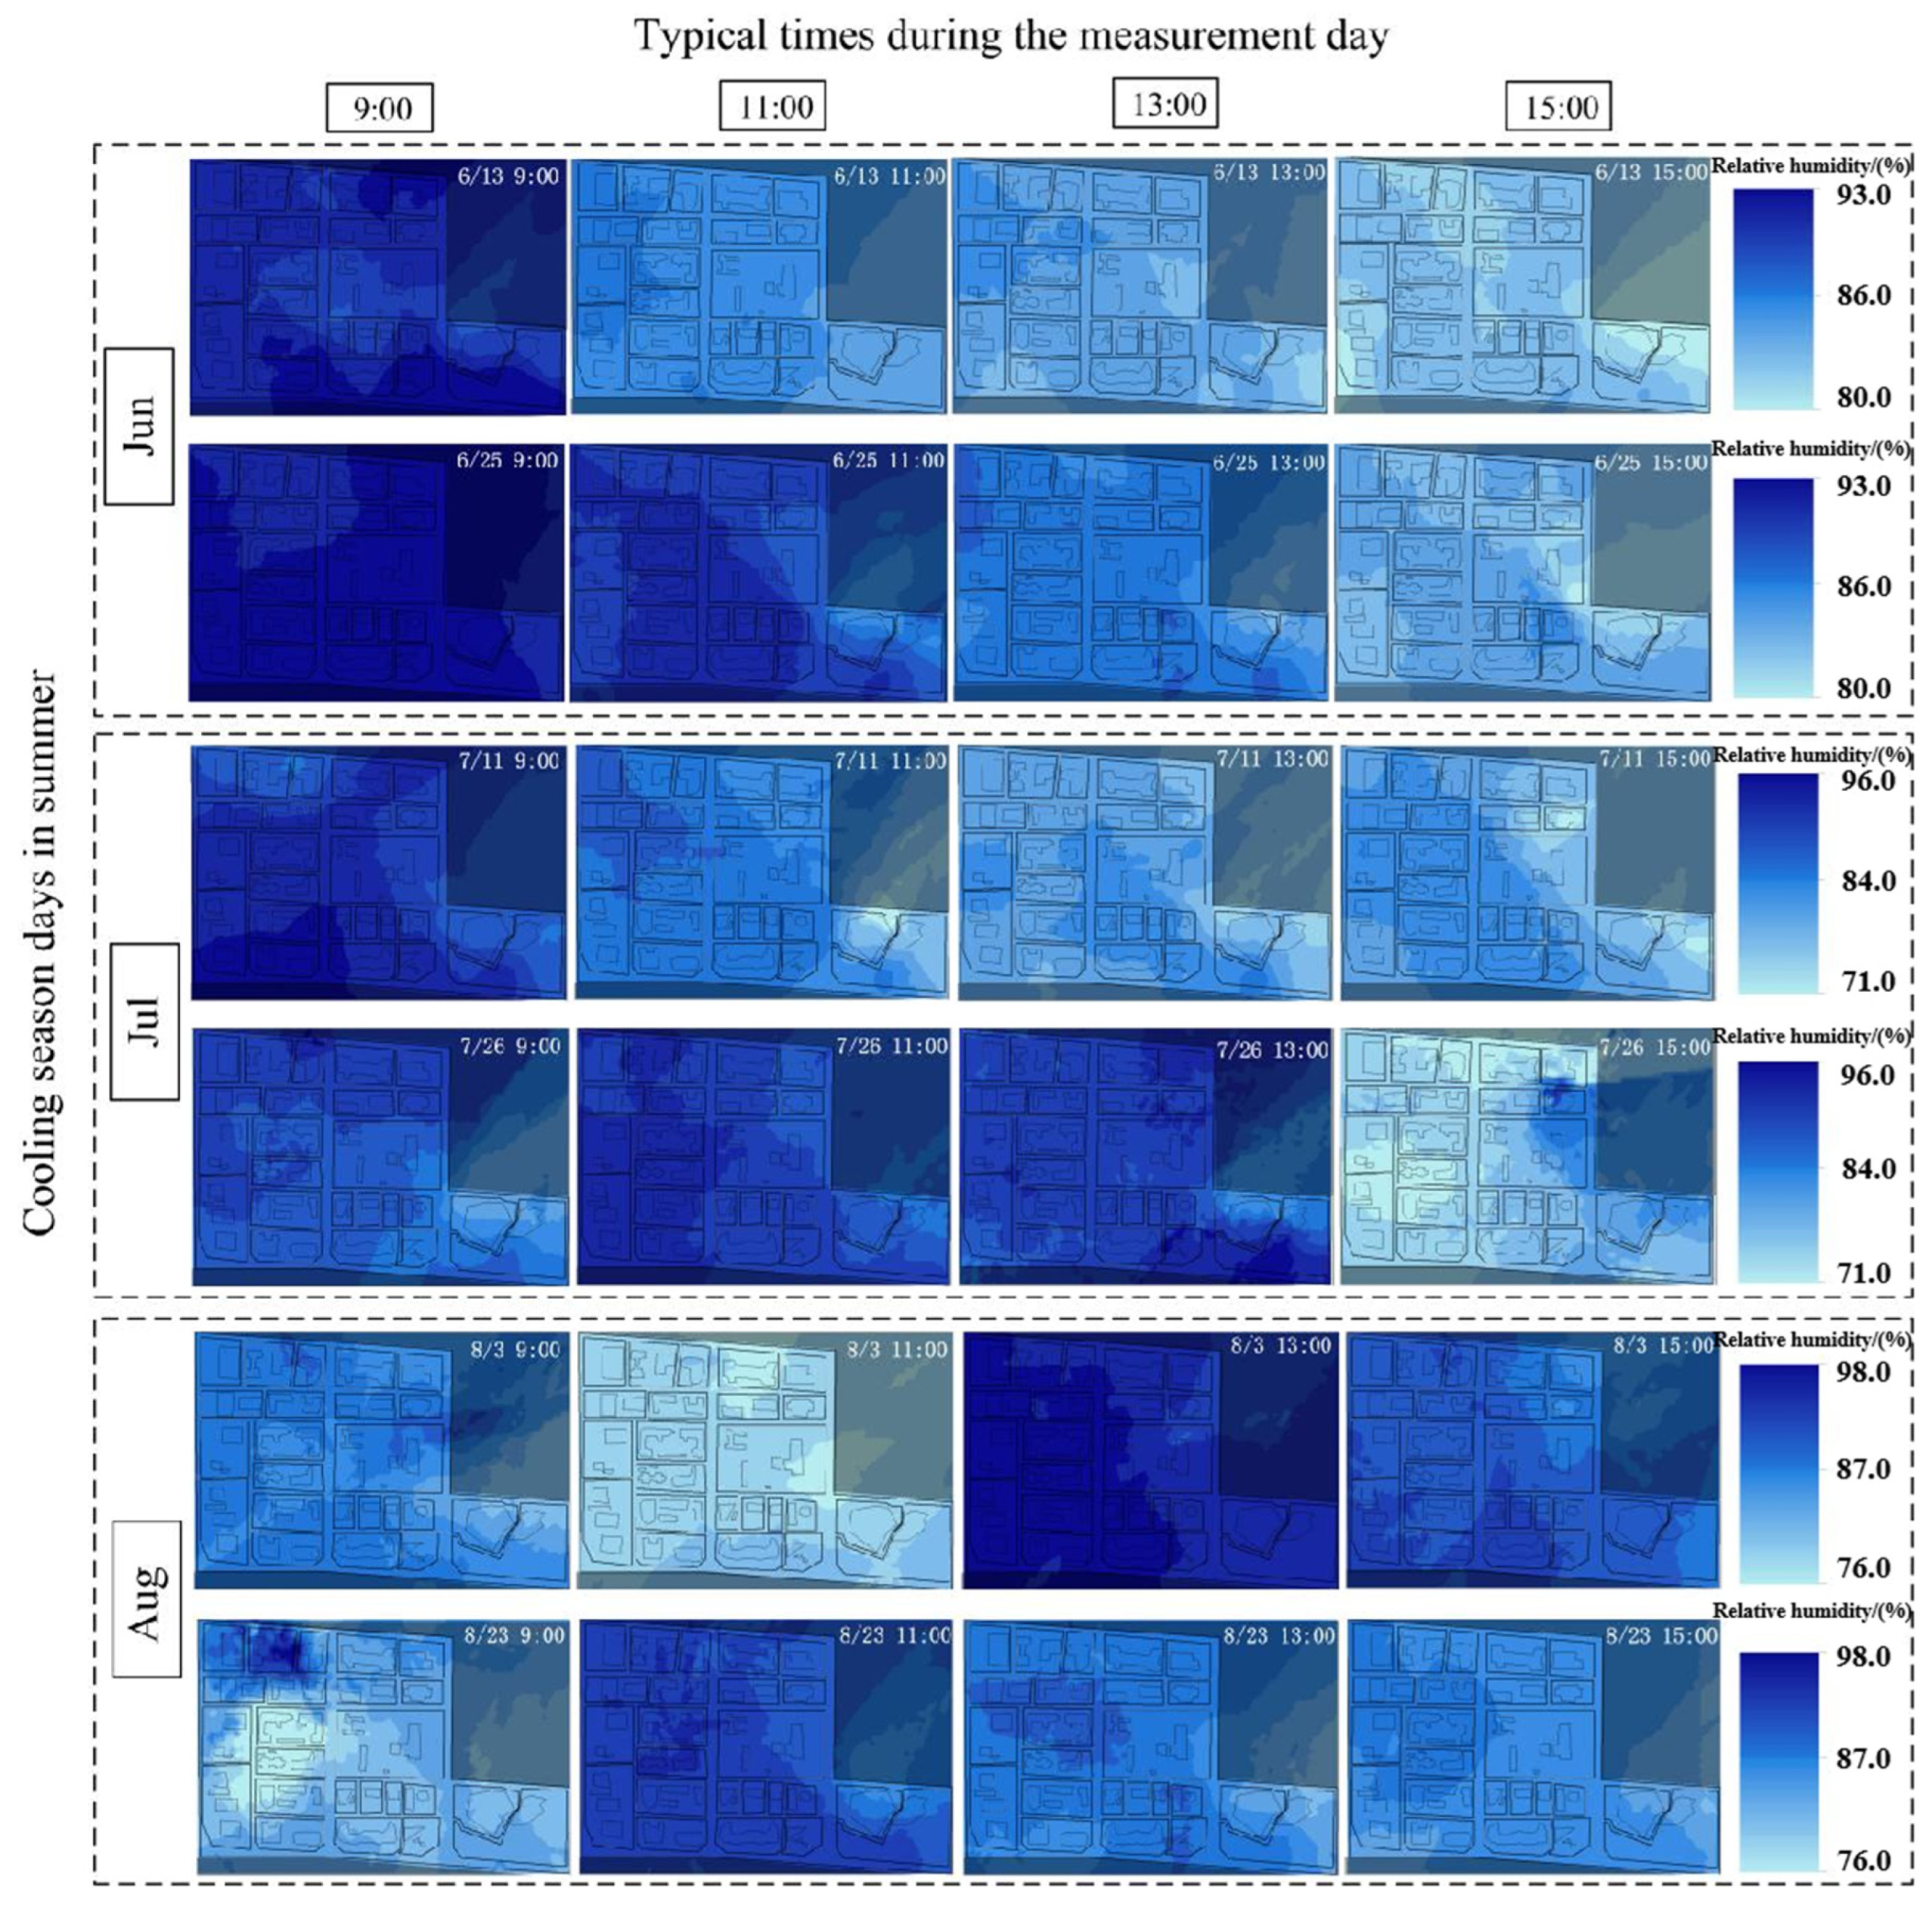
3.2. Spatiotemporal Characteristic Distributions of Relative Humidity
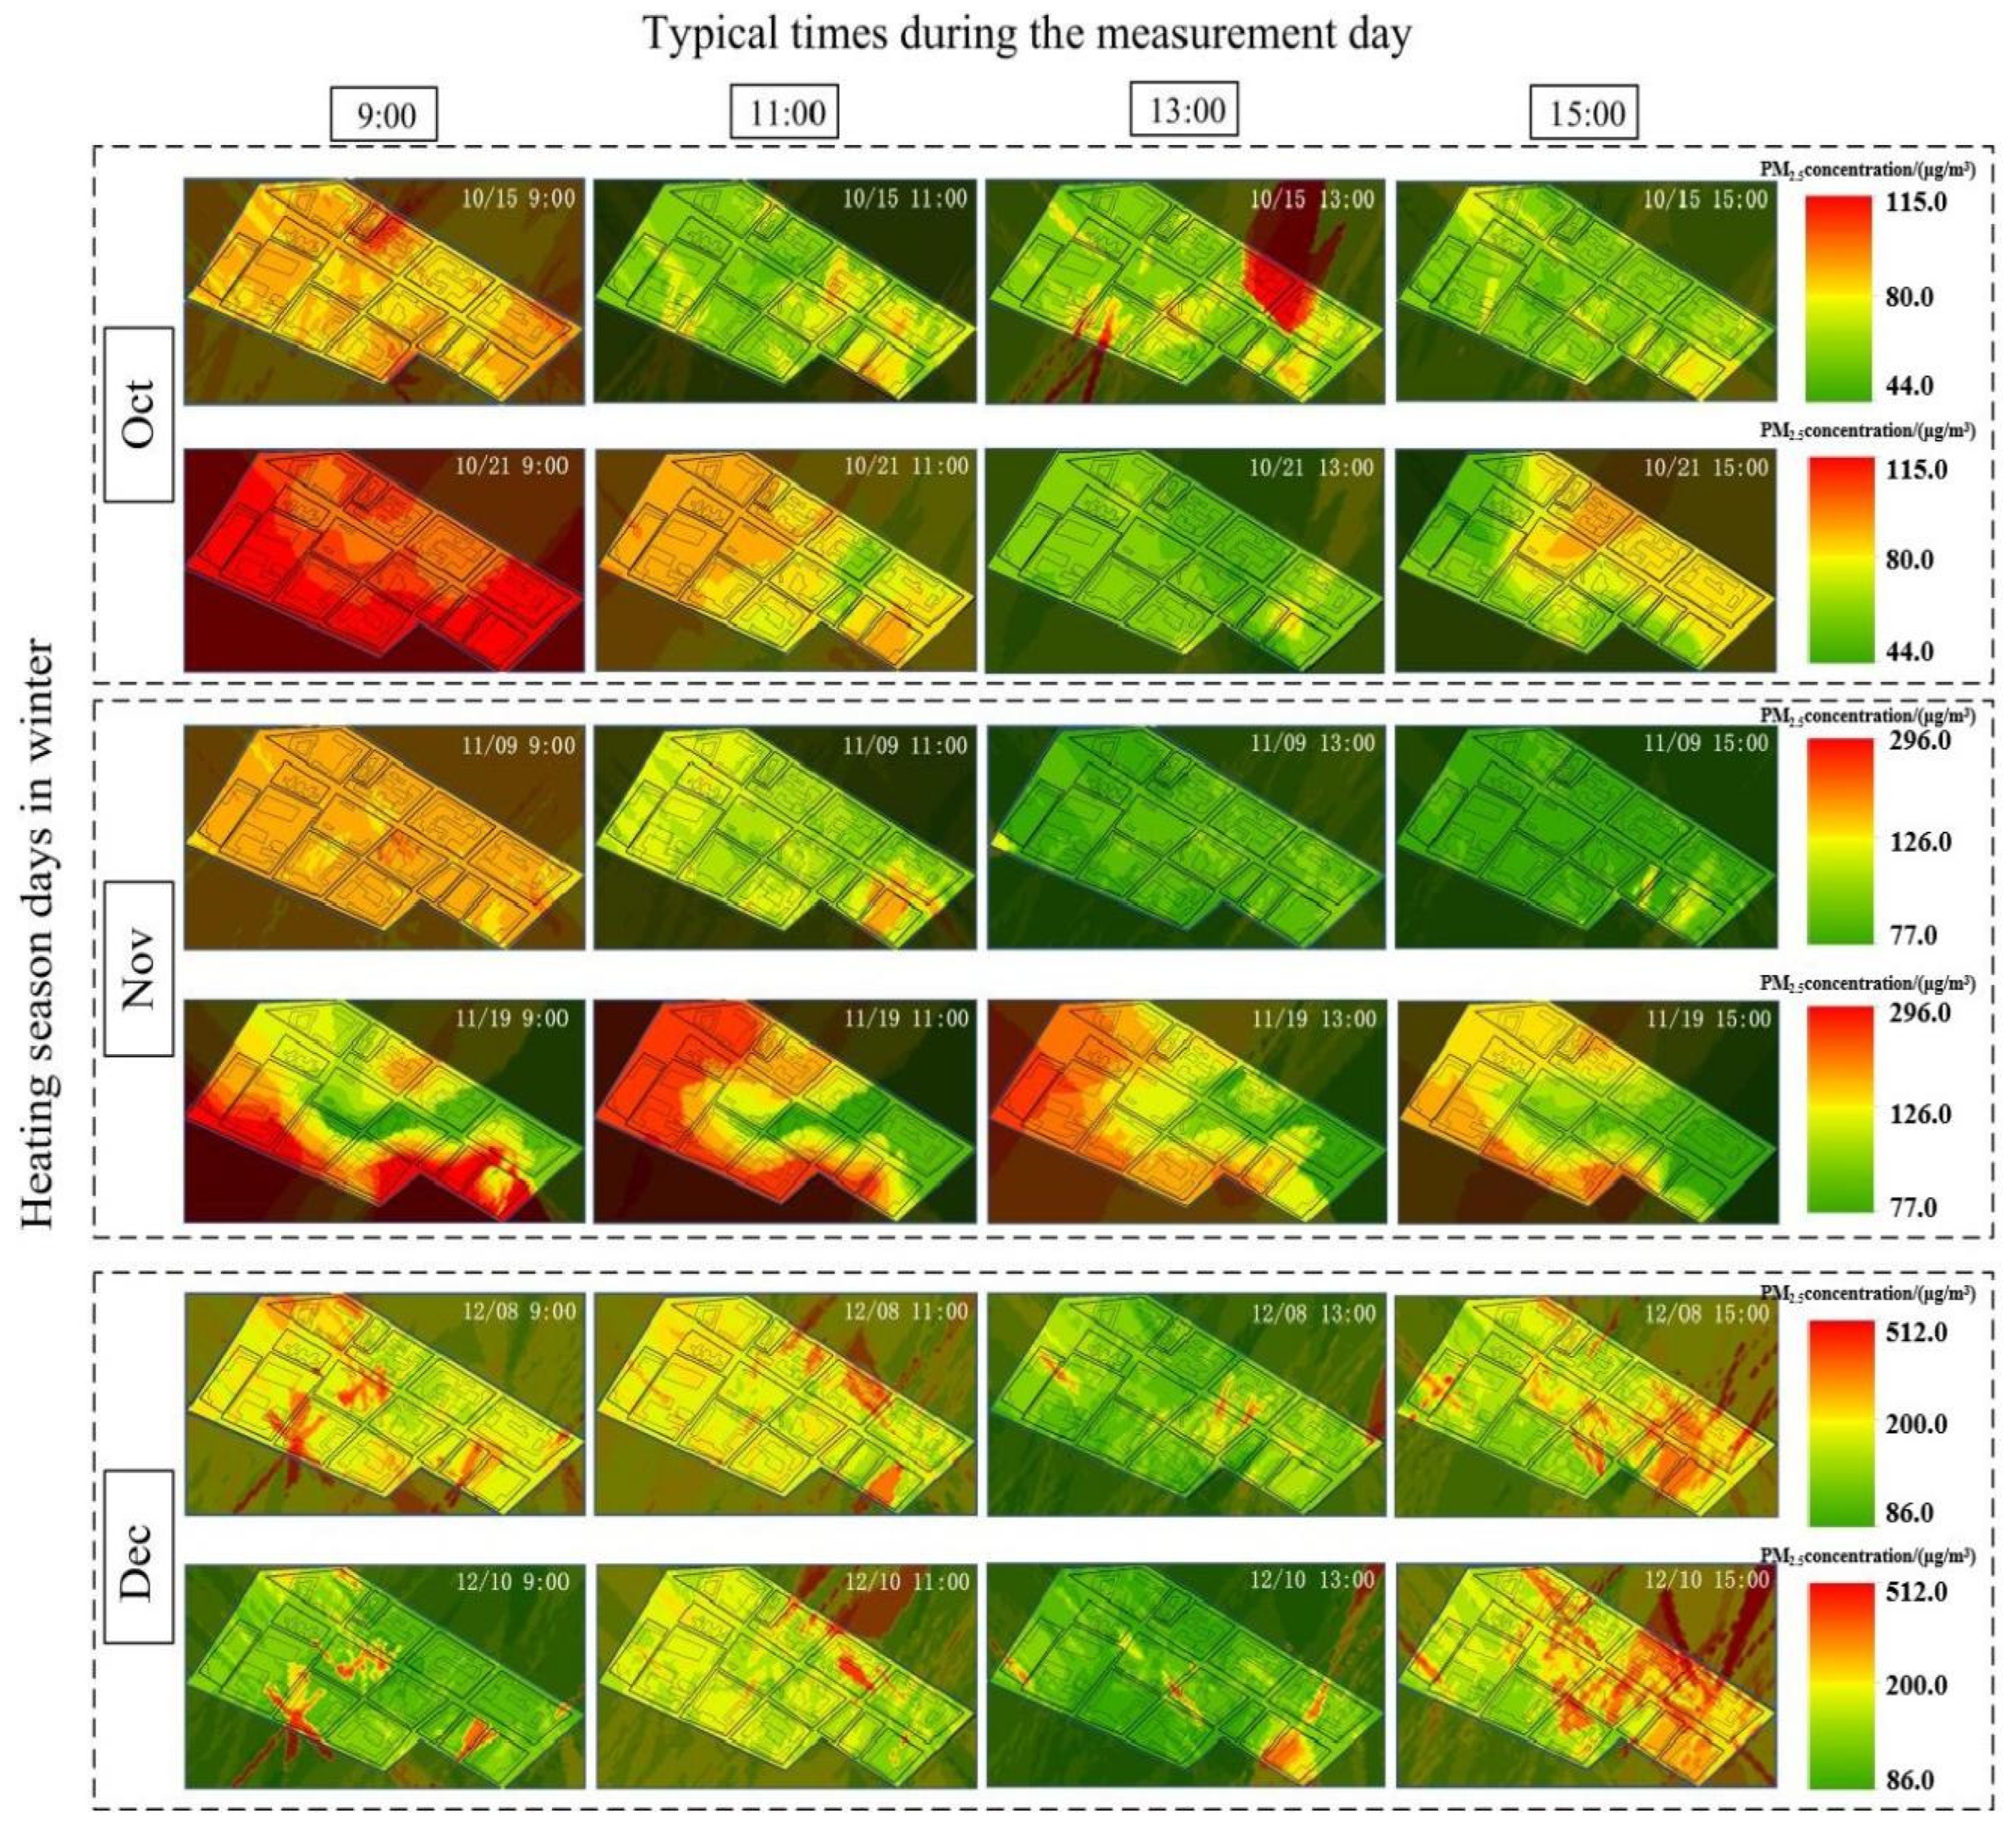
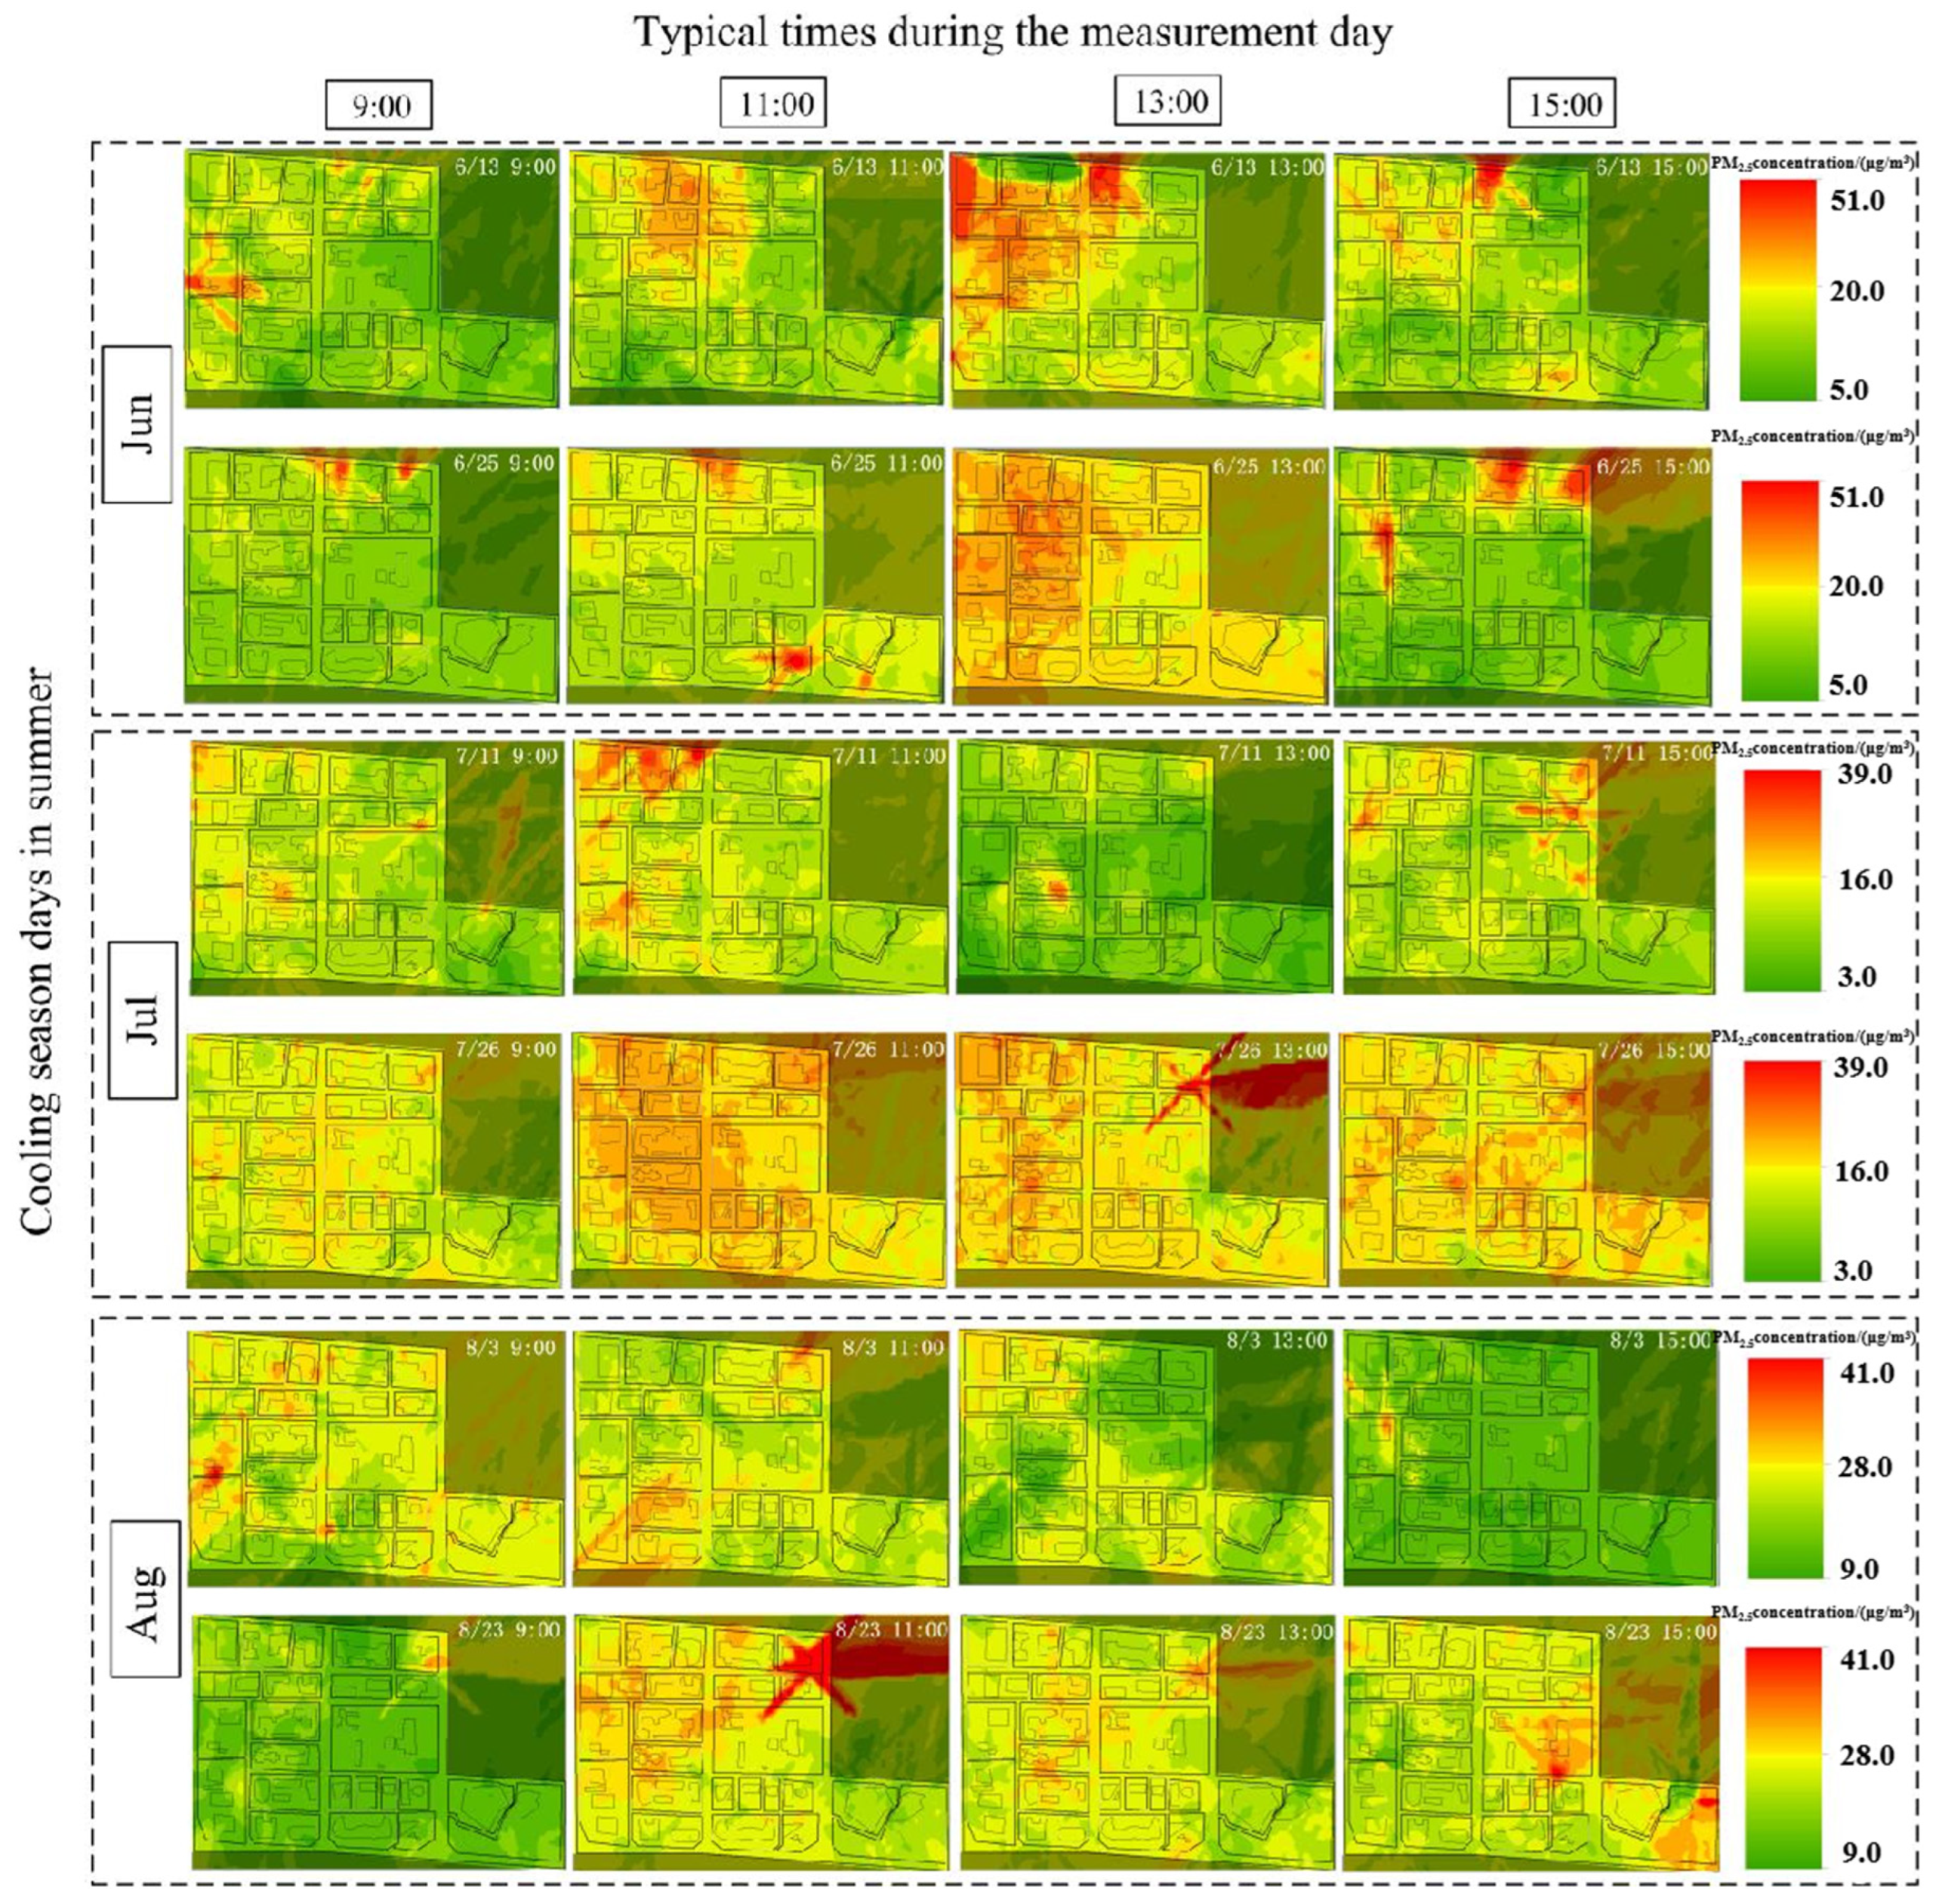
3.3. Spatiotemporal Characteristic Distributions of PM2.5 Concentration
4. Discussion
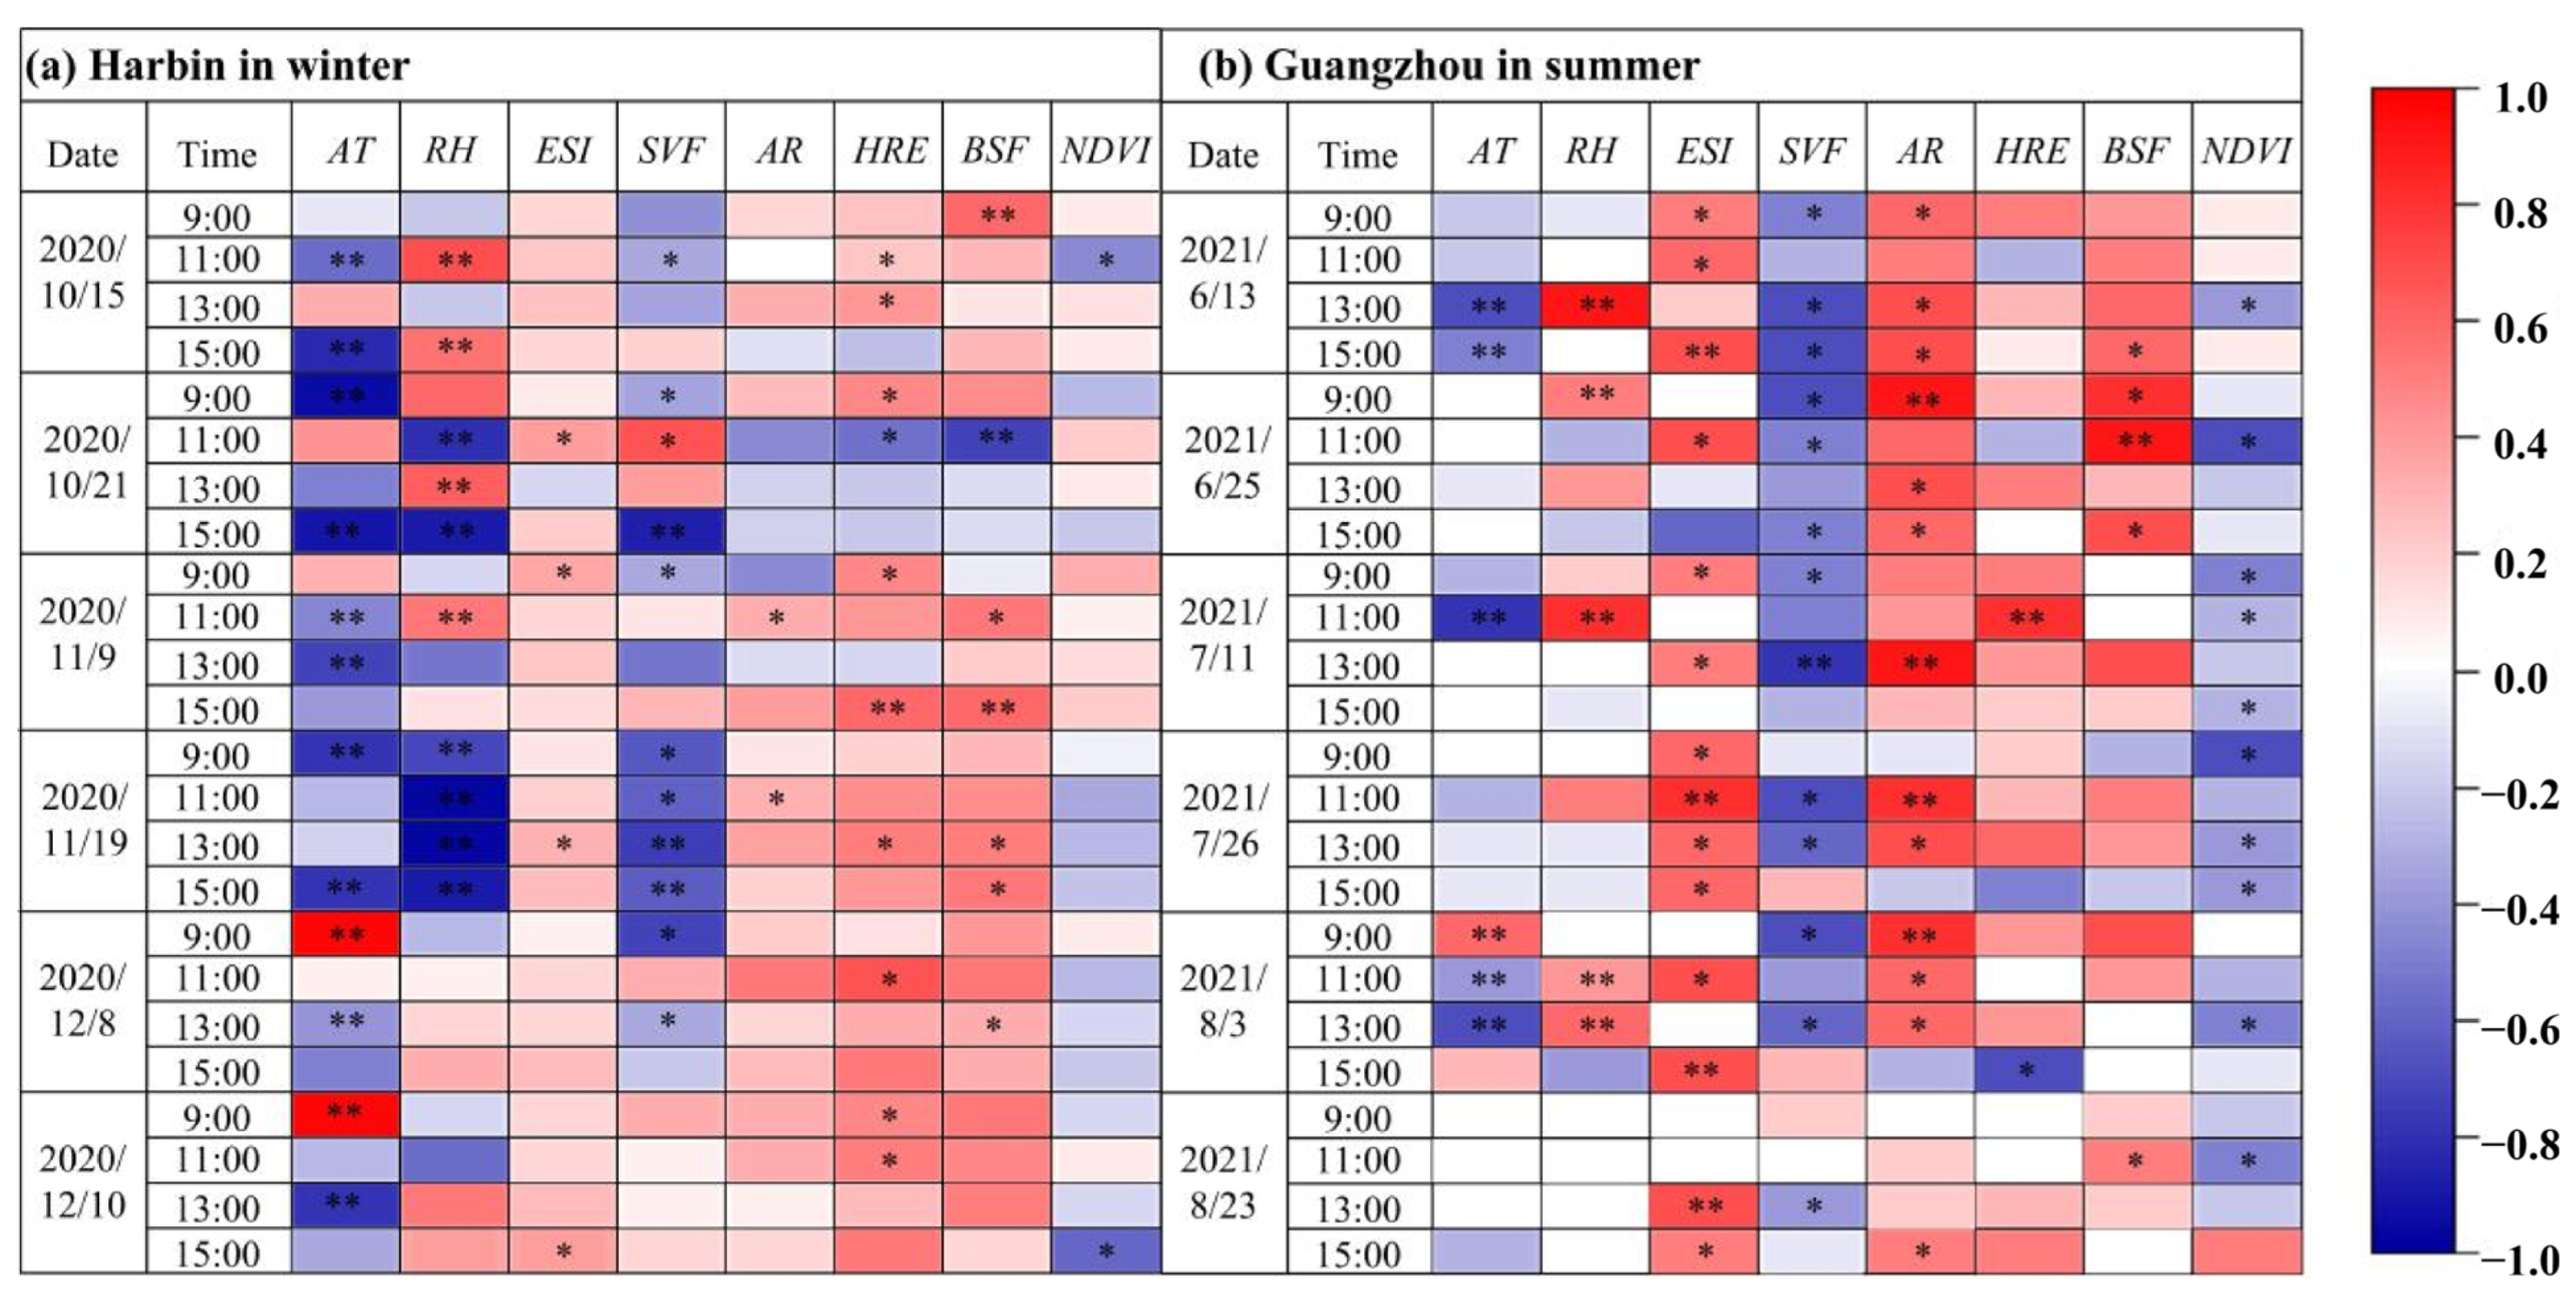
4.1. Comparative Analysis of Multiple Factors Influencing Near-Surface PM2.5 Concentration
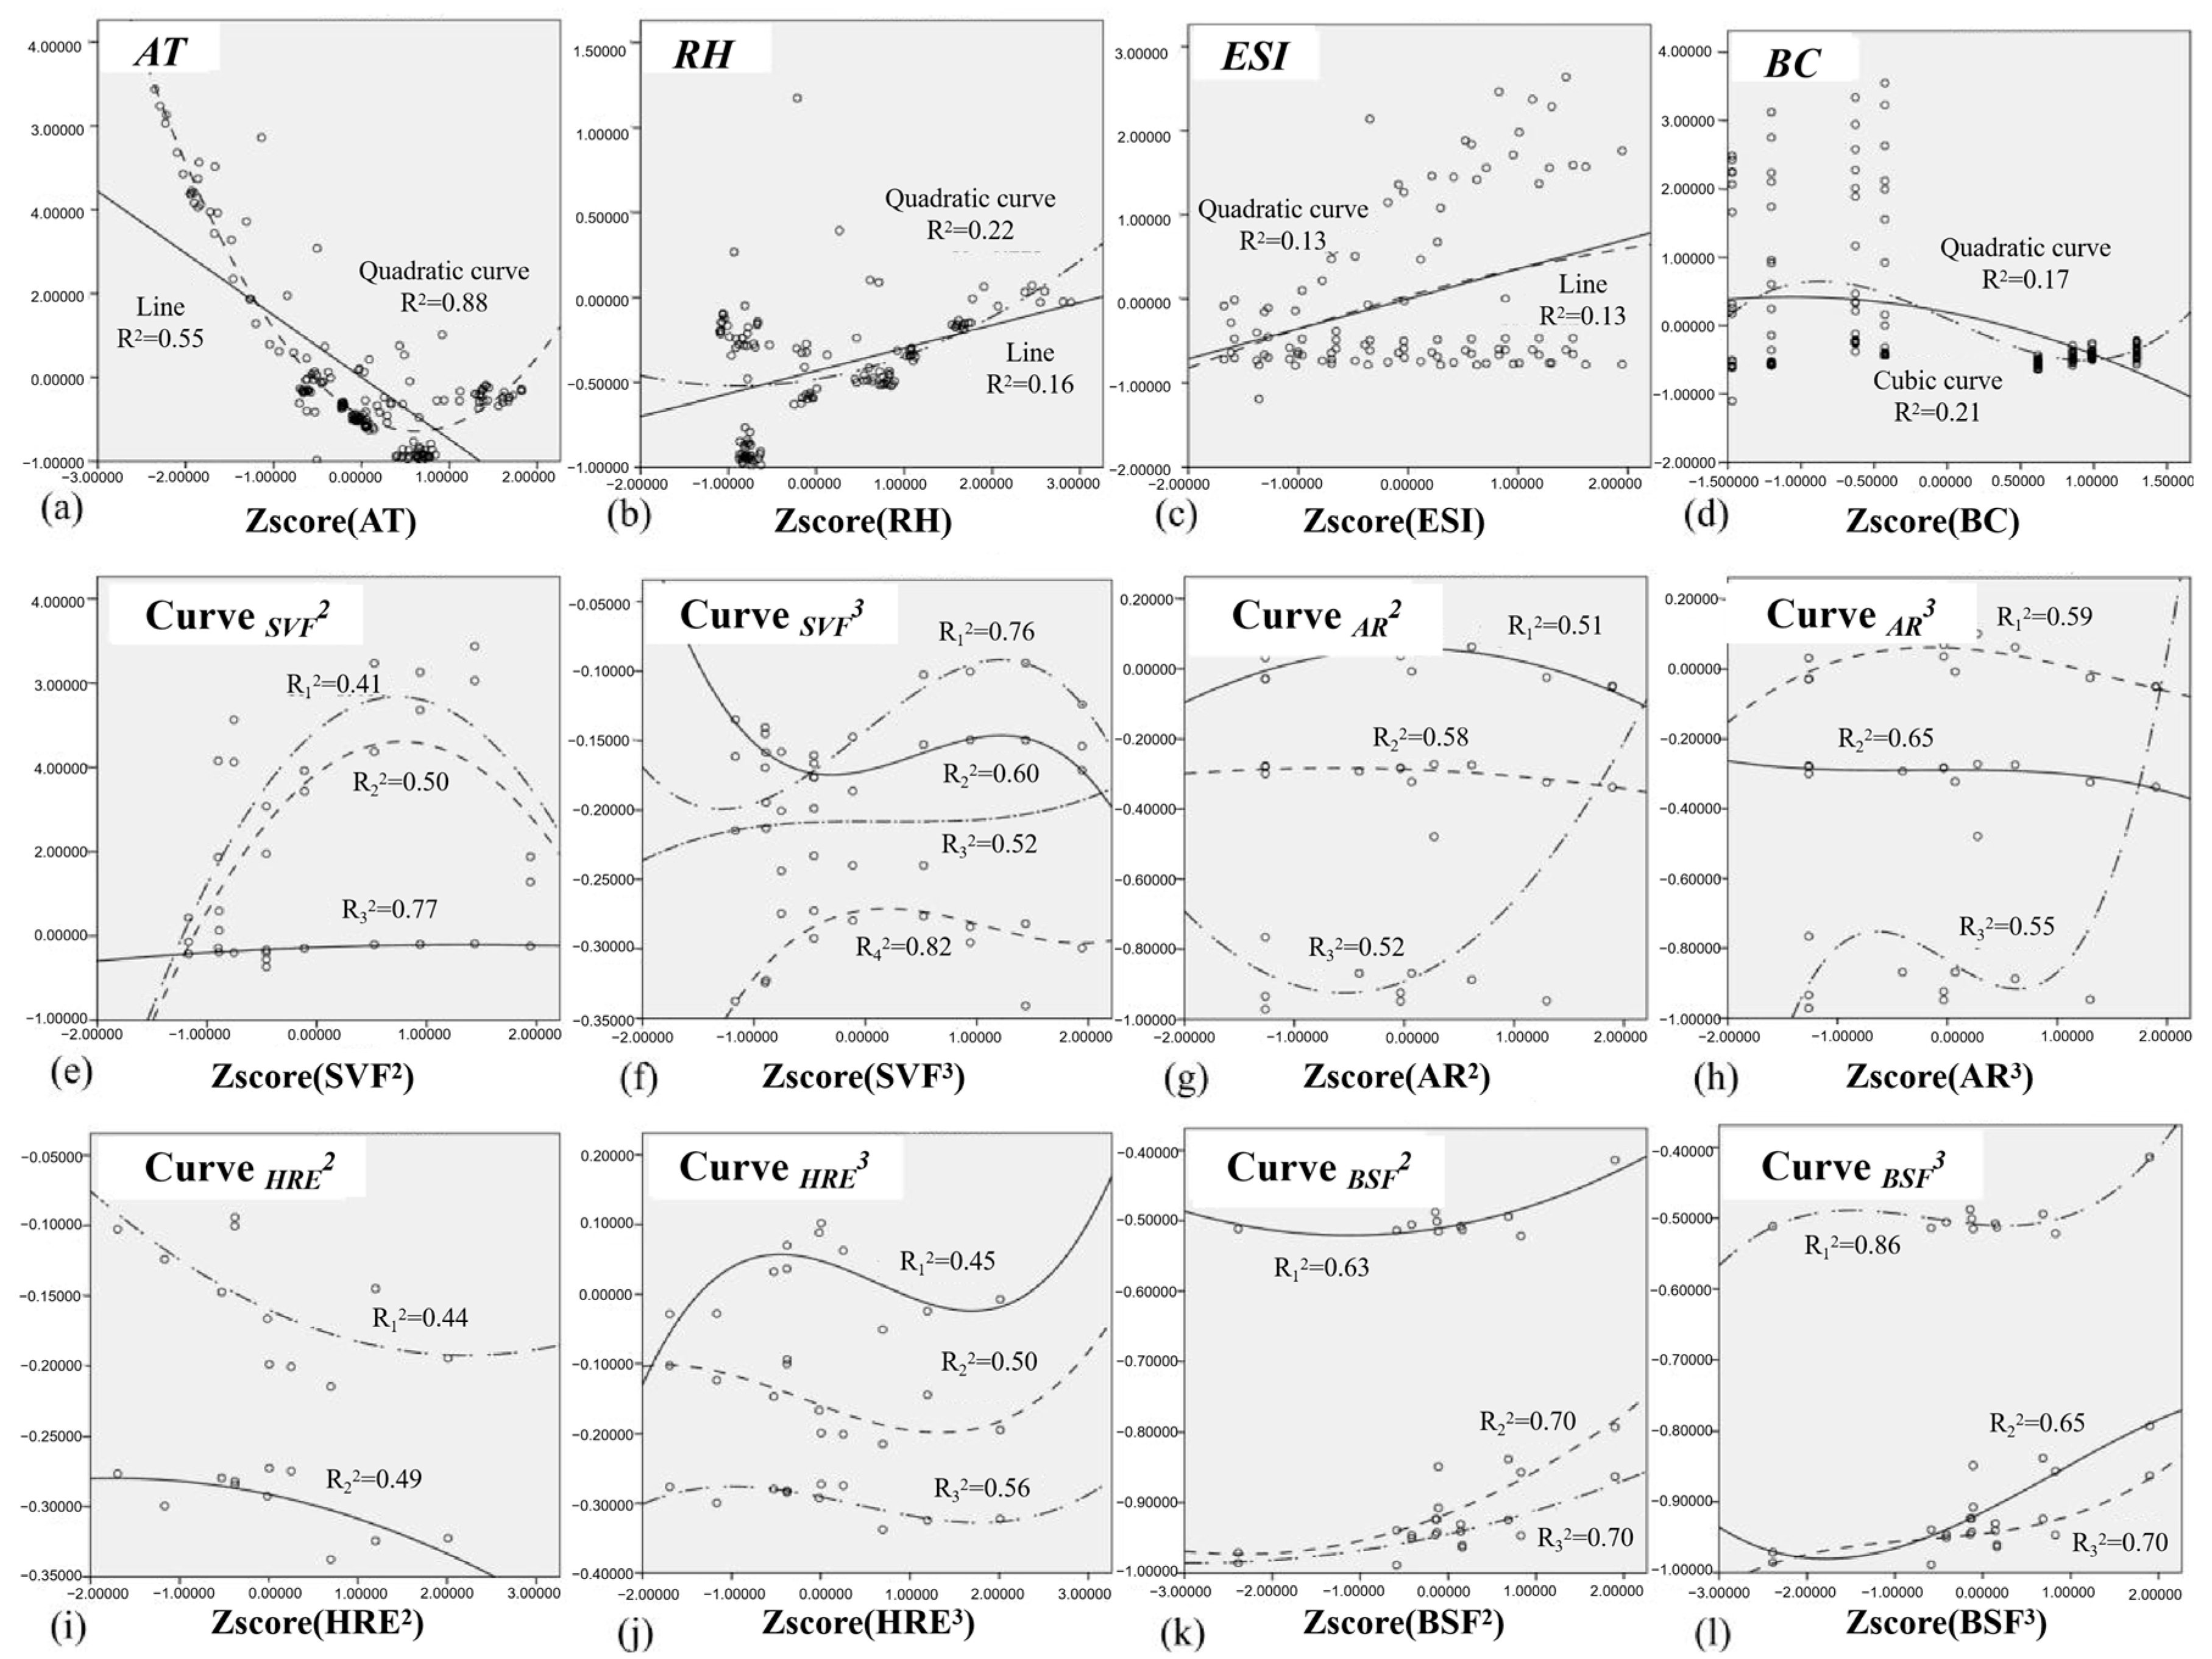
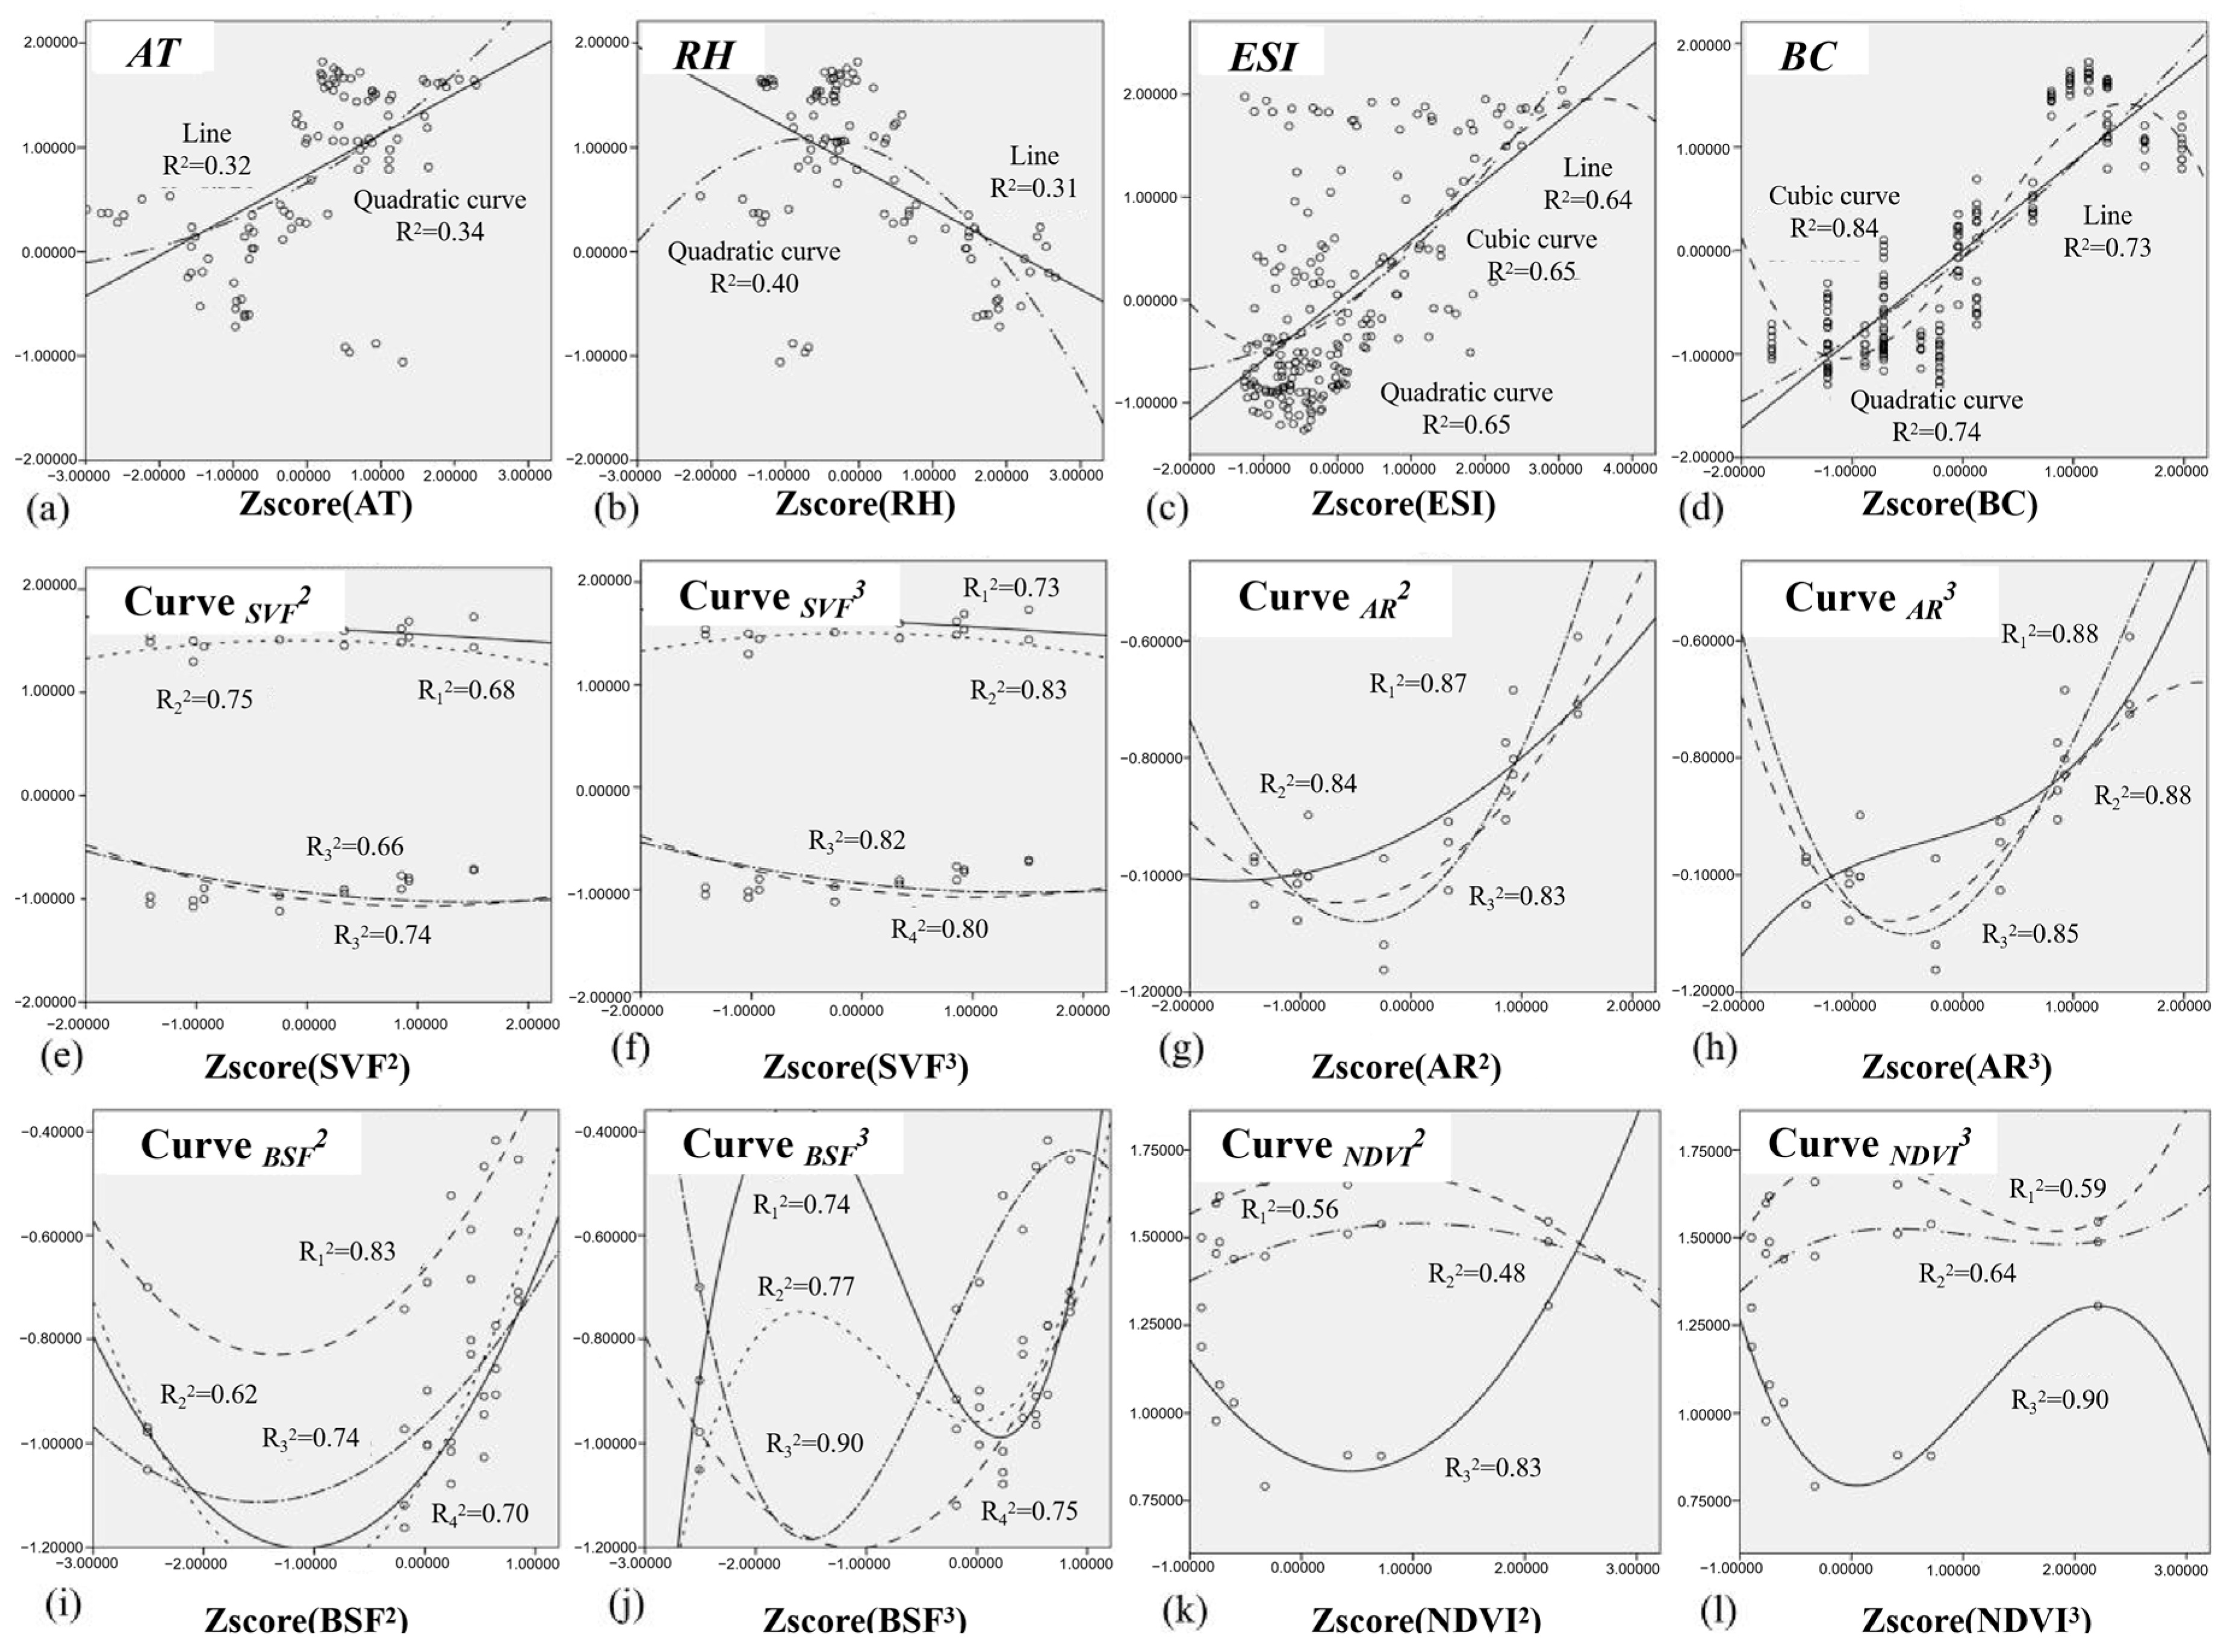
4.2. Curve Fitting
4.3. Optimization Strategy
- Optimization of urban morphology
- Optimization of vegetation pattern
- Regional climate environment adaptability
4.4. Limitations and Future Research
5. Conclusions
Author Contributions
Funding
Institutional Review Board Statement
Informed Consent Statement
Data Availability Statement
Conflicts of Interest
References
- Yan, S.; Cao, H.; Chen, Y.; Wu, C.; Hong, T.; Fan, H. Spatial and temporal characteristics of air quality and air pollutants in 2013 in Beijing. Environ. Sci. Pollut. Res. 2016, 23, 13996–14007. [Google Scholar] [CrossRef] [PubMed]
- Lin, Y.; Zou, J.; Yang, W.; Li, C.-Q. A Review of Recent Advances in Research on PM2.5 in China. Int. J. Environ. Res. Public Health 2018, 15, 438. [Google Scholar] [CrossRef] [PubMed]
- Luo, H.; Han, Y.; Lu, C.; Yang, J.; Wu, Y. Characteristics of Surface Solar Radiation under Different Air Pollution Conditions over Nanjing, China: Observation and Simulation. Adv. Atmos. Sci. 2019, 36, 1047–1059. [Google Scholar] [CrossRef]
- Kant, Y.; Mitra, D.; Chauhan, P. Space-based observations on the impact of COVID-19-induced lockdown on aerosols over India. Curr. Sci. 2020, 119, 539–544. [Google Scholar] [CrossRef]
- Zhang, S.; Routledge, M.N. The contribution of PM2.5 to cardiovascular disease in China. Environ. Sci. Pollut. Res. 2020, 27, 37502–37513. [Google Scholar] [CrossRef]
- Lin, H.; Long, Y.; Su, Y.; Song, K.; Li, C.; Ding, N. Air pollution and hospital admissions for critical illness in emergency department: A tertiary-center research in Changsha, China, 2016–2020. Environ. Sci. Pollut. Res. 2022, 29, 21440–21450. [Google Scholar] [CrossRef]
- Kim, H.-B.; Shim, J.-Y.; Park, B.; Lee, Y.-J. Long-Term Exposure to Air Pollutants and Cancer Mortality: A Meta-Analysis of Cohort Studies. Int. J. Environ. Res. Public Health 2018, 15, 2608. [Google Scholar] [CrossRef]
- Zhu, C.; Fu, Z.; Liu, L.; Shi, X.; Li, Y. Health risk assessment of PM2.5 on walking trips. Sci. Rep. 2021, 11, 19249. [Google Scholar] [CrossRef]
- Liu, S.; Lim, Y.H.; Pedersen, M.; Jørgensen, J.T.; Amini, H.; Cole-Hunter, T.; Methta, A.J.; So, R.; Mortensen, L.H.; Westendorp, R.G.J.; et al. Long-term exposure to ambient air pollution and road traffic noise and asthma incidence in adults: The Danish Nurse cohort. Environ. Int. 2021, 152, 106464. [Google Scholar] [CrossRef]
- Zahed, F.; Pardakhti, A.; Motlagh, M.S.; Mohammad Kari, B.; Tavakoli, A. Infiltration of outdoor PM2.5 and influencing factors. Air Qual. Atmos. Health 2022, 15, 2215–2230. [Google Scholar] [CrossRef]
- Chen, L.; Wang, H.; Wang, Z.; Dong, Z. Estimating the mortality attributable to indoor exposure to particulate matter of outdoor origin in mainland China. Sci. Total Environ. 2023, 872, 162286. [Google Scholar] [CrossRef] [PubMed]
- Zhang, X.; Bai, Z.; Fan, X.; Lu, Y.; Cao, Y.; Zhao, Z.; Sun, Q.; Pan, J. Urban Expansion Process, Pattern, and Land Use Response in an Urban Mining Composited Zone from 1986 to 2013. J. Urban Plan. Dev. 2016, 142, 4. [Google Scholar] [CrossRef]
- Huang, Q.; Liu, Y. The Coupling between Urban Expansion and Population Growth: An Analysis of Urban Agglomerations in China (2005–2020). Sustainability 2021, 13, 7250. [Google Scholar] [CrossRef]
- Krall, J.R.; Adibah, N.; Babin, L.M.; Lee, Y.C.; Motti, V.G.; McCombs, M.; McWilliams, A.; Thornburg, J.; Pollack, A.Z. Estimating exposure to traffic-related PM2.5 for women commuters using vehicle and personal monitoring. Environ. Res. 2020, 187, 109644. [Google Scholar] [CrossRef] [PubMed]
- Yang, Y.; Li, J.; Zhu, G.; Yuan, Q. Spatio–Temporal Relationship and Evolvement of Socioeconomic Factors and PM2.5 in China During 1998–2016. Int. J. Environ. Res. Public Health 2019, 16, 1149. [Google Scholar] [CrossRef]
- Zhang, H.; Wang, Z.; Zhang, W. Exploring spatiotemporal patterns of PM2.5 in China based on ground-level observations for 190 cities. Environ. Pollut. 2016, 216, 559–567. [Google Scholar] [CrossRef] [PubMed]
- Shith, S.; Yusof, N.F.F.M.; Ramli, N.A. Multivariate analysis on trace elements of fine particulate matter (PM2.5) in industrial and sub-urban area. Int. J. Integr. Eng. 2019, 11, 040–052. [Google Scholar] [CrossRef]
- Weaver, A.M.; Gurley, E.S.; Crabtree-Ide, C.; Salje, H.; Yoo, E.H.; Mu, L.; Akter, N.; Ram, P.K. Air pollution dispersion from biomass stoves to neighboring homes in Mirpur, Dhaka, Bangladesh. BMC Public Health 2019, 19, 425. [Google Scholar] [CrossRef] [PubMed]
- Jeong, C.H.; Wang, J.M.; Hilker, N.; Debosz, J.; Sofowote, U.; Su, Y.; Noble, M.; Healy, R.; Munoz, T.; Dabek-Zlotorzynska, E.; et al. Temporal and spatial variability of traffic-related PM2.5 sources: Comparison of exhaust and non-exhaust emissions. Atmos. Environ. 2019, 198, 55–69. [Google Scholar] [CrossRef]
- Askariyeh, M.H.; Venugopal, M.; Khreis, H.; Birt, A.; Zietsman, J. Near-road traffic-related air pollution: Resuspended PM2.5 from highways and arterials. Int. J. Environ. Res. Public Health 2020, 17, 2851. [Google Scholar] [CrossRef]
- Li, X.; Feng, Y.J.; Liang, H.Y. The Impact of Meteorological Factors on PM2.5 Variations in Hong Kong. IOP Conf. Ser. Earth Environ. Sci. 2017, 78, 012003. [Google Scholar] [CrossRef]
- Zhou, Y.; Zhang, D.; Zheng, L.; Shi, R.; Chen, M. The variation characteristics of PM2.5 in Shanghai and its correlation with meteorological factors. Remote Sens. Model. Ecosyst. Sustain. XV 2018, 10767, 181–187. [Google Scholar] [CrossRef]
- Danek, T.; Weglinska, E.; Zareba, M. The infuence of meteorological factors and terrain on air pollution concentration and migration: A geostatistical case study from Krakow. Poland. Sci. Rep. 2022, 12, 11050. [Google Scholar] [CrossRef]
- Zareba, M.; Dlugosz, H.; Danek, T.; Weglinska, E. Big-Data-Driven Machine Learning for Enhancing Spatiotemporal Air Pollution Pattern Analysis. Atmosphere 2023, 14, 760. [Google Scholar] [CrossRef]
- Tan, X.; Zhou, Z.; Wang, W. Relationships between urban form and PM2. 5 concentrations from the spatial pattern and process perspective. Build. Environ. 2023, 234, 110147. [Google Scholar] [CrossRef]
- Zhang, A.; Xia, C.; Li, W. Relationships between 3D urban form and ground-level fine particulate matter at street block level: Evidence from fifteen metropolises in China. Build. Environ. 2022, 211, 108745. [Google Scholar] [CrossRef]
- Stewart, I.D.; Oke, T.R.; Krayenhoff, E.S. Evaluation of the “local climate zone” scheme using temperature observations and model simulations. Int. J. Climatol. 2014, 34, 1062–1080. [Google Scholar] [CrossRef]
- Cai, M.; Ren, C.; Xu, Y.; Lau, K.K.L.; Wang, R. Investigating the relationship between local climate zone and land surface temperature using an improved WUDAPT methodology—A case study of Yangtze River Delta, China. Urban Clim. 2018, 24, 485–502. [Google Scholar] [CrossRef]
- Jin, L.; Pan, X.; Liu, L.; Liu, L.; Liu, J.; Gao, Y. Block-based local climate zone approach to urban climate maps using the UDC model. Build. Environ. 2020, 186, 107334. [Google Scholar] [CrossRef]
- Cheung, H.K.W.; Coles, D.; Levermore, G.J. Urban heat island analysis of Greater Manchester, UK using sky view factor analysis. Build. Serv. Eng. Res. Technol. 2016, 37, 5–17. [Google Scholar] [CrossRef]
- Xie, X.; Huang, Z. Impact of aspect ratio and surface heating on pollutant transport in street canyons. J. Mech. Sci. Technol. 2007, 21, 1781–1790. [Google Scholar] [CrossRef]
- Crago, R.D.; Okello, W.; Jasinski, M.F. Equations for the Drag Force and Aerodynamic Roughness Length of Urban Areas with Random Building Heights. Bound.-Layer Meteorol. 2012, 145, 423–437. [Google Scholar] [CrossRef]
- Liu, Y.; Mu, K.; Han, B.; Zhang, M.; Bao, J.; Yang, L. Surface urban heat island effect of local climate zone. Harbin Gongye Daxue Xuebao/J. Harbin Inst. Technol. 2021, 53, 192–200. [Google Scholar] [CrossRef]
- Bhuyan, U.; Zang, C.; Vicente-Serrano, S.M.; Menzel, A. Exploring Relationships among Tree-Ring Growth, Climate Variability, and Seasonal Leaf Activity on Varying Timescales and Spatial Resolutions. Remote Sens. 2017, 9, 526. [Google Scholar] [CrossRef]
- Liu, L.; Lin, Y.; Wang, D.; Liu, J. An improved temporal correction method for mobile measurement of outdoor thermal climates. Theor. Appl. Climatol. 2017, 129, 201–212. [Google Scholar] [CrossRef]
- He, H.; Zhu, Y.; Liu, L.; Du, J.; Liu, L.; Liu, J. Effects of roadside trees three-dimensional morphology characteristics on traffic-related PM2.5 distribution in hot-humid urban blocks. Urban Clim. 2023, 49, 101448. [Google Scholar] [CrossRef]
- Rzeszutek, M.; Bogacki, M.; Bździuch, P.; Szulecka, A. Improvement assessment of the OSPM model performance by considering the secondary road dust emissions. Transp. Res. Part D Transp. Environ. 2019, 68, 137–149. [Google Scholar] [CrossRef]
- Peng, K.; Yang, Y.; Zheng, J.; Yin, S.; Gao, Z.; Huang, X. Emission factor and inventory of paved road fugitive dust sources in the Pearl River Delta region. Huanjing Kexue Xuebao/Acta Sci. Circumstantiae 2013, 33, 2657–2663. [Google Scholar] [CrossRef]
- Liu, L.; Lin, Y.; Liu, J.; Wang, L.; Wang, D.; Shui, T.; Chen, X.; Wu, Q. Analysis of Local-Scale Urban Heat Island Characteristics Using an Integrated Method of Mobile Measurement and GIS-Based Spatial Interpolation. Build. Environ. 2017, 117, 191–207. [Google Scholar] [CrossRef]

| Direction | Authors (Years) | Key Observations and Techniques | Factors |
|---|---|---|---|
| Shith et al. (2019) [17] | Measurements of concentrations of PM2.5 and its constituents vary from place to place, depending on the source identification of PM2.5 by the hysplit model. | Industrial activities | |
| Weaver et al. (2019) [18] | Burning biomass in a house affected the air quality of the surrounding houses through home observations. | Biomass combustion | |
|
Sources of background PM2.5 concentration | Jeong et al. (2019) [19] | The contribution of traffic-generated PM2.5 sources may vary across location and time according to a comparison of source contributions between two near-road sites. | Exhaust emissions, brake wear, resuspension of road dust |
| Askariyeh et al. (2020) [20] | The environmental impacts of PM2.5 concentrations associated with traffic near roads were modeled by using regulatory guidelines. | Combustion, brake wear, tire wear, and resuspended dust | |
|
Climatic region diversity | Li et al. (2017) [21] | Meteorological factors influencing PM2.5 accumulation, dispersion, and transport were identified with correlation analysis. | Air temperature, pressure, rainfall, relative humidity, wind speed, and wind direction |
| Zhou et al. (2020) [22] | Seasonal differences of meteorological elements on PM2.5 were identified with correlation analysis. | Relative humidity, air temperature, wind and boundary layer height | |
|
Urban morphology heterogeneity | Danek et al. (2022) [23] | The sources of air pollution in cities were analyzed through a complex geostatistical approach for spatiotemporal analysis of particulate matter (PM) concentrations. | Topography, meteorological variables, |
| Zareba et al. (2023) [24] | Spatiotemporal patterns of air pollution were analyzed through unsupervised machine learning algorithms. | Weather conditions, traffic patterns, and industrial activity | |
| Tan et al. (2023) [25] | Correlation relationships between PM2.5 concentration and urban compactness were found through the density concentration function (DCF) model. | Urban compactness | |
| Zhang et al. (2022) [26] | The three-dimensional spatial index and multiple linear regression were used to analyze the relationship between three-dimensional urban form and PM2.5 concentration at street level using a satellite-derived surface dataset. | Street accessibility, road length, terrain, urban vegetation, surrounding open green space, and transportation facilities |
| Surface Factor | Methods Adopted | Calculation Method | Explanation |
|---|---|---|---|
| Sky view factor (SVF) | Photographs filmed by fish-eye camera | SVF = | Ssky is the visible sky area in a fish-eye photograph, m2. Stotal is the total circular area of a fish-eye photograph, m2. |
| Aspect ratio of street canyon (AR) | Data recording from field surveys | AR = | H is the height of the street canyon in the block, m. W is the width of the street canyon in the block, m. |
| Height of roughness elements (HRE) | HRE = | hi is the height of the building in the block, m. n is the number of buildings in the block. | |
| Building surface fraction (BSF) | Satellite imagery data from Google Earth | BSF = | Sb represents the outline area of the building base in the block, m. Stotal is expressed as the total area of the block. |
| Normalized difference vegetation index (NDVI) | NDVI = ((IR − R)/(IR + R)) | IR is the pixel value of the infrared band. R is the pixel value of red-light band. |
| Mobile Survey | Fixed Observation Site | ||||
|---|---|---|---|---|---|
| Instrument settings |  |  |  | 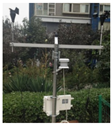 | 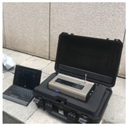 |
| GPS module (Intelligent Terminal A8) | Hand-held PM2.5 detector (GT-1000-B3) | Temperature and humidity recorder (HOBO U23-002) | Fixed weather station (HOBO U23-002) | Particulate matter detector (GRIMM) | |
| Monitoring data | Latitude and longitude | PM2.5 concentration | Air temperature and relative humidity | Air temperature and relative humidity | PM2.5 concentration |
| Test interval | 1 s | 1 min | |||
| Accuracy | Single point (2–5 m) | ±3% | ±0.18 °C for air temperature; ±2.5% for relative humidity | Full scale ±5% | |
| Near-Surface PM2.5 Concentration | No. | Fitted Equations Covering Different Variables | Goodness of Fit | |
|---|---|---|---|---|
| Residual Sum of δ2 | Adjusted R2 | |||
| PM2.5 concentration in Harbin winter | 1 | y(PM2.5) = f1 (AT, SVF) = Curve AT2 + Curve SVF3 | 23.80 | 0.89 |
| 2 | y(PM2.5) = f2 (AT, SVF, AR) = Curve AT2 + Curve SVF3 + Curve AR2 | 20.97 | 0.88 | |
| 3 | y(PM2.5) = f3 (AT, SVF, AR) = Curve AT2 + Curve SVF3 + Curve AR3 | 11.57 | 0.94 | |
| 4 | y(PM2.5) = f4 (AT, SVF, AR, HRE) = Curve AT2 + Curve SVF3 + Curve AR3 + Curve HRE3 | 11.10 | 0.94 | |
| 5 | y(PM2.5) = f5 (AT, SVF, AR, HRE, BSF) = Curve AT2 + Curve SVF3 + Curve AR3 + Curve HRE3 + Curve BSF3 | 10.65 | 0.96 | |
| PM2.5 concentration in Guangzhou summer | 1 | y(PM2.5) = g1 (ESI, BC) = Curve ESI3 + Curve BC3 | 30.55 | 0.82 |
| 2 | y(PM2.5) = g2 (ESI, BC, SVF) = Curve ESI3 + Curve BC3 + Curve SVF3 | 27.69 | 0.85 | |
| 3 | y(PM2.5) = g3 (ESI, BC, SVF, AR) = Curve ESI3 + Curve BC3 + Curve SVF3 + Curve AR2 | 22.54 | 0.88 | |
| 4 | y(PM2.5) = g4 (ESI, BC, SVF, AR) = Curve ESI3 + Curve BC3 + Curve SVF3 + Curve AR3 | 22.54 | 0.88 | |
| 5 | y(PM2.5) = g5 (ESI, BC, SVF, AR, NDVI) = Curve ESI3 + Curve BC3 + Curve SVF3 + Curve AR3 + Curve NDVI2 | 14.75 | 0.93 | |
| 6 | y(PM2.5) = g6 (ESI, BC, SVF, AR, NDVI) = Curve ESI3 + Curve BC3 + Curve SVF3 + Curve AR3 + Curve NDVI3 | 14.75 | 0.93 | |
| 7 | y(PM2.5) = g7 (ESI, BC, SVF, AR, NDVI, BSF) = Curve ESI3 + Curve BC3 + Curve SVF3 + Curve AR3 + Curve NDVI3 + Curve BSF2 | 23.65 | 0.87 | |
| 8 | y(PM2.5) = g8 (ESI, BC, SVF, AR, NDVI, BSF) = Curve ESI3 + Curve BC3 + Curve SVF3 + Curve AR3 + Curve NDVI3 + Curve BSF3 | 23.65 | 0.87 | |
Disclaimer/Publisher’s Note: The statements, opinions and data contained in all publications are solely those of the individual author(s) and contributor(s) and not of MDPI and/or the editor(s). MDPI and/or the editor(s) disclaim responsibility for any injury to people or property resulting from any ideas, methods, instructions or products referred to in the content. |
© 2023 by the authors. Licensee MDPI, Basel, Switzerland. This article is an open access article distributed under the terms and conditions of the Creative Commons Attribution (CC BY) license (https://creativecommons.org/licenses/by/4.0/).
Share and Cite
Liu, L.; He, H.; Zhu, Y.; Liu, J.; Wu, J.; Tan, Z.; Xie, H. Spatiotemporal Distribution Characteristics and Multi-Factor Analysis of Near-Surface PM2.5 Concentration in Local-Scale Urban Areas. Atmosphere 2023, 14, 1583. https://doi.org/10.3390/atmos14101583
Liu L, He H, Zhu Y, Liu J, Wu J, Tan Z, Xie H. Spatiotemporal Distribution Characteristics and Multi-Factor Analysis of Near-Surface PM2.5 Concentration in Local-Scale Urban Areas. Atmosphere. 2023; 14(10):1583. https://doi.org/10.3390/atmos14101583
Chicago/Turabian StyleLiu, Lin, Huiyu He, Yushuang Zhu, Jing Liu, Jiani Wu, Zhuang Tan, and Hui Xie. 2023. "Spatiotemporal Distribution Characteristics and Multi-Factor Analysis of Near-Surface PM2.5 Concentration in Local-Scale Urban Areas" Atmosphere 14, no. 10: 1583. https://doi.org/10.3390/atmos14101583
APA StyleLiu, L., He, H., Zhu, Y., Liu, J., Wu, J., Tan, Z., & Xie, H. (2023). Spatiotemporal Distribution Characteristics and Multi-Factor Analysis of Near-Surface PM2.5 Concentration in Local-Scale Urban Areas. Atmosphere, 14(10), 1583. https://doi.org/10.3390/atmos14101583