Article

Study on the Optical–Physical Properties of Aerosol Layers in Africa Based on a Laser Satellite

1
Academy of Remote Sensing Technology and Application, Nanyang Normal University, Wolong Road No. 1638, Nanyang 473061, China
2
Key Laboratory of Natural Disaster and Remote Sensing of Henan Province, Nanyang Normal University, Wolong Road No. 1638, Nanyang 473061, China
3
Engineering Research Center of Environmental Laser Remote Sensing Technology and Application of Henan Province, Nanyang Normal University, Wolong Road No. 1638, Nanyang 473061, China
4
International Joint Laboratory of Watershed Ecological Security and Collaborative Innovation Center of Water Security for Water Source Region of Middle Route Project of South-North Water Diversion in Henan Province, College of Agricultural Engineering, Nanyang Normal University, Nanyang 473061, China
5
Ecological Complexity and Modelling Laboratory, Department of Botany and Plant Sciences, University of California, Riverside, CA 92521-0124, USA
6
School of Electronic Information, Wuhan University, Wuhan 430072, China
*
Author to whom correspondence should be addressed.
These authors contributed equally to this work.
Atmosphere 2023, 14(10), 1524; https://doi.org/10.3390/atmos14101524
Submission received: 21 August 2023 / Revised: 18 September 2023 / Accepted: 28 September 2023 / Published: 30 September 2023
(This article belongs to the Special Issue Natural Sources Aerosol Remote Monitoring)

Abstract

:
Atmospheric aerosols have important effects on the environment and human health. In this study, we analyzed the atmospheric aerosol layers’ optical and physical properties over Africa utilizing CALIPSO level 2 products from 2007 to 2019. Interannual and seasonal variations in aerosol optical parameters were studied: the lowest aerosol layer (AODL), the base height of the lowest aerosol layer (BL), the top height of the lowest aerosol layer (HL), the top height of the highest aerosol layer (HH), the volumetric depolarization ratio of the lowest aerosol layer (DRL), the color ratio of the lowest aerosol layer (CRL), the total AOD of all aerosol layers (AODT), the number of aerosol feature layers (N), the thickness of the lowest aerosol layer (TL), and the AOD proportion of the lowest aerosol layer (PAODL). The annual mean AODT was slightly higher in southern Africa than in northern Africa. HL and HH had strongly positive correlations with landform elevations. However, HL and HH were greater in northern Africa than in southern Africa from March to August. The reason could be that northern Africa is dominated by deserts with high temperatures and intense atmospheric vertical convections leading to dust layers existing in the upper air. PAODL values were lower in northern Africa (daytime: 71%; nighttime: 61%) than in southern Africa (daytime: 78%; nighttime: 69%), revealing that aerosol stratifications were more frequent in northern Africa than in southern Africa. DRL values were higher in northern Africa (daytime: 0.16; nighttime: 0.11) than in southern Africa (daytime: 0.07; nighttime: 0.05) indicating the predominance of non-spherical dust particles in northern Africa. This work can provide an important understanding of regional aerosol layers’ optical and physical properties to scientists and local environmental protection agencies.

1. Introduction

Atmospheric aerosols are liquid or solid particulate matter (PM) suspended in the atmosphere, with a diameter of 0.001–100 μm [1,2]. Aerosols have important effects on the atmospheric energy balance, environment, air quality, climate dynamics, and human life [3,4,5,6]. Therefore, effective monitoring of atmospheric aerosols can help provide an important understanding of aerosol optical and physical characteristics, aerosol radiative forcings, and aerosol air pollution control [7,8,9].
The optical properties of aerosols are mainly obtained through ground-based measurements and satellite observations [10,11,12,13]. Ground-based measurements are mainly conducted through sun photometer networks, such as the Aerosol Robotic Network (AERONET), which can provide global aerosol observations [14,15,16]. Meanwhile, satellites can achieve large-area observations of aerosols all over the world; for instance, the Moderate Resolution Imaging Spectroradiometer (MODIS) [17,18], Multi-angle Imaging Spectroradiometer (MISR) [19,20], and Visible Infrared Imaging Radiometer Suite (VIIRS) [21] have been used for long-term continuous detection of aerosol optical depth (AOD) globally. To better understand the optical and physical characteristics of aerosols and clouds, aerosol and cloud layers’ vertical distribution information has been explored based on lidar [22,23,24]. Lidar satellites like CALIPSO (Cloud–Aerosol Lidar and Infrared Pathfinder Satellite Observations) have been widely used in the scientific observation of aerosol and cloud layers around the world [25,26,27]. CALIOP (Cloud–Aerosol Lidar with Orthogonal Polarization) was an important dual-wavelength polarization lidar payload on CALIPSO, which had the unique advantage of obtaining the vertical structure of aerosol and cloud optical–physical properties, such as atmospheric optical depth (AOD), aerosol layer location information, and aerosol shape and size information [28,29,30].
Africa is an important dust source region in the world, which has a significant impact on the regional and global radiation budget, climate system, and sea–land–air coupling [31]. The level of industrialization and agricultural modernization in Africa is still relatively backward with a low technological level [32]. Air pollution and environmental problems need to be studied and discussed in depth in Africa. Previous studies mainly focused on seasonal air pollution caused by savannah fires in southern Africa [33,34]. Prospero and Lamb studied the regional climate effects of dust aerosols in African arid regions and the Caribbean [35]. However, there are few studies on the vertical distributions of aerosol layers’ optical and physical properties over the whole of Africa at present. And interannual and seasonal variations in aerosol layers’ optical and physical properties also need to be further explored, which can deepen our understanding and recognition of the aerosol climate effect in Africa. Based on this background, this paper utilized CALIPSO satellite products to study spatial–temporal distribution characteristics, seasonal variation, and inter-annual variation characteristics of atmospheric aerosol layers in Africa. The natural and human causes (pollutant emission, meteorological conditions, etc.), and correlations between important optical–physical parameters were also studied in Africa. This study can provide new understandings and ideas for studies on the aerosol climate effect and environmental impact in Africa and neighboring areas, and can also provide scientific and technical support for local relevant departments to carry out environmental protection activities. The research method is discussed in Section 2. The results and discussion are provided in Section 3 and a simple conclusion is provided in Section 4.

2. Methodology

2.1. Study Area

Figure 1 shows the landform of Africa. Africa is a continent spanning the equator, located between the northern and southern hemispheres. It is surrounded by the Atlantic and Indian Oceans, and the Mediterranean Sea [36]. Its total area is 30,370,000 km2 [32]. The African population is unevenly distributed; the southern and eastern regions are relatively densely populated, while most of the areas north of the Sahara are more sparsely populated [37]. The African coastline is extremely long, and the southern and eastern coastlines are more rugged, while the northern and western coastlines are flatter. Southern and eastern Africa are dominated by mountains and plateaus, while the western and northern parts are dominated by deserts and plateaus (Sahara Desert and Atlas Mountains) [38]. Southern Africa has wet summers and dry winters, while the northern and western regions are dominated by desert landscapes. The average temperature in southern Africa is usually between 20 and 30 °C. The climate in northern Africa is milder along the Mediterranean coast, where the annual average temperature is about 20–22 °C. The climate is hotter in desert regions, and the maximum temperature in summer can reach about 50 °C. Due to the geographical location of Africa, its climate types are diverse, including savanna, tropical desert, and tropical rainforest climates [39,40,41].

2.2. Materials and Methods

CALIPSO (Cloud–Aerosol Lidar and Infrared Pathfinder Satellite Observations) was jointly developed by NASA and the French Central Institute of Aerodynamics [29]. It was launched on April 28, 2006. CALIOP has a revisit cycle of 16 days. The satellite is equipped with CALIOP (cloud and atmosphere lidar altimeter), IIR (infrared imager), and WFC (wide-field camera). The CALIOP lidar can provide a three-channel echo dataset: 532 nm vertical polarization, 532 nm horizontal polarization, and 1064 nm. CALIOP can detect information on the layer location, thickness, optical density, and type of cloud and aerosol layers [28]. The dataset used in this study was level 2, where the horizontal resolution of the data used was 5 km [25,42]. The aerosol optical–physical parameters utilized in this paper are shown in Table 1.
AODL, HL, BL, HH, DRL, CRL, and N can be obtained directly from level 2 products, while AODT, TL, and PAODL should be computed indirectly using the following equations:
AOD T = 1 N AOD N ; N = 1 , 2 , 7 , 8
T N = H N B N
PAOD N = AOD N AOD T × 100 %
where N = 1 represents the lowest aerosol layer; N = 8 represents the highest aerosol layer, i.e.,:
AOD L = AOD 1
T L = T 1
BL = B1
HL = H1
DRL = DR1
CRL = CR1
PAOD L = PAOD 1
Based on the geographical location of Africa, we divided Africa into two regions ((A) northern plains and desert regions and (B) southern highlands regions). The dataset used in this study was the 532 nm band. The annual and seasonal variability in aerosol variables over these two regions was calculated from 2007 to 2019, and correlations of important optical–physical parameters (AODL, N, HH, TL, and PAODL) were also discussed. Seasons were defined as March–May (MAM), June–August (JJA), September–November (SON), and December–February (DJF) in this study.

3. Results and Discussion

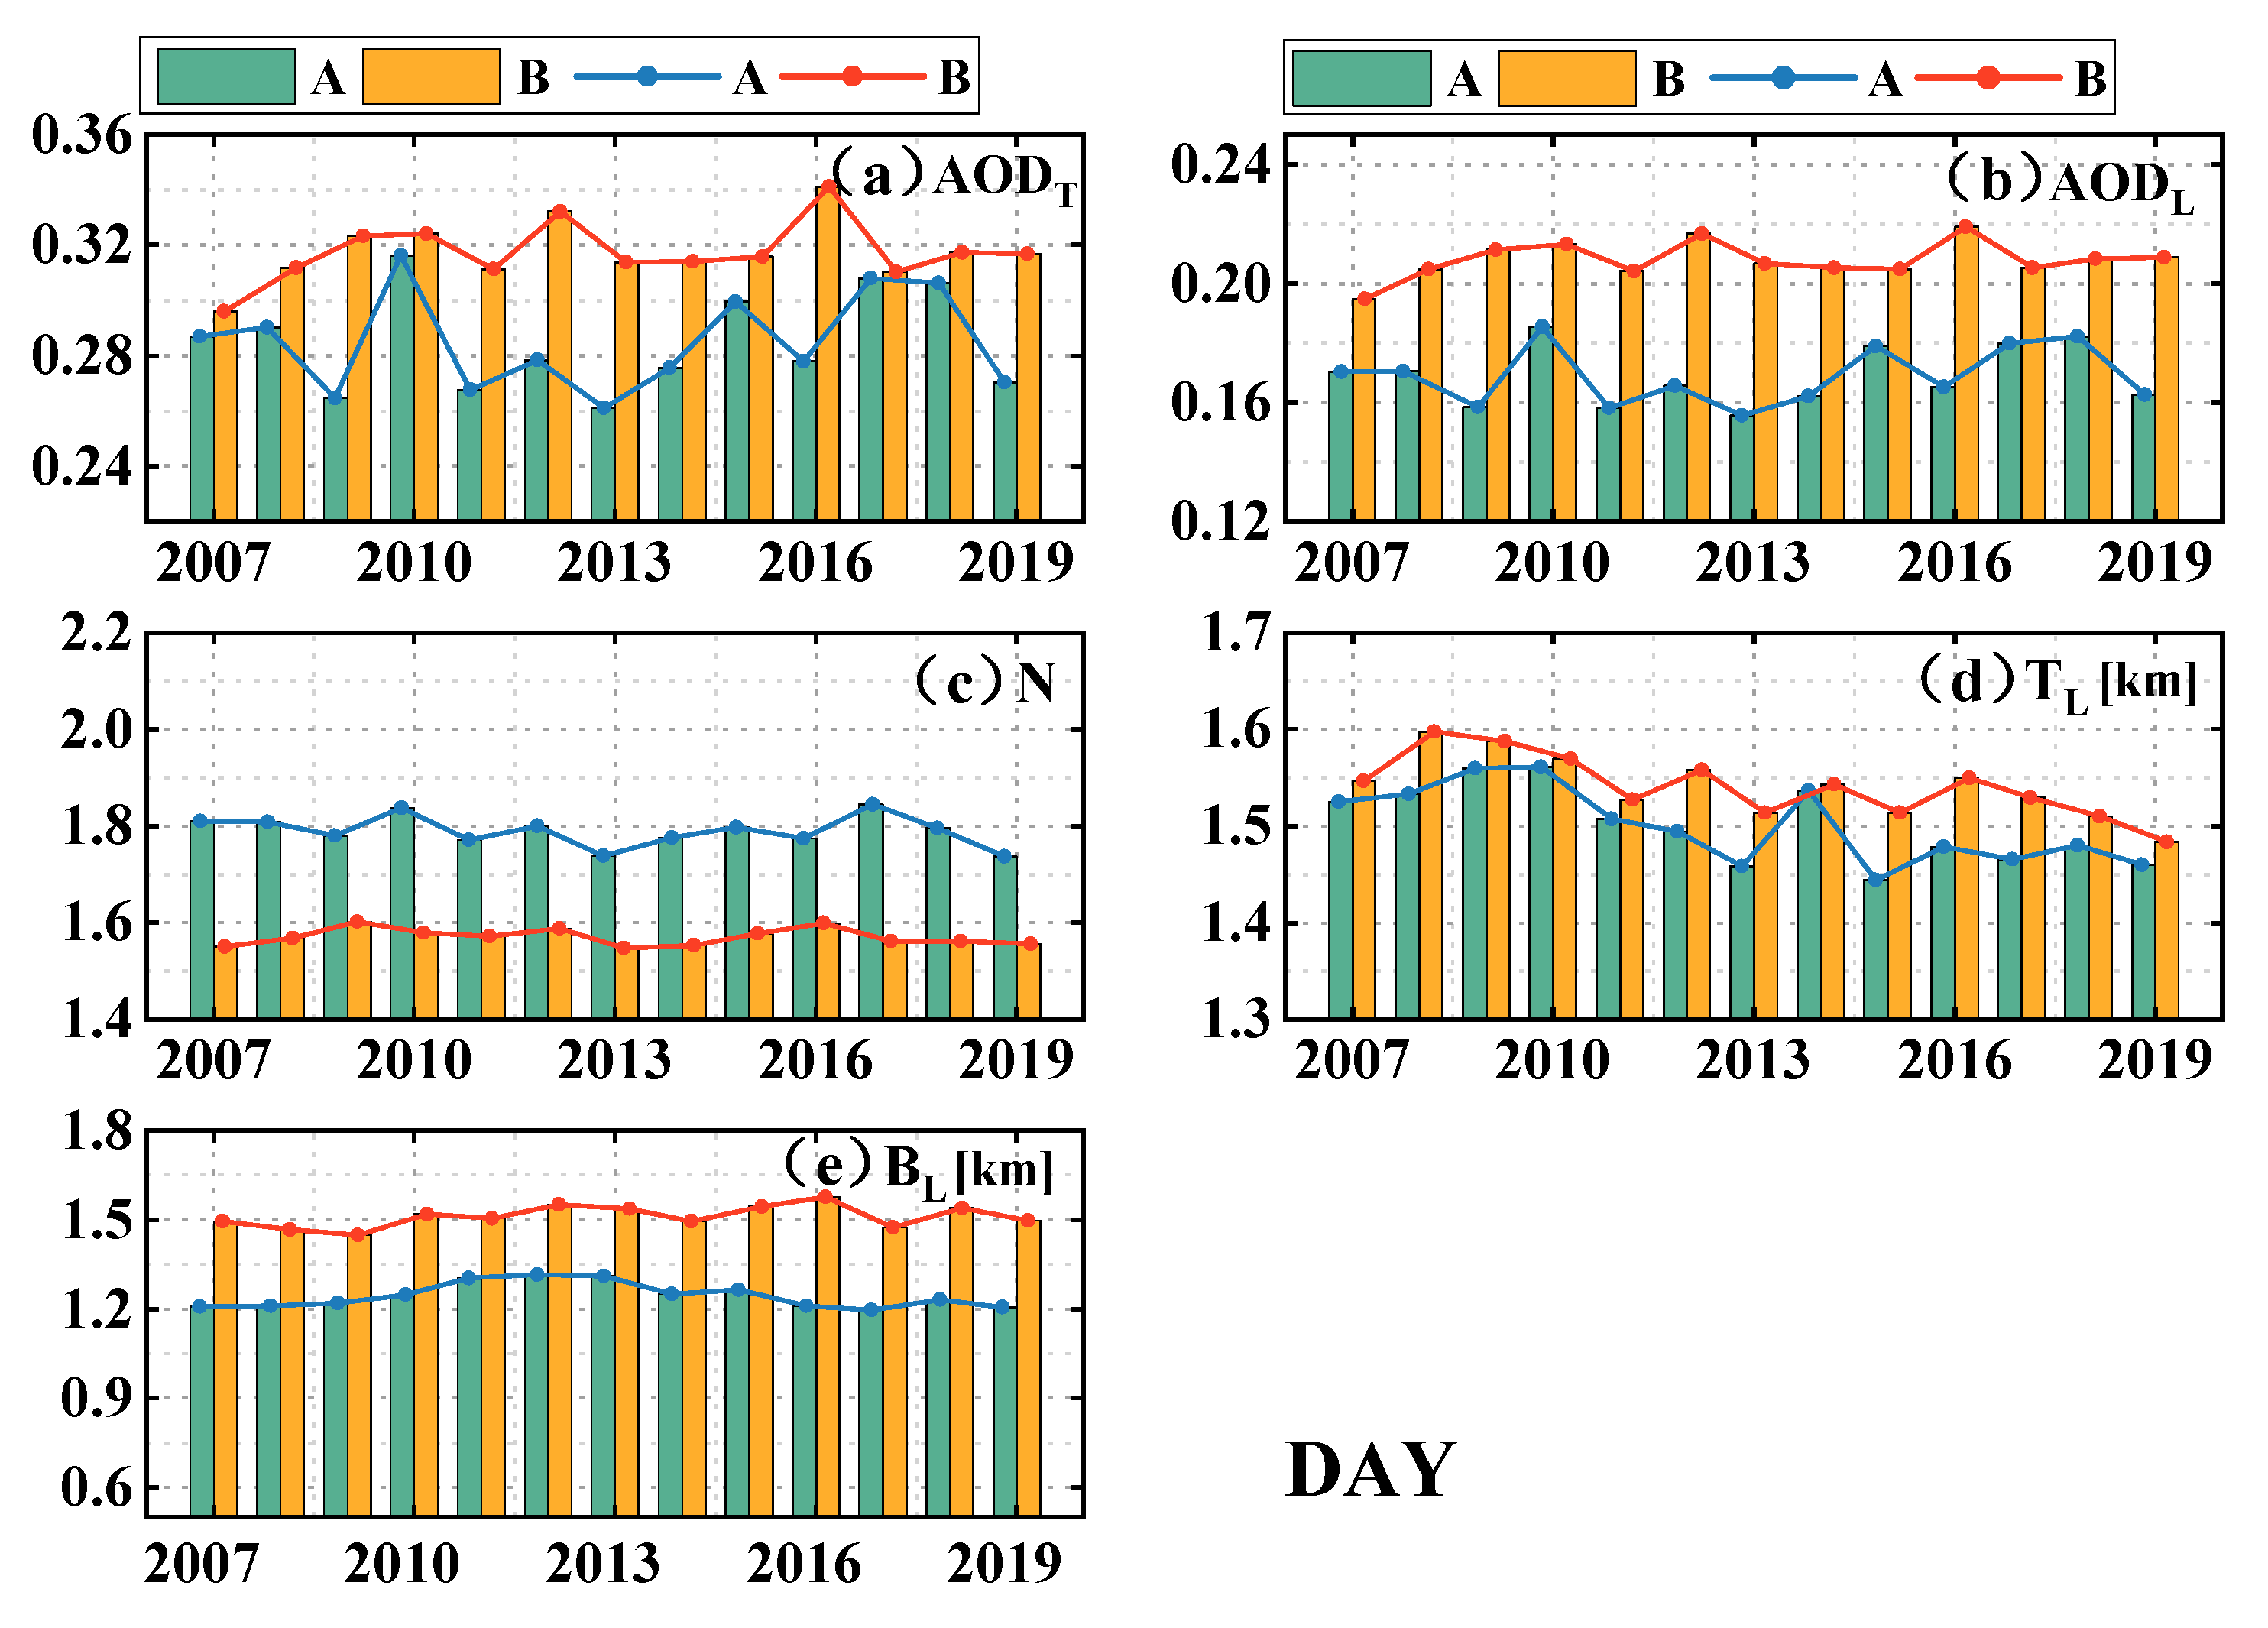
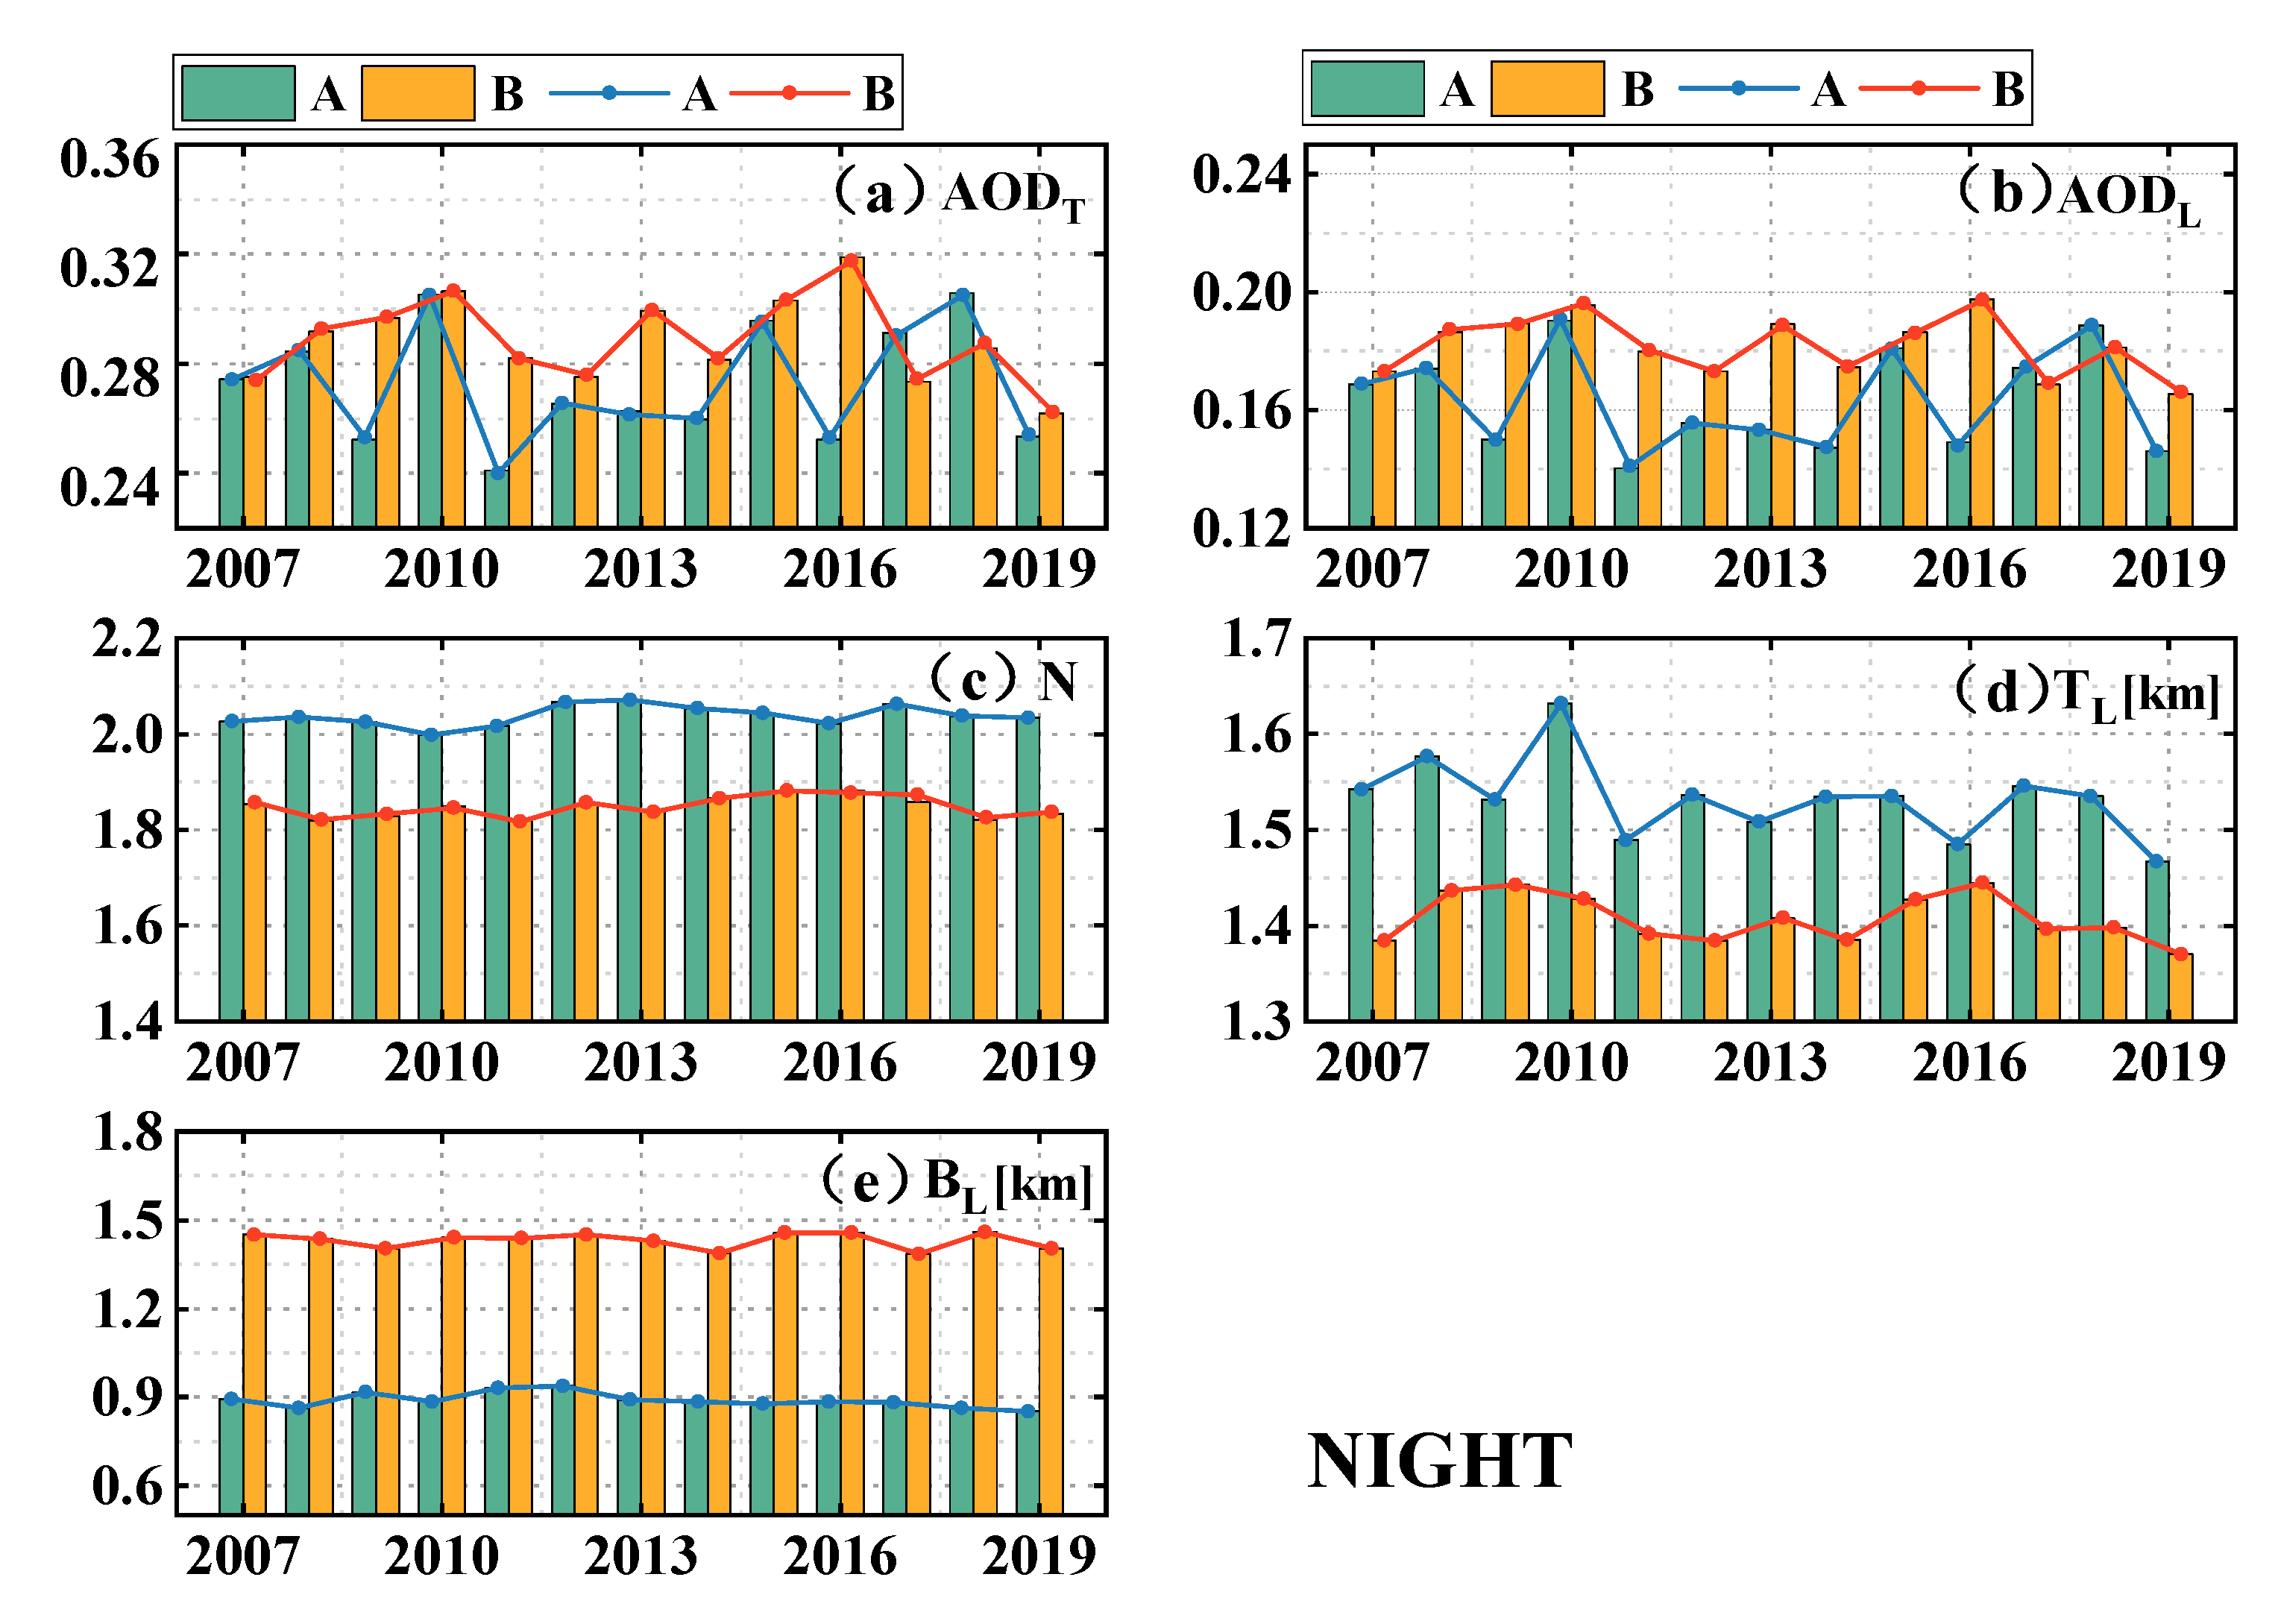
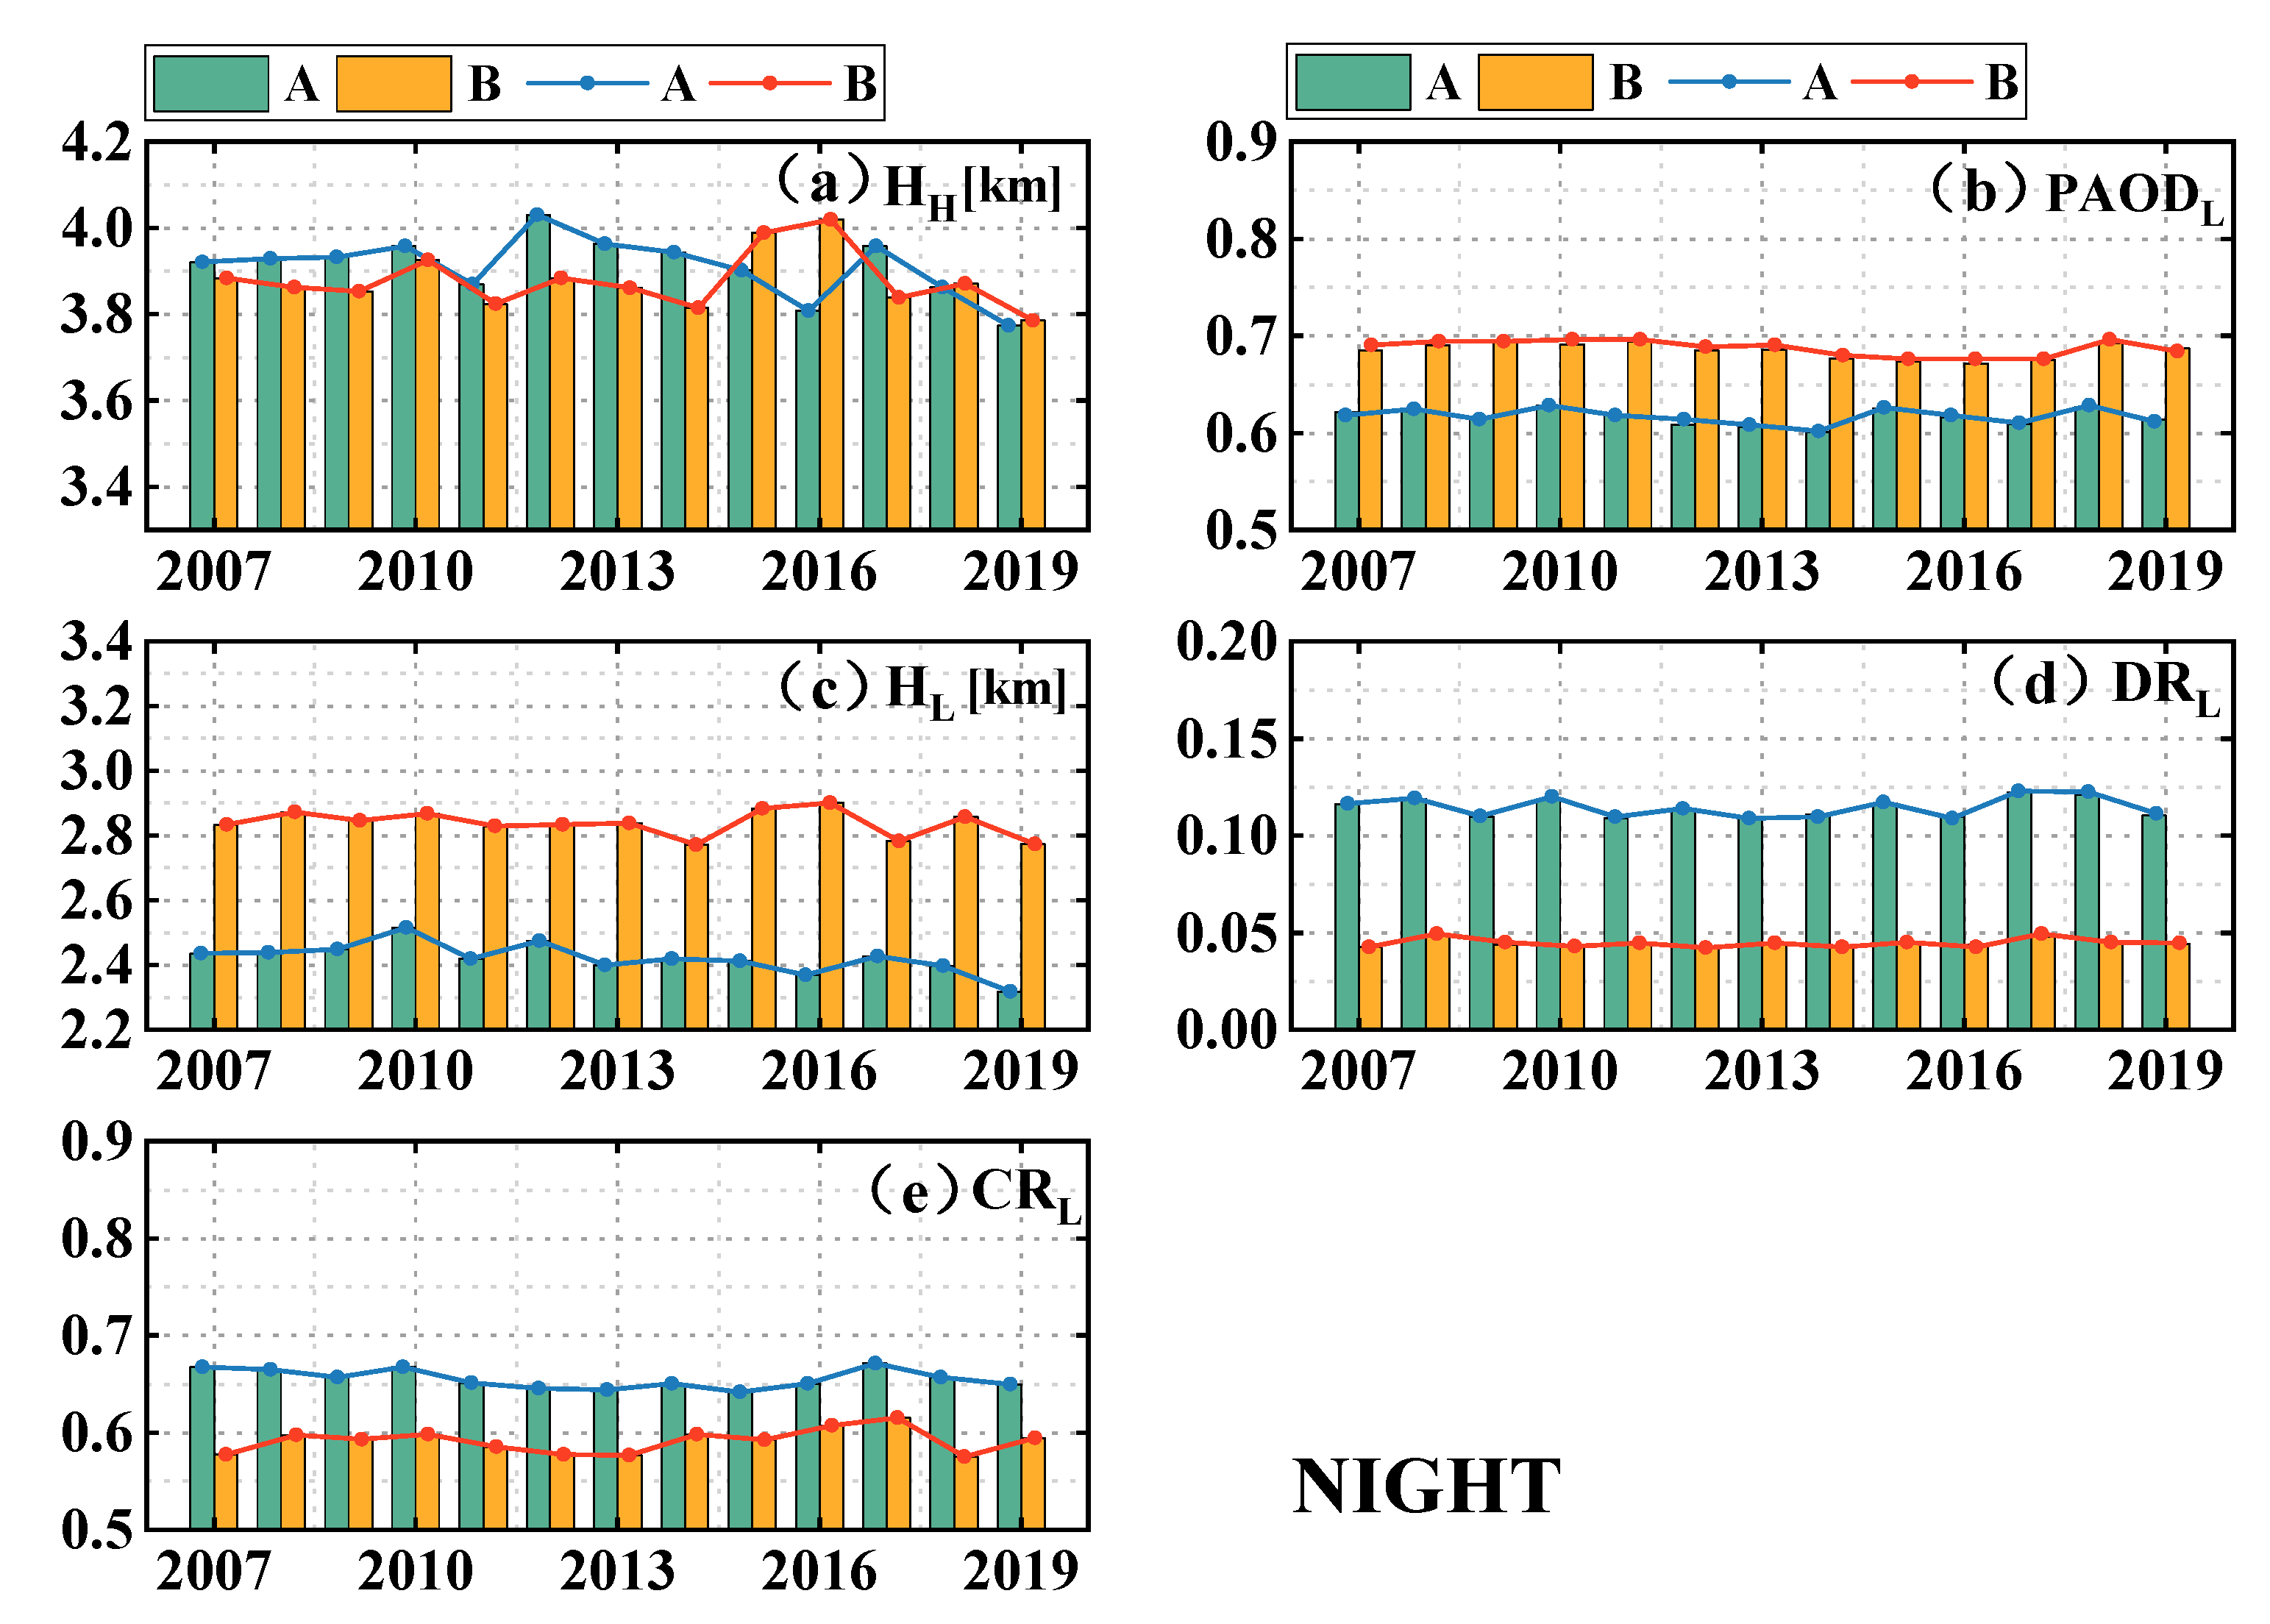
3.1. Interannual Variability in Aerosol Layer Properties in Africa

The annual mean values of AODT over the plains (zone A) and highlands (zone B) of Africa were studied from 2007 to 2019, as shown in Figure 2 and Figure 3 (daytime) and Figure 4 and Figure 5 (nighttime). Figure 2a (daytime) and Figure 4a (nighttime) show that annual mean values of AODT were both higher in zone B (daytime: 0.32; nighttime: 0.29) than in zone A (daytime: 0.28; nighttime: 0.27). Because zone A is located in northern Africa, characterized by more deserts and frequent dust storms (Saharan, etc.), large amounts of flying dust can increase aerosol loading in the atmosphere leading to correspondingly high AODT values [43]. Zone B is located in southern Africa, where human activities are more extensive. Factories, agricultural activities, and economic activities generate large amounts of aerosols emitted into the atmosphere, resulting in high annual mean values of AODT in zone B [33,37]. As shown in Figure 2b (daytime) and Figure 4b (nighttime), annual mean values of AODL were also high in region B (daytime: 0.2; nighttime: 0.18) and region A (daytime: 0.17; nighttime: 0.16). This was similar to the variation in AODT as described above, i.e., zone B was more influenced by anthropogenic activities and zone A was more influenced by natural factors.
From Figure 2c and Figure 4c, it can be seen that annual average values of N were higher in area A (daytime: 1.79; nighttime: 2.0) than in area B (daytime: 1.58; nighttime: 1.85). The reason can be the fact that area A has a tropical desert climate with relatively high temperatures and intense atmospheric vertical movements leading to more frequent vertical stratifications [36,44]. Area B, on the other hand, is a mountainous plateau landform and the temperature in zone B was not as high as in zone A resulting in relatively weak atmospheric vertical convection and stratification in zone B [37]. As shown in Figure 2d and Figure 4d, results showed that TL values in zone A (daytime: 1.50 km; nighttime: 1.53 km) and zone B (daytime: 1.54 km; nighttime: 1.41 km) were both ~1.5 km. Figure 2e and Figure 4e show the fact that the annual mean values of BL in zone B (daytime: 1.51 km; nighttime: 1.43 km) were higher than those in zone A (daytime: 1.24 km; nighttime: 0.89 km). Moreover, Figure 3c and Figure 5c also show the fact that the annual mean values of HL in zone B (daytime: 1.51 km; nighttime: 1.43 km) were higher than those in zone A (daytime: 1.24 km; nighttime: 0.89 km). One of the main reasons can be related to topographic elevations. Zone B is a plateau landform with mainly higher elevations, while Zone A is a plain landform with lower elevations. On the other hand, Figure 3a and Figure 5a show that HH values were not obviously different between zones A (daytime: 3.58 km; nighttime: 3.91 km) and B (daytime: 3.55 km; nighttime: 3.88 km). This was because region A is mainly covered by deserts, and dust would be blown to a high altitude in the atmosphere, causing aerosol layer stratification and uplifting, resulting in the HH values of plain region A being almost equal to those of plateau region B [35].
PAODL was the ratio between AODL and AODT shown in Figure 3b and Figure 5b. As shown, B PAODL values (daytime: 77.4%; nighttime: 68.4%) were higher than A PAODL values (daytime: 71.2%; nighttime: 61.6%) because PAODL represented the proportion of the first aerosol layer in the entire atmosphere. In region A, due to the influence of more desert coverage, there was more stratification of dust layers in the sky, resulting in a decrease in the proportion of the first aerosol layer [45]. The phenomenon was less common in region B. As shown in Figure 3d and Figure 5d, the DRL annual mean values of zone A (daytime: 0.16, nighttime: 0.11) were higher than those of zone B (daytime: 0.07; nighttime: 0.04). DRL reflected the non-spherical properties of the lowest aerosol layer; the larger the DRL values, the more non-spherical the aerosol particles. The reason, once again, can be that area A had more deserts (the Sahara Desert and other smaller deserts such as the Libyan Desert and the Sinai Peninsula Desert) than region B. The shape of dust aerosols was almost irregular and non-spherical [44,46]. Atmospheric aerosols of the B region were mainly emitted from human activity and industrial development, and their shapes were more often spherical (such as black carbon aerosols) [33,34,37]. CRL was the ratio of the total attenuation backscattering coefficient at 1064 nm wavelength and 532 nm wavelength, which represented the particle sizes. The higher the color ratio values, the larger the particle sizes. As shown in Figure 3e and Figure 5e, the annual mean values of the color ratio in zone B (day: 0.81; night: 0.6) were similar to those in zone A (day: 0.76; night: 0.56), and both values were larger. This was because more parts of region A were covered by deserts, and the dust aerosol sizes were larger. Aerosol sources in region B were mainly combustion emissions (black carbon, organic carbon, etc.), forest fires, industrial emissions (sulfate, etc.), and sea salts, which will lead to larger aerosol particle sizes [34,39,47,48,49,50].

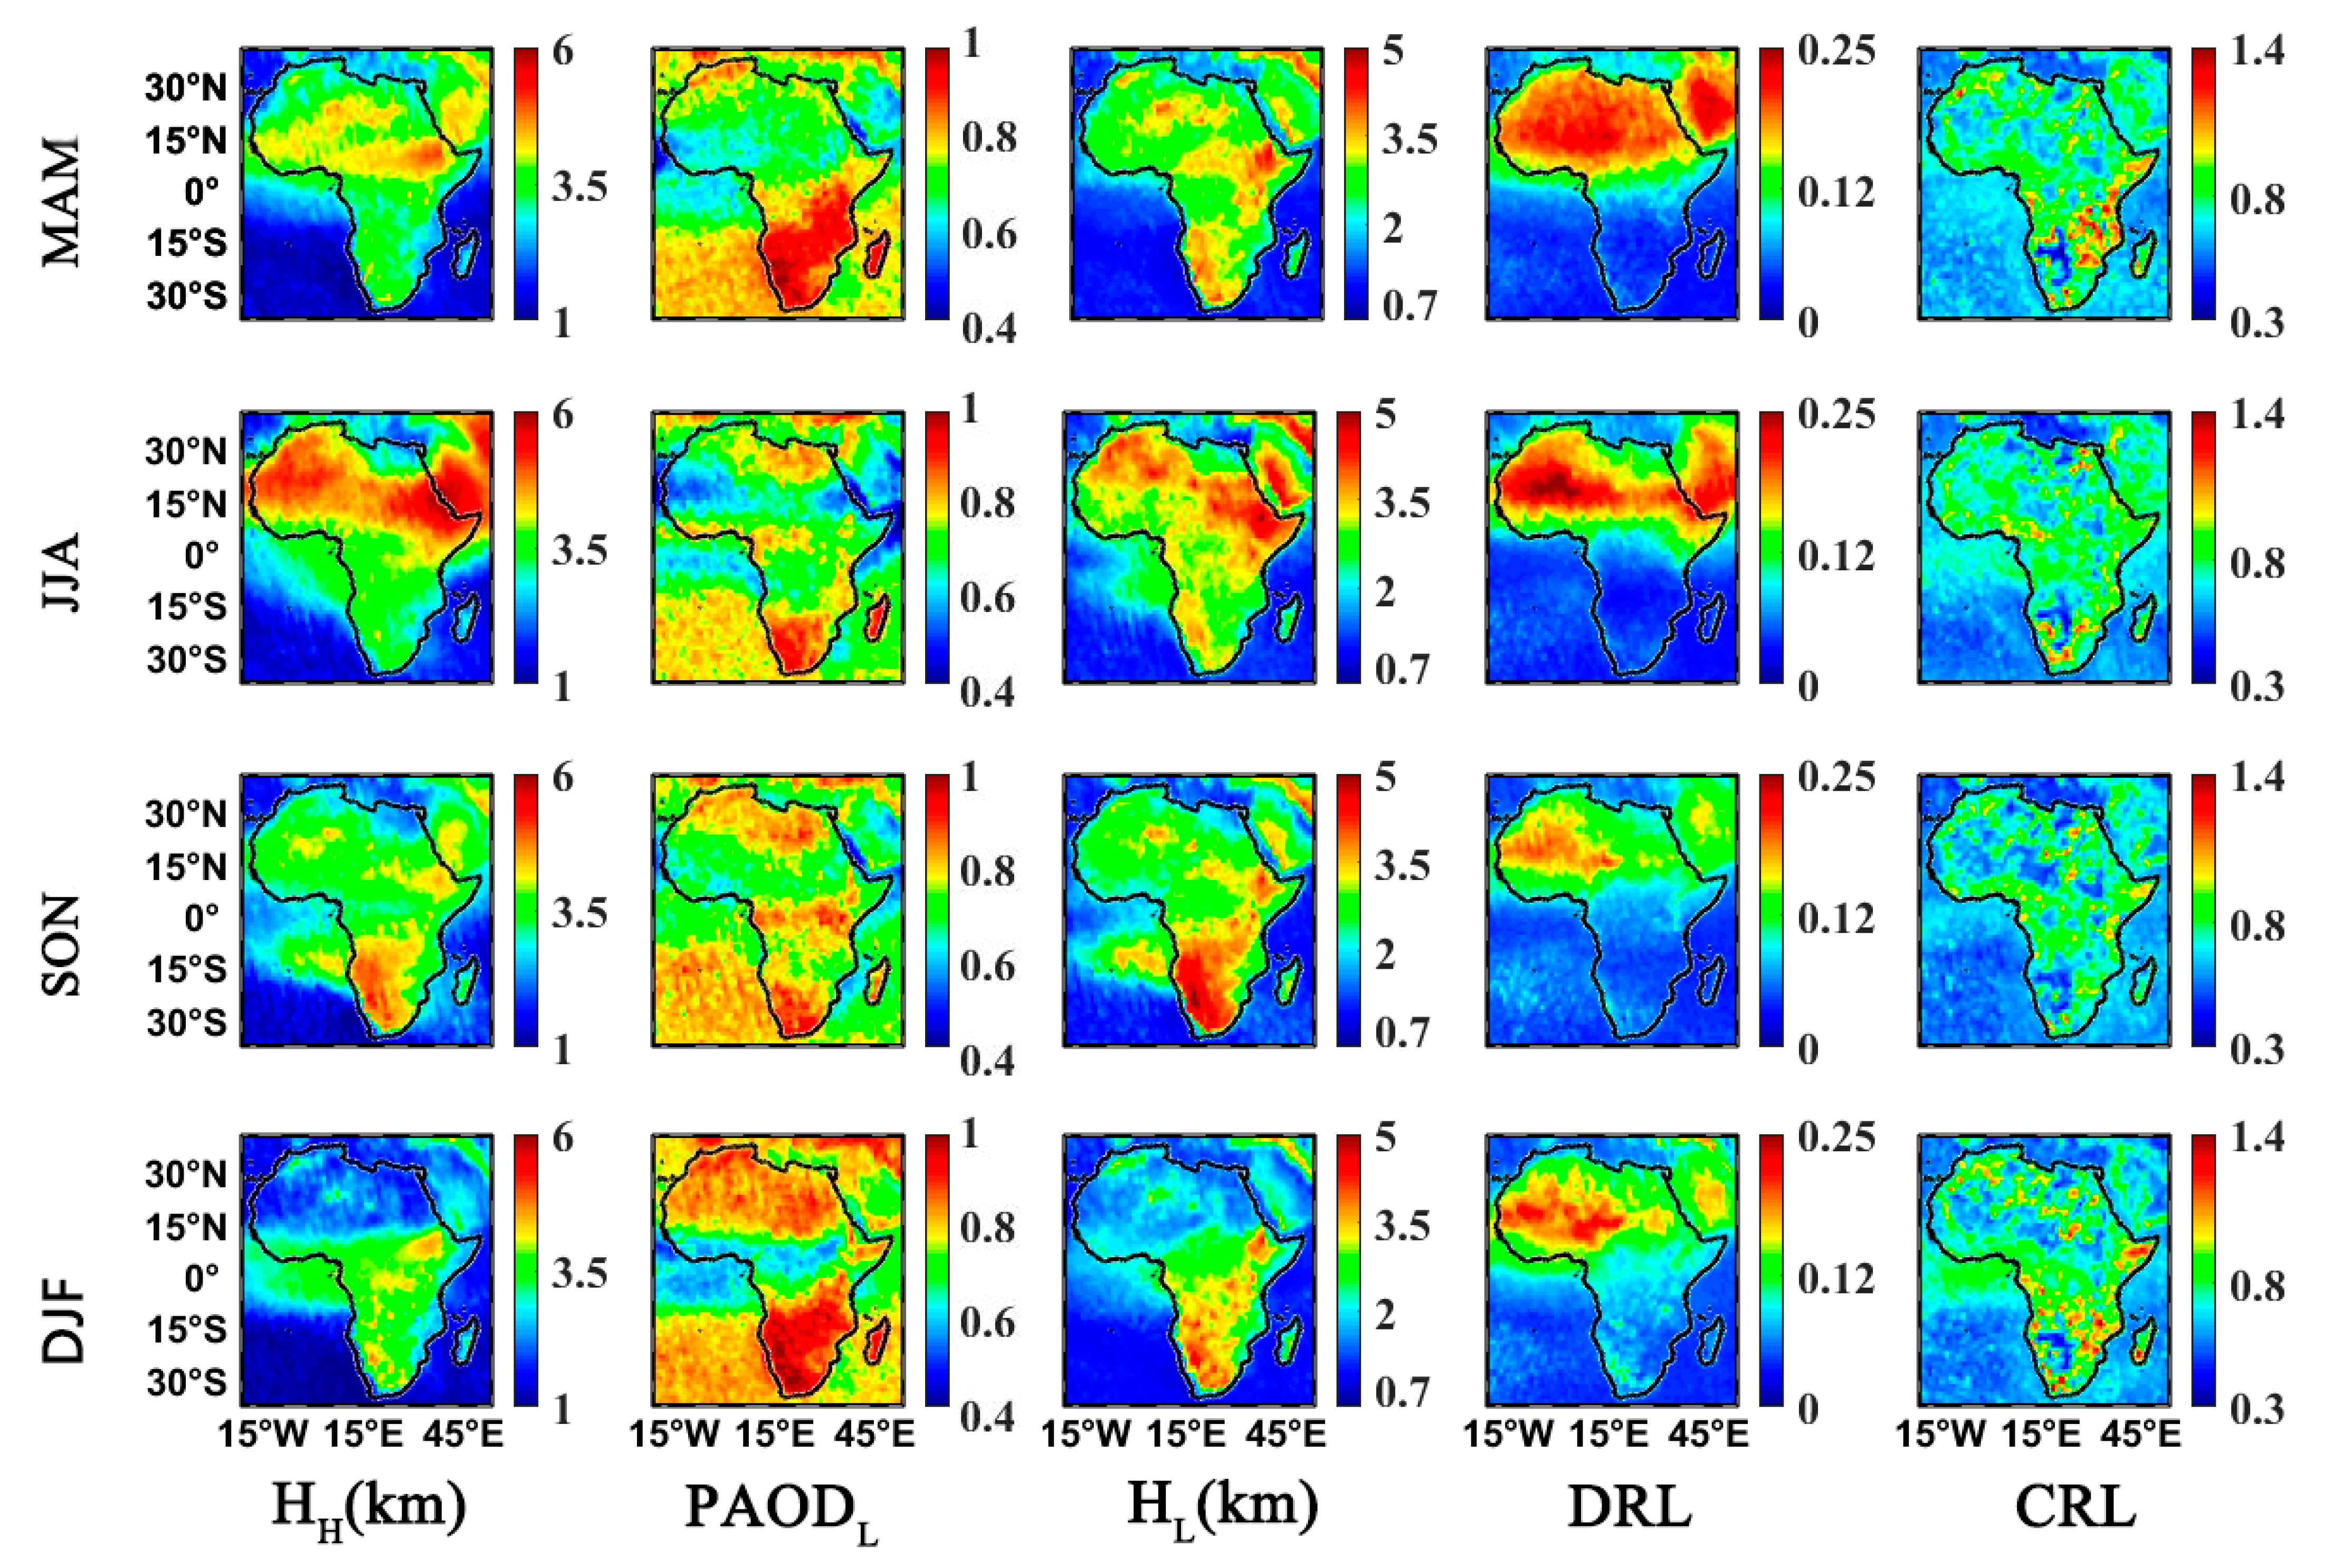
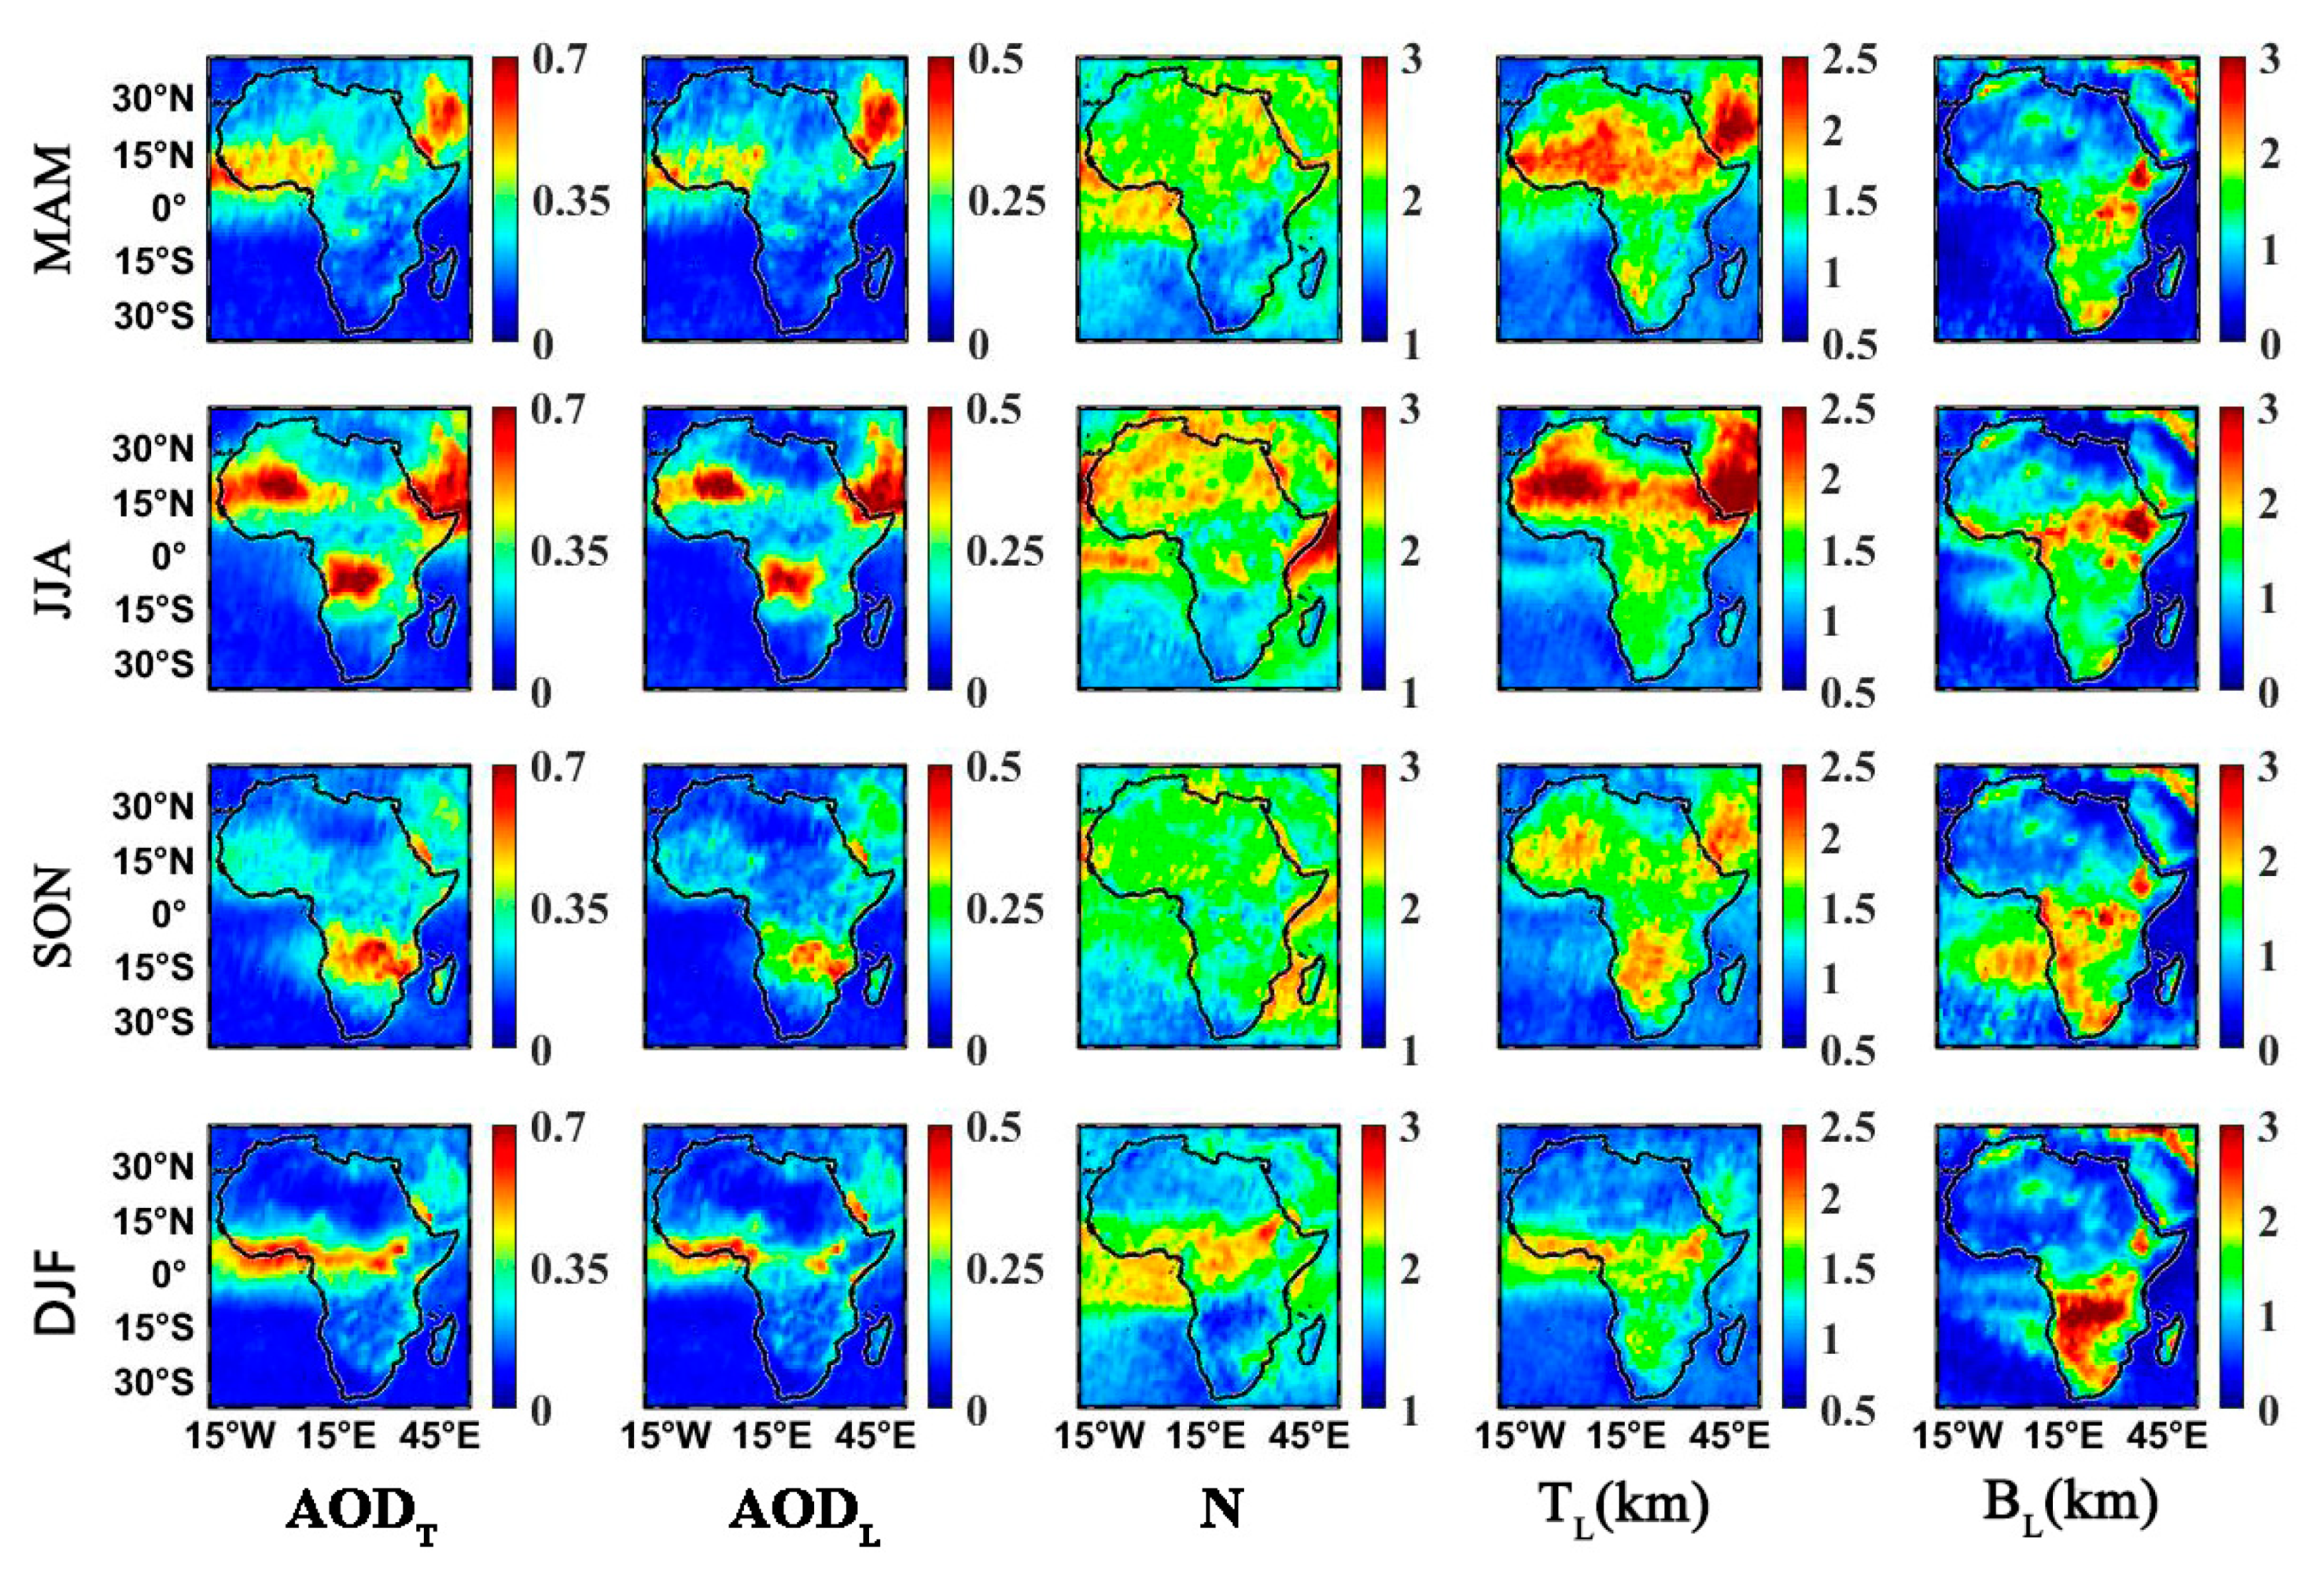
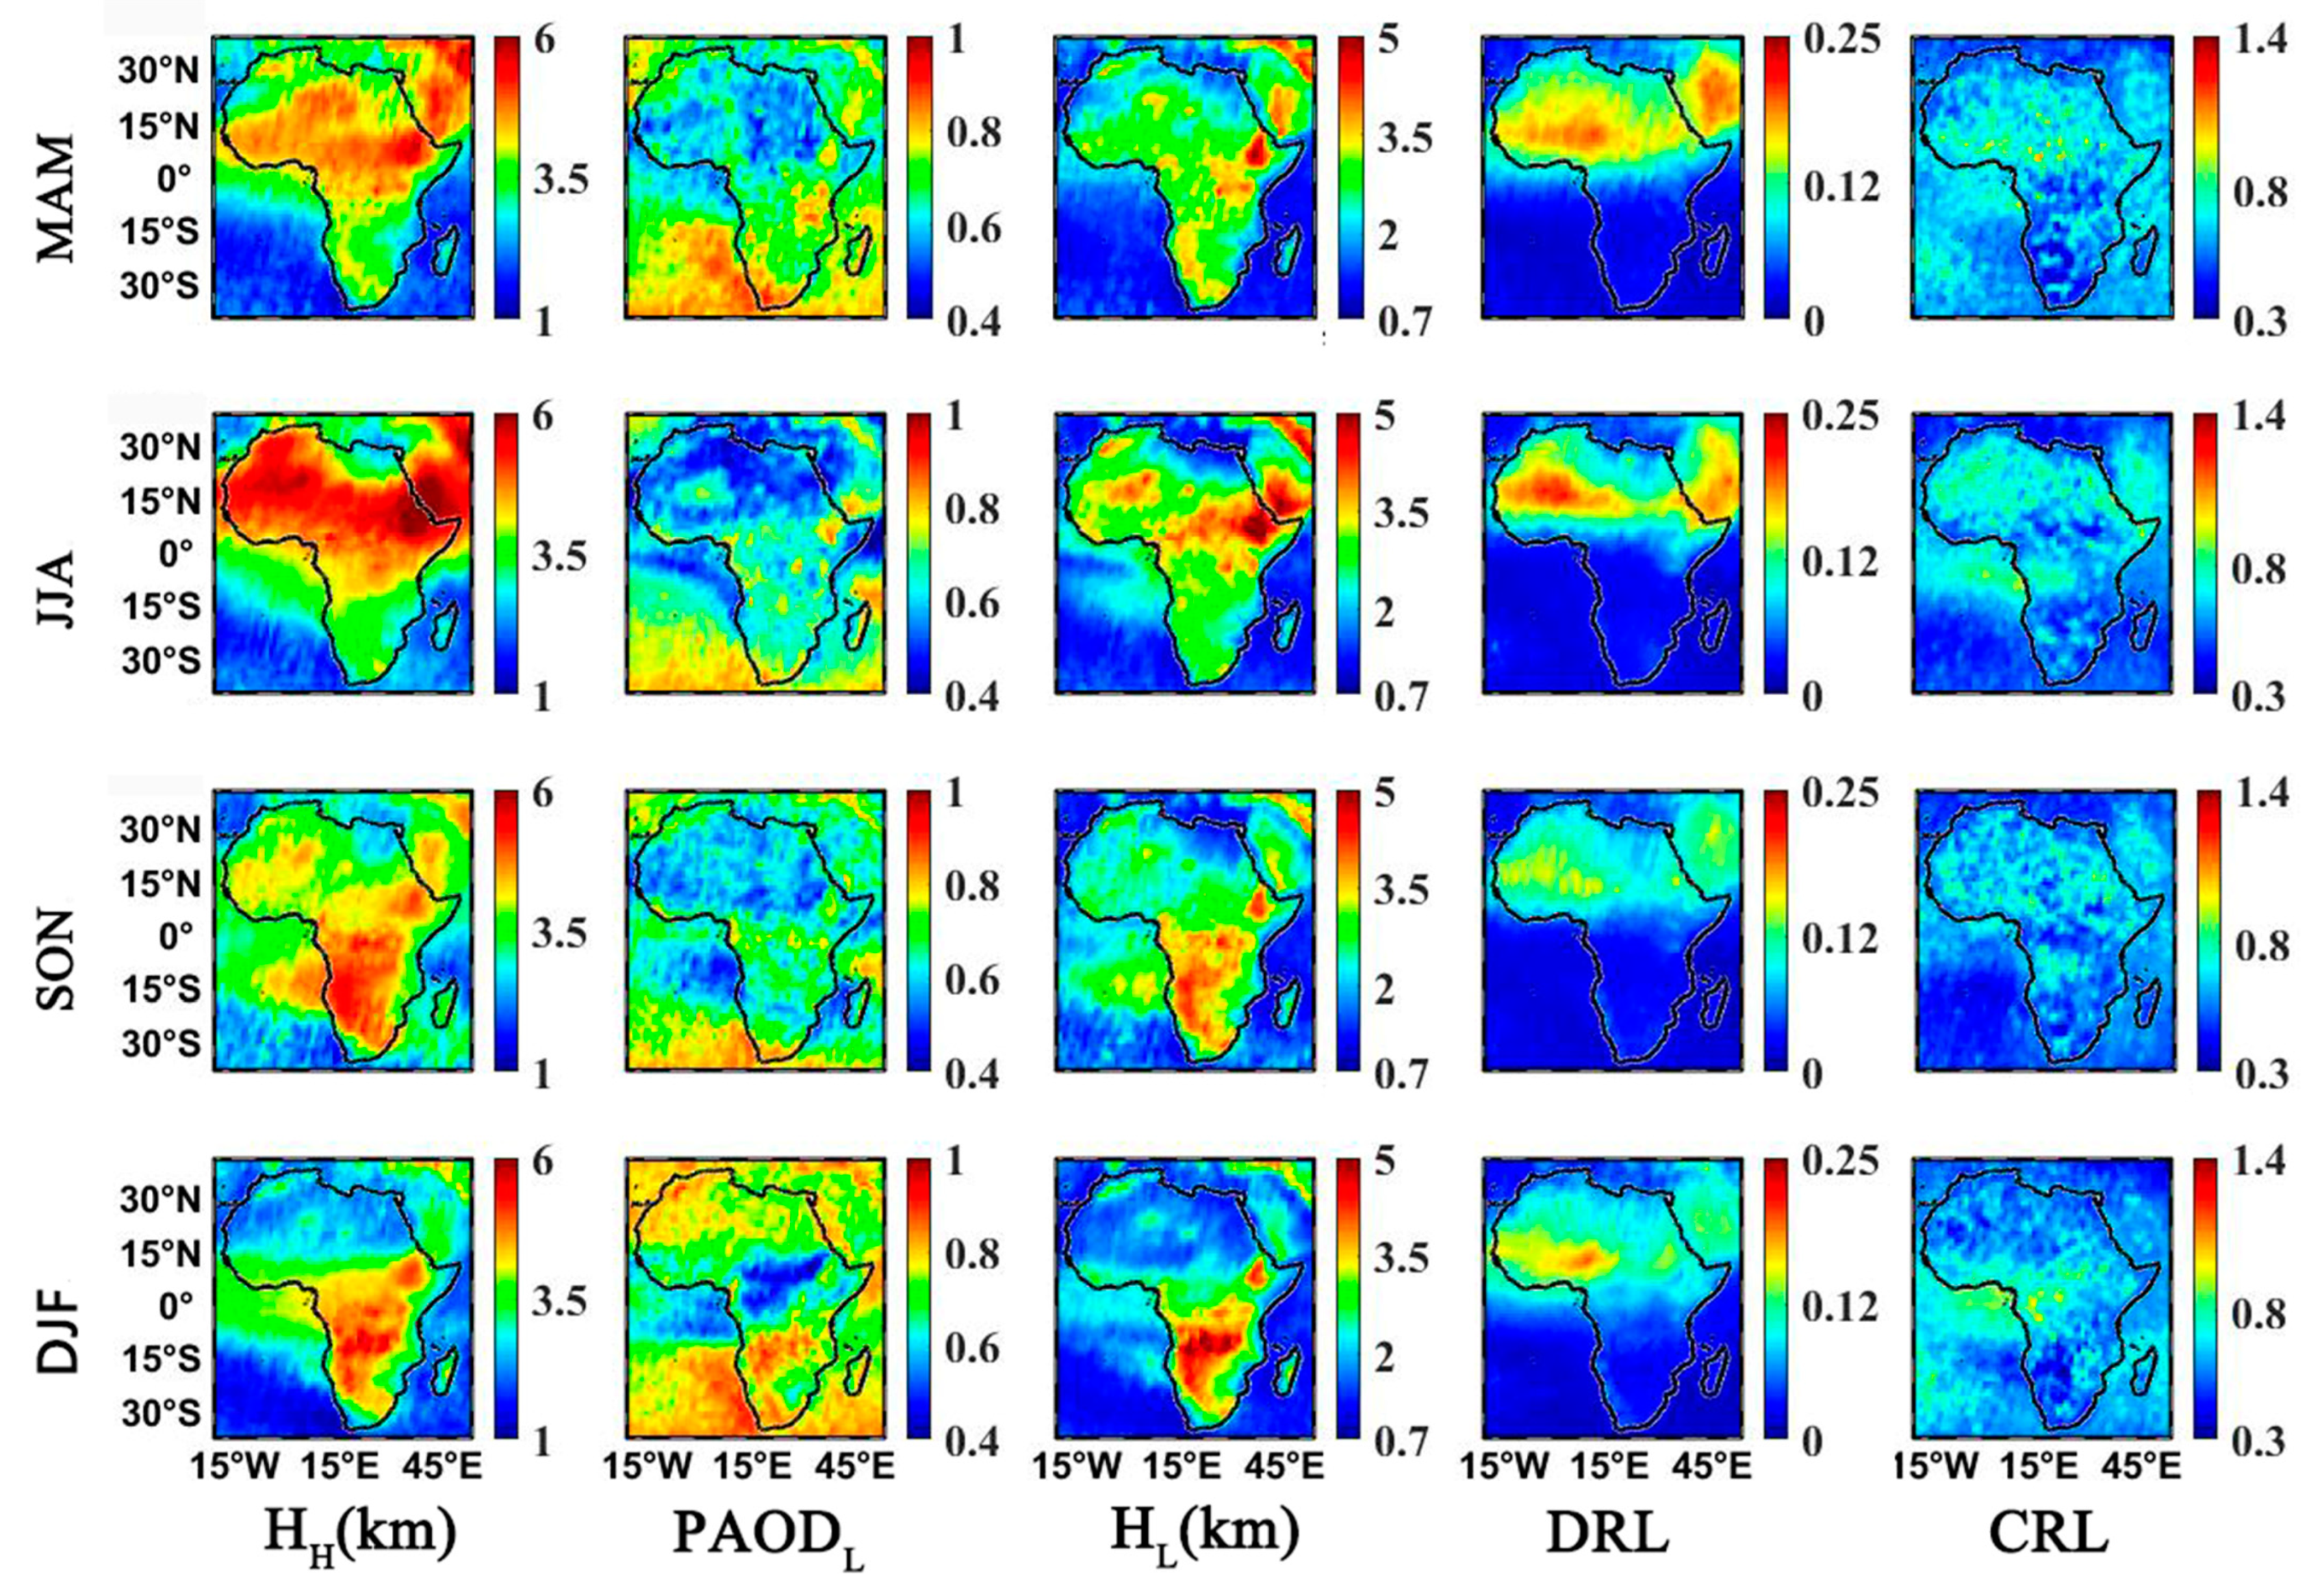
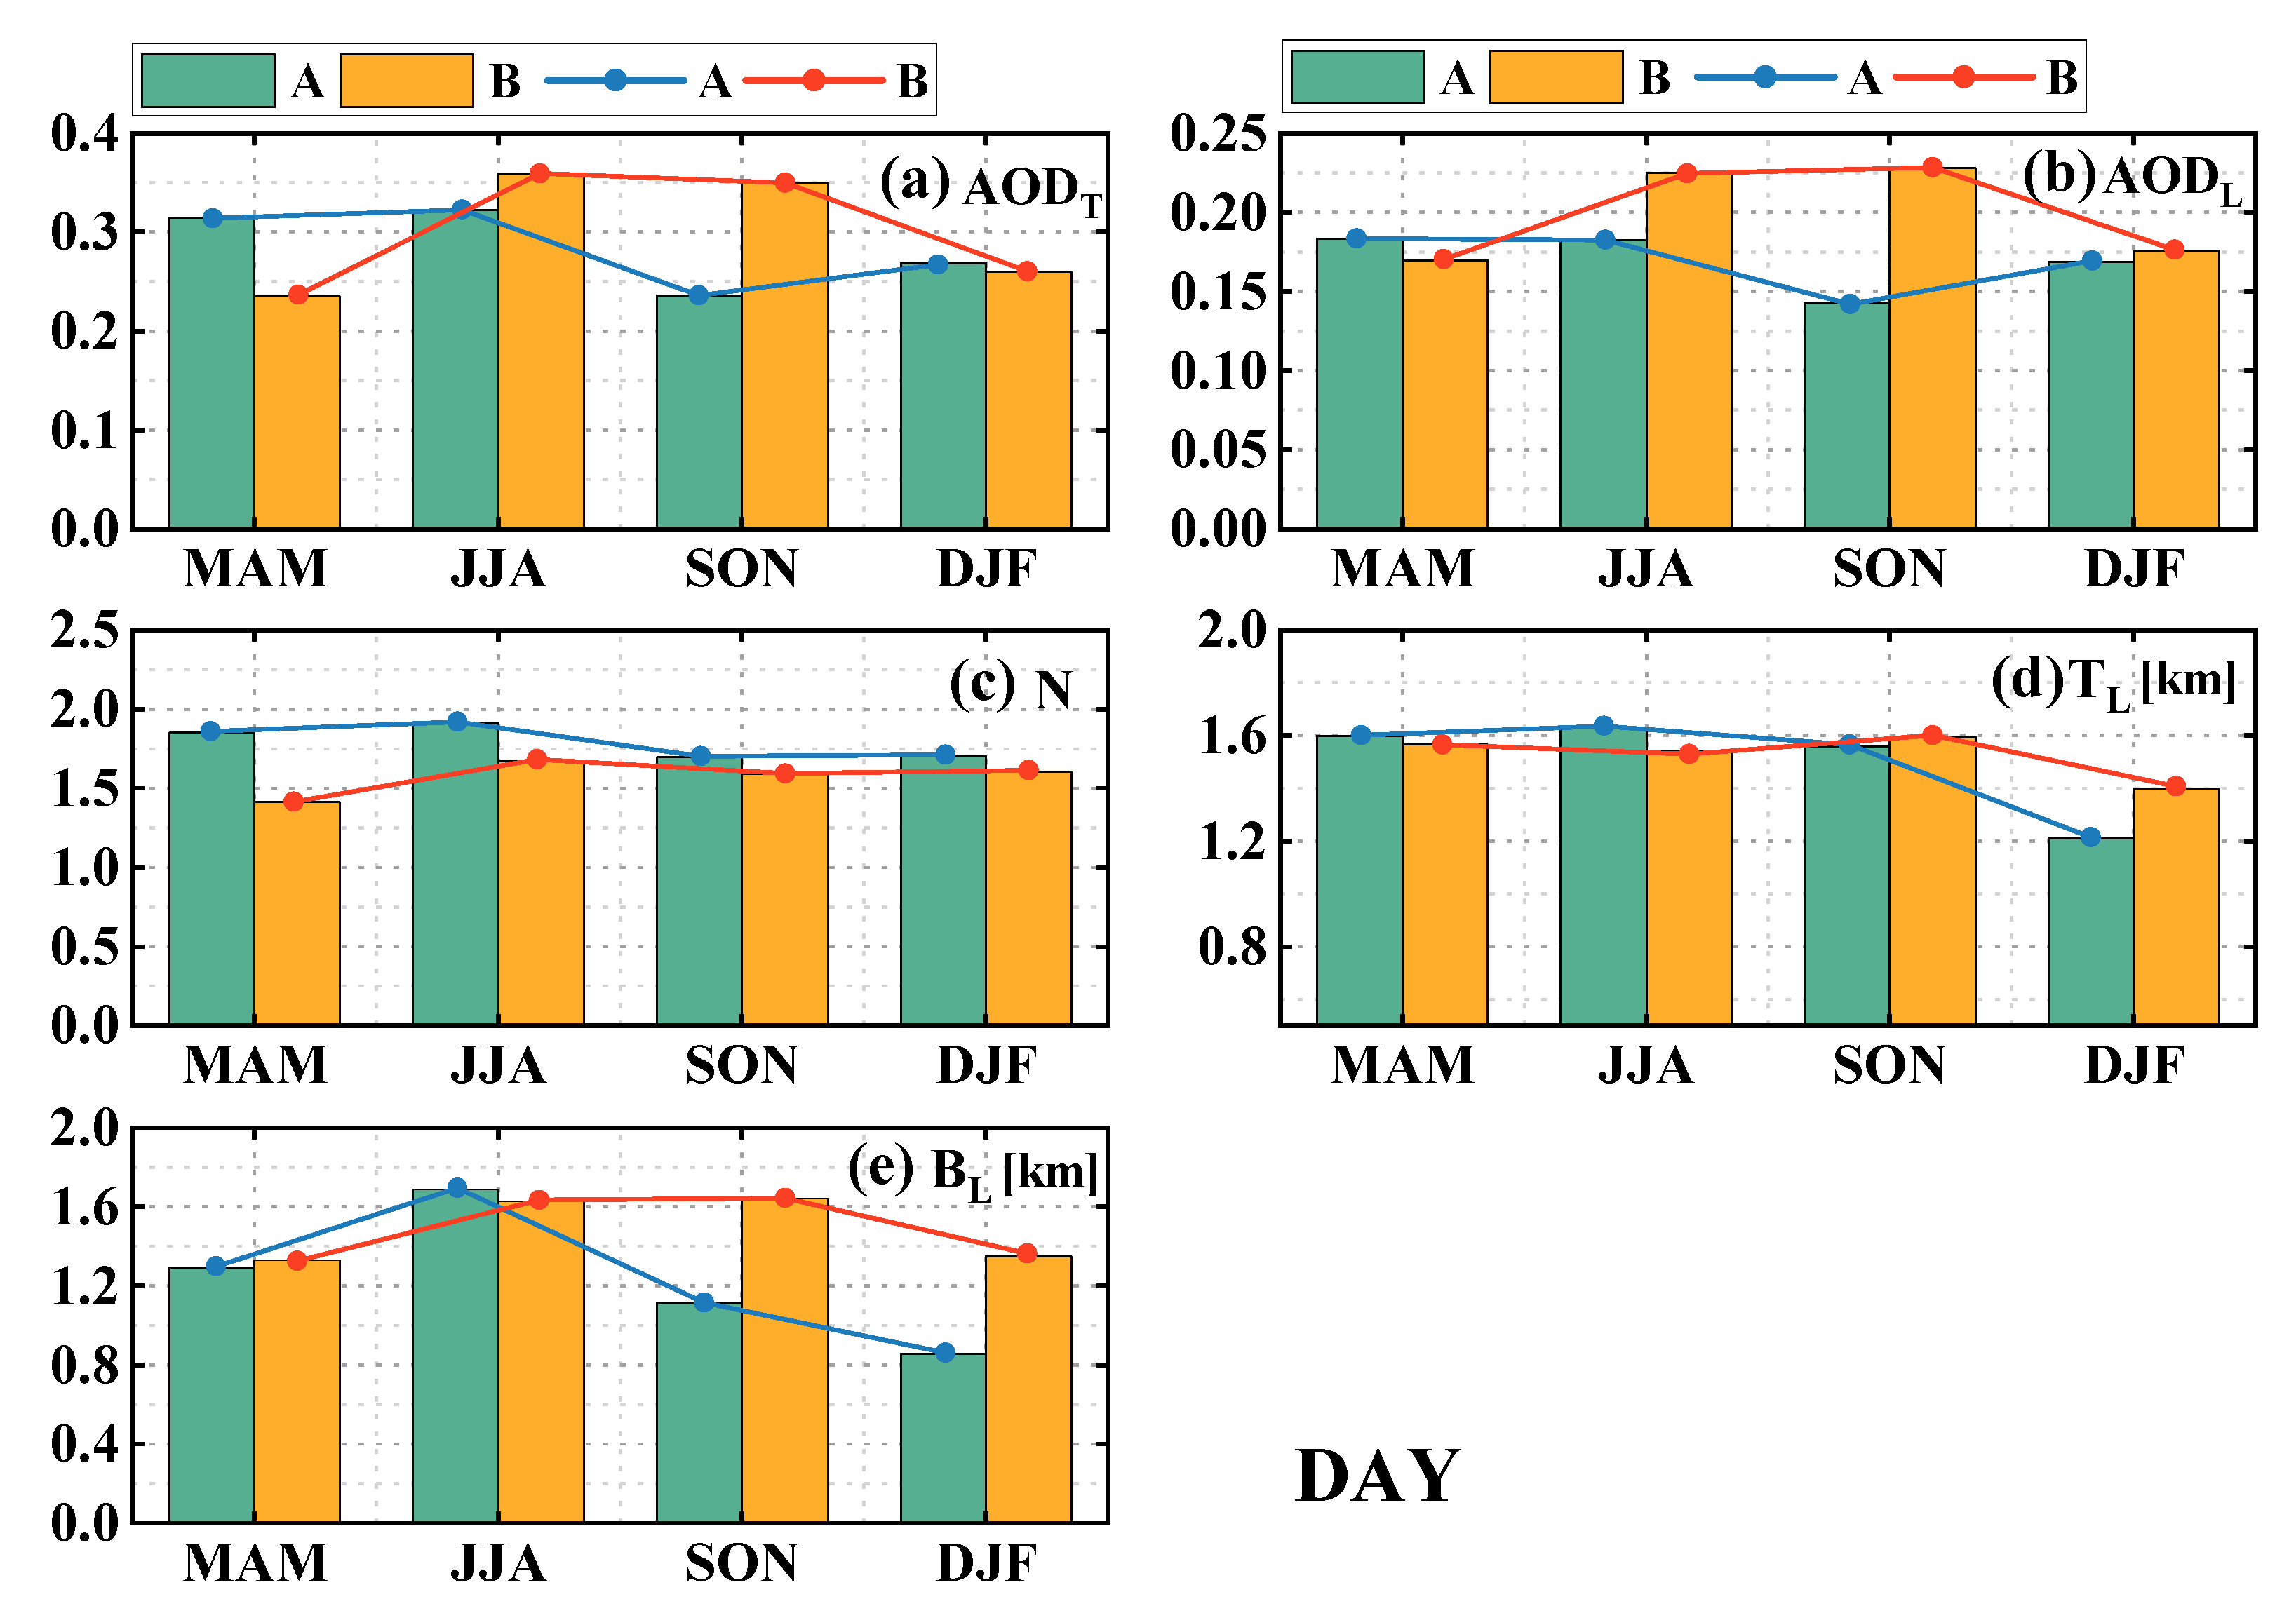
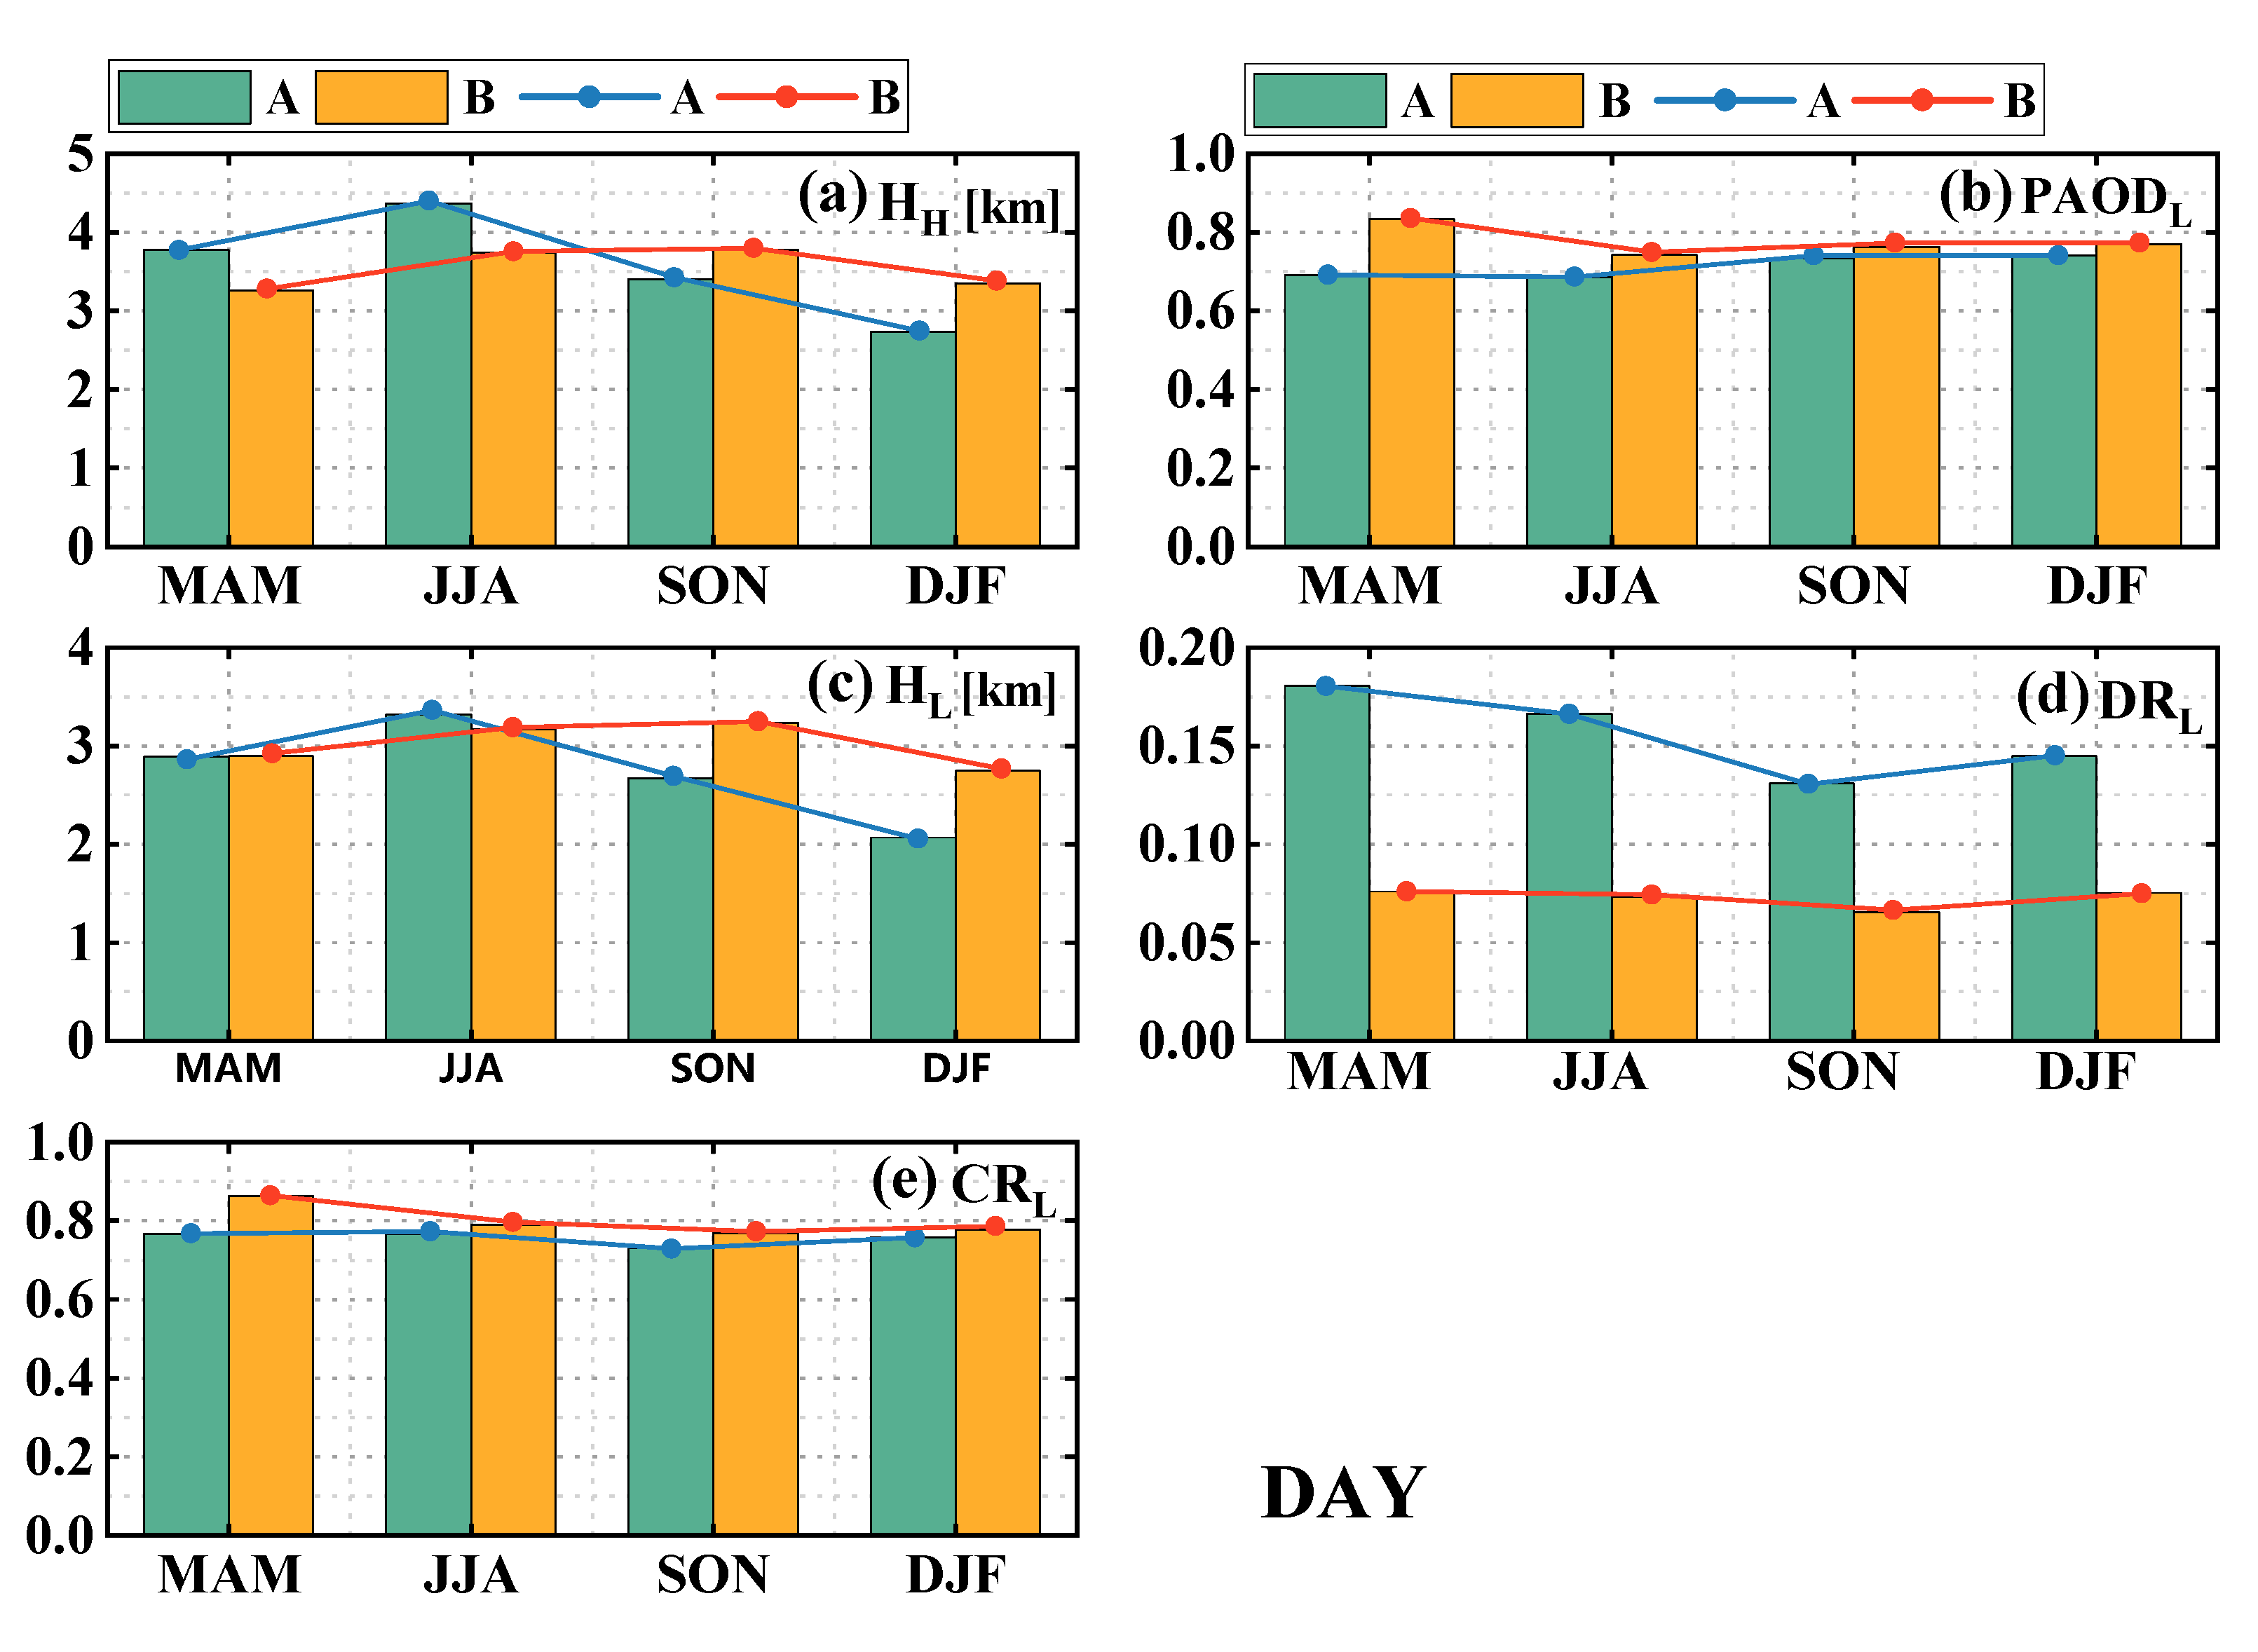
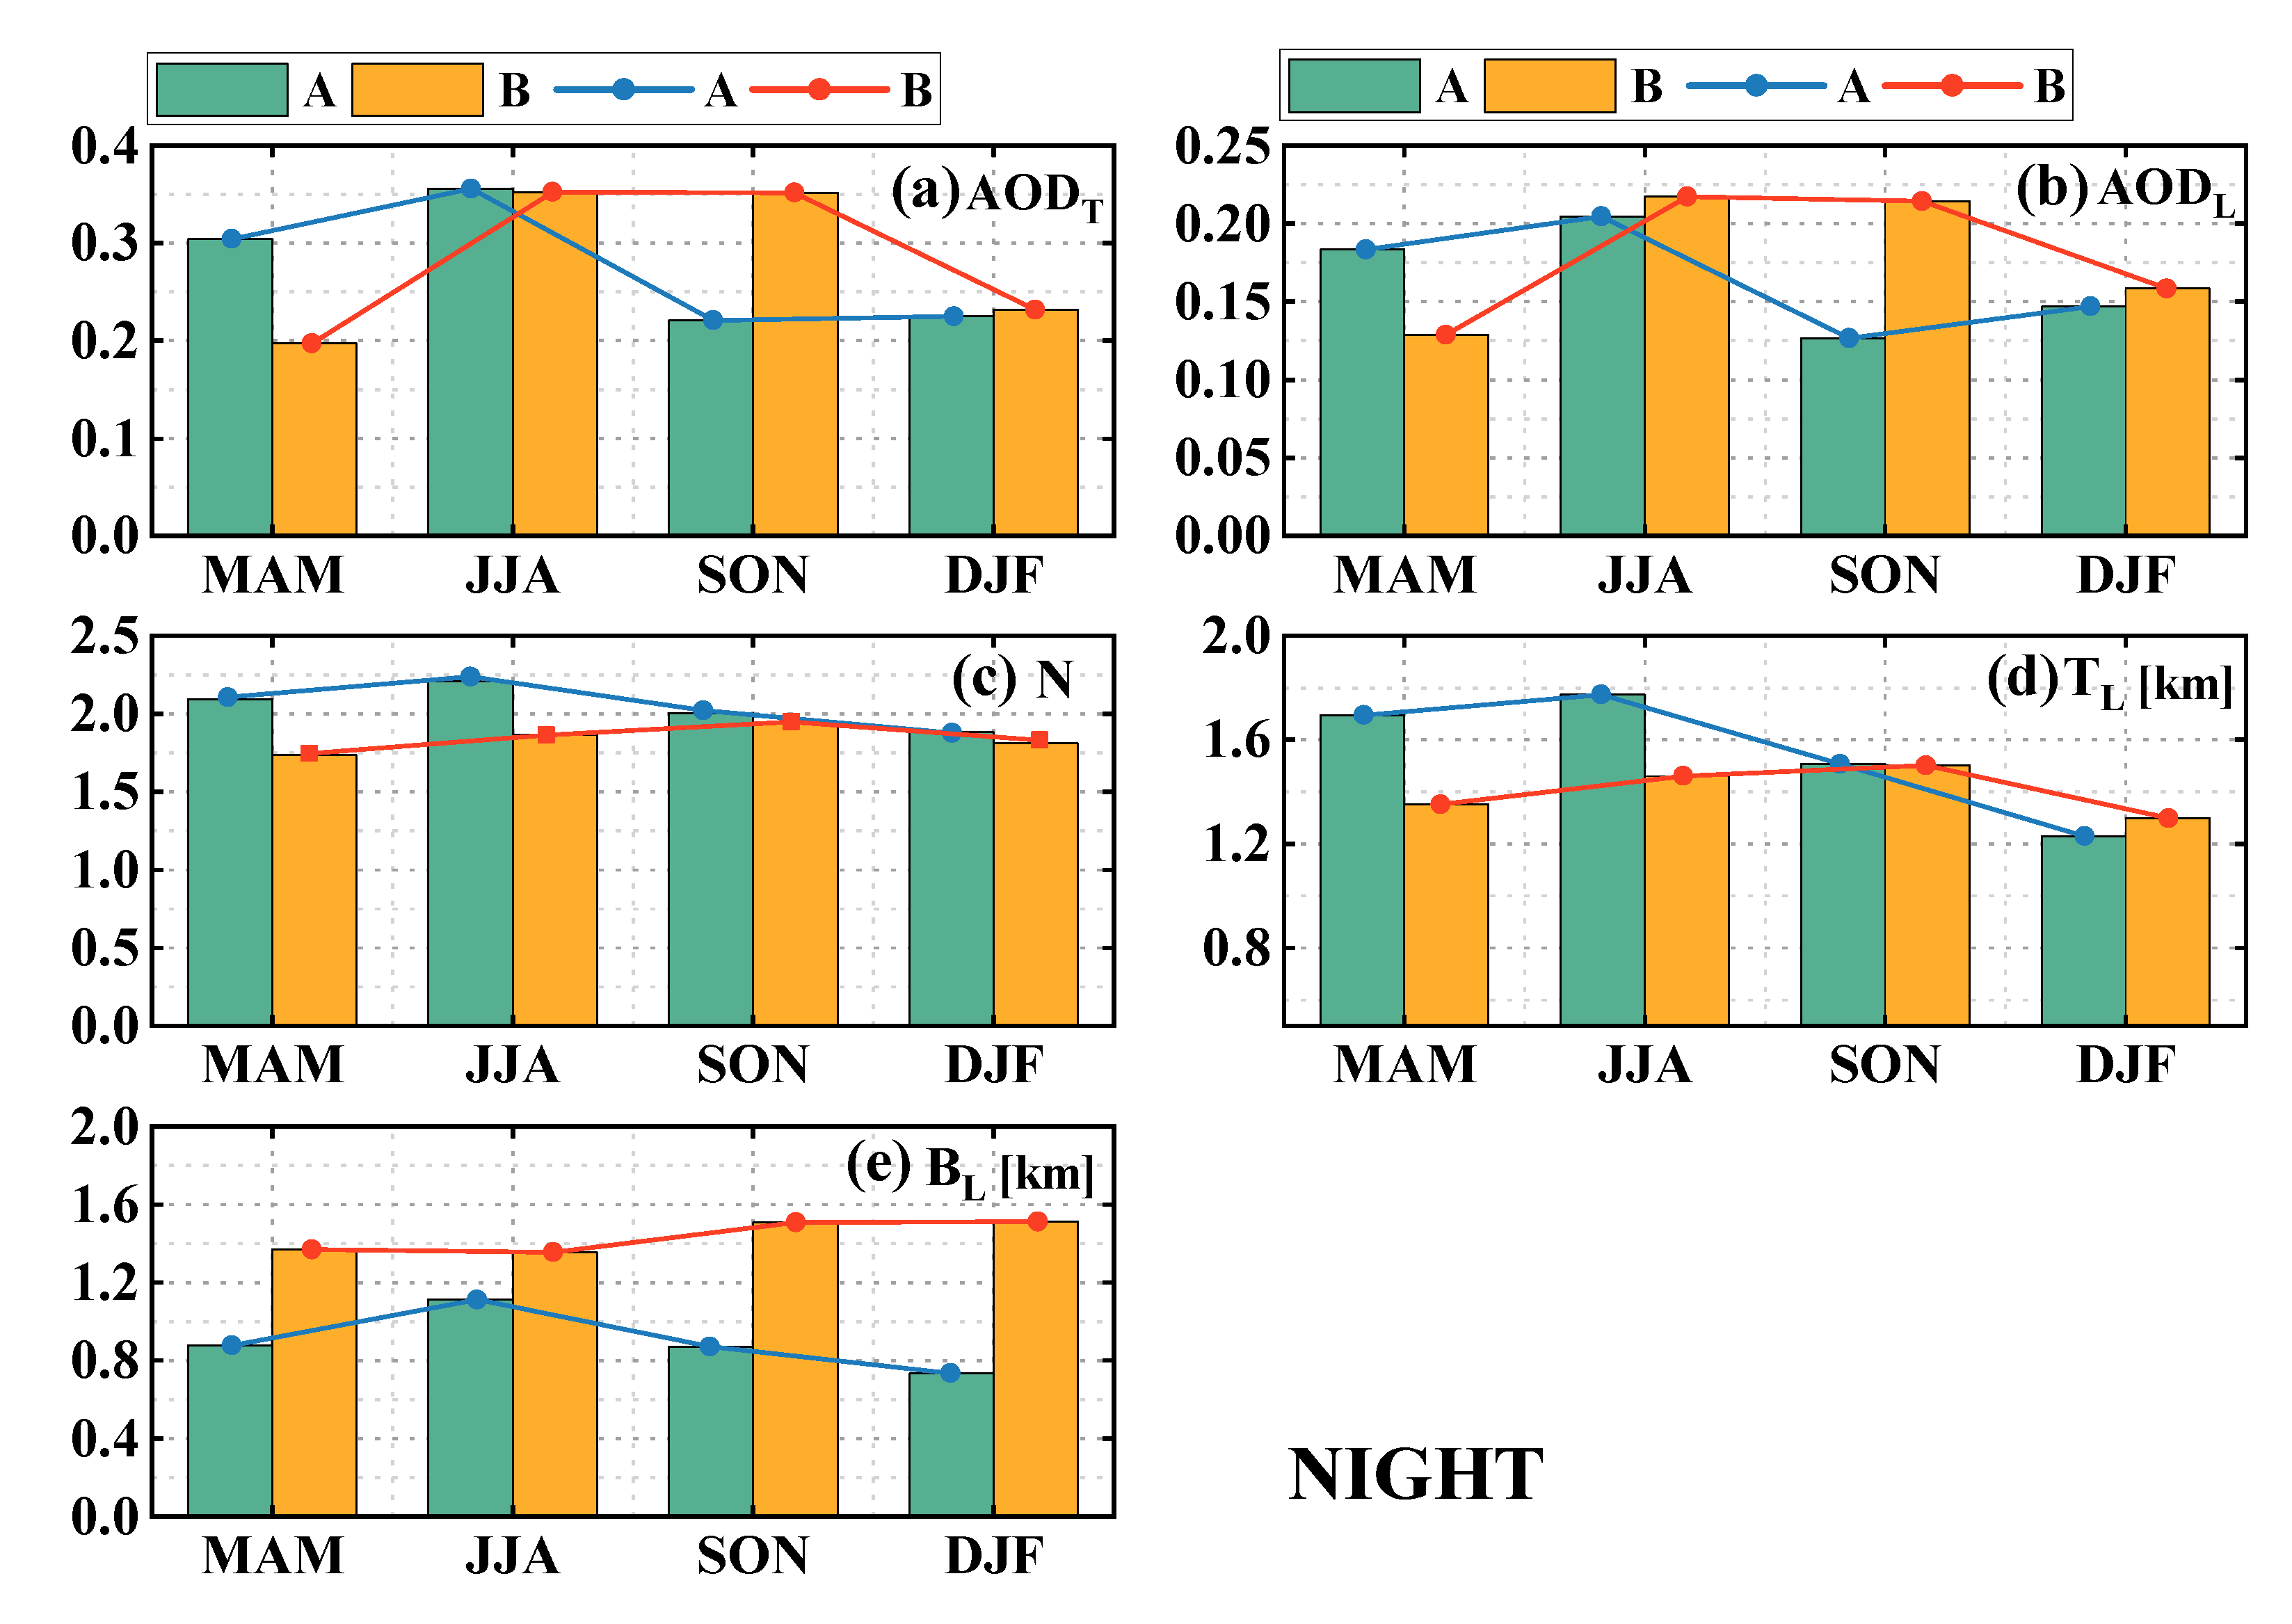
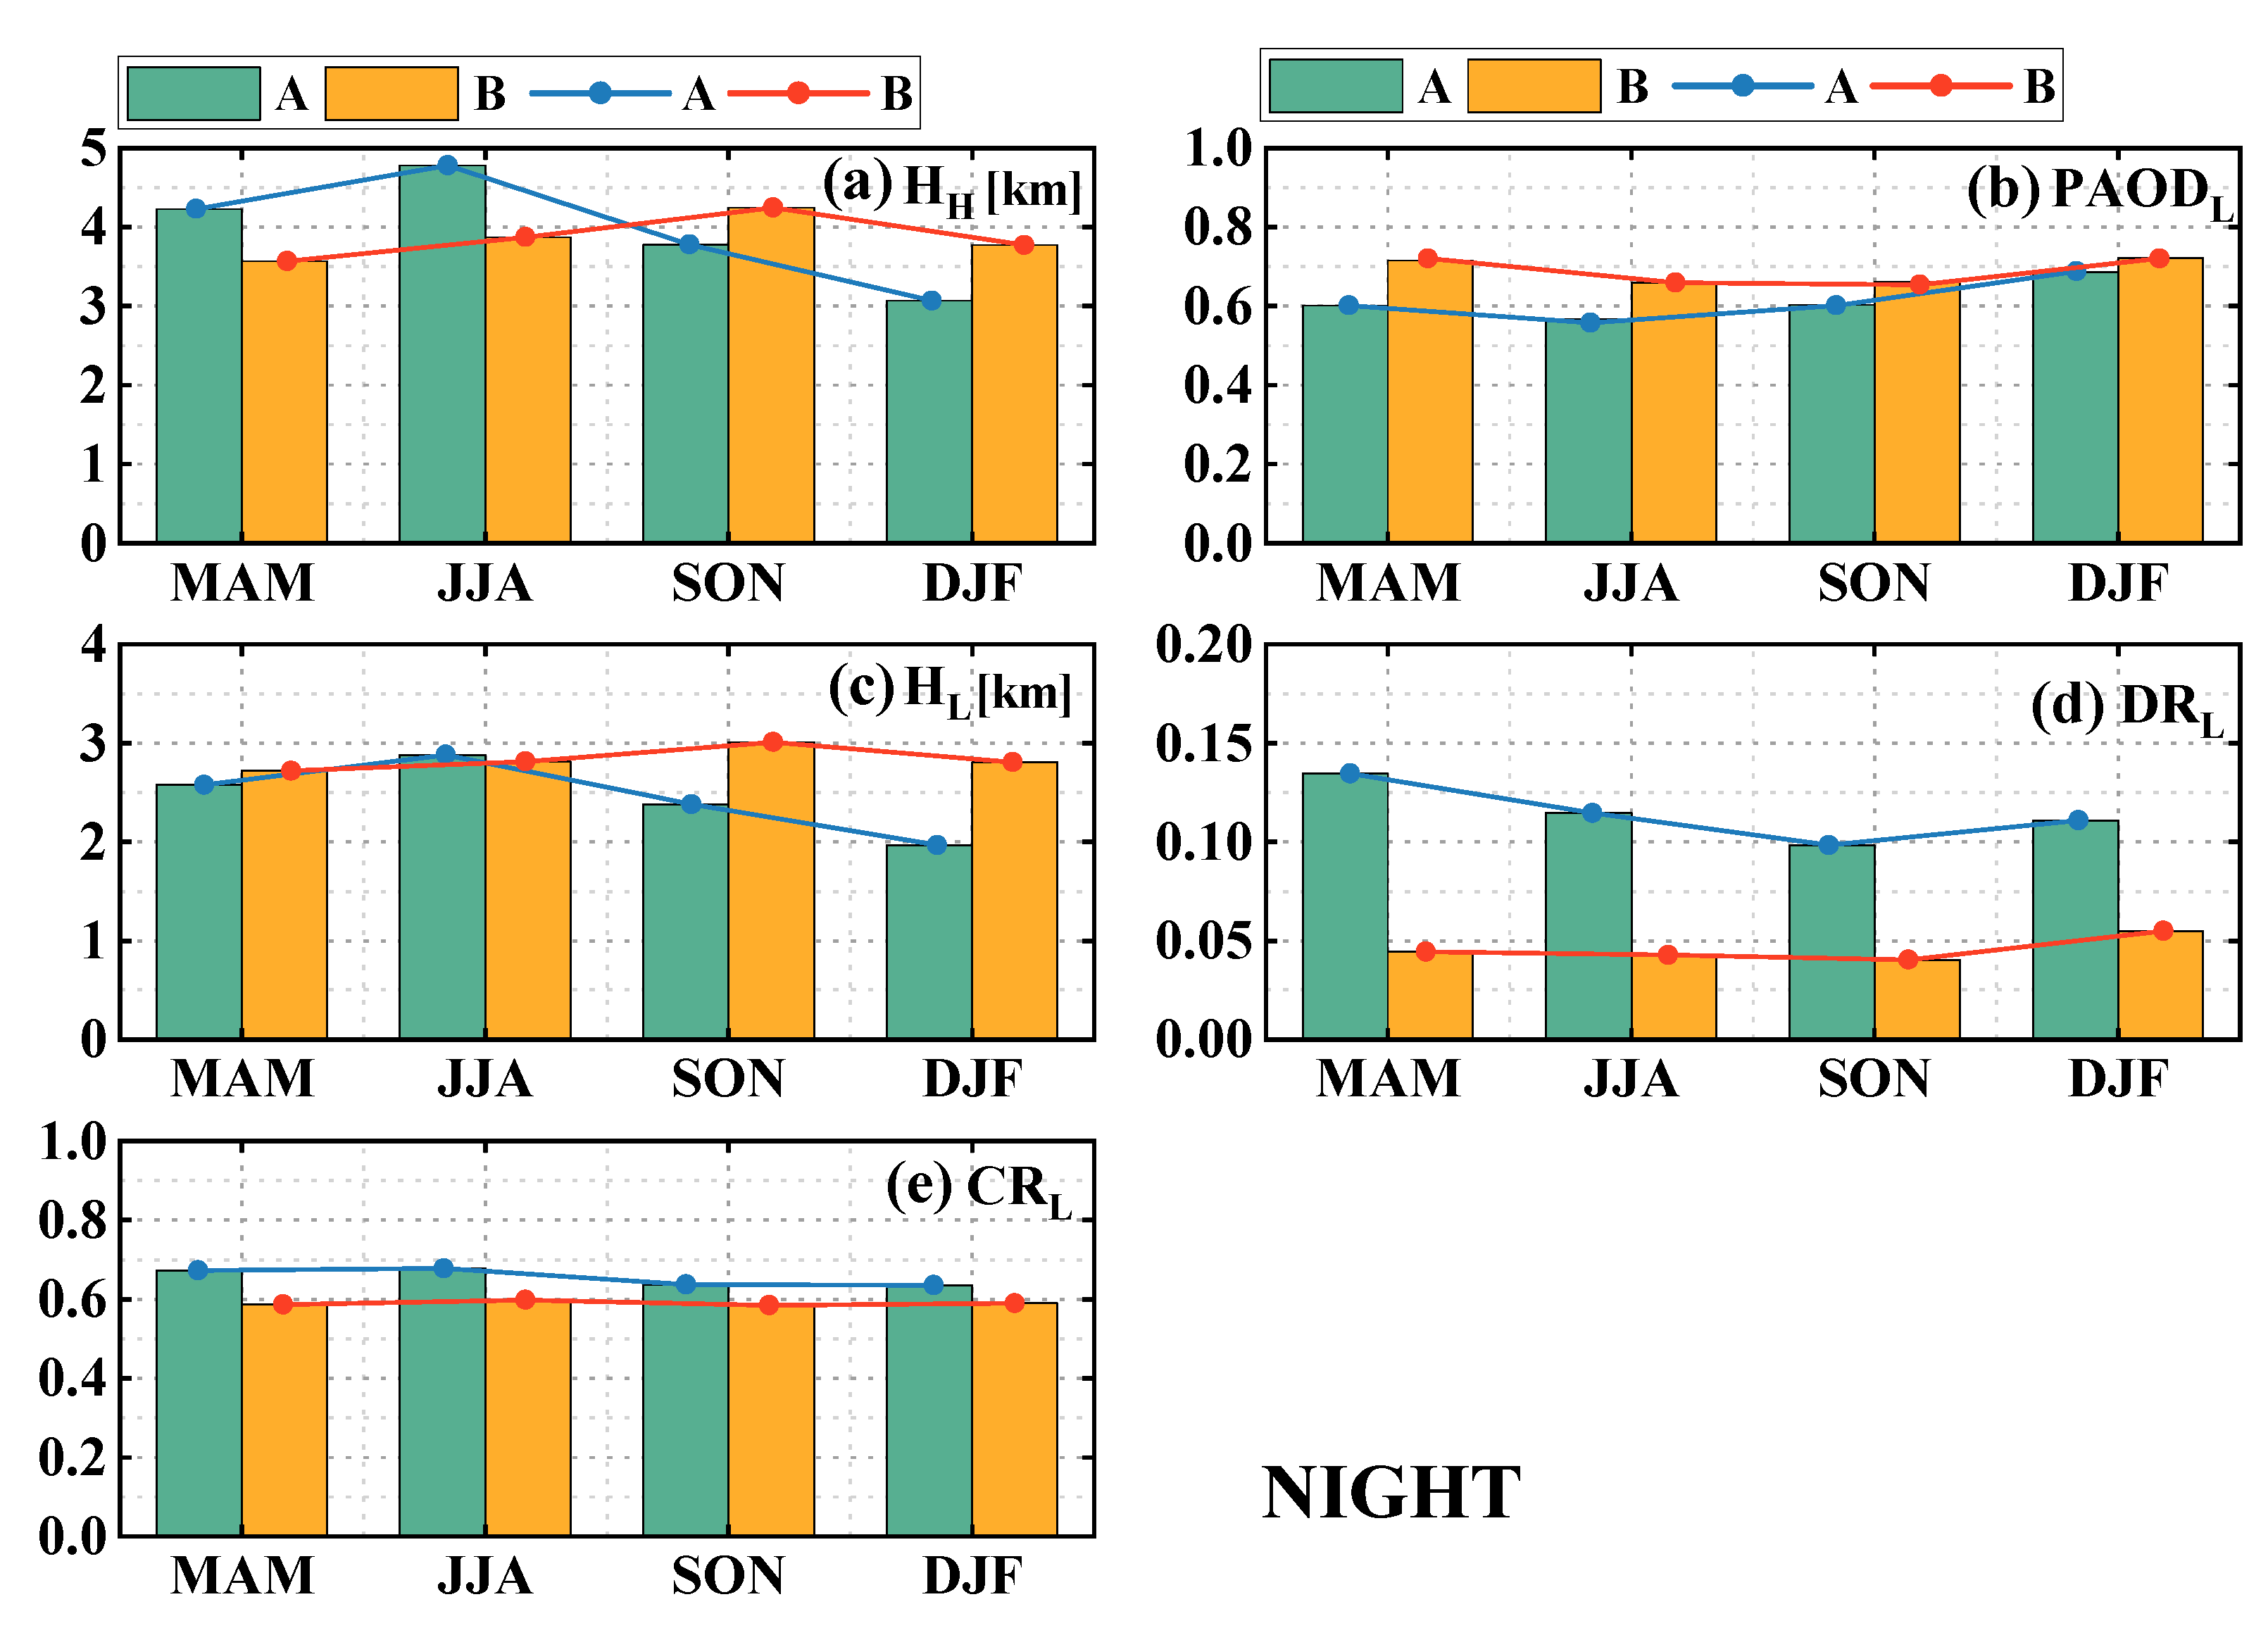
3.2. Seasonal Variations in the African Aerosol Layer

We conducted seasonal statistical analysis of parameters during daytime and nighttime over Africa (from Figure 6, Figure 7, Figure 8, Figure 9, Figure 10, Figure 11, Figure 12 and Figure 13). March–May AOD (AODT, AODL) high values (daytime AODT: ~0.46; nighttime AODT: ~0.53; daytime AODL: ~0.28; nighttime AODL: ~0.34) were mainly concentrated in the south of the Sahara Desert, in Guinea, probably due to high dust loadings carried by strong northeasterly trade winds. June–August showed that AOD (AODT, AODL) was still high in the Sahara Desert region of northern Africa (daytime AODT: ~0.6; nighttime AODT: ~0.7; daytime AODL: ~0.3; nighttime AODL: ~0.4). The Sahara Desert had large quantities of dust during the summer months at this time, resulting in excessive AOD values [44,45]. At this time in the Congo Basin region, atmospheric aerosols were dominated by organic carbon (OC) and black carbon (BC) aerosols emitted from tropical rainforests and savannas [34,51]. High AOD (AODT, AODL) values in September–November (daytime AODT: ~0.5; nighttime AODT: ~0.6; daytime AODL: ~0.3; nighttime AODL: ~0.45) were mainly in the highland forest areas of Zambia and Angola in southern Africa, probably due to the increased aerosol loadings emitted during this season due to frequent fires [33]. In December–February, high AOD (AODT, AODL) values (daytime AODT: ~0.6; nighttime AODT: ~0.6; daytime AODL: ~0.3; nighttime AODL: ~0.35) were mainly concentrated in equatorial regions. The reason can be that northeast trade winds and southeast trade winds formed the equatorial easterly wind during this season, which blew northern and southern aerosols to the equator [51]. Aerosols gathered in the equatorial region, leading to increases in the AOD values. From the seasonal variation plots (Figure 10, Figure 11, Figure 12 and Figure 13), AODT values in area A were higher in March–August (daytime: ~0.32; nighttime: ~0.33) than in September–February (daytime: ~0.25; nighttime: ~0.22), which was roughly for the same reason stated above. The dominant aerosol type in North Africa was sand-dust aerosol, which existed with the highest frequency in spring and summer, followed by autumn, and the lowest in winter [44].
According to spatial distribution maps (Figure 6 and Figure 8), N values from March to August were higher in northern Africa (daytime: ~1.88; nighttime: ~2.15) than in southern Africa (daytime: ~1.54; nighttime: ~1.80). Because northern Africa had spring–summer seasons and high temperatures at this time, atmospheric vertical convection was stronger, leading to more aerosol layer stratifications and high N values. From December to February, high N values (2~2.5) were mainly distributed in the Guinea Gulf near the equator, which can be due to the equator’s high temperature enhancing atmospheric vertical convection, resulting in the obvious aerosol layer stratifications [51]. In southern Africa, the N values (daytime: ~1.54; nighttime: ~1.80) were not high in all seasons, which can be attributed to the high-altitude terrain here. The relatively low temperature throughout the year could lead to weak vertical convections and stratifications. High values of TL (~2 km) were mainly found in northern Africa and the Congo Basin region. Northern Africa was the main source of high dust aerosol contents, resulting in thick aerosol layers; the Congo Basin is densely populated, and human activities could generate a large amount of localized anthropogenic aerosols [50]. More socio-economic activities and energy consumption (petroleum and minerals industries) can also bring more serious atmospheric pollution, resulting in high aerosol loadings and thicker aerosol layers [47].
HL, HH, and BL will have strong positive correlations with geographic elevation according to their definitions. The higher the geographic altitude, the higher the HL, HH, and BL values. Therefore, the HL, HH, and BL values (HL, daytime: ~3.01 km; nighttime: ~2.84 km; HH, daytime: ~3.53 km; nighttime: ~3.86 km; BL, daytime: ~1.49 km; nighttime: ~1.44 km) were higher in the southern African plateau in all four seasons. Meanwhile, due to the influence of sand and dust aerosols in the spring and summer seasons in northern Africa, the temperature was higher, and atmospheric vertical convection was strong. Liftings of the sand and dust layers were obvious, which will lead to larger values of HL, HH, and BL (HL, daytime: ~2.73 km; nighttime: ~3.10 km; HH, daytime: ~4.01 km; nighttime: ~4.50 km; BL, daytime: ~1.49 km; nighttime: ~1.0 km) in spring and summer in northern Africa. In addition, in the northeastern region of Africa, the Ethiopian plateau also had larger HL, HH, and BL values during all four seasons due to higher terrain elevations.
Low PAODL values indicate small AOD proportions of the lowest aerosol layers and more stratification of aerosol layers. PAODL values (spring, daytime: ~0.69; nighttime: ~0.60; summer, daytime: ~0.69; nighttime: ~0.57; autumn, daytime: ~0.73; nighttime: ~0.60) were lower in spring, summer, and autumn in northern Africa. Frequent outbreaks of dust combined with higher temperatures, strong atmospheric vertical convection, and greater stratification will result in a decrease in PAODL values. Meanwhile, in Congo Basin and Guinea Gulf regions, PAODL values were also lower (March–May, daytime: ~0.75; nighttime: ~0.70; June–August, daytime: ~0.70; nighttime: ~0.68; September–November, daytime: ~0.76; nighttime: ~0.71; December–February, daytime: ~0.65; nighttime: ~0.51). The Congo Basin and Guinea Gulf are in the equatorial region, which is mainly dominated by tropical rainforests, and characterized by frequent forest fires, leading to large amounts of black carbon aerosols being emitted into the air. At the same time, the Guinea Gulf has a large population, and increased economic activities will lead to more anthropogenic emissions. Coupled with higher atmospheric temperatures in equatorial regions, atmospheric convections were strong, and atmospheric stratifications were obvious, which would then lead to reduced PAODL values. The DRL values were large in North Africa in all seasons (daytime: ~0.16; nighttime: ~0.11). Because the main aerosol sources were large amounts of dust aerosols in North Africa, they were irregularly shaped [38,46]. The DRL values were low in area B in all four seasons (daytime: ~0.07; nighttime: ~0.04) and did not change significantly, indicating that aerosols in southern Africa were mainly dominated by spherical features [37].
The CRL values of dust aerosols in northern Africa were high in the spring and summer seasons (daytime: 0.77; nighttime: 0.68), which should be attributed to the fact that higher temperatures, stronger vertical convections, and more frequent dust activities in spring and summer can bring larger-sized dust particles into the air. On the other hand, lower temperatures weakened the vertical convections, and fewer dust activities in fall and winter can lead to decreased particle sizes. Large CRL values in Equatorial Guinea regions in all four seasons (daytime: ~0.81; nighttime: ~0.65) can be attributed to high anthropogenic emissions and economic activities. Meanwhile, burnings of local tropical rainforests and savannahs will emit large quantities of black carbon aerosols and organic carbon aerosols. Moreover, dust aerosols can be blown from northern Africa to the Guinea Bay region due to north-easterly trade winds in December–February, resulting in large CRL values here. In the coastal and highland areas of southern Africa, the CRL values were higher in December–May (daytime: ~0.82; nighttime: ~0.59). The reason probably was that higher temperatures in these two seasons can lead to large amounts of seawater evaporation. High humidity in the air can promote the formation of particles coated by moisture [33,34,48,49]. Therefore, aerosol particles had large sizes with spherical characteristics.

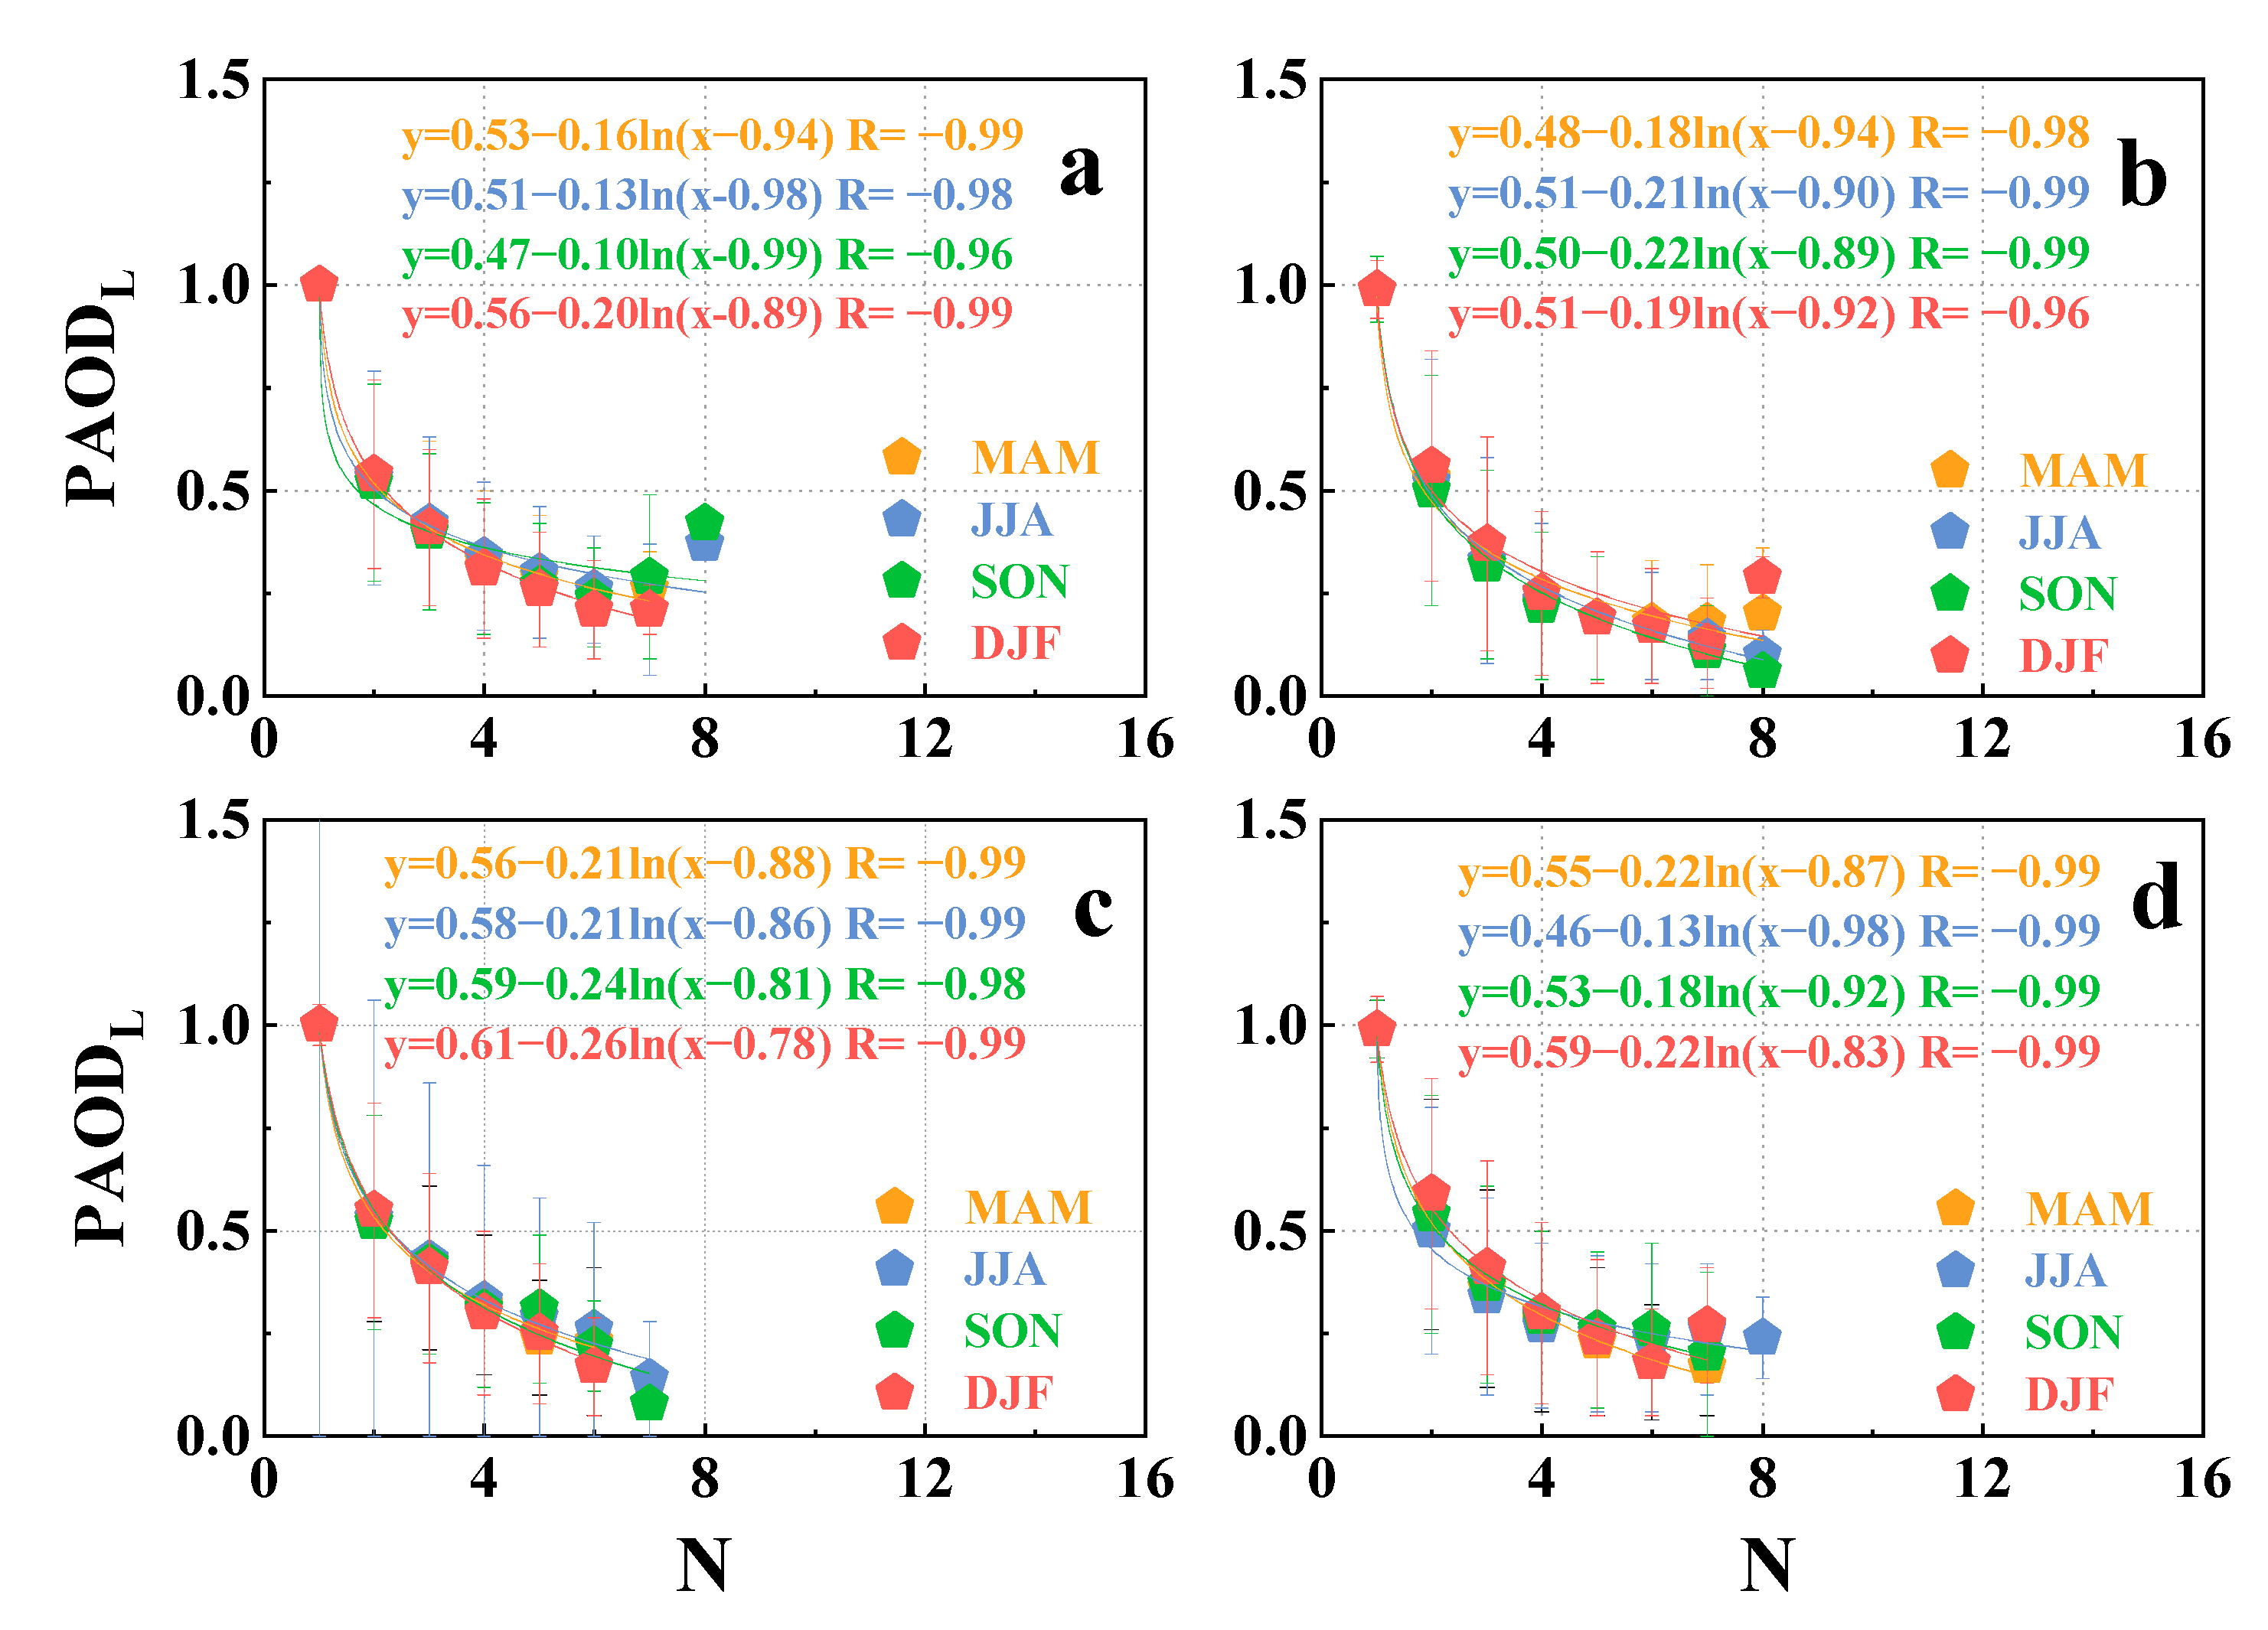
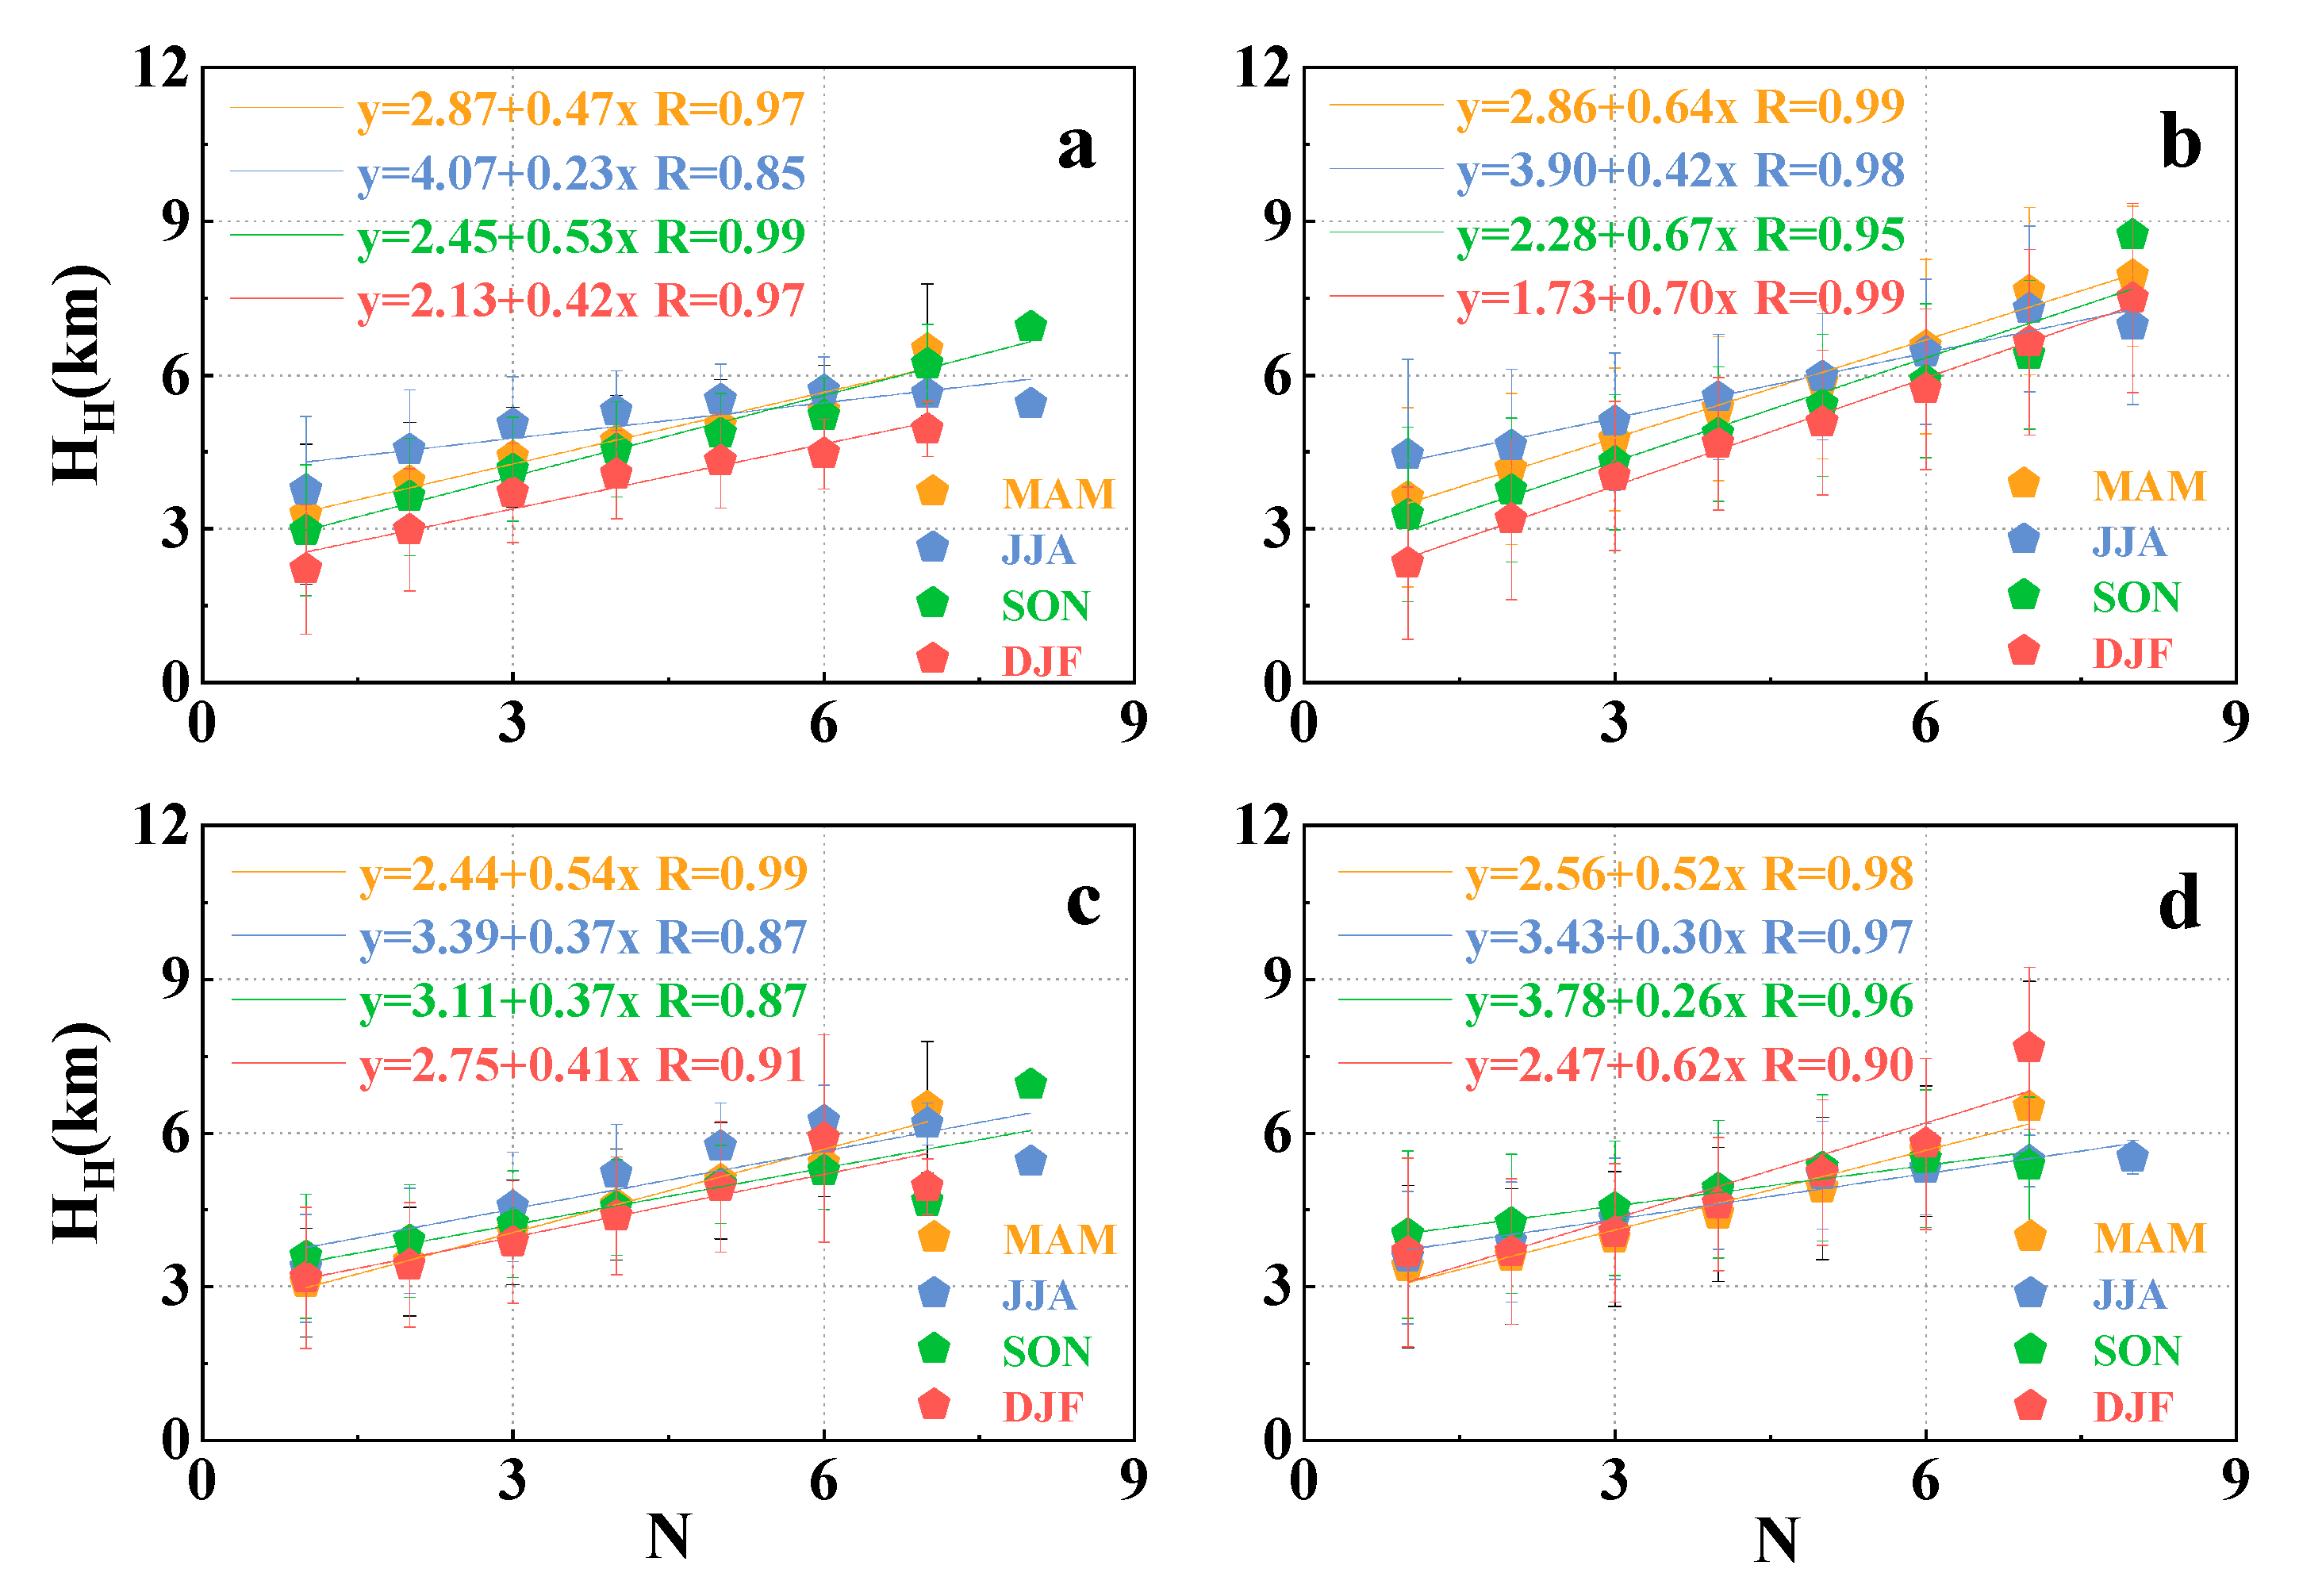
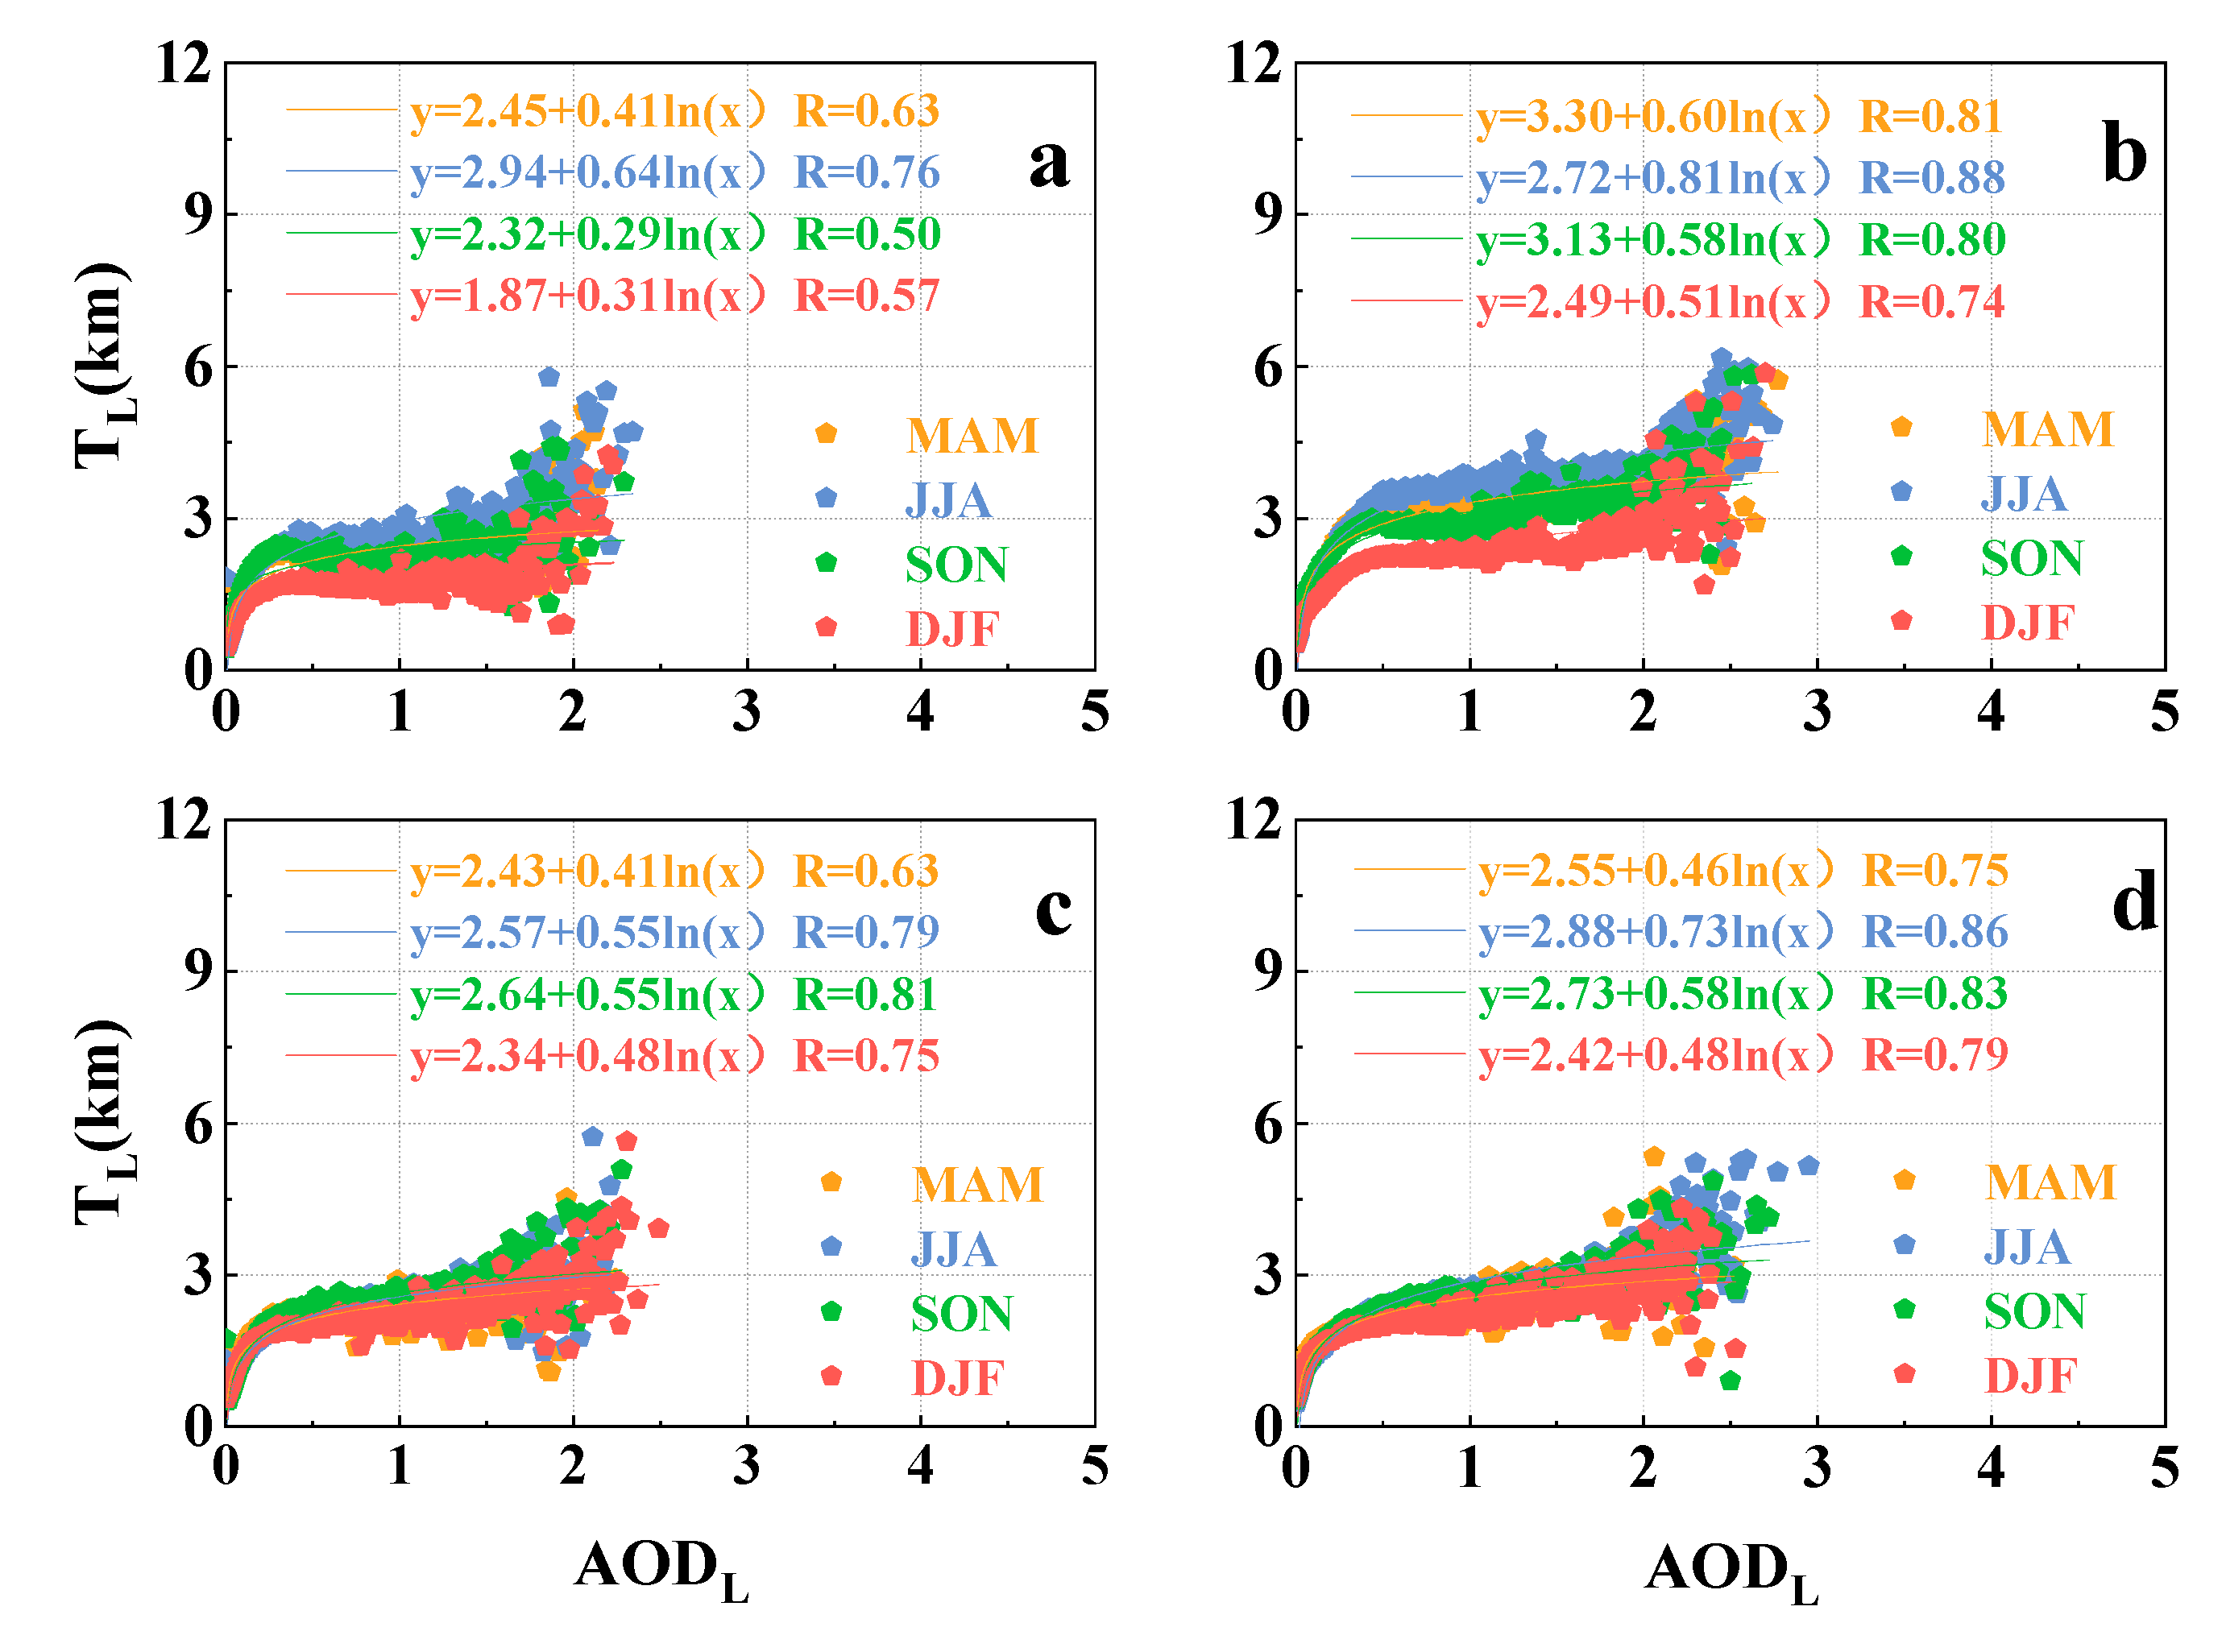
3.3. Correlations of Aerosol Properties over Africa

We analyzed the correlations of aerosol properties over Africa. Figure 14 depicts the correlation between N and PAODL over Africa. Results showed that N and PAODL values all had significant negative correlations over A and B at daytime and nighttime. The larger the N, the smaller the PAODL. Therefore, the greater the number of layers, the lower the proportion of the lowest aerosol layer’s AOD; i.e., PAODL values became smaller. Our results were consistent with the results of existing studies [52,53].
Figure 15 depicts the correlation between N and HH over Africa. As shown, N and HH had strong positive correlations in all regions at daytime and nighttime. The higher the HH, the greater the N values. Because more aerosol layers were generally due to strong atmospheric vertical convection, leading to liftings of the aerosol layers, the top heights of the highest aerosol layers increased. At the same time, the more frequent the aerosol stratifications, the greater the number of aerosol layers. This result was consistent with the existing knowledge reported for the Yellow River Basin and the Tibetan Plateau [52,54].
Figure 16 depicts more significant positive correlations between AODL and TL. The thicker the aerosol layers, the greater their light obstruction, i.e., the aerosol layers’ optical thickness increased. Similar findings have been observed in the Pakistan region and Tibet [52,53].
A comparison of AOD values between Africa and previous study areas (the Tibetan Plateau [52], Pakistan [53], and the Yellow River Basin [54]) showed that AOD values were mainly related to the climate environment and human activities. And it was found that AOD values in the Tibetan Plateau were lower than those in Africa. The AOD values of Pakistan and some parts of the Yellow River basin were higher than that of Africa. The main reason why Pakistan had higher AOD than Africa was cross-border pollution, human activities, and industrial pollution discharge. The main reason why the Yellow River Basin had higher AOD than Africa was that the urban agglomeration close to the eastern part of the region is one of the most polluted places in China. Africa is dominated by tropical steppe and tropical desert climates, and the high dust content would lead to a large aerosol load. The Tibetan Plateau is dominated by a plateau climate, low humidity and temperature, and low aerosol load.
For all the regions studied, HH, HL, and BL had strong positive correlations with altitude. Compared with Pakistan, the Tibetan Plateau, and the Yellow River basin, the higher the temperature, the larger the N values, the more obvious the aerosol layer stratifications, and vice versa. In all the studied areas, PAODL values had strong negative correlations with N values. The lower the N values, the fewer the aerosol layers stratifications, and the larger the PAODL values. For all regions, it was observed that seasonal variations in PAODL values were lower in summer and higher in winter. This was due to the strong air convection caused by high temperatures in summer and weak convections caused by low temperatures in winter.
By comparison, it was found that aerosol CRL values in Africa were all large (~0.8), while non-spherical aerosols were dominated by dust in northern Africa. And the spherical aerosols enveloped by water vapor in southern Africa were familiar. The spatial distribution of aerosol particle size in Pakistan showed a gradually increasing trend from north to south, because the southern region was close to the vast desert area, and aerosols had strong non-spherical characteristics. The aerosol particle size in the Yellow River Basin was slightly smaller than that in Africa (~0.7), and the eastern Tibetan Plateau and Loess Plateau show strong aerosol non-spherical characteristics, which may be due to the more frequent occurrence of dust aerosols, while the North China Plain showed more spherical aerosols.

4. Conclusions

In this study, we explored aerosol layers’ optical–physical characteristics over Africa from 2007 to 2019 using CALIPSO satellite level 2 products. Interannual and seasonal variations in 10 parameters during daytime and nighttime were analyzed and discussed. The conclusions were as follows:
(1)
The Sahara Desert accumulated large amounts of dust aerosols during the spring and summer months, resulting in high AOD (AODT, AODL) values. Organic carbon (OC) and black carbon (BC) aerosols emitted from the Congo Basin region will lead to an increase in AOD (AODT, AODL) values. Equatorial Guinea Gulf region’s perennial high temperatures enhanced atmospheric vertical convections and aerosol stratifications in December–February, leading to high N values.
(2)
Thicker aerosol layers had a high-frequency occurrence in northern Africa and the Congo Basin regions because of the high content of dust aerosols and artificial aerosol loading. Low values of PAODL indicated more stratified aerosol layers. PAODL values decreased in the Equatorial Guinea Gulf region because of high temperatures, strong convections, and obvious stratifications.
(3)
Aerosols in region B were mainly dominated by spherical features. Irregularly shaped aerosols were mainly observed in region A. Higher DRL values were observed in the A region in spring and summer because of frequent dust activities. DRL values were also high in the southern B region from December to May. This was due to anthropogenic discharges from industrial activities, animal husbandry, and tourism. Also due to the high humidity that occurred in this season, particles were covered by a water envelope, which can increase the size of particles.

Author Contributions

Conceptualization, M.Z. and F.L.; methodology, D.W.; software, P.M.; validation, X.C. and P.Q.; formal analysis, P.M.; investigation, X.C.; resources, D.W.; data curation, P.M.; writing—original draft preparation, P.M. and X.C.; writing—review and editing, M.Z.; visualization, P.Q.; supervision, M.Z. and W.G.; project administration, M.Z. and L.B.L.; funding acquisition, M.Z. All authors have read and agreed to the published version of the manuscript.

Funding

This research was funded by the support program of Henan provincial colleges and universities scientific and technological innovation talent (No. 24HASTIT018); the Programs for Science and Technology Development of Henan Province (No. 232102320069); the Nanyang Normal University Scientific Research Project (No. 2020QN033); the Overseas Expertise Introduction Center for Discipline Innovation of Watershed Ecological Security in the Water Source Area of the Middle Route of South-to-North Water Diversion (No. D23015).

Institutional Review Board Statement

Not applicable.

Informed Consent Statement

Not applicable.

Data Availability Statement

Not applicable.

Acknowledgments

We thank the editors for assisting in the linguistic refinement of this manuscript. And we also thank NASA for providing datasets (https://subset.larc.nasa.gov/calipso/login.php, accessed on 1 March 2023).

Conflicts of Interest

The authors declare no conflict of interest.

References

  1. Kaufman, Y.J.; Tanré, D.; Boucher, O. A Satellite View of Aerosols in the Climate System. Nature 2002, 419, 215–223. [Google Scholar] [CrossRef]
  2. Ackerman, A.S.; Kirkpatrick, M.P.; Stevens, D.E.; Toon, O.B. The Impact of Humidity above Stratiform Clouds on Indirect Aerosol Climate Forcing. Nature 2004, 432, 1014–1017. [Google Scholar] [CrossRef]
  3. Huang, R.J.; Zhang, Y.; Bozzetti, C.; Ho, K.F.; Cao, J.J.; Han, Y.; Daellenbach, K.R.; Slowik, J.G.; Platt, S.M.; Canonaco, F. High Secondary Aerosol Contribution to Particulate Pollution during Haze Events in China. Nature 2014, 514, 218–222. [Google Scholar] [CrossRef]
  4. Kulmala, M.; Kontkanen, J.; Junninen, H.; Lehtipalo, K.; Manninen, H.E.; Nieminen, T.; Petäjä, T.; Sipilä, M.; Schobesberger, S.; Rantala, P.; et al. Direct Observations of Atmospheric Aerosol Nucleation. Science 2013, 339, 943–946. [Google Scholar] [CrossRef]
  5. Kaiser, J. How Dirty Air Hurts the Heart. Science 2015, 307, 1858–1859. [Google Scholar] [CrossRef]
  6. Kaiser, J.; Granmar, M. Mounting Evidence Indicts Fine-Particle Pollution. Science 2005, 307, 1858–1861. [Google Scholar] [CrossRef]
  7. Menon, S.; Hansen, J.; Nazarenko, L.; Luo, Y. Climate Effects of Black Carbon Aerosols in China and India. Science 2002, 297, 2250–2253. [Google Scholar] [CrossRef]
  8. Crutzen, P.J.; Andreae, M.O. Biomass Burning in the Tropics: Impact on Atmospheric Chemistry and Biogeochemical Cycles. Science 1990, 250, 1669–1678. [Google Scholar] [CrossRef]
  9. Jacobson, M.Z. Strong Radiative Heating Due to the Mixing State of Black Carbon in Atmospheric Aerosols. Nature 2001, 409, 695–697. [Google Scholar] [CrossRef]
  10. Ma, N.; Zhao, C.S.; Nowak, A.; Müller, T.; Pfeifer, S.; Cheng, Y.F.; Deng, Z.; Liu, P.F.; Xu, W.Y.; Ran, L.; et al. Aerosol Optical Properties in the North China Plain during Hachi Campaign: An in-Situ Optical Closure Study. Atmos. Chem. Phys. 2011, 11, 9567–9605. [Google Scholar] [CrossRef]
  11. Gautam, R.; Hsu, N.C.; Tsay, S.C.; Lau, K.M.; Holben, B.; Bell, S.; Smirnov, A.; Li, C.; Hansell, R.; Ji, Q.; et al. Accumulation of Aerosols over the Indo-Gangetic Plains and Southern Slopes of the Himalayas: Distribution, Properties and Radiative Effects during the 2009 Pre-Monsoon Season. Atmos. Chem. Phys. Discuss. 2011, 11, 12841–12863. [Google Scholar] [CrossRef]
  12. Wang, H.; Xue, M.; Zhang, X.Y.; Liu, H.L.; Zhou, C.H.; Tan, S.C.; Che, H.Z.; Chen, B.; Li, T. Mesoscale Modeling Study of the Interactions between Aerosols and Pbl Meteorology during a Haze Episode in China Jing-Jin-Ji and Its near Surrounding Region—Part 1: Aerosol Distributions and Meteorological Features. Atmos. Chem. Phys. 2015, 15, 3257–3275. [Google Scholar] [CrossRef]
  13. Shen, X.J.; Sun, J.Y.; Zhang, X.Y.; Zhang, Y.M.; Zhang, L.; Che, H.C.; Ma, Q.L.; Yu, X.M.; Yue, Y.; Zhang, Y.W. Zhang. Characterization of Submicron Aerosols and Effect on Visibility during a Severe Haze-Fog Episode in Yangtze River Delta, China. Atmos. Environ. 2015, 120, 307–316. [Google Scholar] [CrossRef]
  14. Dubovik, O.; Smirnov, A.; Holben, B.N.; King, M.D.; Kaufman, Y.J.; Eck, T.F.; Slutsker, I. Accuracy Assessments of Aerosol Optical Properties Retrieved from Aerosol Robotic Network (Aeronet) Sun and Sky Radiance Measurements. J. Geophys. Res. Atmos. 2000, 105, 9791–9806. [Google Scholar] [CrossRef]
  15. Holben, B.N.; Eck, T.F.; Slutsker, I.A.; Tanré, D.; Buis, J.P.; Setzer, A.; Vermote, E.; Reagan, J.A.; Kaufman, Y.J.; Nakajima, T.; et al. Aeronet—A Federated Instrument Network and Data Archive for Aerosol Characterization. Remote Sens. Environ. 1998, 66, 1–16. [Google Scholar] [CrossRef]
  16. Smirnov, A.; Holben, B.N.; Eck, T.F.; Slutsker, I.; Chatenet, B.; Pinker, R.T. Pinker. Diurnal Variability of Aerosol Optical Depth Observed at Aeronet (Aerosol Robotic Network) Sites. Geophys. Res. Lett. 2002, 29, 301–304. [Google Scholar] [CrossRef]
  17. Ma, Y.; Zhu, Z.; Zhong, L.; Wang, B.; Han, C.; Wang, Z.; Wang, Y.; Lu, L.; Amatya, P.M.; Ma, W.; et al. Combining Modis, Avhrr and in Situ Data for Evapotranspiration Estimation over Heterogeneous Landscape of the Tibetan Plateau. Atmos. Chem. Phys. 2014, 14, 1507–1515. [Google Scholar] [CrossRef]
  18. Remer, L.A.; Kaufman, Y.J.; Tanré, D.; Mattoo, S.; Chu, D.A.; Martins, J.V.; Li, R.R.; Ichoku, C.; Levy, R.C.; Kleidman, R.G.; et al. The Modis Aerosol Algorithm, Products, and Validation. J. Atmos. Sci. 2005, 62, 947–973. [Google Scholar] [CrossRef]
  19. Kahn, R.A.; Gaitley, B.J.; Martonchik, J.V.; Diner, D.J.; Crean, K.A.; Holben, B. Multiangle Imaging Spectroradiometer (Misr) Global Aerosol Optical Depth Validation Based on 2 Years of Coincident Aerosol Robotic Network (Aeronet) Observations. J. Geophys. Res. Atmos. 2005, 110, D10S04. [Google Scholar] [CrossRef]
  20. Shi, Y.; Zhang, J.; Reid, J.S.; Hyer, E.J.; Eck, T.F.; Holben, B.N.; Kahn, R.A. A Critical Examination of Spatial Biases between Modis and Misr Aerosol Products—Application for Potential Aeronet Deployment. Atmos. Meas. Tech. 2011, 4, 2823–2836. [Google Scholar] [CrossRef]
  21. Liu, H.; Remer, L.A.; Huang, J.; Huang, H.-C.; Kondragunta, S.; Laszlo, I.; Oo, M.; Jackson, J.M. Preliminary Evaluation of S-Npp Viirs Aerosol Optical Thickness. J. Geophys. Res. Atmos. 2014, 119, 3942–3962. [Google Scholar] [CrossRef]
  22. Alejandro, S.B.; Koenig, G.G.; Bedo, D.; Swirbalus, T.; Frelin, R.; Woffinden, J.; Vaughan, J.M.; Brown, D.W.; Callan, R.; Davies, P.H.; et al. Atlantic Atmospheric Aerosol Studies: 1. Program Overview and Airborne Lidar. J. Geophys. Res. 1995, 100, 1035–1041. [Google Scholar] [CrossRef]
  23. Niranjan, K.; Madhavan, B.L.; Sreekanth, V. Micro Pulse Lidar Observation of High Altitude Aerosol Layers at Visakhapatnam Located on the East Coast of India. Geophys. Res. Lett. 2007, 34, 340–354. [Google Scholar] [CrossRef]
  24. Pappalardo, G.; Amodeo, A.; Pandolfi, M.; Wandinger, U.; Ansmann, A.; Bösenberg, J.; Matthias, V.; Amiridis, V.; De Tomasi, F.; Frioud, M.; et al. Aerosol Lidar Intercomparison in the Framework of the Earlinet Project. 3. Raman Lidar Algorithm for Aerosol Extinction, Backscatter, and Lidar Ratio. Appl. Opt. 2004, 43, 5370–5385. [Google Scholar] [CrossRef]
  25. Winker, D.M.; Vaughan, M.A.; Omar, A.; Hu, Y.; Powell, K.A.; Liu, Z.; Hunt, W.H.; Young, S.A. Overview of the Calipso Mission and Caliop Data Processing Algorithms. J. Atmos. Ocean. Technol. 2009, 26, 2310–2323. [Google Scholar] [CrossRef]
  26. Liu, D.; Wang, Z.; Liu, Z.; Winker, D.; Trepte, C. A Height Resolved Global View of Dust Aerosols from the First Year Calipso Lidar Measurements. J. Geophys. Res. Atmos. 2008, 113, 280–288. [Google Scholar] [CrossRef]
  27. Gui, K.; Che, H.; Zheng, Y.; Zhao, H.; Yao, W.; Li, L.; Zhang, L.; Wang, H.; Wang, Y.; Zhang, X. Three-Dimensional Climatology, Trends, and Meteorological Drivers of Global and Regional Tropospheric Type-Dependent Aerosols: Insights from 13 Years (2007–2019) of Caliop Observations. Atmos. Chem. Phys. 2021, 21, 15309–15336. [Google Scholar] [CrossRef]
  28. Winker, D.M.; Pelon, J.; Coakley, J.A., Jr.; Ackerman, S.A.; Charlson, R.J.; Colarco, P.R.; Flamant, P.; Fu, Q.; Hoff, R.M.; Kittaka, C.; et al. The Calipso Mission: A Global 3d View of Aerosols and Clouds. Bull. Am. Meteorol. Soc. 2010, 91, 1211–1229. [Google Scholar] [CrossRef]
  29. Winker, D.M.; Pelon, J.R.; McCormick, M.P. The Calipso Mission: Spaceborne Lidar for Observation of Aerosols and Clouds. In Proceedings of the 3rd International Asia-Pacific Environmental Remote Sensing Remote Sensing of the Atmosphere, Ocean, Environment, and Space, Hangzhou, China, 21 March 2003. [Google Scholar]
  30. Winker, D.M.; Hunt, W.H.; McGill, M.J. Initial Performance Assessment of Caliop. Geophys. Res. Lett. 2007, 34, 228–262. [Google Scholar] [CrossRef]
  31. IPCC Working Group, I. Climate Change 2013: The Physical Science Basis. Contrib. Work. 2013, 43, 866–871. [Google Scholar]
  32. Yu, H.; Chin, M.; Yuan, T.; Bian, H.; Remer, L.A.; Prospero, J.M.; Omar, A.; Winker, D.; Yang, Y.; Zhang, Y.; et al. The Fertilizing Role of African Dust in the Amazon Rainforest: A First Multiyear Assessment Based on Data from Cloud-Aerosol Lidar and Infrared Pathfinder Satellite Observations. Geophys. Res. Lett. 2015, 42, 1984–1991. [Google Scholar] [CrossRef]
  33. Korontzi, S.; Ward, D.E.; Susott, R.A.; Yokelson, R.J.; Justice, C.O.; Hobbs, P.V.; Smithwick, E.A.H.; Hao, W.M. Seasonal Variation and Ecosystem Dependence of Emission Factors for Selected Trace Gases and Pm 2.5 for Southern African Savanna Fires. J. Geophys. Res. Atmos. 2003, 108, 4758. [Google Scholar] [CrossRef]
  34. Ward, D.E.; Hao, W.M.; Susott, R.A.; Babbitt, R.E.; Shea, R.W.; Kauffman, J.B.; Justice, C.O. Justice. Effect of Fuel Composition on Combustion Efficiency and Emission Factors for African Savanna Ecosystems. J. Geophys. Res. Atmos. 1996, 101, 23569–23576. [Google Scholar] [CrossRef]
  35. Prospero, J.M.; Lamb, P.J. African Droughts and Dust Transport to the Caribbean: Climate Change Implications. Science 2003, 302, 1024–1027. [Google Scholar] [CrossRef]
  36. Moulin, C.; Lambert, C.E.; Dulac, F.; Dayan, U. Control of Atmospheric Export of Dust from North Africa by the North Atlantic Oscillation. Nature 1997, 387, 691–694. [Google Scholar] [CrossRef]
  37. Engelbrecht, J.P.; Swanepoel, L.; Chow, J.C.; Watson, J.G.; Egami, R.T. Pm2.5 and PM10 Concentrations from the Qalabotjha Low-Smoke Fuels Macro-Scale Experiment in South Africa. Environ. Monit. Assess. 2001, 69, 1–15. [Google Scholar] [CrossRef]
  38. Viana, M.; Querol, X.; Alastuey, A.; Cuevas, E.; Rodrıguez, S. Influence of African Dust on the Levels of Atmospheric Particulates in the Canary Island Air Quality Network. Atmos. Environ. 2002, 36, 5861–5875. [Google Scholar] [CrossRef]
  39. Bryant, R.G.; Bigg, G.R.; Mahowald, N.M.; Eckardt, F.D.; Ross, S.G. Dust Emission Response to Climate in Southern Africa. J. Geophys. Res. Atmos. 2007, 112, D09207. [Google Scholar] [CrossRef]
  40. Ngaira, J.K.W. Impact of Climate Change on Agriculture in Africa by 2030. Sci. Res. Essays 2007, 2, 238–243. [Google Scholar]
  41. Dajuma, A.; Sylla, M.B.; Tall, M.; Almazroui, M.; Yassa, N.; Diedhiou, A.; Giorgi, F. Projected Expansion of Hottest Climate Zones over Africa during the Mid and Late 21st Century. Environ. Res. Clim. 2023, 2, 025002. [Google Scholar] [CrossRef]
  42. Tackett, J.L.; Winker, D.M.; Getzewich, B.J.; Vaughan, M.A.; Young, S.A.; Kar, J. Calipso Lidar Level 3 Aerosol Profile Product: Version 3 Algorithm Design. Atmos. Meas. Tech. 2018, 11, 4129–4152. [Google Scholar] [CrossRef] [PubMed]
  43. Meng, L.; Gao, H.W.; Yu, Y.; Yao, X.H.; Gao, Y.; Zhang, C.; Fan, L. A New Approach Developed to Study Variability in North African Dust Transport Routes over the Atlantic during 2001–2015. Geophys. Res. Lett. 2017, 44, 10026–10035. [Google Scholar] [CrossRef]
  44. Jankowiak, I.; Tanré, D. Satellite Climatology of Saharan Dust Outbreaks: Method and Preliminary Results. J. Clim. 1992, 5, 646–656. [Google Scholar] [CrossRef]
  45. Tanaka, T.Y.; Chiba, M. A Numerical Study of the Contributions of Dust Source Regions to the Global Dust Budget. Glob Planet Chang. 2006, 52, 88–104. [Google Scholar] [CrossRef]
  46. Li, X.; Savoie, D.; Voss, K.; Prospero, J.M.; Maring, H. Dominance of Mineral Dust in Aerosol Light-Scattering in the North Atlantic Trade Winds. Nature 1996, 380, 416–419. [Google Scholar] [CrossRef]
  47. Guenther, A.; Hewitt, C.N.; Erickson, D.; Fall, R.; Geron, C.; Graedel, T.; Harley, P.; Klinger, L.; Lerdau, M.; McKay, W.A.; et al. A Global Model of Natural Volatile Organic Compound Emissions. J. Geophys. Res. Atmos. 1995, 100, 8873–8892. [Google Scholar] [CrossRef]
  48. Roth, B.; Okada, K. On the Modification of Sea-Salt Particles in the Coastal Atmosphere. Atmos. Environ. 1998, 32, 1555–1569. [Google Scholar] [CrossRef]
  49. Sievering, H.; Cainey, J.; Harvey, M.; McGregor, J.; Nichol, S.; Quinn, P. Aerosol Non-Sea-Salt Sulfate in the Remote Marine Boundary Layer under Clear-Sky and Normal Cloudiness Conditions: Ocean-Derived Biogenic Alkalinity Enhances Sea-Salt Sulfate Production by Ozone Oxidation. J. Geophys. Res. Atmos. 2004, 109, 47–53. [Google Scholar] [CrossRef]
  50. Tegen, I.; Lacis, A.A.; Fung, I. The Influence on Climate Forcing of Mineral Aerosols from Disturbed Soils. Nature 1996, 380, 419–422. [Google Scholar] [CrossRef]
  51. Dagan, G.; Chemke, R. The Effect of Subtropical Aerosol Loading on Equatorial Precipitation. Geophys. Res. Lett. 2016, 43, 11048–11056. [Google Scholar] [CrossRef]
  52. Zhang, M.; Wang, L.; Bilal, M.; Gong, W.; Zhang, Z.; Guo, G. The Characteristics of the Aerosol Optical Depth within the Lowest Aerosol Layer over the Tibetan Plateau from 2007 to 2014. Remote Sens. 2018, 10, 696. [Google Scholar] [CrossRef]
  53. Zhang, M.; Su, B.; Bilal, M.; Atique, L.; Usman, M.; Qiu, Z.; Ali, A.; Han, G. An Investigation of Vertically Distributed Aerosol Optical Properties over Pakistan Using Calipso Satellite Data. Remote Sens. 2020, 12, 2183. [Google Scholar] [CrossRef]
  54. Zhang, M.; Liu, J.; Bilal, M.; Zhang, C.; Zhao, F.; Xie, X.; Khedher, K.M. Optical and Physical Characteristics of the Lowest Aerosol Layers over the Yellow River Basin. Atmophere 2019, 10, 638. [Google Scholar] [CrossRef]
Figure 1. Topographic map of Africa. A: northern plains and desert regions; B: south-ern highlands regions.
Atmosphere 14 01524 g001
Figure 2. Interannual variation in the optical properties of African aerosol layers during daytime from 2007 to 2019. (a) AODT, (b) AODL, (c) N, (d) TL, (e) BL (A: plains area; B: highland area).
Atmosphere 14 01524 g002
Figure 3. Interannual variation in the optical properties of African aerosol layers during daytime from 2007 to 2019. (a) HH, (b) PAODL, (c) HL, (d) DRL, (e) CRL (A: plains area; B: highland area).
Atmosphere 14 01524 g003
Figure 4. Interannual variation in the optical properties of African aerosol layers during nighttime from 2007 to 2019. (a) AODT, (b) AODL, (c) N, (d) TL, (e) BL (A: plains area; B: highland area).
Atmosphere 14 01524 g004
Figure 5. Interannual variation in the optical properties of African aerosol layers during nighttime from 2007 to 2019. (a) HH, (b) PAODL, (c) HL, (d) DRL, (e) CRL (A: plains area; B: highland area).
Atmosphere 14 01524 g005
Figure 6. Seasonal spatial distribution of AODT, AODL, N, TL, and BL over Africa during daytime.
Atmosphere 14 01524 g006
Figure 7. Seasonal spatial distribution of HH, PAODL, HL, DRL, and CRL over Africa during daytime.
Atmosphere 14 01524 g007
Figure 8. Seasonal spatial distribution of AODT, AODL, N, TL, and BL over Africa during nighttime.
Atmosphere 14 01524 g008
Figure 9. Seasonal spatial distribution of HH, PAODL, HL, DRL, and CRL over Africa during nighttime.
Atmosphere 14 01524 g009
Figure 10. Seasonal variation in the optical properties of the aerosol layer over Africa during daytime from 2007 to 2019. (a) AODT, (b) AODL, (c) N, (d) TL, and (e) BL (A: plains area; B: highland area).
Atmosphere 14 01524 g010
Figure 11. Seasonal variation in the optical properties of the aerosol layer over Africa during daytime from 2007 to 2019. (a) HH, (b) PAODL, (c) HL, (d) DRL, and (e) CRL (A: plains area; B: highland area).
Atmosphere 14 01524 g011
Figure 12. Seasonal variation in the optical properties of the aerosol layer over Africa at night from 2007 to 2019. (a) AODT, (b) AODL, (c) N, (d) TL, and (e) BL (A: plains area; B: highland area).
Atmosphere 14 01524 g012
Figure 13. Seasonal variation in the optical properties of the aerosol layer over Africa at night from 2007 to 2019. (a) HH, (b) PAODL, (c) HL, (d) DRL, and (e) CRL (A: plains area; B: highland area).
Atmosphere 14 01524 g013
Figure 14. Correlation of N and PAODL over Africa from 2007 to 2019 ((a) northern plains daytime; (b) northern plains nighttime; (c) southern plateau daytime; (d) southern plateau nighttime).
Atmosphere 14 01524 g014
Figure 15. Correlation of N and HH over Africa from 2007 to 2019 ((a) northern plains daytime; (b) northern plains nighttime; (c) southern plateau daytime; (d) southern plateau nighttime).
Atmosphere 14 01524 g015
Figure 16. Correlation of AODL and TL over Africa from 2007 to 2019 ((a) northern plains daytime; (b) northern plains nighttime; (c) southern plateau daytime; (d) southern plateau nighttime).
Atmosphere 14 01524 g016
Table 1. An abbreviated list of aerosol optical–physical parameters is in this paper.
ParameterAbbreviation
AOD of the lowest aerosol layerAODL
Total AOD of all aerosol layersAODT
The base height of the lowest aerosol layerBL
Top height of the lowest aerosol layerHL
Depolarization ratio of the lowest aerosol layerDRL
Top height of the highest aerosol layerHH
Thickness of the lowest aerosol layerTL
Number of aerosol layersN
Specific gravity of the lowest aerosol layer AOD PAODL
Color ratio of the lowest aerosol layerCRL
Disclaimer/Publisher’s Note: The statements, opinions and data contained in all publications are solely those of the individual author(s) and contributor(s) and not of MDPI and/or the editor(s). MDPI and/or the editor(s) disclaim responsibility for any injury to people or property resulting from any ideas, methods, instructions or products referred to in the content.

