Abstract
The typical diurnal variability of tropospheric winds over West Sumatra and their changes associated with El Niño Southern Oscillation, Quasi-Biennial Oscillation, Madden–Julian Oscillations and convectively coupled Kelvin waves during the extended boreal winter season are investigated based on nineteen years of observations from Equatorial Atmosphere Radar in Kototabang, Indonesia. Sub-diurnal wind variability is assessed based on the amplitude and phase of the diurnal (24 h) and semidiurnal (12 h) modes.The results show that composite diurnal variability is dominated by cloud-induced circulation and thermal tides. Although these sub-diurnal modes do not change the daily mean wind direction, they modulate velocities throughout the day. Typical diurnal evolution of the vertical wind component is consistent with changes in the latent heating profiles associated with the evolution of a cloud field from cumulus before noon to deep convection in the afternoon and stratiform clouds in the evening. El Niño Southern Oscillation and Quasi-Biennial Oscillation affect the mean tropospheric winds, throughout the troposphere and above 250 hPa, respectively, but do not affect sub-diurnal amplitudes. Eastward propagating Madden–Julian Oscillations and convectively coupled Kelvin waves impact both the mean and sub-diurnal tropospheric wind variability. Both horizontal and vertical winds show the largest variability in the lower and mid troposphere (below 400 hPa). The observed variability in the vertical wind component highlights that large-scale phenomena interact with both the local evolution and progression of a cloud field through dynamical feedback.
1. Introduction
The Maritime Continent (MC) is composed of a mixture of islands and seas at the heart of the Indo-Pacific “warm pool”. Diabatic processes over the MC region, mainly latent heat release during the formation of convective clouds, are known to affect global circulation and climate [1,2]. Atmospheric variability over the region is dominated by a consistent diurnal cycle, recognized, among others, in the evolution of clouds and precipitation patterns [3,4,5]. Sumatra is the third largest island of the MC (after Borneo and New Guinea), oriented northwest to southeast across the equator. It is adjacent to the Indian Ocean and, therefore, directly affected by weather systems that develop over the tropical open ocean and propagate eastward. It is also characterized by a significant topography, with a mountain range along the west coast (Barisan Mountains) and lowlands in the center and on the eastern side of the island (Figure 1a).
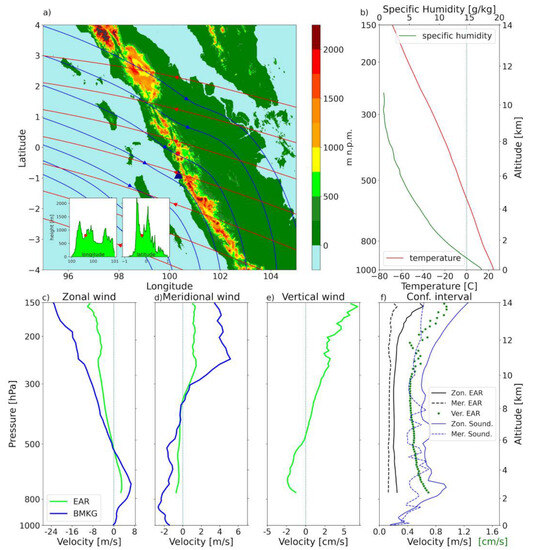
Figure 1.
(a) Orographic map of Sumatra. Blue lines indicate streamlines of multi-year (2001–2019) November–March mean horizontal winds at 850 hPa; red lines show similar streamlines at 200 hPa. EAR location marked by a red dot. Soundings station in Padang marked by blue triangle inside the rectangle. Two panels in the left-down corner of (a) show cross sections through Sumatra along the latitude and longitude where the EAR is located. (b) Multi-year (2001–2019) November–March mean temperature and relative humidity profiles from atmospheric soundings data in Padang. (c) Multi-year (2001–2019) mean vertical zonal wind profiles from EAR (green line), soundings (blue line). (d) Same as (c) but for meridional wind component. (e) Same as (c) but for vertical wind component (no soundings profile). (f) Confidence interval (95%) radius for EAR data for each wind component: zonal and meridional wind in (m/s), vertical wind in (cm/s), green color.
Precipitation variability in Sumatra is strongly affected by atmospheric phenomena at a range of time scales. At a longer, interannual time scale, variability in the intensity of the warm pool has been shown to modulate rainfall patterns over Sumatra. Relevant mechanisms include altering the local branch of the Walker circulation via surface forcing due to sea surface temperature (SST) variability through El Niño Southern Oscillation (ENSO) [6,7,8] and Indian Ocean Dipole (IOD) [9,10]. Upper-level forcing has been known to affect precipitation patterns in the tropics as well. The Quasi-Biennial Oscillation (QBO), which is observed as a variation of the speed and direction of zonal wind in the stratosphere with a ~28-month period, has been shown to affect equatorial convection and precipitation [11]. On a shorter, intraseasonal time scale, propagating phenomena, such as the Madden–Julian oscillation (MJO) [12,13,14,15] and convectively coupled equatorial waves (CCEWs) [16,17,18], are observed in the tropical atmosphere. The MJO modulates precipitation patterns across the MC region, bringing an excess amount of rain during its convective phase. However, precipitation anomalies over the islands tend to arrive ahead of the large-scale convective envelope that primarily affects surrounding seas [19]. Due to the equatorial position of Sumatra, eastward propagating convectively coupled Kelvin waves (CCKWs) tend to have the most significant impact on the rainfall amount among all CCEWs. In fact, interactions between CCKWs and the diurnal cycle of precipitation over that region have been shown to impact both local precipitation anomalies and the propagation properties of waves [20]. Furthermore, CCKWs constitute the single most relevant predictor of floods in Sumatra [21]. However, specific mechanisms responsible for interactions between the local, diurnally evolving environment and propagating weather events are not fully understood.
The spatial distribution of landmasses, resulting in inhomogeneity in the absorption of solar radiation, makes the MC region prone to a strong diurnal breeze circulation. This diurnal change in wind patterns has been shown to affect the evolution of cloud systems over Sumatra [22]. Although regional modeling of these features is possible, it requires a high spatial resolution [23,24,25]. Such resolutions are still unavailable for most global general circulation models, which contributes to significant biases in the representation of diurnal cycle processes over the MC region [26].
The impact of the atmospheric thermal tides on atmospheric winds has long been recognized (e.g., [27,28]). The theoretical model of atmospheric tides and the numerical calculations show that the most significant impacts are the semidiurnal (12 h period) and diurnal (24 h period) modes. Although thermal tides are independent of the breeze circulation, as they are primarily forced by solar energy absorption by ozone in the stratosphere, they extend to the surface and can interfere with tropospheric dynamics.
Previous studies on the tropical atmosphere have rarely focused on tropospheric wind variability on the diurnal time scale, mostly due to difficulties in consistent observations of winds over long periods. Short-term studies were conducted during research campaigns, such as MONEX [29], TOGA-COARE [30], and DYNAMO [31,32], among others. Recently, the multiscale variability in the MC and its global impacts has been a goal of the international Years of the Maritime Continent program [33]. However, such field campaigns rarely last more than several months, with even shorter intensive observations. Such intensive observation periods are required for the analysis of sub-diurnal variability as they provide sufficient temporal resolution of measurements. As a result, the derivation of meaningful, long-term, consistent statistics from such programs is limited.
In this study, we utilize long-term observations of tropospheric wind from the Equatorial Atmosphere Radar (EAR) facility located in Kototabang, near the west coast of Sumatra, Indonesia [34]. This dataset is used to identify the typical diurnal evolution of all three components of tropospheric winds and assess their variability associated with assorted large-scale weather patterns. Very-high-frequency radars have been shown to provide useful insight into tropospheric dynamics on the diurnal time scale [35,36].The structure of the paper is as follows: Section 2 presents details of data used and our methodology, Section 3 describes the mean diurnal evolution of tropospheric winds and discusses the modulation of both the mean and diurnal evolution of winds associated with ENSO, QBO, MJO, and CCKW. Section 4 provides a discussion of this paper’s results.
2. Materials and Methods
This study focuses on the variability in tropospheric winds during the extended boreal winter season, that is, the months of November, December, January, February, and March (NDJFM, hereafter extended boreal winter). This selection is motivated by the annual cycle of tropospheric winds in Sumatra and the seasonal variability in sub-seasonal equatorial modes. It limits the impact of seasonal changes on observed variability while maximizing the number of weather phenomena for composite analyses. Below, we provide a description of all relevant datasets as well as an overview of utilized data analysis methods. The key information regarding all data sources utilized in our study is compiled in Table 1. A primary source of wind data is Equatorial Atmospheric Radar. This dataset is supplemented with ground precipitation measurements collected at the same location, as well as satellite precipitation estimates that provide regional context to our study. Additionally, atmospheric soundings data are used for comparison with radar observations as well as to investigate stratification within the troposphere.

Table 1.
The key information regarding all data sources utilized in our study.
2.1. Equatorial Atmospheric Radar
Equatorial Atmospheric Radar data from 2001 to 2019 were used in this study. The instrument is located in Kototabang near Bukittinggi, West Sumatra, Indonesia (100.32° E, 0.2° S), and provides horizontal and vertical wind data with 10 min temporal and 150 m vertical resolution starting from about 2 km above sea level. In this study, data up to 20 km were utilized. Although data from some days were missing (less than 11% of all days during investigated period), this did not affect calculations of the mean diurnal cycle of tropospheric winds and its variability. This was verified by comparing the results of calculations based on all available data with data denial tests, where 10% of the data were randomly excluded. During calculations of the mean diurnal cycle, repeated deviations for specific hours were observed. EAR observations alternate between the lower atmosphere and the ionosphere modes. The ionosphere observation mode changes between daytime and nighttime, while the lower atmosphere mode remains consistent. The switching of modes occurs at 6:00 and 18:00, possibly contributing to data contamination and biases identified around those hours. In fact, three data points (30 min worth of data) around 6 LST, 18 LST, and 24 LST (Figure A1 in Appendix A) were identified as systematically biased. Those data points were removed from the analysis. Data from the two lowest available altitudes were also not included in the analysis due to unrealistic results, likely due to impact of orography around the EAR location. The vertical wind data with values less than −0.5 m/s were removed due to their potentially unphysical magnitudes, which may be caused by the falling droplets. This constraint removes only a small portion of available data (less than 3%). The accuracy and uncertainty of vertical wind data of EAR observations have been previously discussed, and this dataset has been shown to provide reliable mean structure [37]. The data, after exclusion of the abovementioned points, were averaged to hourly means that were analyzed in this study. Finally, results of this study are presented using pressure coordinates, which were derived using the hydrostatic equation and multi-year mean temperature profile for extended boreal winter obtained from atmospheric soundings in Padang.
2.2. Soundings Data
Atmospheric soundings data from Padang (WMO ID: WIMG, operated by Meteorology, Climatology and Geophysical Agency BMKG, 100.35° E, 0.88° S) for 2001–2019 were used to obtain the mean thermodynamic structure as well as horizontal winds throughout the troposphere near EAR location. Soundings launched at 00 UTC were utilized. Although this dataset does not provide any insight into subdiurnal variability, horizontal wind measurements were used for comparison with EAR data. Processed atmospheric sounding data, in their final form available through Global Telecommunication System, were downloaded from the University of Wyoming website. All available profiles for the extended boreal winter were used to calculate the mean vertical structure of temperature, humidity (Figure 1b), and horizontal winds (Figure 1c,d).
2.3. Precipitation Data
Precipitation data were used to calculate diurnal rainfall evolution and compare it with the diurnal variation in tropospheric winds. The primary source of data is an Optical Rain Gauge operated at the EAR site (0.20° S, 100.32° E). It is an OSi’s ORG® (Optical Rain Gauge) 815 instrument that provides data with hourly temporal resolution. Data for 2002–2016 were used. In addition, the integrated multi-satellite retrievals (IMERGv6) data [38] were used to characterize diurnal progression of precipitation patterns around EAR location. Data from 2002 to 2016 at the native (0.1 degree) spatial resolution were recalculated to hourly averages for a comparison with ORG data. When direct comparison with ORG data was performed, IMERGv6 grid point nearest to EAR location (100.35° E, 0.25° S) was used.
2.4. Tracking the Activity of Large-Scale Phenomena
This research delves into the variability in winds associated with various sub-seasonal and climatic phenomena. The latter is defined by global or local indices that portray the conditions of these patterns. To achieve this, El Niño Southern Oscillation (ENSO) events were recognized using the Niño 4 Sea Surface Temperature (SST) index anomalies. Months with values greater than 0.5 were classified as El Niño, while those with values less than −0.5 were considered La Niña months. There were 1059 days identified as El Niño (7 events), while 724 days were classified as La Niña (7 events). The Indian Ocean Dipole (IOD) events were monitored through the standard Dipole Mode Index (DMI). Months exhibiting positive (negative) DMI values were categorized as positive (negative) IOD phases. Quasi-Biennial Oscillation (QBO) events were identified using the 50 hPa QBO index data. This index is based on zonally averaged equatorial zonal wind anomalies (relative to the 1991–2020 period) from NCEP/NCAR reanalysis [39]. QBO index data were obtained from NOAA’s Climate Prediction Center [40]. Months with positive (negative) anomalies in the index were designated as westerly (easterly) QBO phases; 1574 days were classified as westerly phase and 1299 days as easterly phase.
Due to West Sumatra’s proximity to the Indian Ocean, eastward-propagating modes, such as the Madden–Julian Oscillation (MJO) and Convectively Coupled Kelvin Waves (CCKWs), influence the atmospheric conditions in that area. Changes in tropospheric winds under the influence of these sub-seasonal events were also examined. MJO activity was gauged using the Realtime Multivariate MJO (RMM) index [41,42]. Days with amplitudes below 1 indicated the absence of MJO activity, while amplitudes surpassing 1 marked days with active intraseasonal convection in one of its 8 phases. Particular focus was given to phases demonstrating heightened convective activity over and near Sumatra (RMM phases 1–4), as well as phase 5 when intraseasonal convection is notably suppressed over the region. Throughout the studied period, there were 136 days classified as phase 1, 200 days as phase 2, 275 days as phase 3, 253 days as phase 4, and 264 days as phase 5. RMM amplitude remained below 1 for 951 days.
CCKW activity at the specified location was evaluated using trajectories derived from satellite precipitation estimates following methodology described in [20,43]. First, following the methodology of [44], the Tropical Rainfall Measurement Mission 3B42 precipitation estimates [45] were averaged over the 2.5° S–2.5° N equatorial band. Then, a two-dimensional Fourier transform in longitude and time was performed to transform to wave number–frequency space. Filtering was applied to isolate the CCKW signal, and the data reverse transformed back to longitude–time space. Finally, the Lagrangian CCKW database was then constructed by identifying coherent eastward-propagating precipitation maxima in this Kelvin wave-filtered Hovmöller dataset. Each CCKW in the database consists of a trajectory, a set of time–longitude paired values, indicating the central position (longitude) of the CCKW at each time (with 3 h resolution). Here, a CCKW trajectory had to exist between 90° E and 110° E longitude and its precipitation anomaly at 100° E had to exceed 5 mm/day, which is about 2 standard deviations of global CCKW precipitation variation and ensures that analyzed events were significant. Thus, 150 CCKW events were identified and analyzed in this study. For each CCKW trajectory, a reference date (day 0) was a day it passed 100° E longitude.
Impacts of large-scale phenomena on tropospheric winds were examined based on composites averaged over specific days (e.g., El Niño days) to show the differences relative to typical tropospheric wind structure during such events. In order to mitigate a different number of days used for different composites and typical condition calculations, a 1000-member bootstrap resampling method was applied to determine errors in mean value calculations for MJO and CCKWs. These errors are indicated by shadings in figures in Section 3.
2.5. Decomposition of Sub-Diurnal Variability
This study utilizes both direct averages calculated for the extended boreal winter seasons and averaged anomalies with respect to multi-year seasonal cycles. The multi-year seasonal cycle was calculated as the mean plus the first three annual harmonics from the entire record (all seasons). The average annual variations in tropospheric winds confirm that climatological changes during extended boreal winter are small. However, to minimize the effect of those variations on investigated variability, anomalies for each wind component were calculated by removing the mean seasonal cycle.
For an analysis of the mean diurnal cycle, a composite diurnal evolution was calculated based on all available anomalies. Then, this composite diurnal evolution was decomposed following Equation (1):
where indicates time in hours; Am is a mean value of a given wind component ; indicates the remaining terms; corresponds to amplitudes and phases of the diurnal and semidiurnal cycle, respectively. Analysis based on this decomposition is presented in Section 3.
2.6. Linking Variability in Vertical Wind Profiles with Cloud Population Changes
Variability in vertical wind profiles associated with ENSO, MJO, and CCKWs is related to changes in cloud populations linked to those modes. In order to quantitate this relationship, the identified anomalous vertical wind profiles (e.g., deviations from typical conditions) are compared to idealized vertical wind profiles associated with assorted cloud types and combinations thereof. For this purpose, it was assumed that latent heating associated with clouds is the main factor influencing changes in vertical wind. Furthermore, canonical vertical wind profiles associated with cumulus congestus, deep convective, and stratiform clouds can be derived based on respective latent heating profiles [46] (these canonical latent heating profiles and their derived vertical wind profiles are presented in Figure A2). , where are vertical wind velocity in Pa/s and m/s, respectively, is an air density, and is gravity acceleration. Assuming a simplified form of first law of thermodynamics, , where is static stability (assumed constant) and is canonical latent heating profile. The derived relation between vertical velocity and latent heating within a specific cloud is:
where is pressure, is mean temperature profile based on soundings data (Figure 1), and is a constant (chosen arbitrarily to simplify calculations—its magnitude does not affect the results). The resulting vertical wind anomaly profiles compare well with those derived from other radar observations within convective cores [47]. Furthermore, heating profiles associated with a cloud field composed of a combination of these three cloud categories can also be translated into a resultant vertical wind profile. Such vertical wind profile was simulated by means of a weighted sum of three established profiles , where denotes a weighted contribution and canonical profile for cumulus congestus (CuCg), deep convective (Deep), and stratiform (Strat) clouds, respectively. A set of such idealized vertical wind profiles for cloud populations was created (a lookup table). Subsequently, a composition that best aligns with observed anomalies in vertical wind was identified using the least square error method. Consequently, this combination portrays a link between observed vertical wind anomalies and variations in the cloud population, while the weights assigned to it () represent changes to specific cloud type with respect to the mean conditions.
3. Results
3.1. Typical Vertical Profiles of Tropospheric Winds over West Sumatra
In this section, results concerning the long-term typical, mean conditions prevailing over the EAR location during NDJFM are presented. Analysis is divided into two parts, focusing on long-term daily mean values (Section 3.1.1) and typical sub-diurnal variability (Section 3.1.2) of all three wind components derived from the entire available records of wind and precipitation measurements.
3.1.1. The Mean Vertical Profiles of Wind
Figure 1 presents typical extended boreal winter wind and thermodynamic profiles in West Sumatra. All wind components exhibit shear across the troposphere. The zonal wind profile measured via EAR (green line in Figure 1c) displays a westerly flow in the lower troposphere (below 500 hPa) and easterly flow in the upper troposphere. The meridional wind shows northerlies in the lower troposphere and southerlies in the upper troposphere. Soundings data exhibit a structure similar to EAR observations, especially below 300 hPa. The shift from easterlies to westerlies in zonal wind data and from northerlies to southerlies in meridional wind data agrees very well between both data sources, but amplitudes of sounding-derived horizontal winds appear visibly larger than in EAR data. However, these differences are nearly linearly dependent on the magnitudes of both horizontal wind speed components, which indicate a potential issue with sounding wind data processing. Due to the lack of information about the balloon ascent rate, sonde type, and applied processing procedures, corrections to the Padang sounding data used in this study were not possible [48]. The larger difference in meridional wind speed above 300 hPa may be due to potentially the largest displacement between EAR location and a location of a balloon at those altitudes. A balloon is advected towards the south by northerly meridional wind components in the lower and middle troposphere (below 300 hPa, Figure 1c) towards the area, where southerlies in the upper troposphere appear more prominent (Figure 1a). It should also be noted that confidence intervals for sounding-derived horizontal velocities are substantially larger than for EAR data, especially above 300 hPa (Figure 1f). The confidence interval radius is directly related to the precision of mean calculations. A narrower confidence interval, indicated by a smaller radius, signifies higher precision in estimating the population mean. In contrast, a wider interval suggests lower precision and a greater degree of uncertainty in our estimate. Hence, the results shown in Figure 1f translate into lower reliability of upper troposphere horizontal wind data based on upper soundings than those based on EAR.
The vertical wind data (Figure 1e) indicate downward motions below 400 hPa, with maximum subsidence around 700 hPa, and upward motions above 400 hPa. The shear of the vertical wind component decreases above 500 hPa. This shift occurs at the same altitude where horizontal wind direction changes. It also occurs near the freezing level (Figure 1b) and altitude where the tops of cumulus congestus clouds are most common in the tropics [49]. Similar vertical wind profile structures were observed on Christmas Island (Equatorial Pacific: 2° N, 157° W) [35], where the dominance of subsidence in the lower troposphere and upward motions in the upper troposphere were shown as well. However, over the EAR site, we observe a change in the vertical wind direction at the altitude of 300 hPa (9.5 km) in comparison to around 12 km over Christmas Island. Moreover, data from Christmas Island showed ascending motions dominating in the 800–650 hPa layer, which were associated with a marine boundary layer. On the west coast of Sumatra, this altitude range is characterized by the strongest subsidence throughout the profile. This distinction can be explained through interactions with clouds and precipitation, which show an apparent diurnal cycle over Sumatra [4,20], with the maximum occurring in the afternoon over the EAR site (Figure 2) and during the night over the ocean adjacent to Sumatra [26].
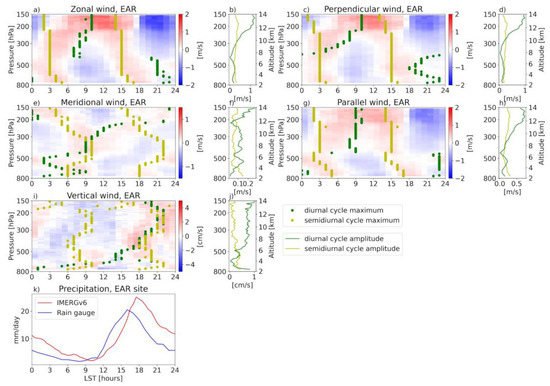
Figure 2.
Typical diurnal variability in wind anomalies and precipitation near the EAR location derived from a multi-year mean diurnal evolution during extended boreal winter season. Panels (a,b) show the results for zonal wind, panels (c,d) for the wind perpendicular to the Barisan Mountains, panels (e,f) for meridional wind, panels (g,h) for the wind parallel to the Barisan Mountains, and panels (i,j) for vertical wind. Green dots indicate the phase of diurnal cycle (hour of the maximum), while yellow dots show phase of semidiurnal cycle. Similarly, the green lines in the (b,d,f,h,j) panels represent vertical profiles of amplitudes of the diurnal cycle, while yellow lines correspond to profiles of amplitudes of the semidiurnal cycle. The panel at the bottom (k) presents IMERGv6 (nearest grid point) and rain gauge data.
Strong downdrafts accompanying convective activity [50] and precipitation-driven cold pools [51] can explain descending air motions in the lower troposphere, observable using the EAR. Conversely, when convective clouds are away from the EAR location, the lower troposphere layers may exhibit descending motions associated with radiative cooling of clear air, while the higher troposphere may manifest ascending motions associated with the occurrence of cirrus and anvil clouds around convective areas. Such conditions are likely present when the precipitation zone shifts from the EAR site to the east, as well as during nighttime precipitation over the ocean. Similar effects in the tropics have been previously reported [52,53]. In addition, previous studies have noted the potential influence of gravitational waves, which can increase the downward wind velocities observed by EAR-type radars [36,54]. Taken together, a combination of the abovementioned phenomena explains the dominance of subsidence in the lower troposphere and upward motions in the upper troposphere in the mean vertical profile. Furthermore, the mean vertical wind structure agrees with diabatic heating profile associated with the mixture of stratiform and convective clouds in a typical cloud population [55].
Due to the diurnal variability in precipitation and clouds, variations in vertical winds throughout the day are expected as well. The diurnal evolution of all wind components is the subject of the following section.
3.1.2. The Typical Diurnal Cycle of Tropospheric Winds
Figure 2 illustrates the mean diurnal evolution of wind components and precipitation at the EAR location. Wind data are obtained from EAR, while precipitation data come from IMERGv6 and a rain gauge operated at the EAR location. A composite diurnal cycle is analyzed, decomposing it into diurnal and semidiurnal modes (Equation (1)). The amplitudes of both modes for horizontal wind components are approximately equal in the lower and middle troposphere (not shown). However, these amplitudes (less than 1 m/s) are generally one order of magnitude lower than the daily mean values, leading to robust variations on a diurnal time scale without significantly altering wind direction at specific altitudes. EAR observations align with the theoretical calculations [28], showing that the dominating semidiurnal mode during boreal winter occurs at 3 and 15 LST for zonal wind and at 6 and 18 LST for meridional wind (Figure 2a,e).
The multi-year-averaged diurnal variability in zonal wind measured by EAR (Figure 2a) exhibits evident semidiurnal characteristics in the lower and mid-troposphere (below 250 hPa), with a double-maximum, double-minimum pattern (see phases of semidiurnal cycle in Figure 2a). The maximum zonal wind (westerly anomaly) is observed at 3 and 15 LST between 700 hPa and 250 hPa, slightly later at lower levels, and followed by minima (easterly anomaly) occurring 6 h later. The upper-level westerly and easterly anomalies are nearly evenly distributed, which manifests domination of the diurnal amplitude (Figure 2b). The zonal wind variability in the upper troposphere is consistent with a diurnal progression of convective systems over Sumatra [19]. Upper-level outflow from convection over Central Sumatra, which maximizes in the evening [5,56], leads to enhanced easterly winds in the upper levels [23]. It is noteworthy that the wind perpendicular and parallel to the Barisan Mountain range shows almost the same variability as zonal wind. It is likely a result of both daily mean zonal wind and its variations dominating over meridional wind. Wind variations are larger in the direction perpendicular to the mountains than parallel to them above 500 hPa. This may be related to the fact that clouds and precipitation patterns tend to propagate in the direction perpendicular to the Barisan Mountain range on the diurnal time scale [25]. Therefore, analysis in the following sections will be focused on zonal and vertical wind components.
EAR data indicate comparable diurnal and semidiurnal amplitudes (about 0.2 m/s) in meridional wind throughout most of the troposphere (Figure 2f). The maximum value (southerly wind) of the semidiurnal cycle occurs at 4–10 LST and 12 h later, while the diurnal cycle aligns with the morning maximum of the semidiurnal cycle in the lower and middle troposphere, resulting in positive interference during the morning. In the upper troposphere, EAR shows positive interference between the minima of diurnal and semidiurnal modes, leading to a relatively strong northerly flow around noon above 250 hPa. Similarly to zonal wind variations, the amplitude of the diurnal mode is larger than the semidiurnal mode above 250 hPa.
The vertical wind data show clear and consistent variability in both altitude and time. In the lower troposphere (up to 500 hPa), EAR data show upward anomalies during the morning hours (7–12 LST). By the late afternoon (15–19 LST), upward anomalies become visible in the middle troposphere, and they have larger magnitude than the morning pattern. Subsequently (9 in the evening to 1 in the night LST), positive anomalies are noticeable above 400 hPa. The amplitude of the semidiurnal cycle (about 0.4 cm/s) outweighs the amplitude of the diurnal cycle (less than 0.2 cm/s) in the lower troposphere (below 600 hPa). However, above 500 mb, the diurnal cycle (0.7–0.8 cm/s) clearly dominates the semidiurnal mode (below 0.3 cm/s) (Figure 2j). This result differs from radar observations over Gadanki, India, where a clear semidiurnal cycle was observed throughout the troposphere, and the magnitude of such variations exceeds 5 cm/s [36]. It should be noted that the phase of the semidiurnal cycle of vertical velocities shows a maximum around 9 LST below 500 hPa, that is, below the mean 0C isotherm, consistent with shallow convective clouds. On the other hand, the phase of the diurnal cycle shows altitudinal dependence, consistent with tilted updrafts characteristic of deep convection [36,57].
This observed variability in vertical wind is closely associated with the development of clouds and their movement across the Barisan Mountains (Figure 3). The combination of morning insolation and mean westerly flow below 500 hPa (as depicted in Figure 1c) leads to the formation of convective clouds along the western slopes of the mountains. Additionally, a breeze circulation contributes to the mean westerly flow during that time, although it may not be deep enough to be visible in EAR data [22]. In the following hours, they grow into the congestus stage and propagate eastward, advected by horizontal winds [19,23]. As a result, convective precipitation starts and intensifies over the EAR location after 11 LST (Figure 2f). Downward anomalies in the lower troposphere at that time are consistent with the development of precipitation-driven cold pools [51] and intensive downdrafts that characterize the later stages of convective development. Precipitation intensifies in the following hours (maximum around 16 LST, Figure 2f), indicating deep convection. Thus, the vertical wind profile shows a change towards stronger positive anomalies in the middle troposphere [58] (also see phases of diurnal cycle in Figure 2i). Such variation in vertical wind in the lower troposphere (descending motions in the middle of the day) is consistent with radiosonde observations near Borneo [52]. Further diurnal eastward propagation of deep convective (Figure 3) clouds results in increased precipitation east of the mountains, with associated stratiform clouds extending westward, over the mountains [22] and EAR location. It is noteworthy that during the afternoon and evening, vertical wind data show a coherent structure of gravity waves, with vertical wavelengths around 6 km and a period of 12 h. Taking vertical wavelength , frequency (from the visible structure in Figure 2e), buoyancy frequency , and the mean flow (mean value around 400 hPa, Figure 1), substituting those values into the dispersion relation for internal gravity waves (Equation (3)), we may calculate the horizontal wavelength . These values are comparable with the results of EOF analysis of diabatic heating profiles over Sumatra [23]. The vertical wavelength derived here matches the distance between the maxima of convective and stratiform heating (EOFs), while the timing and period of the gravity wave observed in Figure 2f are consistent with the time and frequency of modulation of principal components. Hence the observed gravity wave can be considered to be a result of cloud development.
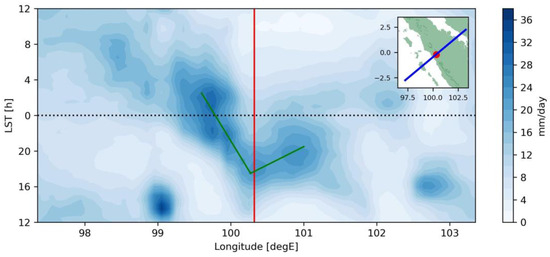
Figure 3.
Mean diurnal evolution of precipitation along the line passing through EAR site and perpendicular to the Barisan Mountain range (shown on the panel in the top-right corner). Data from IMERGv6. Each horizontal line shows mean data along the investigated line. Red line indicates the longitude of EAR site. Green lines show the inland and offshore propagation patterns.
Late in the evening, upward motions in the upper troposphere are observed with the conjecture of anomalous westerlies. At this time, the center of the convective system is typically located over Central Sumatra (Figure 3) [56]. Observed upper tropospheric zonal wind anomalies are consistent with an outflow from such a system and may be responsible for the advection of thick stratiform clouds towards the EAR location. In fact, precipitation over EAR in the evening can be recognized as the stratiform type [59]. Latent heating associated with such clouds can explain observed upward anomalies at that time.
The diurnal evolution of precipitation over the region is visible in IMERGv6 data (Figure 3) [56]. Precipitation occurs over the west coast of Sumatra and moves both in-land (eastward) towards the EAR location and further over Central Sumatra, and off shore (westward) towards Siberut and Batu islands and Indian Ocean (Figure 3). It should be noted that the in-land branch moves faster and achieves peak intensity at 19 LST over Central Sumatra. The offshore branch is slower—it starts intensifying after 20 LST and can be tracked until 8 LST on the following day, when it enhances precipitation over the eastern Indian Ocean (98° E). The double peak on the in-land branch is consistent with the observed wind structure; specifically, the noon precipitation over Barisan Mountains is associated with horizontal wind convergence occurring over EAR, and the in-land maximum is manifested in EAR data by the presence of stratiform clouds.
3.2. Variability in Tropospheric Winds in Sumatra on Sub-Seasonal to Interannual Time Scale
In this section, the variability in tropospheric winds is analyzed in the context of assorted sub-seasonal and climate phenomena. In particular, changes in daily mean as well as diurnal and semidiurnal amplitudes associated with interannual modes, such as ENSO and QBO, and sub-seasonal modes, such as MJO and CCKW, are investigated.
3.2.1. Precipitation
Figure 4 presents the mean diurnal evolution of precipitation from rain gauge during ENSO, MJO, and CCKW events. It can be observed that the variations in precipitation rates are not related to significant differences in the hour of maximum rainfall during the day. Large-scale atmospheric patterns affect both daily mean precipitation and amplitude of the diurnal variation but not its phase, which is consistent with previous results [56]. During El Niño, precipitation rates are larger than during La Niña, especially during the afternoon. Previous studies have shown that the precipitation response due to ENSO differs by MC regions. In particular, western MC, including Sumatra, exhibits increased precipitation during the El Niño phase [60], especially during boreal winter [61]. Similarly, the easterly phase of QBO is associated with stronger rainfalls than the westerly phase (not shown); however, these differences are much smaller than for ENSO. MJO RMM phases 1–4 are those with significantly larger precipitation rates than the multi-year mean, with the maximum during RMM phase 3, while phases 5–7 show smaller-than-usual precipitation rates, with the minimum during RMM phase 5. It should be noted that MC islands, including Sumatra, exhibit increased precipitation ahead of the arrival of convective envelopes [19,62]. During CCKW activity, the significant positive anomaly in precipitation is observed during a day of CCKW passage and the following day, also consistent with previous studies [20,63]. It is noteworthy that rain gauge data show broadly positive anomalies only during the evening of a day when CCKW passes over the EAR location (day 0). IMERGv6 data show similar broad anomalies also during the following day but with a smaller magnitude.
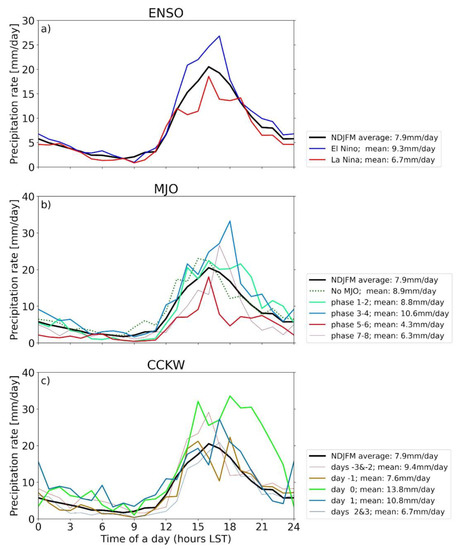
Figure 4.
The multi-year (2002–2016) mean diurnal cycle of precipitation and its composite variability associated with ENSO (a), MJO (b), and CCKW (c) based on rain gauge data from EAR location. Black line in each panel presents the multi-year (2002–2016) extended boreal winter (NDJFM) mean, for which the daily mean value equals 7.9 mm/day. Panel (a): blue (red) line corresponds to El Niño (La Niña) phase of ENSO. Panel (b): each line corresponds to a couple of phases of the MJO based on RMM index; days with amplitude of RMM index less than 1 highlighted by green dotted line (No MJO). Panel (c): each line corresponds to a composite mean diurnal cycle relative to a day or days of CCKW passage over EAR location. Daily mean values for each line are presented in respective legends.
3.2.2. ENSO
The response of tropospheric winds over Sumatra to the ENSO phase is shown in Figure 5. Zonal wind data show the strongest variability among all wind components. The profiles of its averaged anomalies indicate increased shear throughout the troposphere during La Niña, while it is suppressed during El Niño events, in comparison with typical conditions. This is consistent with anomalously strong convection over the Western Pacific Ocean and Maritime Continent during La Niña and, therefore, stronger low-level westerlies and upper-level easterlies over Sumatra [64].
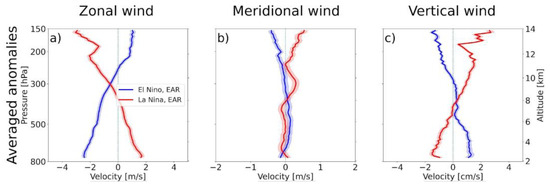
Figure 5.
Tropospheric wind variability near EAR location as a function of ENSO phase, EAR data. Mean anomalies of zonal (a), meridional (b), and vertical (c) wind profiles are shown. The red lines indicate the profiles for El Niño phase composites. Similarly, the blue lines correspond to the La Niña phase composites. Shadings indicate standard errors.
The meridional wind, on the other hand, shows only marginal variation due to ENSO (Figure 5b). EAR meridional wind data show that averaged anomalies are small throughout the troposphere, for both El Niño and La Niña phases, in comparison with zonal wind data. These anomalies are the largest in the upper troposphere, with positive values during La Niña and negative during El Niño.
EAR data show significant variations in the averaged anomalies of vertical wind. During La Niña, negative anomalies are observed in the lower troposphere and positive anomalies in the upper troposphere. On the other hand, El Niño events are associated with positive anomalies in the lower troposphere and no significant variations at higher levels. The analysis using latent heating profiles for different clouds leads to the conclusion that vertical wind anomalies during El Niño agree with an increased contribution of deep convective clouds and a decreased contribution of stratiform clouds. During La Niña, the opposite is observed: there are more stratiform clouds and fewer deep convective clouds in the cloud population (Figure A3). Since the cloud population over the EAR site evolves during the day, it is reasonable to study the impact of ENSO on the diurnal evolution of vertical wind.
Figure 6 shows the mean diurnal evolution of vertical wind during El Niño and La Niña as well as a comparison between rain gauge and IMERGv6 data for those phases. During El Niño, the vertical wind anomalies show similar diurnal evolution as during a typical day (Figure 2); however, the positive anomalies in the lower and middle troposphere have larger magnitudes. During La Niña events, the upward anomalies are observed in the upper troposphere throughout the day, with their maximum values in the evening. Neither ENSO phase has a significant impact on the amplitudes of diurnal and semidiurnal modes of horizontal winds (Figure A5). The comparison of rainfall data shows that the differences between both phases of ENSO are larger in rain gauge data than in IMERGv6. It is noteworthy that a similar analysis for IOD (not shown) does not show any significant variations in either the mean profiles or the amplitudes of diurnal and semidiurnal cycles.
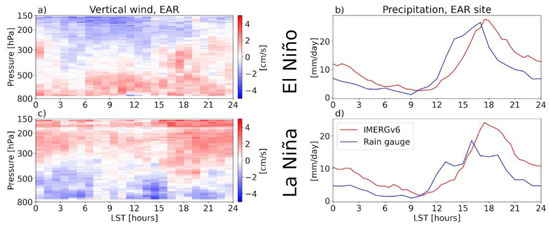
Figure 6.
Diurnal evolution of vertical wind anomalies and precipitation. Top row corresponds to El Niño composites; bottom row represent the results for La Niña events. Panels (a,c) show composite diurnal variability in vertical wind’s anomalies (EAR data). Panels (b,d) represent composite of rainfall over EAR site: blue lines—rain gauge, red lines—IMERGv6 data for nearest grid point.
3.2.3. QBO
A similar analysis to that for ENSO was also performed for the QBO phases. In the zonal wind, no significant differences were noted between the profiles for the two QBO phases in the lower and middle troposphere. Above 250 mb in the easterlies phase, a clear increase in easterly winds with altitude was observed. During the westerly phase, westerly anomalies were visible, but their magnitude was smaller than the anomalies for the easterlies phase. Therefore, despite the fact that QBO is a stratospheric phenomenon, observations from the EAR show its impact on the upper troposphere as well. Meridional and vertical wind profiles are close to the multi-year average across the troposphere. During the easterlies phase, slight southerlies and upward anomalies can be observed in the upper troposphere, which is consistent with the small elevated contribution from stratiform clouds to the cloud population.
3.2.4. MJO
Figure 7 presents the tropospheric wind variability observed via EAR for different phases of MJO. Over the western part of the MC, including Sumatra, precipitation over land is expected to be enhanced in MJO phases 1–3, while it is suppressed in phases 5–6. The rainfall tends to be near a long-term mean in phases 4, 7, and 8 [19]. The rain gauge data show enhanced precipitation during phases 1–4 and drier conditions during phases 5–6 (Figure 4) in the EAR location. Since the rainfall variation between phase 1 and phase 5 is the largest, this analysis focuses on those phases. Profiles that correspond to those phases are indicated by thick lines in Figure 7.
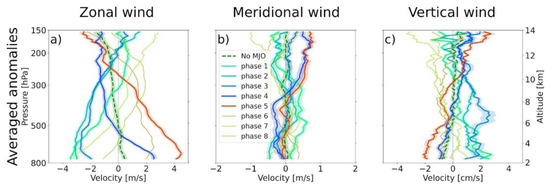
Figure 7.
Same as Figure 5 but the composites are prepared for MJO phases. Green dotted line indicates the composite for days with RMM amplitude smaller than 1. Other lines correspond to days with RMM amplitudes larger than 1 and for respective phases of MJO, as indicated in legend. (a) zonal wind; (b) meridional wind, and (c) vertical wind.
Profiles of the averaged zonal wind anomalies (Figure 7a) change from phase to phase, as expected for the MJO structure and its eastward propagation [14,65,66]. In the lower troposphere (below 500 hPa), the typical westerly flow vanishes or even reverses during RMM phases 1–3. The strongest upper-level westerly anomaly is observed in phases 7 and 8. The magnitude of variations in the lower troposphere is larger than in the upper troposphere, which indicates the bottom-heavy structure of MJO in EAR observations. Moreover, the changes in the middle and upper troposphere are delayed with respect to the lower troposphere, e.g., in the lower troposphere, the transition from easterly anomalies to westerly anomalies occurs between phases 3 and 4, while in the middle troposphere, it is observed between phases 4 and 5. It is consistent with a westward tilt in the MJO structure.
Meridional wind shows less variability due to MJO activity than zonal wind. The range of variability associated with MJO is less than 2 m/s for meridional wind, while it is in the order of 10 m/s for zonal wind.
The vertical wind (Figure 7c) shows more complex variability, associated with MJO propagation. It can be explained in the context of variability in large-scale cloudiness and precipitation patterns [19] and latent heating profiles, associated with various types of clouds [55]. Here, the methodology described in Section 2.6. is used to quantify this relationship (Figure A3).
During MJO phase 1, the positive anomaly, relative to climatology, is observed below 450 hPa. It is consistent with an increased amount of cumulus congestus convective clouds and higher precipitation rates in the afternoon (Figure 4). In the MJO phase 2, the positive anomaly of mean vertical wind is observed in the middle and lower troposphere. Such a structure agrees with the increased contribution of cumulus congestus and deep convective clouds to the cloud population. This is also consistent with the observed diurnal evolution of precipitation in the EAR location (Figure 4), which shows a broad maximum between 17 and 20 LST and coincides with the positive anomalies of vertical wind in the middle troposphere (Figure 8c) and enhanced amplitude of the diurnal mode. In West Sumatra, cloud tops are the highest and precipitation is the largest during RMM phase 3 [19], which confirms that the environmental conditions are favorable for the widespread development of deep convection. Rain gauge observations show a strong, relatively narrow peak around 18 LST (blue line in Figure 4c), which is consistent with the increased contribution from deep convection to a cloud population. In that MJO phase, the mean vertical wind profile shows a thick positive anomaly between 800 hPa and 250 hPa. Figure 8e shows that those anomalies are distributed among all hours of the day, but the maximum occurs during the afternoon, which is confirmed by the highest precipitation rates. It is noteworthy that phases 1–3 of MJO are characterized by the weakest westerlies in the lower troposphere.
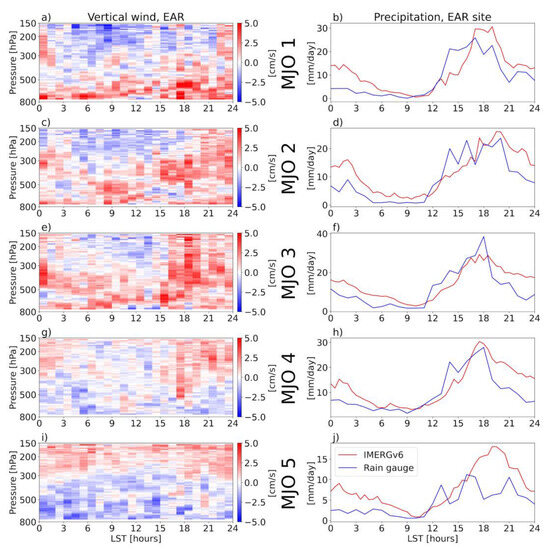
Figure 8.
Mean diurnal cycle of vertical wind and precipitation for MJO RMM phases—each row corresponds to results for specific phase. Panels in left column (a,c,e,g,i) present composite diurnal evolution of vertical wind from EAR data. Panels in right column (b,d,f,h,j) show composite IMERGv6 and rain gauge data for corresponding days.
In MJO phase 4, the averaged vertical wind anomalies show fewer diversions from climatology (Figure 7c) than for previous phases. These anomalies may be explained by the slightly increased population of stratiform clouds. This coincides with enhanced precipitation rates, enhanced upward anomalies in the upper troposphere during evening hours, and the increased amplitude of the diurnal mode at those levels. MJO phase 5 represents a shift from favorable to suppressed convective conditions [19]. West Sumatra exhibits suppressed large-scale precipitation, smaller than usual local precipitation rate (red line in Figure 4c), and decreased diurnal variability in precipitation. The vertical wind profile shows the strongest, among all MJO phases, subsidence in the lower troposphere. RMM phases 7 and 8 are characterized by the smallest mean daily variations in vertical wind throughout the troposphere. In addition, vertical wind anomalies in the upper troposphere manifest the lowest values among all phases. Together with observations of zonal wind and large westerly anomalies at those altitudes, they can be explained by a lower amount of stratiform clouds and, hence, lower latent heating.
3.2.5. CCKW
A significant evolution of tropospheric winds is observed within ±2 days of CCKW passage over the EAR location (Figure 9), consistent with precipitation variability due to CCKW activity [20]. The evolution of a zonal wind anomalies during a CCKW passage over the EAR site is consistent with the westward-tilted baroclinic structure of a CCKW [17].
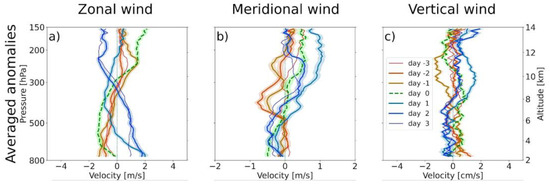
Figure 9.
Same as Figure 5 but for CCKWs. Each line corresponds to composite over specific days before or after CCKW passage which corresponds to negative and positive values in legend. (a) zonal wind; (b) meridional wind, and (c) vertical wind.
The meridional wind shows northerly anomalies in the upper troposphere before CCKW passage. On the day of CCKW arrival, a strong northerly anomaly is observed in the lower troposphere (below 500 hPa), while a southerly anomaly occurs in the upper troposphere (above 350 hPa). After a CCKW passage, the anomalies in the lower troposphere become weaker, while in the upper troposphere, the strongest southerlies are observed one day after the CCKW event. A combination of anomalous zonal and meridional wind during and after a CCKW event is consistent with a structure of convective system propagating eastward and diverting southward of the equator, with a radial inflow in the lower and outflow in the upper troposphere. Furthermore, the one-day delay in the occurrence of mid-tropospheric anomalies is consistent with the tilted structure of CCKW. The diurnal cycle of meridional wind does not show any significant effects due to CCKW activity.
Mean vertical wind profiles show significant variability associated with CCKW activity, especially between one day before and one day after a wave passage. In the lower troposphere (below 600 hPa), positive anomalies are observed one day before a CCKW passage, while upper levels exhibit the strongest negative anomalies. This can be explained by the analysis of heating profiles, which yields stronger-than-usual cumulus congestus convection and fewer stratiform clouds (Figure A3). The mean diurnal cycle of vertical wind (Figure 10b) shows that significant upward anomalies in the lower troposphere occur throughout the day. Between 400 hPa and 150 hPa, negative anomalies dominate, indicating a smaller contribution from deep convection and stratiform clouds to the cloud population. On a day of wave passage, an ascending anomaly in the lower and middle troposphere is apparent, with a maximum around 350 hPa, while in the upper troposphere, vertical wind shows downward anomalies. This pattern is consistent with the more frequent occurrence of cumulus congestus and deep convective clouds and associated heating profiles [55]. These positive anomalies are visible in composite diurnal evolution between 8 and 23 LST, which is the typical period of cumulus congestus, deep, and stratiform clouds. The increased number of deep clouds during the evening is consistent with the broad maximum of precipitation (Figure 3). The following day is characterized by positive anomalies above 500 hPa, with a maximum near 300 hPa. This indicates a shift in cloud composition toward an increased number of stratiform, anvil clouds and their characteristic latent heating profiles. These positive anomalies are visible not only during daytime but at night as well (Figure 10b). This likely results from the convective zone of CCKW moving further eastward.
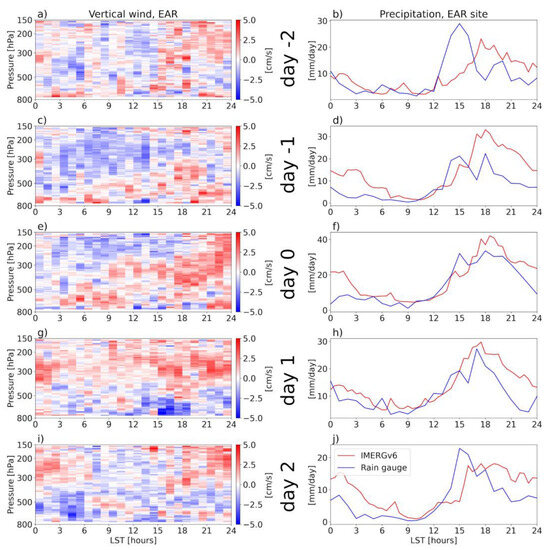
Figure 10.
Mean diurnal cycle of vertical wind and precipitation during CCKW activity—each row corresponds to the results for specific day related to CCKW passage. Panels in left column (a,c,e,g,i) present composite diurnal evolution of vertical wind from EAR data for days from 2 before (day −2) to 2 after (2) CCKW passage. Panels in right column (b,d,f,h,j) show composite IMERGv6 and rain gauge data for corresponding days.
4. Discussion
This study investigates the diurnal evolution of tropospheric winds over Sumatra during extended boreal winter (November, December, January, February, and March) and its variability associated with assorted large-scale atmospheric phenomena. To that end, remote sensing EAR observations from the EAR location (West Sumatra) were used and analyzed in the context of precipitation variability, assessed based on IMERGv6 and rain gauge data from the EAR location (Section 2).
A typical day in West Sumatra is characterized by a diurnal development of convective clouds and their horizontal propagation (see Appendix A for a schematic figure, Figure A4). Our results are consistent with the previous studies of such phenomena [4,19,22]. EAR observations show that amplitudes of diurnal and semidiurnal modes are of similar magnitude throughout most of the troposphere. Furthermore, the phase of the semidiurnal cycle (tides) appears in phase with cloud evolution and, therefore, can contribute to observed cloud field variability. However, its magnitude is roughly one order of magnitude smaller than the mean horizontal winds. Therefore, its importance for the observed variability should be further investigated (for example, in a numerical framework). The identified semidiurnal amplitudes are also smaller than those observed using radar in Gadanki, India [36], and the variability in the upper troposphere is dominated by the diurnal mode. The latter may be related to thick stratiform clouds, which regularly occur over the EAR location in the late evening and night and dominate diurnal variations at those altitudes [22].
Our results show that various large-scale phenomena significantly affect tropospheric winds over Sumatra, including the diurnal evolution of vertical wind components. A mechanism relating the vertical shear of horizontal winds, convective activity, and precipitation over West Sumatra, as well as offshore propagation, has been proposed [67,68]. Namely, decreased horizontal wind shear enhances the convection over the west coast of Sumatra and favors its westward offshore propagation, while the opposite occurs during the increased vertical shear of horizontal winds. The EAR observations are consistent with those findings. The ENSO, MJO, and CCKWs have a substantial impact on both the horizontal winds and the stability of the atmosphere. Decreased zonal wind shear in the troposphere is characteristic for El Niño days and the days of RMM MJO phases 1–3. During CCKW activity, similar conditions are present from two days prior to the passage up to the day of the passage of the wave over the EAR site. When the vertical shear of horizontal winds is decreased, anomalous winds act oppositely to the mean westerly flow. At these times, the precipitation rates are increased. On the other hand, increased zonal wind shear in the troposphere leads to the favorable eastward propagation of clouds and lower precipitation rates. Such conditions are typical for La Niña days, RMM MJO phase 5 days, and two days after the CCKW passage.
Variations in zonal wind with respect to MJO phases observed using EAR are much larger in the lower troposphere than in the upper troposphere (Figure 7a) and show a tilted structure for both CCKW and MJO. The MJO variance in vertical wind is significant below 500 hPa and above 200 hPa. Thus, the observed MJO over West Sumatra appears different from the not-tilted, top-heavy structure identified based on tropical wave analysis of reanalysis data [69]. Maximum vertical wind variance due to CCKW is observed in the upper troposphere, near 300 hPa. Observations indicate a significant top heaviness for this mode over the EAR location.
Moreover, the average daily anomalies of vertical wind for specific events may be used for the analysis of variations in cloud populations based on the relationship between the latent heating profiles of clouds and associated vertical winds (as described in Section 2). These results are summarized in Figure 11. EAR data indicate an increased amount of deep convective clouds and decreased amount of stratiform clouds and (slightly) decreased amount of cumulus congestus clouds during El Niño. The opposite occurs during La Niña—more stratiform clouds, more cumulus congestus, and less deep convective clouds. The evolution of vertical wind profiles during MJO may also be linked to the robust variability in cloud population. While phases 1–3 are characterized by increasing amounts of deep convective clouds, during phases 4–6, a significant decrease in the contribution of these clouds to a cloud population is observed. This can be related to the convective ‘center’ of an MJO envelope moving east of West Sumatra during and after phase 4. Between phases 6 and 8 of MJO, a significant increase in deep convective clouds and a decrease in stratiform and cumulus congestus clouds are observed. It is consistent with a convection-forming ‘hot tower’, rather than aggregating to mesoscale clusters [70]. During CCKW activity, an inferred cloud population also show robust variability. Two days before a CCKW event, a decreased amount of deep convective clouds, accompanied by an increased amount of cumulus congestus and stratiform clouds is noticed. The cloud population changes significantly over the next two days and is dominated by deep convective clouds on the day of CCKW passage. Two days following the passage of the CCKW’s convective center, cloud population mimic behavior was observed over two days before it (−3 days and +3 days relative to CCKW passage show cloud populations similar to typical conditions, not shown). Therefore, immediately before and after a CCKW event, the cloud population is similar but its diurnal progression differs significantly, which exemplifies coupling between clouds and circulation. All of the abovementioned impacts of large-scale atmospheric phenomena on the weather over the investigated area are summarized in Figure 12.
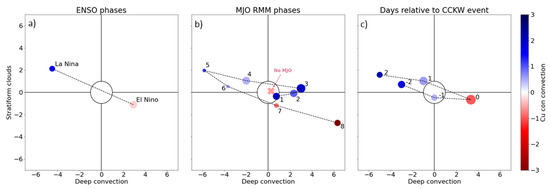
Figure 11.
Differences in cloud population during large-scale events over Sumatra. X-axis shows normalized contribution from deep convective clouds, Y-axis shows normalized contribution from stratiform clouds and colors of a marker shows normalized contribution from cumulus congestus clouds. Normalization is based on a standard deviation of typical vertical wind variability calculated using vertical wind anomalies for 45 composites, each based on 50 random days, to which clouds contributions have been calculated. The size of the dot is related to the anomalies of precipitation from ORG in EAR location. Panels show variability associated with (a) ENSO phases, (b) MJO activity, and (c) CCKW events.
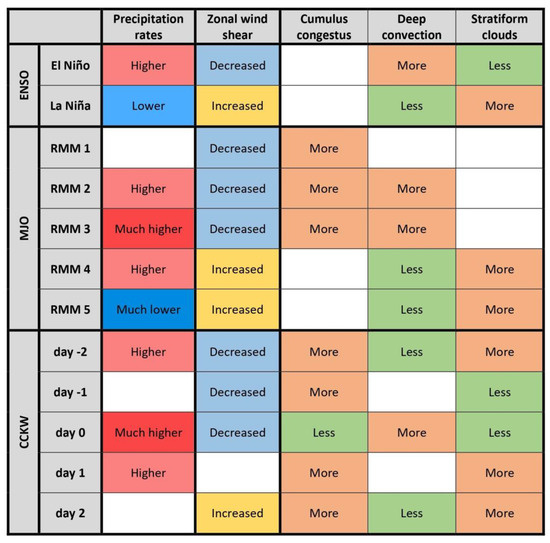
Figure 12.
Summary of large-scale impacts on precipitation, zonal wind shear, and cloud population over EAR location.
Author Contributions
W.R.S., D.B.B. and M.K.F. contributed to the conceptualization and design of this study. M.M. and H.H. contributed to the processing and analysis of the EAR data. T.S. provided rain gauge data. W.R.S. and D.B.B. designed the methodology of this study and analyzed the data. W.R.S. performed formal analysis, investigation, software development, and visualization. All authors discussed the results. W.R.S. and D.B.B. wrote the draft manuscript. All authors contributed to the final manuscript. D.B.B. and supported this work through funding acquisition. All authors have read and agreed to the published version of the manuscript.
Funding
This research was supported, in part, by NSF Grant 1724741 “Equatorial Line Observations (ELO) field campaign during the International Years of Maritime Continent”, program managed by Eric T. DeWeaver and by National Science Centre (NCN) of Poland, grant no. 2019/35/B/ST10/03463. EAR data were provided by the Research Institute for Sustainable Humanosphere of Kyoto University.
Institutional Review Board Statement
Not applicable.
Informed Consent Statement
Not applicable.
Data Availability Statement
Equatorial Atmospheric Radar data available at: http://www.rish.kyoto-u.ac.jp/ear/data/data/ver02.0212/ (accessed on 11 August 2023) IMERGv6 data available at Goddard Earth Sciences Data and Information Services Center (GES DISC) (Huffman et al. 2019). ORG data and data processing codes are available on request.
Conflicts of Interest
The authors declare no conflict of interest.
Appendix A
Figure A1 depicts the mean diurnal evolution of zonal wind during the NDJFM season, as derived from the original EAR data at two altitudes (3.5 and 5 km). The figure clearly illustrates deviations from an otherwise-smooth evolution around 6:00, 18:00, and 24:00 LST. Biased data points responsible for these deviations were discarded, and hourly averages were calculated based on the remaining data. The results obtained from this analysis closely resemble the diurnal evolution based on the raw 10 min data (represented by black dashed lines).
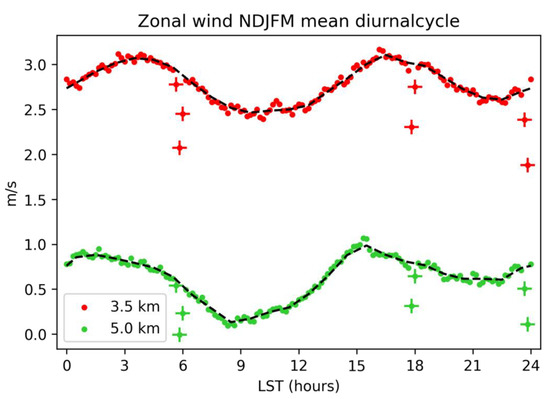
Figure A1.
NDJFM zonal wind diurnal cycle based on original EAR data for two altitudes: 3.5 km (red) and 5.0 km (green). Biased points are indicated by “+”. Black dashed lines correspond to similar diurnal cycle but for hourly means with removed biased points.
Figure A2 shows the profiles of latent heating and vertical wind for specific clouds that were studied. The latent heating profiles were based on [46] and were adjusted to suit the conditions prevailing over West Sumatra. Specifically, for each profile, the bottom level was set at 2 km (above the mountain range), and the top level (16 km) was chosen to be in close proximity to the cold point tropopause, which was calculated based on the mean temperature profile from soundings in Padang. The vertical wind profiles were calculated using Equation (3), as presented in the methodology. The primary difference between the vertical wind and latent heating profiles is a shift in the altitude of the maximum value. For instance, the maximum latent heating for deep convective clouds occurs at around 6 km, whereas the maximum calculated updrafts occur at around 7 km. This shift is primarily attributable to changes in the air density.
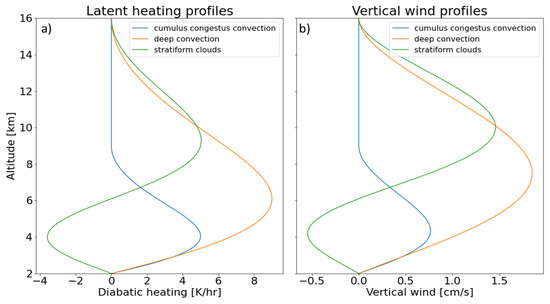
Figure A2.
(a) Diabatic heating profiles for cumulus congestus (blue), deep convective (orange), and stratiform clouds (green) used in this study. (b) Vertical wind profiles calculated based on latent heating profiles in panel (a).
Figure A3 presents the averaged vertical wind anomalies for specific days, categorized by ENSO and MJO phases, as well as days relative to CCKW passage (represented by the blue lines). Each panel also shows a fitted vertical wind velocity profile due to the latent heating of a cloud composition that best matches the observed data. The legend in each panel provides a quantitative assessment of the change in contribution of a specific cloud type (cumulus congestus, deep, and stratiform clouds) to the total cloud population. The bold numbers provided in the legend denote values that exceed the typical variability for a specific cloud type in West Sumatra, as measured by a standard deviation of the 50-member bootstrap resampling. Most of the profiles show good agreement with the data, particularly in the middle troposphere. However, differences are noticeable in the lower and upper troposphere, primarily due to the fact that the fitting profiles converge to zero at the lower and upper altitude boundaries, which is not the case in the observations owing to the overlap issue. Specifically, the first data point, which is about 1200 m above the ground, is affected by this issue.
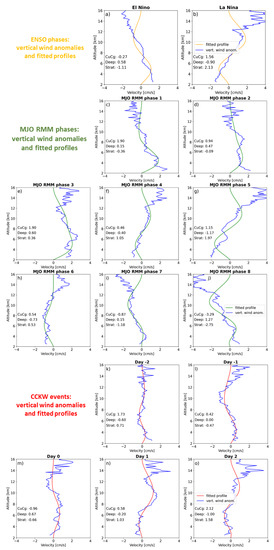
Figure A3.
Averaged vertical wind anomalies (blue lines) for specific days of ENSO phases (a,b), MJO RMM phases (c–j), days relative to CCKW passage (k–o). Orange lines indicate fitted vertical wind profile for ENSO phases, green lines—for MJO RMM phases and red lines—for days relative to CCKW passage. Numbers presented on each panel corresponds to the values of , and for presented fitted profile.
A typical day in West Sumatra is characterized by a diurnal development of convective clouds and their horizontal propagation, schematically depicted in Figure A4. The differential absorption of solar heat between land and sea leads to breeze circulation which intensifies the prevailing low-level westerlies and results in the development of convective clouds along the coast and upwind slopes of the Barisan Mountains before local noon. Over the next few hours, these cloud systems grow over the region. The lack of their horizontal movement during this time can be partially explained by the observed minimum of the semidiurnal tide, which can act to minimize horizontal propagation. The clouds reach the congestus stage and start propagating eastward after local noon when mean westerlies are supported by both diurnal (breeze) and semidiurnal (tides) components. Precipitation then arrives over the EAR location in the Barisan Mountains. The precipitation increases in the following few hours as convective clouds grow into the deep convective stage and move further inland. Maximum precipitation occurs at 16–17 LST, accompanied by low-level horizontal wind convergence. Later, the precipitation rates decrease significantly as they change from the convective to the stratiform type. This shift is due to the upper-level outflow from deep convection located inland, which brings thick anvil clouds over West Sumatra. This easterly outflow is supported by both the mean upper-level easterlies and the minima in the diurnal and semidiurnal modes. Although the phase of the semidiurnal cycle (tides) appears to be in phase and, therefore, supportive of the diurnal evolution cycle described above, it should be noted that its magnitude is roughly one order of magnitude smaller than that of the mean horizontal winds.
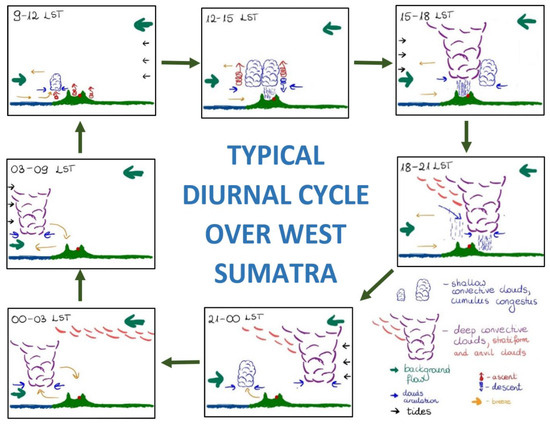
Figure A4.
Typical diurnal cycle over West Sumatra.
Figure A5 and Figure A6 illustrate the variability in diurnal and semidiurnal amplitudes for all wind components in response to ENSO, QBO, MJO, and CCKW activity. The results show that ENSO and QBO exert minimal influence on the amplitudes of both sub-diurnal modes in horizontal winds. However, a noticeable impact of ENSO is observed in the vertical wind component below 500 hPa. During El Niño events, the diurnal cycle amplitude is significantly enhanced (up to approximately 0.5 cm/s) between 700 and 500 hPa. This phenomenon may be linked to an increased population of convective clouds. On the other hand, QBO influences the diurnal cycle amplitude of the vertical wind component above 400 mb. During the Westerlies phase (Easterlies phase), this amplitude is reduced (increased) by approximately 0.2 cm/s. This effect is likely associated with elevated stratospheric temperatures during the easterlies phase and an increased accumulation of clouds. The impact of QBO on the semidiurnal amplitude is minor. The effect of MJO and CCKW on diurnal and semidiurnal cycle amplitudes for all components of wind is much larger than the effects of ENSO and QBO. The sub-diurnal amplitudes of all wind components associated with the Madden–Julian Oscillation (MJO) and the Convectively Coupled Kelvin Waves (CCKWs) exhibit significant variability with altitude. MJO RMM phases 1–3 (convectively active over West Sumatra) and the day of passage of a Kelvin wave, along with the subsequent day, consistently manifest the highest amplitudes in the diurnal cycle across all wind components. This is a manifestation of coupling between tropospheric dynamics and cloud field evolution on a diurnal time scale. For example, the enhanced diurnal amplitudes of horizontal winds below 500 hPa in RMM phases 1–3 indicate enhanced low-level convergence during the early afternoon (Figure 2a,c), which supports the upward motions observed at that time (positive vertical wind anomaly around 500 hPa in Figure 2i and increased diurnal amplitude in Figure A5). Therefore, this feedback supports the development of cumulus convection at that these times, which impact the overall cloud field population (Figure 11). Conversely, when stratiform clouds appear enhanced two days after a CCKW event (Figure 11), we observed a strong increase in zonal wind diurnal and semidiurnal amplitudes (dark blue in Figure A5 and Figure A6), which supports an argument that these clouds originate from enhanced deep convection over Central Sumatra and contribute to the observed positive anomaly in vertical wind (Figure 9c), supported by its diurnal variability (Figure A5l).
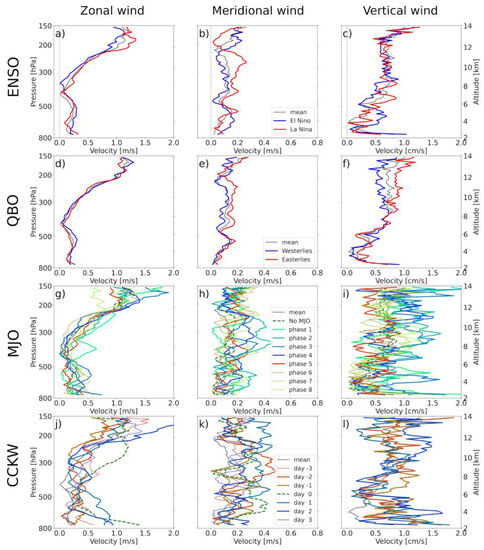
Figure A5.
Variations in the amplitude of mean diurnal cycle during ENSO (a–c), QBO (d–f), MJO (g–i), and CCKW (j–l) activity. Left column corresponds to zonal wind, middle column presents similar results for meridional wind, and right column for vertical wind.
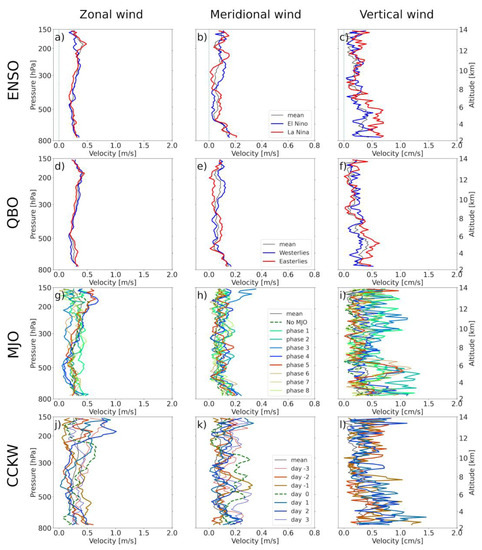
Figure A6.
Same as Figure A5 but for semidiurnal cycle amplitude. Variations in the amplitude of mean diurnal cycle during ENSO (a–c), QBO (d–f), MJO (g–i), and CCKW (j–l) activity.
References
- Ramage, C.S. Role of a Tropical “Maritime Continent” in the Atmospheric Circulation 1. Mon. Weather Rev. 1968, 96, 365–370. [Google Scholar] [CrossRef]
- Simpson, J.; Keenan, T.D.; Ferrier, B.; Simpson, R.H.; Holland, G.J. Cumulus Mergers in the Maritime Continent Region. Meteorol. Atmos. Phys. 1993, 51, 73–99. [Google Scholar] [CrossRef]
- Janowiak, J.E.; Arkin, P.A.; Morrissey, M. An Examination of the Diurnal Cycle in Oceanic Tropical Rainfall Using Satellite and In Situ Data. Mon. Weather Rev. 1994, 122, 2296–2311. [Google Scholar] [CrossRef]
- Qian, J.H. Why Precipitation Is Mostly Concentrated over Islands in the Maritime Continent. J. Atmos. Sci. 2008, 65, 1428–1441. [Google Scholar] [CrossRef]
- Marzuki, M.; Suryanti, K.; Yusnaini, H.; Tangang, F.; Muharsyah, R.; Vonnisa, M.; Devianto, D. Diurnal Variation of Precipitation from the Perspectives of Precipitation Amount, Intensity and Duration over Sumatra from Rain Gauge Observations. Int. J. Climatol. 2021, 41, 4386–4397. [Google Scholar] [CrossRef]
- Timmermann, A.; An, S.I.; Kug, J.S.; Jin, F.F.; Cai, W.; Capotondi, A.; Cobb, K.; Lengaigne, M.; McPhaden, M.J.; Stuecker, M.F.; et al. El Niño–Southern Oscillation Complexity. Nature 2018, 559, 535–545. [Google Scholar] [CrossRef] [PubMed]
- Fitriany, A.A.; Flatau, P.J.; Khoirunurrofik, K.; Riama, N.F. Assessment on the Use of Meteorological and Social Media Information for Forest Fire Detection and Prediction in Riau, Indonesia. Sustainability 2021, 13, 11188. [Google Scholar] [CrossRef]
- Peatman, S.C.; Schwendike, J.; Birch, C.E.; Marsham, J.H.; Matthews, A.J.; Yang, G.Y. A Local-to-Large Scale View of Maritime Continent Rainfall: Control by ENSO, MJO, and Equatorial Waves. J. Clim. 2021, 34, 8933–8953. [Google Scholar] [CrossRef]
- Saji, N.H.; Goswami, B.N.; Vinayachandran, P.N.; Yamagata, T. A Dipole Mode in the Tropical Indian Ocean. Nature 1999, 401, 360–363. [Google Scholar] [CrossRef]
- Webster, P.J.; Moore, A.M.; Loschnigg, J.P.; Leben, R.R. Coupled Ocean-Atmosphere Dynamics in the Indian Ocean during 1997–98. Nature 1999, 401, 356–360. [Google Scholar] [CrossRef]
- Lau, K.M.; Sheu, P.J. Annual Cycle, Quasi-Biennial Oscillation, and Southern Oscillation in Global Precipitation. J. Geophys. Res. 1988, 93, 10975–10988. [Google Scholar] [CrossRef]
- Madden, R.A.; Julian, P.R. Description of Global-Scale Circulation Cells in the Tropics with a 40–50 Day Period. J. Atmos. Sci. 1972, 29, 1109–1123. [Google Scholar] [CrossRef]
- Zhang, C. Madden-Julian Oscillation: Bridging Weather and Climate. Bull. Am. Meteorol. Soc. 2013, 94, 1849–1870. [Google Scholar] [CrossRef]
- Zhang, C. Madden-Julian Oscillation. Rev. Geophys. 2005, 43, 1–36. [Google Scholar] [CrossRef]
- Jiang, X.; Adames, Á.F.; Kim, D.; Maloney, E.D.; Lin, H.; Kim, H.; Zhang, C.; DeMott, C.A.; Klingaman, N.P. Fifty Years of Research on the Madden-Julian Oscillation: Recent Progress, Challenges, and Perspectives. J. Geophys. Res. Atmos. 2020, 125, e2019JD030911. [Google Scholar] [CrossRef]
- Roundy, P.E.; Frank, W.M. A Climatology of Waves in the Equatorial Region. J. Atmos. Sci. 2004, 61, 2105–2132. [Google Scholar] [CrossRef]
- Kiladis, G.N.; Wheeler, M.C.; Haertel, P.T.; Straub, K.H.; Roundy, P.E. Convectively Coupled Equatorial Waves. Rev. Geophys. 2009, 47, RG2003. [Google Scholar] [CrossRef]
- Sakaeda, N.; Kiladis, G.; Dias, J. The Diurnal Cycle of Rainfall and the Convectively Coupled Equatorial Waves over the Maritime Continent. J. Clim. 2020, 33, 3307–3331. [Google Scholar] [CrossRef]
- Peatman, S.C.; Matthews, A.J.; Stevens, D.P. Propagation of the Madden-Julian Oscillation through the Maritime Continent and Scale Interaction with the Diurnal Cycle of Precipitation. Q. J. R. Meteorol. Soc. 2014, 140, 814–825. [Google Scholar] [CrossRef]
- Baranowski, D.B.; Flatau, M.K.; Flatau, P.J.; Matthews, A.J. Phase Locking between Atmospheric Convectively Coupled Equatorial Kelvin Waves and the Diurnal Cycle of Precipitation over the Maritime Continent. Geophys. Res. Lett. 2016, 43, 8269–8276. [Google Scholar] [CrossRef]
- Baranowski, D.B.; Flatau, M.K.; Flatau, P.J.; Karnawati, D.; Barabasz, K.; Labuz, M.; Latos, B.; Schmidt, J.M.; Paski, J.A.I. Marzuki Social-Media and Newspaper Reports Reveal Large-Scale Meteorological Drivers of Floods on Sumatra. Nat. Commun. 2020, 11, 2503. [Google Scholar] [CrossRef] [PubMed]
- Mori, S.; Jun-Ichi, H.; Tauhid, Y.I.; Yamanaka, M.D.; Okamoto, N.; Murata, F.; Sakurai, N.; Hashiguchi, H.; Sribimawati, T. Diurnal Land-Sea Rainfall Peak Migration over Sumatera Island, Indonesian Maritime Continent, Observed by TRMM Satellite and Intensive Rawinsonde Soundings. Mon. Weather Rev. 2004, 132, 2021–2039. [Google Scholar] [CrossRef]
- Love, B.S.; Matthews, A.J.; Lister, G.M.S. The Diurnal Cycle of Precipitation over the Maritime Continent in a High-Resolution Atmospheric Model. Q. J. R. Meteorol. Soc. 2011, 137, 934–947. [Google Scholar] [CrossRef]
- Hassim, M.E.E.; Lane, T.P.; Grabowski, W.W. The Diurnal Cycle of Rainfall over New Guinea in Convection-Permitting WRF Simulations. Atmos. Chem. Phys. 2016, 16, 161–175. [Google Scholar] [CrossRef]
- Peatman, S.C.; Birch, C.E.; Schwendike, J.; Marsham, J.H.; Dearden, C.; Webster, S.; Neely, R.R.; Matthews, A.J. The Role of Density Currents and Gravity Waves in the Offshore Propagation of Convection over Sumatra. Mon. Weather Rev. 2023, 151, 1757–1777. [Google Scholar] [CrossRef]
- Baranowski, D.B.; Waliser, D.E.; Jiang, X.; Ridout, J.A.; Flatau, M.K. Contemporary GCM Fidelity in Representing the Diurnal Cycle of Precipitation Over the Maritime Continent. J. Geophys. Res. Atmos. 2019, 124, 747–769. [Google Scholar] [CrossRef]
- Lindzen, R.S.; Chapman, S. Atmospheric Tides. Space Sci. Rev. 1969, 10, 3–188. [Google Scholar] [CrossRef]
- Lindzen, R.S.; Hong, S. Effects of Mean Winds and Horizontal Temperature Gradients on Solar and Lunar Semidiurnal Tides in the Atmosphere. J. Atmos. Sci. 1974, 31, 1421–1446. [Google Scholar] [CrossRef]
- Greenfield, R.S.; Krishnamurti, T.N. The Winter Monsoon Experiment—Report of December 1978 Field Phase. Bull. Am. Meteorol. Soc. 1979, 60, 439–444. [Google Scholar] [CrossRef]
- Webster, P.J.; Lukas, R. TOGA COARE: The Complex Ocean-Atmosphere Response Experiment. Bull. Am. Meteorol. Soc. 1992, 73, 1377–1416. [Google Scholar] [CrossRef]
- Gottschalck, J.; Roundy, P.E.; Schreck, C.J.; Vintzileos, A.; Zhang, C. Large-Scale Atmospheric and Oceanic Conditions during the 2011–12 DYNAMO Field Campaign. Mon. Weather Rev. 2013, 141, 4173–4196. [Google Scholar] [CrossRef]
- Yoneyama, K.; Zhang, C.; Long, C.N. Tracking Pulses of the Madden-Julian Oscillation. Bull. Am. Meteorol. Soc. 2013, 94, 1871–1891. [Google Scholar] [CrossRef]
- Yoneyama, K.; Zhang, C. Years of the Maritime Continent. Geophys. Res. Lett. 2020, 47, e2020GL087182. [Google Scholar] [CrossRef]
- Fukao, S.; Hashiguchi, H.; Yamamoto, M.; Tsuda, T.; Nakamura, T.; Yamamoto, M.K.; Sato, T.; Hagio, M.; Yabugaki, Y. Equatorial Atmosphere Radar (EAR): System Description and First Results. Radio Sci. 2003, 38, 1053. [Google Scholar] [CrossRef]
- Gage, K.S.; McAfee, J.R.; Reid, G.C. Diurnal Variation in Vertical Motion over the Central Equatorial Pacific from VHF Wind-profiling Doppler Radar Observations at Christmas Island (2° N, 157° W). Geophys. Res. Lett. 1992, 19, 1827–1830. [Google Scholar] [CrossRef]
- Uma, K.N.; Rao, T.N. Diurnal Variation in Vertical Air Motion over a Tropical Station, Gadanki (13.5° N, 79.2° E), and Its Effect on the Estimation of Mean Vertical Air Motion. J. Geophys. Res. Atmos. 2009, 114. [Google Scholar] [CrossRef]
- Uma, K.N.; Shankar Das, S.; Venkat Ratnam, M.; Viswanathan Suneeth, K. Assessment of Vertical Air Motion among Reanalyses and Qualitative Comparison with Very-High-Frequency Radar Measurements over Two Tropical Stations. Atmos. Chem. Phys. 2021, 21, 2083–2103. [Google Scholar] [CrossRef]
- Huffman, G.; Bolvin, D.; Nelkin, E. Integrated Multi-SatellitE Retrievals for GPM (IMERG) Technical Documentation. Math. Teach. 2017, 612, 54. [Google Scholar]
- Kalnay, E.; Kanamitsu, M.; Kistler, R.; Collins, W.; Deaven, D.; Gandin, L.; Iredell, M.; Saha, S.; White, G.; Woollen, J.; et al. The NCEP/NCAR 40-Year Reanalysis Project. Bull. Am. Meteorol. Soc. 1996, 77, 437–472. [Google Scholar] [CrossRef]
- 50 Mb Zonal Wind Index—CDAS. Available online: https://ftp.cpc.ncep.noaa.gov/wd52dg/data/indices/qbo.u50.index (accessed on 11 August 2023).
- Wheeler, M.C.; Hendon, H.H. An All-Season Real-Time Multivariate MJO Index: Development of an Index for Monitoring and Prediction. Mon. Weather Rev. 2004, 132, 1917–1932. [Google Scholar] [CrossRef]
- RMM Values up to “Real Time”. Available online: http://www.bom.gov.au/climate/mjo/graphics/rmm.74toRealtime.txt (accessed on 11 August 2023).
- Baranowski, D.B.; Flatau, M.K.; Flatau, P.J.; Matthews, A.J. Impact of Atmospheric Convectively Coupled Equatorial Kelvin Waves on Upper Ocean Variability. J. Geophys. Res. 2016, 121, 2045–2059. [Google Scholar] [CrossRef]
- Wheeler, M.; Kiladis, G.N. Convectively Coupled Equatorial Waves: Analysis of Clouds and Temperature in the Wavenumber-Frequency Domain. J. Atmos. Sci. 1999, 56, 374–399. [Google Scholar] [CrossRef]
- Huffman, G.J.; Adler, R.F.; Bolvin, D.T.; Gu, G.; Nelkin, E.J.; Bowman, K.P.; Hong, Y.; Stocker, E.F.; Wolff, D.B. The TRMM Multisatellite Precipitation Analysis (TMPA): Quasi-Global, Multiyear, Combined-Sensor Precipitation Estimates at Fine Scales. J. Hydrometeorol. 2007, 8, 38–55. [Google Scholar] [CrossRef]
- Siebesma, P.; Bony, S.; Jacob, C.; Stevens, B. Tropical and Subtropical Cloud Systems. In Clouds and Climate; Cambridge University Press: Cambridge, UK, 2020; pp. 251–278. [Google Scholar]
- Uma, K.N.; Rao, T.N. Characteristics of Vertical Velocity Cores in Different Convective Systems Observed over Gadanki, India. Mon. Weather Rev. 2009, 137, 954–975. [Google Scholar] [CrossRef]
- Ciesielski, P.E.; Haerte, P.T.; Johnson, R.H.; Wang, J.; Loehrer, S.M. Developing High-Quality Field Program Sounding Datasets. Bull. Am. Meteorol. Soc. 2012, 93, 325–336. [Google Scholar] [CrossRef]
- Johnson, R.H.; Rickenbach, T.M.; Rutledge, S.A.; Ciesielski, P.E.; Schubert, W.H. Trimodal Characteristics of Tropical Convection. J. Clim. 1999, 12, 2397–2418. [Google Scholar] [CrossRef]
- Houze, R.A. Mesoscale Convective Systems. Rev. Geophys. 2004, 42, 1–43. [Google Scholar] [CrossRef]
- Drager, A.J.; van den Heever, S.C. Characterizing Convective Cold Pools. J. Adv. Model. Earth Syst. 2017, 9, 1091–1115. [Google Scholar] [CrossRef]
- Johnson, R.H. Vertical Motion in Near-Equatorial Winter Monsoon Convection. J. Meteorol. Soc. Japan. Ser. II 1982, 60, 682–690. [Google Scholar] [CrossRef]
- Gage, K.S.; Mcafee, J.R.; Carter, D.A.; Ecklund, W.L.; Riddle, A.C.; Reid, G.C.; Balsley, B.B. Long-Term Mean Vertical Motion over the Tropical Pacific: Wind-Profiling Doppler Radar Measurements. Science 1991, 254, 1771–1773. [Google Scholar] [CrossRef]
- Nastrom, G.D.; Vanzandt, T.E. Mean Vertical Motions Seen by Radar Wind Profilers. J. Appl. Meteorol. 1994, 33, 984–995. [Google Scholar] [CrossRef]
- Schumacher, C.; Houze, R.A.; Kraucunas, I. The Tropical Dynamical Response to Latent Heating Estimates Derived from the TRMM Precipitation Radar. J. Atmos. Sci. 2004, 61, 1341–1358. [Google Scholar] [CrossRef]
- Marzuki, M.; Yusnaini, H.; Tangang, F.; Muharsyah, R.; Vonnisa, M.; Harmadi, H. Land—Sea Contrast of Diurnal Cycle Characteristics and Rain Event Propagations over Sumatra According to Different Rain Duration and Seasons. Atmos. Res. 2022, 270, 106051. [Google Scholar] [CrossRef]
- May, P.T.; Rajopadhyaya, D.K. Vertical Velocity Characteristics of Deep Convection over Darwin, Australia. Mon. Weather Rev. 1999, 127, 1056–1071. [Google Scholar] [CrossRef]
- Da Silva, N.A.; Muller, C.; Shamekh, S.; Fildier, B. Significant Amplification of Instantaneous Extreme Precipitation With Convective Self-Aggregation. J. Adv. Model. Earth Syst. 2021, 13, e2021MS002607. [Google Scholar] [CrossRef] [PubMed]
- Marzuki; Randeu, W.L.; Kozu, T.; Shimomai, T.; Hashiguchi, H.; Schönhuber, M. Raindrop Axis Ratios, Fall Velocities and Size Distribution over Sumatra from 2D-Video Disdrometer Measurement. Atmos. Res. 2013, 119, 23–27. [Google Scholar] [CrossRef]
- Lu, J.; Li, T.; Shen, X. Precipitation Diurnal Cycle over the Maritime Continent Modulated by ENSO. Clim. Dyn. 2023, 61, 2547–2564. [Google Scholar] [CrossRef]
- Reid, J.S.; Xian, P.; Hyer, E.J.; Flatau, M.K.; Ramirez, E.M.; Turk, F.J.; Sampson, C.R.; Zhang, C.; Fukada, E.M.; Maloney, E.D. Multi-Scale Meteorological Conceptual Analysis of Observed Active Fire Hotspot Activity and Smoke Optical Depth in the Maritime Continent. Atmos. Chem. Phys. 2012, 12, 2117–2147. [Google Scholar] [CrossRef]
- Qian, J.H. Mechanisms for the Dipolar Patterns of Rainfall Variability over Large Islands in the Maritime Continent Associated with the Madden-Julian Oscillation. J. Atmos. Sci. 2020, 77, 2257–2278. [Google Scholar] [CrossRef]
- Matthews, A.J. Dynamical Propagation and Growth Mechanisms for Convectively Coupled Equatorial Kelvin Waves over the Indian Ocean. Q. J. R. Meteorol. Soc. 2021, 147, 4310–4336. [Google Scholar] [CrossRef]
- Gushchina, D.; Zheleznova, I.; Osipov, A.; Olchev, A. Effect of Various Types of ENSO Events on Moisture Conditions in the Humid and Subhumid Tropics. Atmosphere 2020, 11, 1354. [Google Scholar] [CrossRef]
- Kikuchi, K.; Takayabu, Y.N. Equatorial Circumnavigation of Moisture Signal Associated with the Madden-Julian Oscillation (MJO) during Boreal Winter. J. Meteorol. Soc. Japan 2003, 81, 851–869. [Google Scholar] [CrossRef]
- Morita, J.; Takayabu, Y.N.; Shige, S.; Kodama, Y. Analysis of Rainfall Characteristics of the Madden-Julian Oscillation Using TRMM Satellite Data. Dyn. Atmos. Ocean. 2006, 42, 107–126. [Google Scholar] [CrossRef]
- Yokoi, S.; Mori, S.; Katsumata, M.; Geng, B.; Yasunaga, K.; Syamsudin, F.; Nurhayati; Yoneyama, K. Diurnal Cycle of Precipitation Observed in the Western Coastal Area of Sumatra Island: Offshore Preconditioning by Gravity Waves. Mon. Weather Rev. 2017, 145, 3745–3761. [Google Scholar] [CrossRef]
- Yokoi, S.; Mori, S.; Syamsudin, F.; Haryoko, U.; Geng, B. Environmental Conditions for Nighttime Offshore Migration of Precipitation Area as Revealed by in Situ Observation off Sumatra Island. Mon. Weather Rev. 2019, 147, 3391–3407. [Google Scholar] [CrossRef]
- Inoue, K.; Adames, Á.F.; Yasunaga, K. Vertical Velocity Profiles in Convectively Coupled Equatorial Waves and MJO: New Diagnoses of Vertical Velocity Profiles in the Wavenumber-Frequency Domain. J. Atmos. Sci. 2020, 77, 2139–2162. [Google Scholar] [CrossRef]
- Heymsfield, G.M.; Tian, L.; Heymsfield, A.J.; Li, L.; Guimond, S. Characteristics of Deep Tropical and Subtropical Convection from Nadir-Viewing High-Altitude Airborne Doppler Radar. J. Atmos. Sci. 2010, 67, 285–308. [Google Scholar] [CrossRef]
Disclaimer/Publisher’s Note: The statements, opinions and data contained in all publications are solely those of the individual author(s) and contributor(s) and not of MDPI and/or the editor(s). MDPI and/or the editor(s) disclaim responsibility for any injury to people or property resulting from any ideas, methods, instructions or products referred to in the content. |
© 2023 by the authors. Licensee MDPI, Basel, Switzerland. This article is an open access article distributed under the terms and conditions of the Creative Commons Attribution (CC BY) license (https://creativecommons.org/licenses/by/4.0/).