Abstract
Long-term exposure to poor air quality has been associated with respiratory viral infections such as influenza and measles. Some epidemiological studies in North America, Europe, and Asia also suggest that exposure to air pollution is associated with increased SARS-CoV-2 infection and mortality associated with COVID-19. However, few studies have been conducted on this topic in South America. In this study, we investigate the association between ambient PM2.5, NO2, and O3 and their interaction with COVID-19-associated deaths in Brazil, the largest country in South America. We apply a negative binomial mixed model with zero inflation using municipality-level COVID-19 deaths as the endpoint and the long-term average of PM2.5, NO2, and O3 as the exposure. We added a random intercept by state to account for potential correlations between communities within the same state. After adjusting the model for several potential confounders, including meteorological variables, demographic characteristics, socioeconomic aspects, and healthcare conditions, we found a positive association between PM2.5 and COVID-19 deaths in Brazil, where a 1 μg/m3 increase in the long-term average of PM2.5 was associated with a 10.22% (95% CI: 9.35; 11.09) increase in COVID-19 deaths. In contrast, O3 and NO2 showed negative associations. As suggested by the literature in other countries, our results suggest that air pollution is an important cofactor that increases the risk of death from COVID-19 in Brazil. The effects of air pollution in Brazil are pronounced, indicating the need for improved air quality control policies.
1. Introduction
The coronavirus disease 2019 (COVID-19), caused by severe acute respiratory syndrome coronavirus-2 (SARS-CoV-2), emerged in December 2019 in Wuhan City, Hubei province, China. To date, as of 30 November 2022, over 648,144,113 million cases and 6,640,896 million deaths have been reported worldwide. Although public health sectors implemented several control strategies, such as social distancing, hygienic measures, and the development of anti-viral drugs and vaccines, the situation is still critical because of several challenges facing the global control strategy [1]. Therefore, it is recommended to reassess the risk of COVID-19 infection from time to time, especially after vaccine availability [2].
Several epidemiological studies in North America [3,4], Europe [5,6,7,8,9,10,11], and Asia [12,13,14,15] have hypothesized that exposure to air pollution is linked with increased numbers of SARS-CoV-2 infections and mortality associated with COVID-19. For example, in the U.S., each 1 μg/m3 increase in the long-term average of fine particles with diameters of 2.5μm and smaller (PM2.5) was associated with an 11% (95% confidence interval (CI): 6; 17) increase in mortality from COVID-19 [16]. In another study, also in the U.S., NO2 exposure was positively associated with an increase in mortality and lethality rates from COVID-19, with an estimated increase of 16.2% (95% CI: 8.7; 24.0) and 11.3% (95% CI: 4.9; 18.2), respectively [17]. In Mexico City, a 1 μg/m3 increase in PM2.5 was associated with an increase of 7.4% in mortality-related COVID-19 [18]. In England, each 1 μg/m3 increase in long-term average PM2.5 was associated with a 12% increase in COVID-19 cases [10]. In Germany, a 1 μg/m3 increase in PM2.5 was associated with 199.46 more cases of COVID-19 per 100,000 population [8]. In China, Zhu et al. [14] reported positive associations between air pollution and cases of COVID-19, where a 10 μg/m3 increase in O3, NO2, PM10, and PM2.5 was associated with 4.76, 6.94, 1.76, and 2.24% increase in the daily number of confirmed cases of COVID-19, respectively.
Isphording and Pestel [19] summarize three plausible associations between air pollution and the prevalence and progression of COVID-19. First, long-term exposure to air pollution leads to certain pre-diseases in susceptible groups. Second, short-term exposure can cause acute respiratory inflammation and reduce immune responses in people [20]. Finally, aerosols and particulate matter (PM) can prolong the residence time of the virus in the air, increasing the likelihood of airborne infection [4].
Although there is growing evidence in the literature that exposure to air pollution is associated with increased cases of infection and mortality related to SARS-CoV-2, little research has been conducted on this topic in South America. To fill this gap and contribute to a comprehensive understanding of the impact of long-term exposure to air pollutants on human health associated with COVID-19 in different regions of the world, we conducted a nationwide ecological study in Brazil using municipality-level data to examine the associations between ambient air pollution (PM2.5, NO2, and O3) and COVID-19 deaths. Our hypothesis is that Brazilian residents of municipalities with higher levels of long-term ambient air pollution are more susceptible to severe COVID-19 outcomes, leading to a higher number of deaths associated with COVID-19.
2. Methods
2.1. COVID-19 Data
Daily counts of COVID-19 deaths were assessed from the Ministry of Health in Brazil. The data were curated by [21]. We considered the outbreak period from 1 March 2020 to 30 April 2021. The data are spatially aggregated for the 5570 Brazilian municipalities. These municipalities are the smallest areas considered by the Brazilian political system. COVID-19 data include the following information: municipality ID, municipality name, state, population of the municipality in 2021, number of new deaths disclosed, cumulative number of deaths, number of new cases disclosed, and cumulative number of cases.
2.2. Air Pollution Data
We accessed daily air pollution concentrations of PM2.5 (µg/m3), NO2 (ppb), and O3 (ppb) for the period between 1 March 2020, and 30 April 2021. The data were accessed from the European Centre for Medium-Range Weather Forecasts (ECMWF), which includes the Copernicus Atmosphere Monitoring Service (CAMS). Air pollution data have a spatial resolution of 0.125 degrees (approximately 12.5 km) and a temporal resolution of 6 h, with daily estimates for 00, 06, 12, and 18 UTC (Universal Time Coordinated).
2.3. Covariate Data
To adjust for potential bias, 14 factors were considered, including demographic, socioeconomic, climate, and health-related variables.
Demographic and socioeconomic factors include the municipality’s population, gross domestic product (GDP), average years of study, Municipal Human Development Index (MHDI), demographic density, GINI index, aging rate, and per capita income. These socioeconomic variables were accessed from the 2010 census, provided by the Brazilian Institute of Geography and Statistics—Instituto Brasileiro de Geografia e Estatística [22].
Climate data were accessed from the ERA-interim model, which consists of a global atmospheric reanalysis from ECMWF. Meteorological data included daily measurements (between 1 March 2020 and 30 April 2021) of surface temperature (°C), wind direction (m/s), atmospheric pressure (Pa), and precipitation (mm). The meteorological dataset was retrieved with a temporal resolution of 6h and a spatial resolution of 12.5 km.
Finally, the health-related variables included the availability of hospital beds and the number of health professionals in each municipality. These data were provided by the Ministry of Health in Brazil.
2.4. Data Consolidation
First, for the air pollution and weather data, we calculated the daily mean concentration of each air pollutant and the meteorological variables. Then, the air pollution and meteorological variables were aggregated at the municipality level using geographic information systems (GIS), considering only the average value of the headquarters of each municipality in Brazil.
Finally, the data from COVID-19 were merged with the air pollution data and covariates. This was a spatiotemporal merging based on the municipality and the day between 1 March 2020 and 30 April 2021. Note that the daily aspect was used in the merging only for the air pollution and weather variables.
2.5. Statistical Analysis
We applied a zero-inflated negative binomial mixed (ZINB) model to estimate associations between long-term exposure to PM2.5, NO2, and O3, and COVID-19 mortality rates. It is common for epidemiological surveillance data, such as COVID-19, to contain excessive zeros. This excess of zeros may be due to the underreporting of deaths, difficulty in recording new deaths in remote locations, or lack of new deaths in that location. Failure to account for the excess of zeros leads to heterogeneous results and inflated error type I. The negative binomial regression model is the most appropriate when the variable of interest has up to 10% zeros in the observations. However, when the inflation of zeros is between 10% and 50% of the observations, the zero-inflated models are more appropriate. The COVID-19 mortality data used in our study have 18.6% observations inflated with zeros.
All analyses were performed at the municipality level. We applied models for one pollutant, two pollutants, and three pollutants to estimate the effects of each air pollutant without and with control for co-pollutants. We added a random intercept for the state to account for the possible correlation of observations between municipalities within the same state. We adjusted the model for the 14 potential confounders and covariates (as described above). We report the results as percentage change in risk (and 95% CI) of COVID-19 mortality rates (MRR) associated with an increase in each air pollutant. The percentage change in risk was calculated as (MRR-1) × 100%. We conducted all analyses in R and performed model fitting using the NBZIMM package.
2.6. Sensitivity Analysis
We performed several sensitivity analyses. First, since the COVID-19 pandemic had a heterogeneous geographic spread in Brazil during the study period, we performed one sensitivity analysis by excluding the municipality of São Paulo and another one by excluding the municipality of Brasilia. Both locations experienced the most severe outbreaks of COVID-19 during the study period. We also conducted sensitivity analyses by stratifying the results by Brazilian regions, including the north, northeast, mid-west, south, and southeast regions. To avoid the influence of territorial areas where the population has a low/high IDHM, we tested the sensitivity of our primary results by excluding the municipalities with an IDHM lower than 500 and then those with an IDHM higher than 799. We performed a similar sensitivity analysis for municipalities with a GINI index less than 0.5 and a GINI index greater than 0.5. Note that the GINI index is an approach to estimate the degree of income concentration in a given group, indicating the difference between the income of the richest and the poorest individuals. We also conducted sensitivity analysis by excluding climate variables from the model, excluding education-related variables, and removing sociodemographic variables such as population density, per capita income, and ageing ratio. We also tested the model without the variable representing the number of available hospital beds. Finally, we conducted one analysis only for the year 2020 and another only for the months of 2021.
3. Results
Table 1 presents the descriptive statistics for the COVID-19 deaths PM2.5, NO2, and O3. The distribution of COVID-19 deaths exhibits asymmetry, as the standard deviation is much higher than the mean, with an estimated coefficient of variation of 8.97 deaths. On the other hand, the distribution of air pollutants was more homogeneous, with an estimated coefficient of variation of 0.50 µg/m3, 1.4 ppm, and 0.42 ppb for PM2.5, NO2, and O3, respectively.

Table 1.
Descriptive statistics for COVID-19 deaths and air pollutants from 1 March 2020 to 30 April 2021 in Brazil.
Figure 1 shows the spatial distribution of deaths from COVID-19 and the concentration of air pollutants in Brazil. We can observe that the highest NO2 levels occur in the northern region of the country. In this region, there are several municipalities with a high proportion of deaths that were due to COVID-19 per 1 million inhabitants. In early 2021, the northern region experienced a significant increase in deaths from COVID-19 that were due to oxygen deficiency in intensive care units [23]. O3 has a higher concentration in the coastal region of Brazil, including the northeast, southeast, and south regions. PM2.5 had the highest concentration in the north and part of the southeast, especially in São Paulo.
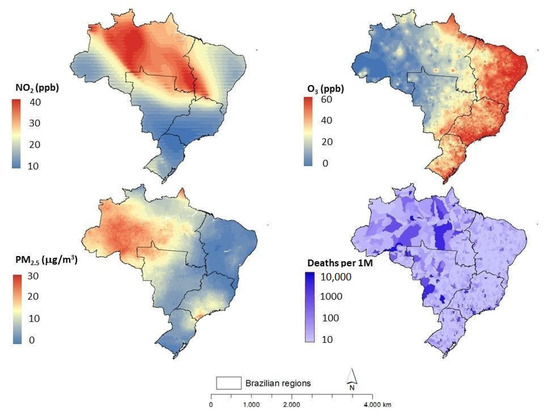
Figure 1.
Average concentrations of air pollutants (PM2.5, NO2, and O3) and deaths from COVID-19 (per 1 million inhabitants) for 1 March 2020 to 30 April 2021 in Brazil.
The percentage changes in COVID-19 deaths associated with air pollution (from the primary analysis, for both single-pollutant, bi-pollutant, and tri-pollutant models) are shown in Figure 2. Figure 3, Figure 4 and Figure 5 show the full results of the mortality risk ratios (MRR), including the results of the primary and sensitivity analyses for the single pollutant, bi-pollutant, and tri-pollutant models, respectively. Our results suggest a positive association between PM2.5 exposure and COVID-19 mortality rates at the municipality level. PM2.5 was the only pollutant with positive associations in all analyses—single, bi-, and tri-pollutant models (Figure 2). In the main analysis of the single pollutant model, it was found that a 1 µg/m3 increase in PM2.5 concentration was associated with a statistically significant 10.22% (95% CI: 9.35; 11.09) increase in COVID-19 deaths (Figure 2). In the bi-pollutant model, this association between PM2.5 and COVID-19 mortality was similar to the single pollutant model, while in the tri-pollutant model it was slight greater, with an estimated 12.31% (95% CI: 11.41; 13.22) increase in COVID-19 deaths (Figure 2). O3 had positive association only in the bi-pollutant model controlled by NO2, with an estimated increase of 14.98% (95% CI: 13.10; 16.89) in COVID-19 deaths (Figure 2). NO2 showed a negative association with deaths in COVID-19 for the mono-pollutant, bi-pollutant, and tri-pollutant models.
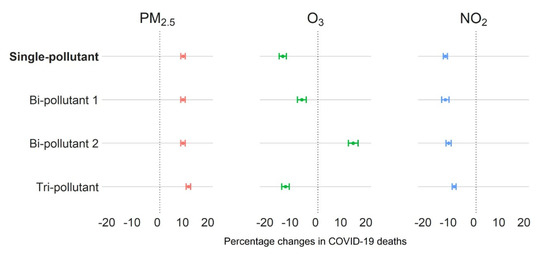
Figure 2.
Percentage change in death rate by COVID-19 associated with air pollution exposure (PM2.5, O3, and NO2) in Brazil between 1 March 2020 and 30 April 2021. Note 1: bi-pollutant 2 for PM2.5 was controlled for NO2; bi-pollutant 2 for O3 was controlled for NO2, and bi-pollutant 2 for NO2 was controlled for O3. Note 2: bi-pollutant 1 for PM2.5 was controlled for O3; bi-pollutant 1 for O3 was controlled for PM2.5, and bi-pollutant 1 for NO2 was controlled for PM2.5.
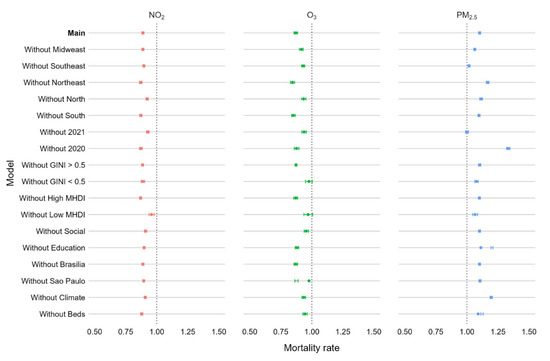
Figure 3.
Mortality risk ratios (MRR) and 95% confidence intervals for PM2.5 (red), O3 (green), and NO2 (blue) in single pollutant models. Note: the MRR of the main analysis (Main) is adjusted for all confounding factors. In the sensitivity analyses, we omitted data for the mid-west region (Without Midwest), southwest region (Without Southeast), northeast region (Without Northeast), northern region (Without North), southern region (Without South), year 2021 (Without 2021) and year 2020 (Without 2020), GINI index less than 0.5 (Without GINI < 0.5), GINI index greater than 0.5 (Without GAINI > 0.5), MHDI high (Without High MHDI) and MHDI low (Without low MHDI), HDI, density, GINI, and dependency ratio (Without Social), education (Without Education), and municipalities of São Paulo (Without Sao Paulo) and Brasilia (Without Brasilia); omitted the data for the temperature, wind direction, and sea pressure variables (Without climate), and hospital beds and health professionals (Without beds).
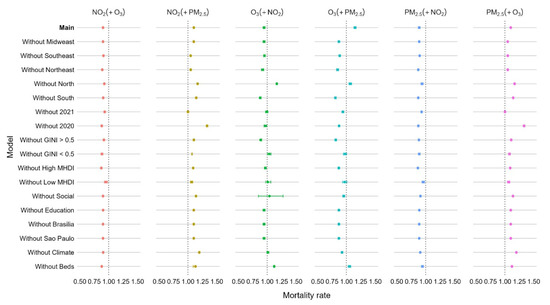
Figure 4.
Mortality risk ratios (MRR) and 95% confidence intervals in bi-pollutant models. Note 1: the panel NO2(+O3) shows the coefficients from NO2 in a model controlled for O3; the panel NO2(+PM2.5) shows the coefficients from NO2 in a model controlled for PM2.5; the panel O3(+NO2) shows the coefficients from O3 in a model controlled for NO2; the panel O3(+PM2.5) shows the coefficients from O3 in a model controlled for PM2.5; the panel PM2.5(+NO2) shows the coefficients from PM2.5 in a model controlled for NO2; and the panel PM2.5(+O3) shows the coefficients from PM2.5 in a model controlled for O3. Note 2: the MRR of the main analysis (Main) is adjusted for all confounding factors. In the sensitivity analyses, we omitted data for the mid-west region (Without Midwest), southwest region (Without Southeast), northeast region (Without Northeast), northern region (Without North), southern region (Without South), year 2021 (Without 2021) and year 2020 (Without 2020), GINI index less than 0.5 (Without GINI < 0.5), GINI index greater than 0.5 (Without GAINI > 0.5), MHDI high (Without High MHDI) and MHDI low (Without low MHDI), HDI, density, GINI, and dependency ratio (Without Social), education (Without Education), and municipalities of São Paulo (Without Sao Paulo) and Brasilia (Without Brasilia); omitted the data for the temperature, wind direction, and sea pressure variables (Without climate), and hospital beds and health professionals (Without beds).
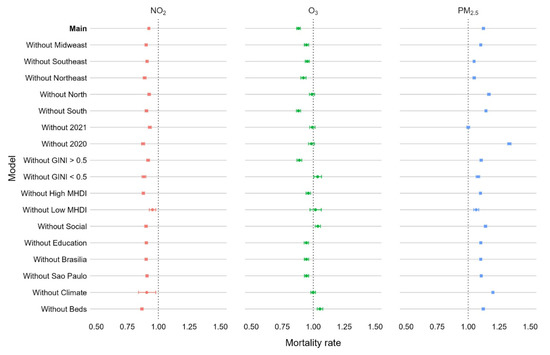
Figure 5.
Mortality risk ratios and 95% confidence intervals for PM2.5 (red), O3 (green) and NO2 (blue) for the model that considers all the three pollutants together. Note: the MRR of the main analysis (Main) is adjusted for all confounding factors. In the sensitivity analyses, we omitted data for the mid-west region (Without Midwest), southwest region (Without Southeast), northeast region (Without Northeast), northern region (Without North), southern region (Without South), year 2021 (Without 2021) and year 2020 (Without 2020), GINI index less than 0.5 (Without GINI < 0.5), GINI index greater than 0.5 (Without GAINI > 0.5), MHDI high (Without High MHDI) and MHDI low (Without low MHDI), HDI, density, GINI, and dependency ratio (Without Social), education (Without Education); and municipalities of São Paulo (Without Sao Paulo) and Brasilia (Without Brasilia); omitted the data for the temperature, wind direction, and sea pressure variables (Without climate) and hospital beds and health professionals (Without beds).
PM2.5 had a positive association with COVID-19 mortality in all sensitivity analyses, including for the single-pollutant (Figure 3), bi-pollutant (Figure 4), and tri-pollutant models (Figure 5). In contrast, NO2 had a negative association with COVID-19 deaths in all sensitivity analysis and all models (Figure 3, Figure 4 and Figure 5). For O3, the results varied substantially (in terms of the direction of the association) among the subgroup analysis and models (Figure 3, Figure 4 and Figure 5). Overall, we can observe that our findings suggest that our primary model is strongly sensitive to all subgroup analysis by sociodemographic, economic, and healthcare status variables (Figure 3). This suggests that these variables are strong confounders.
4. Discussion
Given the significant risks facing public health worldwide, there is an urgent need to uncover the possible parameters favoring the spread and progression of the COVID-19 pandemic. As far as we know, this is the first study in Brazil at the municipal level to address the role of PM2.5, NO2, and O3 in COVID-19 deaths with an analysis period of more than one year.
In this study, information on air pollution at the municipal level was used together with data from satellite observations and health and demographic data to investigate the associations between long-term exposure to three major air pollutants and COVID-19 deaths using mono- and tri-pollutant models. We observed significant positive associations between PM2.5 levels and COVID-19 deaths at the county level between 1 March 2020 and 30 April 2021. These results may help identify vulnerable and high-risk populations, particularly those living in areas with historically high PM2.5 exposure, such as the northern region (Figure 1), which has the highest PM2.5 levels. In this region, socioeconomic inequality in access to health services is considered high, which is a plausible explanation for the high number of deaths associated with COVID-19 [24].
Our results are consistent with the known association between PM2.5 exposure and respiratory disease and provide a rationale for extended follow-up as more COVID-19 data become available. Our results are consistent with the findings of the ecological study proposed by Xu et al. [4], which reported a statistically positive association between long-term PM2.5 exposure and COVID-19 mortality rates, focusing on U.S. counties and accounting for 20 potential confounders at the county level. The study also applied ZINB models to account for exceedances of zero in the observations, and its results suggest that a 1 μg/m3 increase in PM2.5 exposure is associated with an 8% (95% CI: 2; 15) increase in the COVID-19 mortality rate. In our study, we estimated a 10.22% (95% CI: 9.35; 11.09) increase in COVID-19 deaths associated with PM2.5 exposure. Our results are also consistent with those of Liang et al. [17], who applied ZINB models to estimate the association between long-term county-level exposure to NO2, PM2.5, and O3 and COVID-19 lethality and mortality in a nationwide cross-sectional study in the United States. They used single- and multiple-pollutant models and controlled for a number of confounding factors. A marginal association was found between PM2.5 and a 14.9% (95% CI: 0.0; 31.9) increase in COVID-19 mortality when controlling for concomitant pollutants. Similar to our study, no significant association was found between the COVID-19 mortality rate and long-term exposure to O3. However, in contrast to our results, Liang et al. [17] found positive associations when they considered the relationship between NO2 and COVID-19 mortality cases in the models for one pollutant, two pollutants, and three pollutants. This positive association with NO2 (also with PM2.5, PM10, and O3) was also observed in a study conducted in China (Tian et al., 2021).
Although this is the first national study in Brazil looking at the association between ambient air pollution and mortality-related COVID-19 in Brazil (as far as we know), some results have already been reported from local studies in Brazil. Our study is also consistent with this local literature in Brazil. For example, in the state of São Paulo, exposure to PM2.5 was associated with a 6.10% increase in mortality by COVID-19 [25]. Two other studies examined changes in air quality during the lockdown period [26,27]. In both studies, the authors focused on the state of Rio de Janeiro, which is located in the southern region of the country. They reported that pollution levels, especially O3 levels, decreased during the lockdown period.
The results also highlight the need for continuous monitoring of air quality and compliance with the National Clean Air Policy. Most Brazilians have no idea about the quality of the air they breathe. Brazil has an inefficient air quality network, with poor spatial and temporal coverage and low quality of air pollution monitors [28]. The World Resources Institute (WRI) Brazil study estimates that more than 50,000 Brazilians are victims of air pollution and only 1.7% of the country’s municipalities register air quality monitoring, especially in the southeastern region, and that most Brazilian cities do not meet the air quality standards established by the National Air Quality Policy [29]. The southeastern region of the country, where São Paulo is located, is the region of the country where air quality is monitored the most, and the state of São Paulo has its own air quality monitoring network. This is excellent for the state but shows how inconsistent air quality monitoring is across the country, which hinders consultation on public policies to improve air-related well-being.
We found that the mortality rate increased from 2020 to 2021 (Figure 3, “without 2021” and “without 2020”). This may be related to the time frame of the COVID dataset. In our study, the COVID data in 2020 covers almost the whole year, from 1 March to 31 December. In 2021, the data include only the first 4 months (January to April). In Brazil, the COVID vaccination started on 17 January 2021, only for the elderly population. The vaccination was progressing slowly through the age groups. In addition, we highlight that at the beginning of 2021 (January to April), Brazil faced serious problems from COVID-19, including a record of daily deaths (compared with 2020).
Our study has some limitations. First, although a substantial number of covariates were adjusted for in this analysis, several potential confounders such as indoor air pollution, ethnicity, age, education, sex, comorbidities, and viral variants were not available. Second, this is a study with an ecological design, in which we are assessing the relationship between COVID-19 and ambient air pollution at a population level living in each municipality rather than data for each individual. Ecological studies cannot demonstrate the causal effect of air pollution on coronavirus mortality, but they can provide exploratory evidence for the hypothesis that the relevant effects may be present. Third, predicted air pollutant concentrations may be subject to some measurement error because the data were derived from global datasets and remote sensing models. However, it should be noted that we were interested in temporal variations of air pollution (daily variations), and therefore ECMWF can be a reliable source for providing such data, as shown by some validation studies, including the validation of the global model CAMS [30].
Despite the limitations, our study has the following strengths. First, the main analysis model was adjusted for a large number of potential confounders, including 14 variables. This is critical because a larger number of covariates may reduce confounding, which potentially affects the estimated association between exposure and outcome in an ecological design. Second, as mentioned earlier, to our knowledge, this was the first national study in Brazil to examine the association between exposure to air pollution and COVID-19 mortality.
5. Conclusions
This study provides new insights into the association between air pollution and COVID-19 deaths. Understanding the role that external environmental factors play in triggering fatal cases from COVID-19 has valuable implications. Our findings suggest that patients with COVID-19 who live in Brazilian regions with high PM2.5 levels may be more susceptible to disease complications. These findings are consistent with most similar studies in the literature. The evidence presented here suggests that practical measures to reduce pollutant levels may also reduce exposure to the pandemic in Brazil.
Author Contributions
R.M.D. contributed to the conceptualization, data curation, methodology, formal analysis, writing-original draft, writing—review and editing. R.E.C. contributed to the conceptualization, writing—review and editing, and resources. T.d.A. contributed to the conceptualization, writing—review and editing, and resources. W.J.R. contributed to the conceptualization, methodology, writing—review and editing, supervision, resources, and funding acquisition. All authors have read and agreed to the published version of the manuscript.
Funding
This work was supported by the Brazilian Agencies National Council for Scientific and Technological Development (CNPq) and by the Ministry of Science, Technology, and Innovation (MCTI). Funding number: 441765/2020-3.
Institutional Review Board Statement
Not applicable.
Informed Consent Statement
Not applicable.
Data Availability Statement
The datasets used and/or analyzed during the current study are available from the corresponding author on reasonable request.
Conflicts of Interest
The authors declare no conflict of interest.
References
- Shehata, A.A.; Parvin, R.; Nagy, A.; Wang, Y.; Azhar, T.M.; Attia, Y.A.; Azhar, E.I.; Paul, A.K.; Rahmatullah, M. An overview of the ongoing challenges in SARS-CoV-2 global control. Ger. J. Microbiol. 2021, 1, 1–18. [Google Scholar] [CrossRef]
- Fawzy, M.; Hasham, A.; Houta, M.H.; Hasham, M.; Helmy, Y.A. COVID-19: Risk assessment and mitigation measures in healthcare and non-healthcare workplaces. Ger. J. Microbiol. 2021, 1, 19–28. [Google Scholar] [CrossRef]
- Wu, X.; Nethery, R.C.; Sabath, M.B.; Braun, D.; Dominici, F. Air Pollution and COVID-19 Mortality in the United States: Strengths and Limitations of an Ecological Regression Analysis. Sci. Adv. 2020, 6, eabd4049. [Google Scholar] [CrossRef] [PubMed]
- Xu, L.; Taylor, J.E.; Kaiser, J. Short-Term Air Pollution Exposure and COVID-19 Infection in the United States. Environ. Pollut. 2022, 292, 118369. [Google Scholar] [CrossRef]
- Andrée, B.P.J.; Chamorro, A.; Spencer, P.; Koomen, E.; Dogo, H. Revisiting the Relation between Economic Growth and the Environment; a Global Assessment of Deforestation, Pollution and Carbon Emission. Renew. Sustain. Energy Rev. 2019, 114, 109221. [Google Scholar] [CrossRef]
- Conticini, E.; Frediani, B.; Caro, D. Can Atmospheric Pollution Be Considered a Co-Factor in Extremely High Level of SARS-CoV-2 Lethality in Northern Italy? Environ. Pollut. 2020, 261, 114465. [Google Scholar] [CrossRef]
- Ogen, Y. Assessing Nitrogen Dioxide (NO2) Levels as a Contributing Factor to Coronavirus (COVID-19) Fatality. Sci. Total Environ. 2020, 726, 138605. [Google Scholar] [CrossRef]
- Prinz, A.L.; Richter, D.J. Long-Term Exposure to Fine Particulate Matter Air Pollution: An Ecological Study of Its Effect on COVID-19 Cases and Fatality in Germany. Environ. Res. 2022, 204, 111948. [Google Scholar] [CrossRef]
- Setti, L.; Passarini, F.; de Gennaro, G.; Barbieri, P.; Pallavicini, A.; Ruscio, M.; Piscitelli, P.; Colao, A.; Miani, A. Searching for SARS-COV-2 on Particulate Matter: A Possible Early Indicator of COVID-19 Epidemic Recurrence. Int. J. Environ. Res. Public Health 2020, 17, 2986. [Google Scholar] [CrossRef]
- Travaglio, M.; Yu, Y.; Popovic, R.; Selley, L.; Leal, N.S.; Martins, L.M. Links between Air Pollution and COVID-19 in England. Environ. Pollut. 2021, 268, 115859. [Google Scholar] [CrossRef]
- Zoran, M.A.; Savastru, R.S.; Savastru, D.M.; Tautan, M.N. Assessing the Relationship between Surface Levels of PM2.5 and PM10 Particulate Matter Impact on COVID-19 in Milan, Italy. Sci. Total Environ. 2020, 738, 139825. [Google Scholar] [CrossRef] [PubMed]
- Cui, Y.; Zhang, Z.-F.; Froines, J.; Zhao, J.; Wang, H.; Yu, S.-Z.; Detels, R. Air Pollution and Case Fatality of SARS in the People’s Republic of China: An Ecologic Study. Environ. Health 2003, 2, 15. [Google Scholar] [CrossRef] [PubMed]
- Hoang, T.; Tran, T.T.A. Ambient Air Pollution, Meteorology, and COVID-19 Infection in Korea. J. Med. Virol. 2021, 93, 878–885. [Google Scholar] [CrossRef] [PubMed]
- Zhu, Y.; Xie, J.; Huang, F.; Cao, L. Association between Short-Term Exposure to Air Pollution and COVID-19 Infection: Evidence from China. Sci. Total Environ. 2020, 727, 138704. [Google Scholar] [CrossRef] [PubMed]
- Yao, Y.; Pan, J.; Wang, W.; Liu, Z.; Kan, H.; Qiu, Y.; Meng, X.; Wang, W. Association of Particulate Matter Pollution and Case Fatality Rate of COVID-19 in 49 Chinese Cities. Sci. Total Environ. 2020, 741, 140396. [Google Scholar] [CrossRef] [PubMed]
- Wu, X.; Nethery, R.C.; Sabath, B.; Braun, D.; Dominici, F.; James, C. Exposure to Air Pollution and COVID-19 Mortality in the United States: A Nationwide Cross-Sectional Study. medRxiv 2020. [Google Scholar] [CrossRef]
- Liang, D.; Shi, L.; Zhao, J.; Liu, P.; Sarnat, J.A.; Gao, S.; Schwartz, J.; Liu, Y.; Ebelt, S.T.; Scovronick, N.; et al. Urban Air Pollution May Enhance COVID-19 Case-Fatality and Mortality Rates in the United States. Innovation 2020, 1, 100047. [Google Scholar] [CrossRef] [PubMed]
- López-Feldman, A.; Heres, D.; Marquez-Padilla, F. Air Pollution Exposure and COVID-19: A Look at Mortality in Mexico City Using Individual-Level Data. Sci. Total Environ. 2021, 756, 143929. [Google Scholar] [CrossRef]
- Isphording, I.E.; Pestel, N. Pandemic Meets Pollution: Poor Air Quality Increases Deaths by COVID-19. J. Environ. Econ. Manag. 2021, 108, 102448. [Google Scholar] [CrossRef]
- Tung, N.T.; Cheng, P.C.; Chi, K.H.; Hsiao, T.C.; Jones, T.; BéruBé, K.; Ho, K.F.; Chuang, H.C. Particulate Matter and SARS-CoV-2: A Possible Model of COVID-19 Transmission. Sci. Total Environ. 2021, 750, 141532. [Google Scholar] [CrossRef]
- Cota, W. Monitoring the Number of COVID-19 Cases and Deaths in Brazil at Municipal and Federative Units Level. 2020. Available online: https://covid19br.wcota.me/ (accessed on 20 June 2020).
- Instituto Brasileiro de Geografia e Estatística. Available online: https://www.ibge.gov.br/estatisticas/sociais/saude/9662-censo-demografico-2010.html?=&t=resultados (accessed on 20 June 2020).
- de Lavor, A. ARCA: Amazônia Sem Respirar: Falta de Oxigênio Causa Mortes e Revela Colapso Em Manaus. Available online: https://www.arca.fiocruz.br/handle/icict/46768 (accessed on 12 June 2022).
- Andrade Filho, V.S.; Artaxo, P.; Hancor, S.; Carmo, C.N.; Cirino, G. Aerossóis de Queimadas e Doenças Respiratórias Em Crianças, Manaus, Brasil. Rev. Saúde Pública 2013, 2, 1–14. [Google Scholar] [CrossRef] [PubMed]
- Leirião, L.F.L.; Debone, D.; Miraglia, S.G.E.K. Does Air Pollution Explain COVID-19 Fatality and Mortality Rates? A Multi-City Study in São Paulo State, Brazil. Environ. Monit. Assess. 2022, 194, 275. [Google Scholar] [CrossRef] [PubMed]
- Siciliano, B.; Dantas, G.; da Silva, C.M.; Arbilla, G. Increased Ozone Levels during the COVID-19 Lockdown: Analysis for the City of Rio de Janeiro, Brazil. Sci. Total Environ. 2020, 737, 139765. [Google Scholar] [CrossRef] [PubMed]
- Dantas, G.; Siciliano, B.; França, B.B.; da Silva, C.M.; Arbilla, G. The Impact of COVID-19 Partial Lockdown on the Air Quality of the City of Rio de Janeiro, Brazil. Sci. Total Environ. 2020, 729, 139085. [Google Scholar] [CrossRef] [PubMed]
- Felin, B. Veja Onde é Feito o Monitoramento Da Qualidade Do Ar No Brasil|WRI Brasil. Available online: https://wribrasil.org.br/pt/blog/2019/06/veja-onde-e-feito-o-monitoramento-da-qualidade-do-ar-no-brasil (accessed on 12 June 2022).
- Sant’Anna, A.; Alencar, A.; Pinheiro, B.; Araújo, C.; Vormittag, E.; Wicher, H.; Borges, K.; Faria, M.; Andrade, M.D.E.F.; Porto, P.; et al. O Estado Da Qualidade Do Ar No Brasil. Wri Bras. 2020, 4, 1–32. [Google Scholar]
- Inness, A.; Ades, M.; Agustí-Panareda, A.; Barr, J.; Benedictow, A.; Blechschmidt, A.M.; Jose Dominguez, J.; Engelen, R.; Eskes, H.; Flemming, J.; et al. The CAMS Reanalysis of Atmospheric Composition. Atmos. Chem. Phys. 2019, 19, 3515–3556. [Google Scholar] [CrossRef]
Disclaimer/Publisher’s Note: The statements, opinions and data contained in all publications are solely those of the individual author(s) and contributor(s) and not of MDPI and/or the editor(s). MDPI and/or the editor(s) disclaim responsibility for any injury to people or property resulting from any ideas, methods, instructions or products referred to in the content. |
© 2022 by the authors. Licensee MDPI, Basel, Switzerland. This article is an open access article distributed under the terms and conditions of the Creative Commons Attribution (CC BY) license (https://creativecommons.org/licenses/by/4.0/).