Abstract
Forest fires arise from anthropogenic load and lightning activity. The formation of a thunderstorm front is due to the influence of a number of factors, including the emission of aerosol particles from forest fires. The purpose of this study is mathematical modeling of heat and mass transfer in vegetation firebrand carried out from a forest fire front, taking into account the formation of soot particles to predict forest fire danger from thunderstorm activity. Research objectives: (1) development of a deterministic mathematical model of heat and mass transfer in a pyrolyzed firebrand of vegetation, taking into account soot formation; (2) development of a probabilistic criterion for assessing forest fire danger from thunderstorms, taking into account aerosol emissions; (3) scenario modeling of heat and mass transfer and the formation of a thunderstorm front; (4) and the formulation of conclusions and proposals for the practical application of the developed deterministic–probabilistic approach to the prediction of forest fires from thunderstorms, taking into account aerosol emissions. The novelty of this study lies in the development of a new model of heat and mass transfer in a pyrolyzed vegetation firebrand and a new probabilistic criterion for forest fire danger due to thunderstorm activity, taking into account aerosol emission. The distributions of temperature and volume fractions of phases in a firebrand are obtained for various scenarios. Scenarios of surface fires, crown forest fires, and a fire storm are considered for typical types of coniferous vegetation. Cubic firebrands are considered in the approximation of a two-dimensional mathematical model. To describe the heat and mass transfer in the firebrand structure, a differential heat conduction equation is used with the corresponding initial and boundary conditions, taking into account the kinetic scheme of pyrolysis and soot formation. Variants of using the developed mathematical model and probabilistic criterion in the practice of protecting forests from fires are proposed. Key findings: (1) linear deterministic–probabilistic mathematical model to assess forest fire occurrence probability taking into account aerosol emission and lightning activity; (2) results of mathematical modeling of heat and mass transfer in firebrand taking into account soot formation; (3) and results of scenario modeling of forest fire occurrence probability for different conditions of lightning activity and aerosol emission.
1. Introduction
In recent decades, many studies of thunderstorm activity have been carried out, practically, over all territories of the Earth [1,2,3,4,5,6,7,8,9]. Considering thunderstorm activity on a global scale, this phenomenon can be associated with two complex processes: the thermodynamics of a thunderstorm front and the presence of particulate matter, which is associated with the presence of aerosol [10,11,12,13,14,15,16,17,18].
It is known that aerosol affects the processes of thunderstorm activity in different ways. On the one hand, in the presence of aerosol, the atmospheric layer is heated and the Earth’s surface cools as a result of the absorption and scattering of solar radiation [19,20,21]. On the other hand, aerosol can activate condensation nuclei in clouds, which leads to the containment of precipitation and an increase in the duration of cloud cover and the appearance of thunderstorms [22,23,24,25,26]. It should also be noted that the aerosol can activate the nuclei of the formation of ice particles, which also affects the processes of thunderstorm activity [27,28]. Moreover, the processes of thunderstorm activity are affected by the size of the aerosol, its type, and chemical composition [29]. For example, it has been shown that an increase in the concentration of black carbon leads to an increase in heavy precipitation [30,31]. Studies by other authors have also confirmed the influence of aerosol properties on thunderstorm phenomena [32,33,34,35,36].
Aerosol can be released as a result of natural and human activities [37]. There are various approaches to assessing the concentration and effect of aerosol in the atmosphere, for example, the Absorbing Aerosol Index [38], and the vertical aerosol profile [39]. At the beginning of the century, studies were carried out using data from the lightning direction finding network National Lightning Detection Network (NLDN), which showed an anomalous increase in thunderstorm activity with an increase in the concentration of natural aerosol [40]. As a result of thunderstorm activity, forest fires occur [41,42,43,44,45,46,47,48,49,50].
On the other hand, as a result of pyrolysis and combustion of forest fuels, soot particles of black carbon are formed, which enter the atmospheric layer during forest fires [51,52]. Black carbon can be formed during pyrolysis and combustion of forest fuels in the forest fire front [53,54] and during pyrolysis and afterburning of firebrands and particles carried out from the forest fire front [55,56,57,58]. Numerical study of soot formation processes is important in the context of the occurrence of forest fires from thunderstorms and the development of methods for predicting forest fire danger [59,60,61,62,63,64,65].
It should be noted that there are two approaches to predicting the occurrence of forest fires. Firstly, one direction is work on the creation of methods for assessing the risks of forest fires [66], and the second direction is associated with the development of methods for predicting and assessing forest fire danger [67]. Many researchers erroneously position their developments as results in the field of risk analysis of forest fire danger. According to the mathematical theory of risk analysis, danger is the probability of a forest fire, and the risk of a forest fire is the product of the probability of a forest fire and the potential damage from a forest fire. Therefore, it is relevant to develop methods for predicting forest fire danger based on a rigorous theory of risk analysis.
The aim of the work is to develop a deterministic–probabilistic method for predicting forest fires from thunderstorms, taking into account the effect of aerosol emission on the formation of a thunderstorm front.
The rest of the article is organized as follows. Section 2: Materials and Methods; Section 3: Results and Discussion; and Section 4: Conclusion. The current published results on the topic taken under consideration and the aim of the research is described in the Introduction section. The mathematical method and the data processing procedure are described in the Materials and Methods section. The key findings are described in the Results and Discussion section, accompanied by some considerations and discussions. A summary of the research and further developments are described in the Conclusion section.
2. Materials and Methods
The territory of the republic is 92.6 thousand square kilometers. The Republic of Altai [68] is located in the very center of Asia at the junction of the Siberian taiga, the Kazakh steppes, and the semi-deserts of Mongolia. It is a mountainous country with an extremely picturesque landscape. The territory of the republic consists of 11 municipalities, uniting 92 rural administrations, which include 245 settlements, the only city of Gorno-Altaisk is the capital of the Altai Republic. The distance from Gorno-Altaisk to Moscow is 3641 km; from Gorno-Altaisk to Barnaul, 250 km; and from Gorno-Altaisk to the nearest railway station (Biysk), 100 km. The territory of the republic is 92,902 sq. km., which is 0.55 of the territory of the Russian Federation, of which: agricultural lands make up 19%, forests 47%, water spaces 0.9%, and other lands 33.1%. The territory of the Republic stretches for more than 350 km from north to south and 400 km from east to west, from a low mountain zone to a high mountain zone, which causes a significant difference in the natural and economic complex of 10 regions of the republic.
The Republic of Altai is located in the center of the Eurasian continent, has an external border with China, Mongolia, Kazakhstan, and an internal border with the constituent entities of the Russian Federation, the republics of Tuva and Khakassia, the Altai Territory, and the Kemerovo Region.
The climate is temperate continental, with relatively short hot summers (June–August) and long (November–March) cold winters. Climate-forming factors are: continental arctic air freely reaching the interior throughout the year, warm and humid western air masses coming from the Atlantic Ocean, warm southwestern and southern winds and local cyclones and foehn-like air currents formed by the relief of a mountainous country. As a rule, the determining factor in the formation of weather conditions is the movement of western air masses.
A significant influence on the climate of the Altai Mountains has a relief that forms a vertical climatic zonality, a low-mountain climate zone (up to 500–600 m), a mid-mountain climate zone (from 500 to 1500 m and more), a high-mountain climate zone (over 2000–2500 m).
The relief of the republic is characterized by high ridges, separated by narrow and deep river valleys, and rare wide intermountain basins. The highest mountain, Belukha, which has an elevation of 4506 m, is the highest point in Siberia.
Communications: Automobile transport is the leading transport in the republic. The length of highways is more than 3.2 thousand km, of which 541 km is the main highway, the federal highway Novosibirsk–Biysk–Tashanta (Chuysky tract).
Demography: the population of the Altai Republic as of 1 January 2019 was 218,866 people.
The capital is the city of Gorno-Altaysk, the only city of the republic, located in its northwestern part. Territory: 91 sq. km. The city of Gorno-Altaisk as a settlement of Ulala was founded in 1830, it received the status of a city in 1928. The distance from Gorno-Altaisk to Moscow is 3641 km, and to the nearest railway station in Biysk is 100 km. The population of the city as of 1 January 2019 was 63,845 people.
Such unique natural sites as Lake Teletskoye, Mount Belukha, Altai, and Katunsky reserves are included in the UNESCO World Heritage List by the decision of UNESCO.
The algorithm for calculating the probability of a forest fire from a thunderstorm is shown in Figure 1. At the first stage, the input data necessary for the operation of the computational procedure implemented in a high-level programming language are read and initialized in accordance with the algorithm. Then the calculation process goes through several successive stages. Three blocks can be distinguished. The first block is responsible for calculating the temperature field in a firebrand. Since the system of equations being solved corresponds to a two-dimensional setting, the locally one-dimensional method for solving two-dimensional equations of mathematical physics is used [69,70]. The finite difference method was used to solve one-dimensional equations [71]. To solve difference analogs of partial differential equations of parabolic type, the marching method is used [72]. In each block, the calculation is carried out in an identical way. In the forward pass, the running coefficients are initialized, and in the backward pass, the temperature is calculated at the next time layer. The second block allows you to calculate the volume fractions of phases, including dry organic matter and soot particles. For this, the numerical implementation of the kinetic schemes of pyrolysis and soot formation is used. To solve systems of ordinary differential equations, the finite-difference method is also used, taking into account the method of simple iteration to resolve nonlinearity in the right-hand sides of differential equations [73].
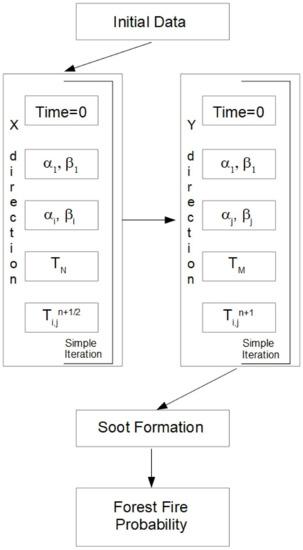
Figure 1.
Scheme of the algorithm for calculating the probability of a forest fire.
The next block allows you to calculate the probability of a forest fire from lightning activity, taking into account soot particles. The probabilistic characteristic of the occurrence of a forest fire from a thunderstorm front, which in turn arises from various factors, one of which is an aerosol particle, namely soot, is considered.
This deterministic–probabilistic mathematical model partially uses synthetic input data. Industrial operation requires additional development. The method for calculating the probability of a forest fire from a thunderstorm, taking into account aerosol emissions, can be schematically presented according to the diagram in Figure 2.
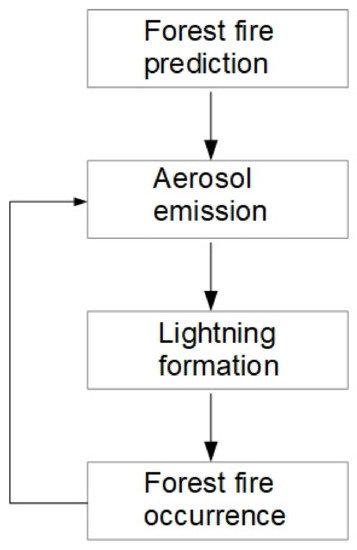
Figure 2.
Scheme with feedback.
Basically, it is a feedback system. However, a linear circuit is currently implemented according to Figure 3.
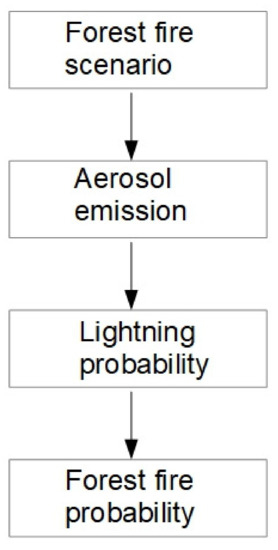
Figure 3.
Linear system.
Basically, it is a linear model. It should be explained why it is currently impossible to organize calculations with feedback. In this deterministic–probabilistic technique, the probability of the formation of a thunderstorm front is estimated, and not the modeling of physicochemical and electrical processes. In the future, a deterministic mathematical model of aerosol transport and the formation of a thunderstorm front should be developed. However, these are tasks for a separate study, which requires field observations and experiments.
The mathematical formulation of the probabilistic model is written as the product of two dependent events [74]:
where
P(FF) is the probability of a forest fire;
P(L) is the probability of occurrence of a thunderstorm front;
P(FF|L) is the conditional probability of a forest fire from thunderstorms, taken according to statistical data according to the formula [73]:
where NFF is the number of forest fires caused by thunderstorms, and NTF is the total number of forest fires.
The probability of the formation of a thunderstorm front from various factors can be calculated using the formula [74]:
where Pi is the factor of formation of a thunderstorm front. In particular, we single out an aerosol particle as a factor: P1 is a probability to achieve critical concentration of aerosol particles; P2 is a probability of unstable atmosphere stratification; P3 is the probability to reach the critical temperature of the lower air layers; P4 is the probability to achieve critical moisture concentration in the surface layer; P5 is the probability to achieve critical moisture concentration at a height of 10 km; and P6 is the probability to achieve critical intensity of vertical mass transfer.
where φ2 is the volume fraction of soot (should be varied in scenarios), and φ2cr is the critical value of the volume fraction of soot (φ2cr is taken equal to 0.03).
The numerical implementation of the problem was carried out on the basis of the following mathematical model. System of basic assumptions:
- The firebrands are modeled by a square solution area with dimensions of 0.1 m to 0.01 m;
- It is assumed that the material of the firebrand is modeled in the concept of a continuum mechanics;
- It is assumed that there is no moisture in the firebrand material;
- The convective heat exchange of a firebrand with the environment occurs in accordance with the statement about the same temperature of a forest fire in the area where the firebrand is located;
- It is believed that the thermophysical characteristics of a firebrand and air do not depend on temperature;
- The transport of a firebrand in a forest fire plume and its possible collisions with other firebrands are not considered;
- The pyrolysis of dry organic matter is taken into account based on the kinetic scheme proposed in [75];
- Pyrolysis of dry organic matter is considered as a one-stage process;
- The temperature distribution is described by a non-stationary nonlinear heat equation;
- Soot formation is taken into account according to the kinetic scheme proposed in [76];
- The volume fraction of soot particles is proportional to the volume fraction of dry organic matter decomposed during pyrolysis with dispersion coefficient αs.
The following types of forest fires are considered [77]:
Surface fire: α = 80 W/(m2·K), T0 = 900 K;
Crown fire: α = 150 W/(m2·K), T0 = 1000 K;
Firestorm: α = 200 W/(m2·K), T0 = 1200 K.
Thermophysical properties of pine [78]:
ρ = 520 kg/m3, λ = 0.15 W/(m·K), c = 2300 J/(kg·K).
Thermophysical properties of spruce [78]:
ρ = 450 kg/m3, λ = 0.11 W/(m·K), c = 2200 J/(kg·K).
Thermophysical properties of birch [78]:
ρ = 630 kg/m3, λ = 0.15 W/(m·K), c = 2400 J/(kg·K).
The average air temperature in the Siberian and Altai regions was used as the ambient temperature [79]:
Spring (April): Te = 275 K;
Summer (July): Te = 293 K;
Autumn (September): Te = 283 K.
Mathematical formulation of the problem for the two-dimensional heat equation with boundary conditions of the 3rd kind and taking into account pyrolysis and soot formation.
The mathematical formulation of the problem looks like:
The initial and boundary conditions are written as follows:
Kinetic equations and initial conditions:
where α is the heat transfer coefficient; c is the heat capacity; E is the activation energy for the pyrolysis process; φ1 is the volume fraction of dry organic matter; φ2 is the volume fraction of soot particles; φ3 is the volume fraction of the gas phase; k is the pre-exponential factor for the pyrolysis process; λ is thermal conductivity; qp is the thermal effect of the pyrolysis process; R is the universal gas constant; ρ is the density; t is time; Tff is the temperature at the flame front; T is the temperature; x, y are spatial coordinates; and subscript s is soot.
3. Results and Discussion
Table 1 shows the main scenarios for mathematical modeling of heat and mass transfer in a firebrand, taking into account soot formation. The main types of forest fires are considered: surface fires of low and high intensity, crown forest fire, and fire storm. The choice of typical tree species is due to their wide distribution on the territory of the Siberian and Altai regions in particular, and on the territory of the Russian Federation as a whole [80]. Each type of forest fire corresponds to a certain temperature in the forest fire front and the heat transfer coefficient, which characterizes the speed of the forest fire front [81]. The dispersion coefficient was chosen in accordance with the previously published work [53], taking into account the results of [76].

Table 1.
Main scenario on heat transfer modeling of firebrand with soot formation.
The sizes of firebrands varied in the range from 10 cm to 1 cm in cross section. This corresponds to the real size range of firebrands formed during the combustion of wood [82,83,84]. Scenario calculations were carried out for all types of forest fires, including low and high intensity surface fires, crown forest fire, and firestorm. This section presents typical results from a low-intensity surface fire.
Scenario A: low-intensity surface fire, spring season, different types of forest fuels, and transverse firebrand size 1–10 cm.
Figure 4 shows the temperature distributions in the firebrand with different sizes at time points of 10 s.
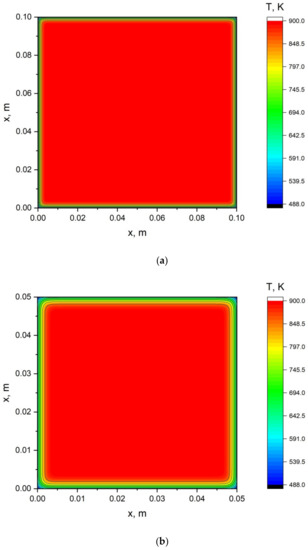
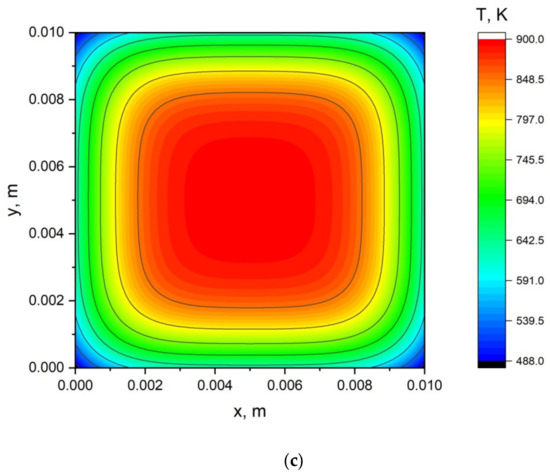
Figure 4.
Temperature distribution in the firebrand at the moment of time 10 s: (a) transverse dimension 10 cm; (b) transverse dimension 5 cm; (c) transverse dimension 1 cm.
Figure 5 shows the temperature dependences at different points of the firebrand on the time of flight in the air for firebrands 1–10 cm in size.
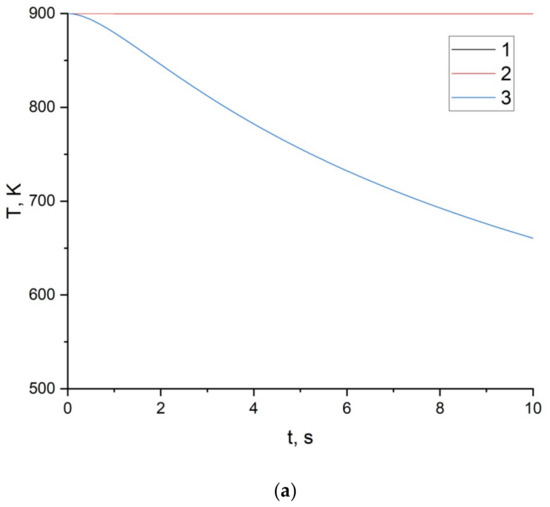
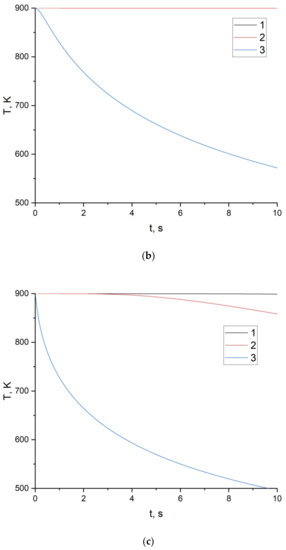
Figure 5.
Dependence of temperature on time at different points of the firebrand for different firebrand sizes: (a) transverse dimension 10 cm; (b) transverse dimension 5 cm; (c) transverse dimension 1 cm; curves 1: in the center of the firebrand; 2: first quarter; 3: on the border of the firebrand.
Figure 6 shows the dependences of the volume fractions of phases on time for a firebrand with a transverse dimension of 10 cm.
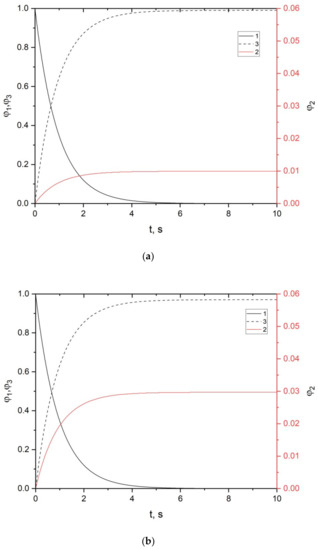
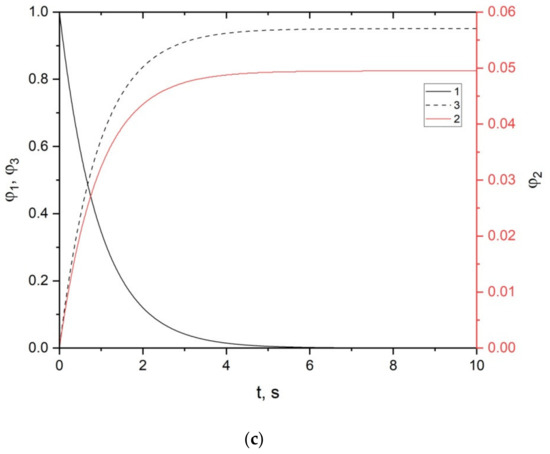
Figure 6.
Dependences of volume fractions of phases on time for firebrand with a transverse dimension of 10 cm: 1: dry organic matter; 2: soot particles; 3: gas mixture; (a) dispersion coefficient 0.01; (b) dispersion coefficient 0.03; (c) dispersion coefficient 0.05.
Figure 7 shows the dependences of the volume fractions of phases on time for a firebrand with a transverse dimension of 1 cm.
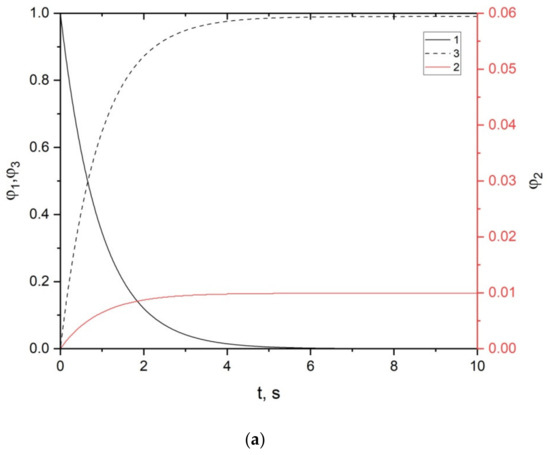
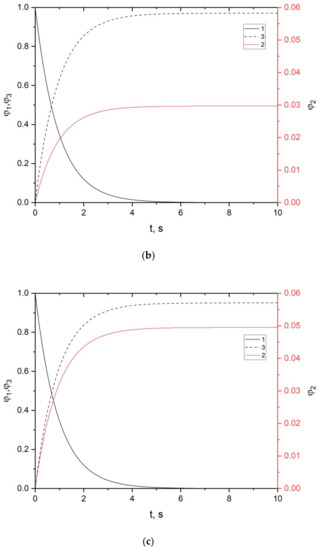
Figure 7.
Dependences of volume fractions of phases on time for firebrand with a transverse dimension of 1 cm: 1: dry organic matter; 2: soot particles; 3: gas mixture; (a) dispersion coefficient 0.01; (b) dispersion coefficient 0.03; (c) dispersion coefficient 0.05.
At the moment, the simulation of heat and mass transfer in a single heated pyrolyzable firebrand of wood has been carried out in the work. The mathematical model takes into account only the initial temperature of the firebrand taken out of the forest fire front and the air temperature in the surface layer of the atmosphere immediately near and above the forest fire front. At the moment, the temperatures of various atmospheric layers are not considered in the work. Moreover, this is not necessary since the dry organic matter of the firebrand thermally decomposes almost completely within a few seconds. A heated firebrand can simply not be carried to a higher atmospheric layer. In the case of a massive firebrand of a sufficiently large size, it can, on the contrary, move quickly enough to the surface of the Earth under the action of gravity. The formation of soot particles, which are the centers of formation of aerosol particles, also occurs within a few seconds. It would be expedient to consider the temperatures of different atmospheric layers in mathematical modeling of aerosol transport in the atmosphere. However, at the moment, this is not modeled in the work. This is worth performing in future research. Data for ambient air temperature, borrowed from the climate reference book [79], were used. It is clear that this is not enough new data, but at present this is enough to demonstrate the operation of a mathematical model. Specifically, for the scenario modeling in this work, we used data from the Gorno-Altaisk meteorological station. So far, modeling of the spatial dynamics of aerosol propagation is out of the question in this work, since this is the subject of a separate study. Therefore, at the moment the spatial resolution of meteorological data does not matter. However, looking ahead, we can suggest using the forecast fields of meteorological parameters generated using a non-hydrostatic mathematical model of weather forecasting [85]. This mathematical model is currently used by Roshydromet of the Russian Federation to obtain short-term and medium-term weather forecasts. Thus, there are all technical possibilities to conduct such studies in the future.
Consider the following scenarios:
A: All factors are fixed, the volume fraction of soot varies. The dependence of the probability of occurrence of a thunderstorm front on the types of fire is analyzed. However, we consider mainly the spring period of fire activity, then the probability of the critical temperature of the lower layers of air is lower than the others.
B: there is a specific type of fire (for example, a firestorm), the number of factors for the formation of a thunderstorm front varies.
Scenario A is characterized by the following parameters:
As the values of the soot volume fraction, their values were taken from the previous study for the maximum value of the soot volume fraction field:
For surface forest fire φ2 = 0.035;
For crown forest fire φ2 = 0.031;
For firestorm φ2= 0.017.
The conditional probability of forest fires from thunderstorms (Table 2) were taken for different types of fire on the basis that in wooded and forest-meadow areas, crown fire most often occurs from thunderstorms, and least often, a fire storm. The spring season is also taken into account:

Table 2.
Probability of a forest fire from thunderstorm activity, taking into account the influence of soot particles on the formation of a thunderstorm front in the spring for scenario A.
Surface forest fire P(FF|L) = 0.2;
Crown forest fire P(FF|L) = 0.4;
Firestorm P(FF|L) = 0.15.
Scenario B is characterized by the following parameters:
Option 1 factors for the formation of a thunderstorm front are insignificant:
Option 2 most likely unstable stratification of the atmosphere:
Option 3 is the most likely first two factors:
Option 4 is the most likely first three factors:
Option 5 All factors are half probable:
Table 3 presents the results of a numerical calculation of the probability of a forest fire from thunderstorm activity, taking into account the influence of soot particles on the formation of a thunderstorm front in the spring for scenario B.

Table 3.
Probability of a forest fire from thunderstorm activity, taking into account the influence of soot particles on the formation of a thunderstorm front in the spring for scenario B.
In addition to scenario modeling, the results of a comparative analysis of forest fire probability estimates for a semi-synthetic set of initial data can be presented. It is proposed to conduct a comparative analysis with two other methods for predicting forest fire danger. The first technique is the Nesterov criterion [86], which is the official state standard for predicting forest fire danger in the territory of the Russian Federation [64]. The second technique is a deterministic–probabilistic model for predicting forest fires from thunderstorms for mountainous areas, such as Gorny Altai in the Russian Federation [61]. Previously, scenario modeling was carried out for the territory of the Republic of Buryatia and the Republic of Altai. Comparative data on the probability of a forest fire is presented in Table 4.

Table 4.
Comparative analysis of various methods for predicting the probability of a forest fire from a thunderstorm.
An analysis of the results shows that only accounting for aerosol provides differentiated results in assessing the probability of a forest fire. The Nesterov criterion does not take into account thunderstorm activity at all.
An analysis of the results presented in Figure 4 shows that the cooling of smaller firebrands is noticeably faster than that of larger ones. However, the central part of the firebrand remains heated to the initial temperature for several tens of seconds. Only small firebrands of the order of 1 cm can be found to cool the near-surface layers to temperatures of 650–700 K. However, both these temperatures and the heat reserve of the firebrand is sufficient so that, under certain conditions, the sedimentation of such a firebrand on the ground layer of forest fuels leads to its ignition [55,87,88].
In addition, numerical simulations were performed for high intensity surface fire, crown fire, and firestorm scenarios. A comparative analysis of the results shows that the lowest cooling rates are characteristic of firebrands emitted from the front of a low-intensity surface forest fire. This is explained by the lowest rate of their transport by a plume from a forest fire in the air [89,90]. The maximum cooling rates are characteristic of firebrands emitted during the occurrence of a fire storm, since in this case the rate of removal of heated firebrands is the maximum. According to [80], the speed of firebrand transport affects the heat transfer coefficient and intensifies the convective heat exchange of a heated firebrand with an air flow.
According to Figure 5, the central part of the heated firebrand retains its original temperature during the entire simulation period (10 s). Only at the border is there a noticeable cooling. On the one hand, in a certain range of transport times for such firebrands, they retain a fire hazard. On the other hand, thermal decomposition and destruction of the backbone of the firebrand, dry organic matter, occurs in the surface layers. As a result, the near-surface layer is destroyed, especially upon physical contact with the surface of the ground forest fuel. In turn, this leads to the possibility of contact of the more heated central part of the firebrand with the forest fuels and, as a result, to its ignition.
Figure 6 shows the dependences of the volume fractions of phases on time for the center of the firebrand. These data can be used to judge pyrolysis and soot formation in the particle as a whole, since the central part retains the initial maximum temperature for a long time. An analysis of the results presented in Figure 4 shows that the dispersion coefficient has the maximum effect on the value of the volume fraction of soot particles. For a firebrand with a transverse dimension of 10 cm, soot formation proceeds intensively during the first two seconds of firebrand transport in air. Moreover, dry organic matter decomposes almost completely under the influence of elevated temperature over a period of 4 s.
Similar results for firebrands with a transverse dimension of 1 cm are shown in Figure 7. A comparative analysis shows that the smaller the firebrand, the more intense and faster the formation of soot particles. In fact, the more relatively small firebrands emitted by the forest fire front, the more soot particles are formed during the transport of firebrands in the air.
The second block of results is devoted to scenario modeling of the formation of a thunderstorm front and the subsequent occurrence of a forest fire from a cloud-to-ground lightning discharge. A fairly simple probabilistic mathematical model is presented. It should be noted that mathematical modeling of atmospheric circulation [85,91] and electrification of soot particles [92] is beyond the scope of this study. Nevertheless, future work can and should be devoted to the study of these issues with the help of deterministic mathematical modeling.
To assess the accuracy of mathematical modeling, first of all, it should be noted that the finite difference method used in this work makes it possible to calculate the temperature in the firebrand and the volume fractions of dry organic matter and soot particles with an approximation order of O(h), which means the accuracy of finding the indicated physical parameters is on the level of the order of the step of the difference grid in space. This is a fairly high, even excessive, accuracy in determining the temperature field and volume fractions in firebrands, taking into account their subsequent use in the probabilistic criterion. In addition, the results of mathematical modeling of heat and mass transfer in an element of forest combustible material (birch leaf) under the influence of a forest fire front were previously published [53]. Comparative analysis shows that there is a qualitative agreement between the obtained results. This fact also allows us to state that the mathematical model of the formation of soot particles proposed in this work is adequate to the physics of the process. As for the probabilistic criterion, it is currently impossible to quantitatively verify the proposed mathematical model. First, we need data on the emission of soot particles for a given region. Moreover, it is desirable to have data from lidar sounding of the atmosphere. Secondly, a mathematical model of the formation of a thunderstorm front is needed based on a system of differential equations with appropriate initial and boundary conditions. The development of such a model is the subject of a separate study. It should be noted that the Institute of Atmospheric Optics of the Siberian Branch of the Russian Academy of Sciences (Tomsk, Russian Federation) has developments for atmospheric sounding using lidar technologies, and in the future it is possible to collaborate with colleagues from this institute to carry out work on validating the probabilistic criterion for assessing the formation of a thunderstorm front and the probability occurrence of a forest fire. However, once again it should be emphasized that this requires separate experiments and field observations.
Similar to any development, the proposed mathematical model has certain limitations. First, in the present paper we consider only firebrands with cubic geometry in the approximation of a two-dimensional formulation. In reality, there is a significant proportion of firebrands with spherical and cylindrical geometries. At the moment, such a geometry of firebrands is not considered. For example, small pinecones can be geometrically described using a ball in zero approximation. Branch fragments have a cylindrical geometry. However, in the future it will not be difficult to take into account these options for the geometry of firebrands. To do this, it is only necessary to develop two additional software modules in which the heat equations are solved using spherical and cylindrical coordinates. The equations for describing the kinetics of changes in the volume fractions of dry organic matter and soot particles remain in the same form, since they are solved at each point of the firebrand. It should also be noted that a small proportion of firebrands has an arbitrary geometry. On the one hand, firebrands with such a geometry can be ignored. On the other hand, in the mathematical modeling of objects with complex geometry, approximate geometric modeling (Bakhvalov) is often used, when the original object is replaced by a figure that describes this object along its outer boundaries. That is, the original object is geometrically inscribed in this figure, which serves as a new solution area. As a result, all objects are reduced to the geometry of a cube, sphere, or cylinder. Secondly, this paper does not consider the issues of aerosol propagation in time and space. It is believed that all the formed soot particles instantly enter the atmosphere. This assumption is used by analogy with heat and mass transfer processes in thermal protection problems. In such problems, it is considered that the resulting pyrolysis products of the protective coating instantly appear in the near-surface layer above the thermal protection element. For this reason, at the moment it is not possible to build maps showing the spatial distribution of the probabilities of the formation of a thunderstorm front and the occurrence of a forest fire. Thirdly, it is not possible to take into account the temperature of various atmospheric layers and consider the spatial processes that occur during the formation of a thunderstorm front. In fact, at the moment, the probabilistic criterion works for the most part as a black box simulation model. In future studies, will also be necessary to build a deterministic mathematical model of spatio-temporal physical processes occurring during the formation of a thunderstorm front, and not only to estimate the probability of its formation using a black box simulation model. Moreover, the last limitation is related to the impossibility to represent the change in the probability of the formation of a thunderstorm front in time. This limitation is a consequence of the previous limitation.
4. Conclusions
As part of the research, a scenario numerical simulation of heat and mass transfer processes in a single firebrand was carried out, taking into account the formation of soot particles.
As a result, the following tasks were solved:
- (1)
- A mathematical model of heat and mass transfer in firebrand was developed within the framework of a two-dimensional formulation, taking into account pyrolysis and the formation of soot particles;
- (2)
- A probabilistic criterion for forest fire danger was developed, taking into account the formation of a thunderstorm front during aerosol emission;
- (3)
- Scenario numerical simulation was carried out and the obtained results were analyzed;
- (4)
- Within current research, next probabilities of forest fire occurrence were obtained: 0.2 for surface forest fire, 0.4 for crown forest fire, and 0.148 for fire storm.
The proposed mathematical model makes it possible to develop new or upgrade existing systems for predicting forest fire danger [62,63,64,93] using a deterministic–probabilistic approach. The experience of operating the Canadian Forest Fire Danger Rating System, presented in a number of publications, shows that the use of predicting systems leads to a reduction in both environmental and socio-economic damage [94]. Forest fire risk prediction is the first and most important step in the fight against forest fires [95].
The developed model is implemented in the high-level programming language Delphi. The RAD Studio program [96] was used for calculations. The developed console application can be used with GIS systems [97,98] to visualize predictive information, taking into account spatial localization [99].
Author Contributions
Conceptualization, N.V.B.; methodology, N.V.B.; software, N.V.B., V.A.V. and A.M.C.; validation, V.A.V. and A.M.C.; formal analysis, N.V.B..; investigation, N.V.B. and A.M.C.; resources, V.A.V. and A.M.C.; data curation, N.V.B., V.A.V. and A.M.C.; writing—original draft preparation, N.V.B., V.A.V. and A.M.C.; writing—review and editing, N.V.B.; visualization, N.V.B. and A.M.C.; supervision, N.V.B.; project administration, N.V.B.; funding acquisition, N.V.B. All authors have read and agreed to the published version of the manuscript.
Funding
This research was funded by Russian Foundation for Basic Research. Grant number 20-45-040012.
Institutional Review Board Statement
Not applicable.
Informed Consent Statement
Not applicable.
Data Availability Statement
Not applicable.
Conflicts of Interest
The authors declare no conflict of interest.
References
- Dayeh, M.A.; Farahat, A.; Ismail-Aldayeh, H.; Abuelgasim, A. Effects of aerosols on lightning activity over the Arabian Peninsula. Atmos. Res. 2021, 261, 105723. [Google Scholar] [CrossRef]
- Orville, R.E.; Henderson, R. Global distribution of midnight lightning: September 1977 to August 1978. Mon. Weather. Rev. 1986, 114, 2640–2653. [Google Scholar] [CrossRef]
- Goodman, S.J.; Christian, H.J., Jr. Global observations of lightning. In Atlas of Satellite Observations Related to Global Change; Gurney, R.J., Foster, J.L., Parkinson, C.L., Eds.; Cambridge University Press: Cambridge, UK, 1993; pp. 191–219. [Google Scholar]
- Heckman, S.J.; Williams, E.; Boldi, B. Total global lighting inferred from Schumann resonance measurement. J. Geophys. Res. 1998, 103, 31775–31779. [Google Scholar] [CrossRef]
- Williams, E.; Rothkin, K.; Stevenson, D.; Boccippio, D. Global lightning variations caused by changes in thunderstorm flash rate and by changes in the number of thunderstorms. J. Appl. Meteorol. 2000, 39, 2223–2230. [Google Scholar] [CrossRef]
- Said, R.K.; Inan, U.S.; Cummins, K.L. Long-range lightning geolocation using a VLF radio atmospheric waveform bank. J. Geophys. Res. 2010, 115, D23108. [Google Scholar] [CrossRef]
- Nag, A.; Murphy, M.J.; Cummins, K.L.; Pifer, A.E.; Cramer, J.A. Recent evolution of the U.S. National Lightning Detection Network. In Proceedings of the 23rd International Lightning Detection Conference (ILDC), Tucson, AZ, USA, 18–21 March 2014. [Google Scholar]
- Albrecht, R.I.; Goodman, S.J.; Buechler, D.E.; Blakeslee, R.J.; Christian, H.J. Where are the lightning hotspots on Earth. Bull. Am. Meteorol. Soc. 2016, 97, 2051–2068. [Google Scholar] [CrossRef]
- Wang, Q.; Li, Z.; Guo, J.; Zhao, C.; Cribb, M. The climate impact of aerosols on the lightning flash rate: Is it detectable from long-term measurements. Atmos. Chem. Phys. 2018, 18, 12797–12816. [Google Scholar] [CrossRef]
- Bell, T.L.; Rosenfeld, D.; Kim, K.-M. Weekly cycle of lightning: Evidence of storm invigoration by pollution. Geophys. Res. Lett. 2009, 36, L23805. [Google Scholar] [CrossRef]
- Christian, H.J.; Blakeslee, R.J.; Boccippio, D.J.; Boeck, W.L.; Buechler, D.E.; Driscoll, K.T.; Goodman, S.J.; Hall, J.M.; Koshak, W.J.; Mach, D.M. Global frequency and distribution of lightning as observed from space by the Optical Transient Detector. J. Geophys. Res. 2003, 108, 4005. [Google Scholar] [CrossRef]
- Farias, W.R.G.; Pinto, O., Jr.; Pinto, I.R.C.A.; Naccarato, K. The influence of urban effect on lightning activity: Evidence of weekly cycle. Atmos. Res. 2014, 135–136, 370–373. [Google Scholar] [CrossRef]
- Guo, J.; Deng, M.; Lee, S.S.; Wang, F.; Li, Z.; Zhai, P.; Liu, H.; Lv, W.; Yao, W.; Li, X. Delaying precipitation and lightning by air pollution over the Pearl River Delta. Part I: Observational analyses. J. Geophys. Res. Atmosphere 2016, 121, 6472–6488. [Google Scholar] [CrossRef]
- Lucas, C.; Zipser, E.J.; Lemone, M.A. Convective available potential energy in the environment of oceanic and continental clouds: Correction and comments. J. Atmos. Sci. 1994, 51, 3829–3830. [Google Scholar] [CrossRef]
- Orville, R.E.; Huffines, G.; Nielsen-Gammon, J.; Zhang, R.; Ely, B.; Steiger, S.; Phillips, S.; Allen, S.; Read, W. Enhancement of Cloud-to-Ground Lightning over Houston, Texas. Geophys. Res. Lett. 2001, 28, 2597–2600. [Google Scholar] [CrossRef]
- Williams, E.; Stanfill, S. The physical origin of the land-ocean contrast in lightning activity. Comptes. Rendus. Phys. 2002, 3, 1277–1292. [Google Scholar] [CrossRef]
- Williams, E.R. Lightning and climate: A review. Atmos. Res. 2005, 76, 272–287. [Google Scholar] [CrossRef]
- Wang, Y.; Wang, M.; Zhang, R.; Ghan, S.J.; Lin, Y.; Hu, J.; Pan, B.; Levy, M.; Jiang, J.H.; Molina, M.J. Assessing the effects of anthropogenic aerosols on Pacific storm track using a multiscale global climate model. Proc. Nat. Acad. Sci. USA 2014, 111, 6894–6899. [Google Scholar] [CrossRef]
- Koren, I.; Kaufman, Y.J.; Rosenfeld, D.; Remer, L.A.; Rudich, Y. Aerosol invigoration and restructuring of Atlantic convective clouds. Geophys. Res. Lett. 2005, 32, L14828. [Google Scholar] [CrossRef]
- Chen, S.; Zhang, R.; Mao, R.; Zhang, Y.; Chen, Y.; Ji, Z.; Gong, Y.; Guan, Y. Sources, characteristics and climate impact of light-absorbing aerosols over the Tibetan Plateau. Earth-Science Reviews. 2022, 232, 104111. [Google Scholar] [CrossRef]
- Proestakis, E.; Kazadzis, S.; Lagouvardos, K.; Kotroni, V.; Kazantzidis, A. Lightning activity and aerosols in the Mediterranean region. Atmos. Res. 2015, 170, 66–75. [Google Scholar] [CrossRef]
- Rosenfeld, D.; Andreae, M.O.; Asmi, A.; Chin, M.; de Leeuw, G.; Donovan, D.P.; Kahn, R.; Kinne, S.; Kivekäs, N.; Kulmala, M.; et al. Global observations of aerosol-cloud-precipitation-climate interactions. Rev. Geophys. 2014, 52, 750–808. [Google Scholar] [CrossRef]
- Yuan, T.; Remer, L.A.; Pickering, K.E.; Yu, H. Observational evidence of aerosol enhancement of lightning activity and convective invigoration. Geophys. Res. Lett. 2011, 38, L04701. [Google Scholar] [CrossRef]
- Thornton, J.A.; Virts, K.S.; Holzworth, R.H.; Mitchell, T. Lightning enhancement over major oceanic shipping lanes. Geophys. Res. Lett. 2017, 44, 9102–9111. [Google Scholar] [CrossRef]
- Varnai, T.; Marshak, A.; Yang, W. Multi-satellite aerosol observations in the vicinity of clouds. Atmos. Chem. Phys. 2013, 13, 3899–3908. [Google Scholar] [CrossRef]
- Fan, J.; Yuan, T.; Comstock, J.M.; Ghan, S.; Khain, A.; Leung, L.R.; Li, Z.; Martins, V.J.; Ovchinnikov, M. Dominant role by vertical wind shear in regulating aerosol effects on deep convective clouds. J. Geophys. Res. 2009, 114, D22206. [Google Scholar] [CrossRef]
- Cziczo, D.J.; Murphy, D.M.; Hudson, P.K.; Thomson, D.S. Single particle measurements of the composition of cirrus ice residue during CRYSTAL-FACE. J. Geophys. Res. 2004, 109, D04201. [Google Scholar]
- van den Heever, S.C.; Carrio, G.; Cotton, W.R.; DeMott, P.J.; Prenni, A.J. Impacts of nucleating aerosol on Florida convection. Part I: Mesoscale simulations. J. Atmos. Sci. 2006, 63, 1752–1775. [Google Scholar] [CrossRef]
- Stolz, D.; Rutledge, S.; Pierce, J.; Heever, S. A global lightning parameterization based on statistical relationships among environmental factors, aerosols, and convective clouds in the TRMM climatology: Lightning Parameterization from TRMM. J. Geophys. Res. Atmos. 2017, 122, 7461–7492. [Google Scholar] [CrossRef]
- Menon, S.; Hansen, J.E.; Nazarenko, L.; Luo, Y. Climate effects of black carbon aerosols in China and India. Science 2002, 297, 2250–2253. [Google Scholar] [CrossRef]
- Rosenfeld, D.; Lahav, R.; Khain, A.P.; Pinsky, M. The role of sea-spray in cleansing air pollution over ocean via cloud processes. Science 2002, 297, 1667–1670. [Google Scholar] [CrossRef]
- Khain, A.P.; BenMoshe, N.; Pokrovsky, A. Factors determining the impact of aerosols on surface precipitation from clouds: An attempt at classification. J. Atmos. Sci. 2008, 65, 1721–1748. [Google Scholar] [CrossRef]
- Khain, A.P.; Leung, L.R.; Lynn, B.; Ghan, S. Effects of aerosols on the dynamics and microphysics of squall lines simulated by spectral bin and bulk parameterization schemes. J. Geophys. Res. 2009, 114, D22203. [Google Scholar] [CrossRef]
- Khain, A.P.; Rosenfeld, D.; Pokrovsky, A. Aerosol impact on the dynamics and microphysics of deep convective clouds. Quart. J. Roy. Meteor. Soc. 2005, 131, 2639–2663. [Google Scholar] [CrossRef]
- Fan, J.; Zhang, R.; Li, G.; Tao, W.-K. Effects of aerosols and relative humidity on cumulus clouds. J. Geophys. Res. 2007, 112, D14204. [Google Scholar] [CrossRef]
- Rosenfeld, D.; Rudich, Y.; Lahav, R. Desert dust suppressing precipitation: A possible desertification feedback loop. Proc. Nat. Acad. Sci. USA 2001, 98, 5975–5980. [Google Scholar] [CrossRef]
- Gautam, S.; Gautam, A.S.; Singh, K.; James, E.J.; Brema, J. Investigations on the relationship among lightning, aerosol concentration, and meteorological parameters with specific reference to the wet and hot humid tropical zone of the southern parts of India. Environ. Technol. Innov. 2021, 22, 101414. [Google Scholar] [CrossRef]
- Mushtaq, F.; Lala, M.G.N.; Anand, A. Spatio-temporal variability of lightning activity over J&K region and its relationship with topography, vegetation cover, and absorbing aerosol index (AAI). J. Atmos. Sol. -Terr. Phys. 2018, 179, 281–292. [Google Scholar]
- Proestakis, E.; Kazadzis, S.; Lagouvardos, K.; Kotroni, V.; Amiridis, V.; Marinou, E.; Price, C.; Kazantzidis, A. Aerosols and lightning activity: The effect of vertical profile and aerosol type. Atmos. Res. 2016, 182, 243–255. [Google Scholar] [CrossRef]
- Murray, N.D.; Orville, R.E.; Huffines, G.R. Effect of pollution from central American fires on cloud-to-ground lightning in May 1998. Geophys. Res. Lett. 2000, 27, 2249–2252. [Google Scholar] [CrossRef]
- Schumacher, V.; Setzer, A.; Saba, M.M.F.; Naccarato, K.P.; Mattos, E.; Justino, F. Characteristics of lightning-caused wildfires in central Brazil in relation to cloud-ground and dry lightning. Agric. For. Meteorol. 2022, 312, 108723. [Google Scholar] [CrossRef]
- Pineda, N.; Montanya, J.; van der Velde, O.A. Characteristics of lightning related to wildfire ignitions in Catalonia. Atmos. Res. 2014, 135–136, 380–387. [Google Scholar] [CrossRef]
- Clarke, H.; Gibson, R.; Cirulis, B.; Bradstock, R.A.; Penman, T.D. Developing and testing models of the drivers of anthropogenic and lightning-caused wildfire ignitions in south-eastern Australia. J. Environ. Manage. 2019, 235, 34–41. [Google Scholar] [CrossRef] [PubMed]
- Nadeem, K.; Taylor, S.W.; Woolford, D.G.; Dean, C.B. Mesoscale spatiotemporal predictive models of daily human- and lightning-caused wildland fire occurrence in British Columbia. Int. J. Wildl. Fire 2019, 29, 11–27. [Google Scholar] [CrossRef]
- Moris, J.V.; Conedera, M.; Nisi, L.; Bernardi, M.; Cesti, G.; Pezzatti, G.B. Lightningcaused fires in the Alps: Identifying the igniting strokes. Agric. For. Meteorol. 2020, 290, 107990. [Google Scholar] [CrossRef]
- Rodríguez-Perez, J.R.; Ordonez, C.; Roca-Pardinas, J.; Vecín-Arias, D.; Dorado, F.C. Evaluating lightning-caused fire occurrence using spatial generalized additive models: A case study in Central Spain. Risk Anal. 2020, 40, 1418–1437. [Google Scholar] [CrossRef] [PubMed]
- Nampak, H.; Love, P.; Fox-Hughes, P.; Watson, C.; Aryal, J.; Harris, R.M.B. Characterizing spatial and temporal variability of lightning activity associated with wildfire over Tasmania. Australia. Fire 2021, 4, 10. [Google Scholar] [CrossRef]
- Balch, J.K.; Bradley, B.A.; Abatzoglou, J.T.; Chelsea Nagy, R.; Fusco, E.J.; Mahood, A.L. Human-started wildfires expand the fire niche across the United States. Proc. Natl. Acad. Sci. USA 2017, 114, 2946–2951. [Google Scholar] [CrossRef]
- Veraverbeke, S.; Rogers, B.M.; Goulden, M.L.; Jandt, R.R.; Miller, C.E.; Wiggins, E.B.; Randerson, J.T. Lightning as a major driver of recent large fire years in North American boreal forests. Nat. Clim. Chang. 2017, 7, 529–534. [Google Scholar] [CrossRef]
- Abdollahi, M.; Dewan, A.; Hassan, Q.K. Applicability of remote sensing-based vegetation water content in modeling lightning-caused forest fire occurrences. ISPRS Int. J. Geo-Info. 2019, 8, 143. [Google Scholar] [CrossRef]
- Hawkins, L.N.; Russell, L.M. Oxidation of ketone groups in transported biomass burning aerosol from the 2008 Northern California Lightning Series fires. Atmos. Environ. 2010, 44, 4142–4154. [Google Scholar] [CrossRef]
- Parka, R.J.; Jacob, D.J.; Logan, J.A. Fire and biofuel contributions to annual mean aerosol mass concentrations in the United States. Atmos. Environ. 2007, 41, 7389–7400. [Google Scholar] [CrossRef]
- Baranovskiy, N.; Kirienko, V. Mathematical Simulation of Forest Fuel Pyrolysis in One-Dimensional Statement Taking into Account Soot Formation. Processes 2021, 9, 1616. [Google Scholar] [CrossRef]
- Baranovskiy, N.V.; Vyatkina, V.A. Mathematical simulation of inert heating and pyrolysis of forest fuel under the influence of a forest fire front, if the process of sooting is taken into account. Pozharovzryvobezopasnost/Fire Explos. Saf. 2022, 31, 34–44. (In Russian) [Google Scholar] [CrossRef]
- Baranovskiy, N.V.; Zakharevich, A.V. Experimental modeling of spruce needles ignition by a carbonaceous particle heated to high temperatures. For. Sci. Issues 2020, 3 (Suppl. 1), 1–9. [Google Scholar] [CrossRef]
- Filkov, A.; Prohanov, S.; Mueller, E.; Kasymov, D.; Martynov, P.; El Houssami, M.; Thomas, J.; Skowronski, N.; Butler, B.; Gallagher, M.; et al. Investigation of firebrand production during prescribed fires conducted in a pine forest. Proc. Combust. Inst. 2017, 36, 3263–3270. [Google Scholar] [CrossRef]
- Cawson, J.G.; Pickering, B.J.; Filkov, A.I.; Burton, J.E.; Kilinc, M.; Penman, T.D. Predicting ignitability from firebrands in mature wet eucalypt forests. For. Ecol. Manag. 2022, 519, 120315. [Google Scholar] [CrossRef]
- Rivera, J.; Hernandez, N.; Consalvi, J.L.; Reszka, P.; Contreras, J.; Fuentes, A. Ignition of wildland fuels by idealized firebrands. Fire Saf. J. 2021, 120, 103036. [Google Scholar] [CrossRef]
- Baranovskiy, N.V. Predicting, Monitoring, and Assessing Forest Fire Dangers and Risks; IGI Global: Hershey, PA, USA, 2020. [Google Scholar] [CrossRef]
- Baranovskiy, N.V. Forest Fire Danger Prediction Using Deterministic-Probabilistic Approach; IGI Global: Hershey, PA, USA, 2021. [Google Scholar] [CrossRef]
- Baranovskiy, N. Deterministic-Probabilistic Approach to Predict Lightning-Caused Forest Fires in Mounting Areas. Forecasting 2021, 3, 695–715. [Google Scholar] [CrossRef]
- Wang, X.; Wotton, B.M.; Cantin, A.S.; Parisien, M.-A.; Anderson, K.; Moore, B.; Flannigan, M.D. CFFDRS: An R package for the Canadian Forest Fire Danger Rating System. Ecol. Process. 2017, 6, 5. [Google Scholar] [CrossRef]
- WFAS: Wildland Fire Assessment System. Available online: https://www.wfas.net/ (accessed on 10 October 2022).
- Podolskaya, A.S.; Ershov, D.V.; Shulyak, P. Application of the method for assessing the likelihood of forest fires in ISDM-Rosleskhoz. Mod. Probl. Remote Sens. Earth Space 2011, 8, 118–126. (In Russian) [Google Scholar]
- Muller, M.M.; Vila-Vilardell, L.; Vacik, H. Towards an integrated forest fire danger assessment system for the European Alps. Ecol. Inform. 2020, 60, 101151. [Google Scholar] [CrossRef]
- Miller, C.; Ager, A.A. A review of recent advances in risk analysis for wildfire management. Int. J. Wildland Fire 2013, 22, 1–14. [Google Scholar] [CrossRef]
- Hardy, C.C. Wildland fire danger and risk: Problems, definitions, and context. For. Ecol. Manag. 2005, 211, 73–82. [Google Scholar] [CrossRef]
- Emercom for Republic of Altay. Available online: https://04.mchs.gov.ru/ (accessed on 14 September 2021).
- Samarskii, A.A.; Vabishchevich, P.N. Computational Heat Transfer, Volume 1, Mathematical Modeling; Wiley: Chichester, UK, 1995. [Google Scholar]
- Samarskii, A.A.; Vabishchevich, P.N. Computational Heat Transfer, Volume 2, The Finite Difference Method; Wiley: Chichester, UK, 1995; 432p. [Google Scholar]
- Samarskii, A.A. The Theory of Difference Schemes; Marcel Dekker, Inc.: New York, NY, USA, 2001. [Google Scholar]
- Samarskii, A.A.; Nikolaev, E.S. Methods for Solving Grid Equations; Nauka: Moscow, Russia, 1978; p. 590. (In Russian) [Google Scholar]
- Bakhvalov, N.S.; Zhidkov, N.P.; Kobelkov, G.M. Numerical Methods; Binom: Moscow, Russia, 2004; p. 636. (In Russian) [Google Scholar]
- Wentzel, E.S. Theory of Probability; ACADEMIA: Moscow, Russia, 2003; p. 571. (In Russian) [Google Scholar]
- Grishin, A.M. Mathematical Modeling of Forest Fires and New Ways to Fighting Them; Science: Novosibirsk, Russia, 1992; p. 401. (In Russian) [Google Scholar]
- Grishin, A.M. A.M. A general mathematical model of forest fires and its application to the protection and safeguarding of forests. In Conjugate Problems of Mechanics and Ecology: Selected Reports of International Conference.; Publishing House of the Tomsk State University: Tomsk, Russia, 2000; pp. 88–137. (In Russian) [Google Scholar]
- Baranovskiy, N.; Malinin, A. Mathematical Simulation of Forest Fire Impact on Industrial Facilities and Wood-Based Buildings. Sustainability 2020, 12, 5475. [Google Scholar] [CrossRef]
- Ayubov, E.N.; Luk’yanovich, A.V.; Novikov, O.N.; Norseeva, M.E.; Omelchenko, M.V.; Prischepov, D.Z.; Skubak, N.Y.; Tverdokhlebov, N.V.; Tarakanov, A.Y. Fires and Explosions; FGBU VNII GOChS (FTs): Moscow, Russia, 2017; p. 144. (In Russian) [Google Scholar]
- Scientific and Applied Reference Book on the Climate of the USSR. Series 3. Long-Term Data, Parts 1–6, Issue 20, (Tomsk, Novosibirsk, Kemerovo Regions and Altai Territory); Gidrometeoizdat: St. Petersburg, Russia, 1993; p. 718. (In Russian)
- Abaimov, V.F. Dendrology; Academy: Moscow, Russia, 2009; p. 368. (In Russian) [Google Scholar]
- Pankratov, B.M.; Polezhaev, Y.V.; Rudko, A.K. Interaction of Materials with Gas Flows; Zuev, V.S., Ed.; Mashinostroenie: Moscow, Russia, 1975; p. 224. (In Russian) [Google Scholar]
- Manzello, S.L.; Cleary, T.G.; Shields, J.R.; Maranghides, A.; Mell, W.; Yang, J.C. Experimental investigation of firebrands: Generation and ignition of fuel beds. Fire Saf. J. 2008, 43, 226–233. [Google Scholar] [CrossRef]
- Yoshioka, H.; Hayashi, Y.; Masuda, H.; Noguchi, T. Real-scale fire wind tunnel experiment on generation of firebrands from a house on fire. Fire Sci. Technol. 2004, 23, 142–150. [Google Scholar] [CrossRef]
- Manzello, S.L.; Shields, J.R.; Cleary, T.G.; Maranghides, A.; Mell, W.E.; Yang, J.C.; Hayashi, Y.; Nii, D.; Kurita, T. On the development and characterization of a firebrand generator. Fire Saf. J. 2008, 43, 258–268. [Google Scholar] [CrossRef]
- Tolstykh, M.; Goyman, G.; Fadeev, R.; Travova, S.; Shashkin, V. Development of the global multiscale atmosphere model: Computational aspects. J. Phys. Conf. Ser. 2021, 1740, 012074. [Google Scholar] [CrossRef]
- Nesterov, V.G. Combustibility of the Forest and Methods of Its Determination; Goslesbumizdat: Moscow, Russia, 1949; p. 76. (In Russian) [Google Scholar]
- Baranovskiy, N.V.; Zakharevich, A.V.; Osotova, D.S. Experimental study of pine forest fuel layer ignition by the steel heated particle. EPJ Web Conf. 2015, 82, 01020. [Google Scholar] [CrossRef]
- Baranovskiy, N.V.; Zakharevich, A.V. Experimental research of grassy rags ignition by heated up to high temperatures carbon particle. In Multifunctional Materials and Modeling; Apple Academic Press: Ontario, Canada, 2015; pp. 11–18. [Google Scholar]
- Grishin, A.; Golovanov, A.; Kolesnikov, A.A.; Strokatov, A.A.; Tsvyk, R. Experimental study of thermal and fire tornados. Dokl. Phys. 2005, 50, 66–68. [Google Scholar] [CrossRef]
- Kataeva, L.Y. Application of the Concepts and Methods of Fluid and Gas Mechanics to Solve Some Urgent Problems of Ecology. Ph.D. Thesis, Tomsk State University, Tomsk, Russia, 2000; p. 180. (In Russian). [Google Scholar]
- Tolstykh, M.; Fadeev, R.; Shashkin, V.; Goyman, G. Improving the Computational Efficiency of the Global SL-AV Numerical Weather Prediction Model. Supercomput. Front. Innov. 2021, 8, 11–23. [Google Scholar] [CrossRef]
- Nagorskiy, M.; Kabanov, M.V.; Pustovalov, K.N. The Influence of Smoke from Forest Fires on the Meteorological and Electrical Characteristics of the Atmosphere. In Predicting, Monitoring, and Assessing Forest Fire Dangers and Risks; Baranovskiy, N., Ed.; IGI Global: Hershey, PA, USA, 2020; pp. 322–344. [Google Scholar] [CrossRef]
- Nieto, H.; Aguado, I.; García, M.; Chuvieco, E. Lightning-caused fires in Central Spain: Development of a probability model of occurrence for two Spanish regions. Agric. For. Meteorol. 2012, 162–163, 35–43. [Google Scholar] [CrossRef]
- Taylor, S.W.; Alexander, M.E. Science, technology and human factors in fire danger rating: The Canadian experience. Int. J. Wildland Fire 2006, 15, 121–135. [Google Scholar] [CrossRef]
- Baranovskiy, N.V. Thermophysical aspects of prognostic modeling of forest fire danger. Ph.D. Thesis, Tomsk Polytechnic University, Tomsk, Russia, 2012; p. 436. (In Russian). [Google Scholar]
- Delphi. Available online: https://www.embarcadero.com/ru/products/delphi (accessed on 14 August 2022).
- Karanina, S.Y.; Kocheeva, N.A.; Belikova, M.Y.; Baranovskiy, N.V. Analysis of a thunderstorm activity according to WWLLN: A case study. Int. Rev. Electr. Eng. 2018, 13, 69–79. [Google Scholar] [CrossRef]
- Baranovskiy, N.; Zharikova, M. A web-oriented geoinformation system application for forest fire danger in the typical forests of the Ukraine. In Thematic Cartography for the Society; Lecture Notes in Geoinformation and Cartography; Springer: Cham, Switzerland, 2014; pp. 13–22. [Google Scholar] [CrossRef]
- Yankovich, K.S.; Yankovich, E.P.; Baranovskiy, N.V. Classification of Vegetation to Estimate Forest Fire Danger Using Landsat 8 Images: Case Study. Math. Probl. Eng. 2019, 2019, 6296417. [Google Scholar] [CrossRef]
Disclaimer/Publisher’s Note: The statements, opinions and data contained in all publications are solely those of the individual author(s) and contributor(s) and not of MDPI and/or the editor(s). MDPI and/or the editor(s) disclaim responsibility for any injury to people or property resulting from any ideas, methods, instructions or products referred to in the content. |
© 2022 by the authors. Licensee MDPI, Basel, Switzerland. This article is an open access article distributed under the terms and conditions of the Creative Commons Attribution (CC BY) license (https://creativecommons.org/licenses/by/4.0/).