Article

A Study on Monitoring and Supervision of Ship Nitrogen-Oxide Emissions and Fuel-Sulfur-Content Compliance

China Waterborne Transport Research Institute, Beijing 100088, China
*
Author to whom correspondence should be addressed.
Atmosphere 2023, 14(1), 175; https://doi.org/10.3390/atmos14010175
Submission received: 9 December 2022 / Revised: 8 January 2023 / Accepted: 11 January 2023 / Published: 13 January 2023
(This article belongs to the Special Issue Traffic Related Emission and Control)

Abstract

:
Regulations for the control of air-pollutant emissions from ships within pollutant emission control areas (ECAs) have been issued for several years, but the lack of practical technologies and fundamental theory in the implementation process remains a challenge. In this study, we designed a model to calculate the nitrogen-oxide-emission intensity of ships and the sulfur content of ship fuels using theoretical deduction from the law of the conservation of mass. The reliability and availability of the derived results were empirically evaluated using measurement data for NOx, SO2, and CO2 in the exhaust gas of a demonstration ship in practice. By examining the model and the measured or registered fuel-oil-consumption rates of ships, a compliance-determination workflow for NOx-emission intensity and fuel-sulfur-content monitoring and supervision in on-voyage ships were proposed. The results showed that the ship fuel’s NOx-emission intensity and sulfur content can be evaluated by monitoring the exhaust-gas composition online and used to assist in maritime monitoring and the supervision of pollutant emissions from ships. It is recommended that uncertainties regarding sulfur content should be considered within 15% during monitoring and supervision. The established model and workflow can assist in maritime monitoring. Meanwhile, all related governments and industry-management departments are advised to actively lead the development of monitoring and supervision technology for ship-air-pollutant control in ECAs, as well as strengthening the quality management of ships’ static data.

1. Introduction

Ship travel emits a variety of atmospheric pollutants and greenhouse gases into the atmospheric environment, such as carbon dioxide (CO2), nitrogen oxide (NOx), sulfur dioxide (SO2), particulate matter (PM), volatile organic compounds (VOC), and black carbon (BC) [1]. Previous studies indicated that the emission of air pollutants from ships in China is mainly present in water areas within 100 km of the shore [2]. With the rapid development of the shipping industry, the negative impact of watercraft on the atmosphere is continuing to increase [3]. I A consensus has been established regarding the idea that improving air quality by reducing the pollutant-emission load of ships is necessary for the domestic and international community [4].
To effectively reduce air-pollutant emissions from ships and mitigate the influence of pollutants on residents’ health in areas with intense shipping activities, some regulatory measures have been proposed. The concept of the “emission control area (ECA)” was defined by the International Maritime Organization (IMO) in Appendix III of at the International Convention for the Prevention of Pollution from Ships (MARPOL Convention) Annex VI in 1997 [5]. The MARPOL Convention enacted stricter measures and delineated NOx Emissions Control Areas (NECA)/SOx Emissions Control Areas (SECA) to minimize airborne emissions from ships within a specific maritime space [6]. To date, IMO has set up five ECAs worldwide, and four (i.e., the Baltic Sea, North Sea and English Channel, North American, and U.S. Caribbean coasts) are in service [7]. Furthermore, in June 2022, the 78th session of the IMO Committee on Maritime Environmental Protection approved the establishment of ECAs in Mediterranean waters, which is expected to officially take effect in 2024 [8].
Some measures have been implemented in terms of the control of pollutant emissions from ships. From 2015, the sulfur content of ship fuel or the corresponding equivalent was not allowed to exceed 0.1% within the ECAs according to the IMO regulations [9]. In addition, the NOx-emissions criteria are more complex than those for SO2 because NOx production depends not only on fuel composition but also on combustion conditions. The IMO implied that the threshold corresponding to the total amount of NOx emissions is related to the axial energy per kilowatt-hour (KW·h) produced by ship engines (Resolution MEPC.177(58)). The emissions standards for NOx in and outside the ECAs are listed in the MARPOL Convention, in which the emissions standards take the form of three transition periods, from loose to strict: Tier I, Tier II, and Tier III [10]. These were implemented in 2000, 2011, and 2016, respectively. Currently, the ECAs enforce Tier III standards, which only apply to ships built after 1 January 2016; they are demarcated by the point at which the ship completes its keel-laying.
China is one of the leading countries in the shipping industry. In 2021, the freight turnover of its inland river and maritime cargo reached 1773.599 billion ton kilometers and 9784.151 billion ton kilometers [11], respectively. Thus, to protect the atmosphere and water environment against pollution in China, the Ministry of Transport of the People’s Republic of China (MOT) issued the “Implementation Plan for Emission Control Area in the Pearl River Delta, Yangtze River Delta, and Bohai Rim (Beijing–Tianjin–Hebei) Waters Area” on 2 December 2015, which established the control area for the emission of atmospheric pollutants from ships in China. On 30 November 2018, the MOT issued “the Implementation Plan for the Emission Control Area of atmospheric pollutants from ships”, which upgrades and strengthens the emission-control regulations established in 2015, with more comprehensive requirements for the emissions of NOx, PM, and SOx. The precautionary area was not expanded into the coastal and interior waters.
The implementation of the ECA rules has significantly reduced pollutant emissions and improved regional air quality in coastal and inland river areas [12,13]. Some European Union countries are concerned about the issue of ship-compliance monitoring, and carry out related supervision in ECAs [14]. However, there are still several technical problems during implementation, especially in China. Firstly, systematic supervision and the monitoring workflow need to be improved in the ECAs. The policy of “the Emission Control Area of atmospheric pollutants from ships” puts forward specific requirements regarding the sulfur content of the fuel used by ships and the NOx-emission intensity of ship engines [15]. However, in the process of supervision, the unrigorous detection method and unstandardized data recording cannot provide sufficient data, such as metadata, on the sulfur content of ship fuels and exhaust-gas volumes, which hinders the emission load or intensity of SOx or NOx. Secondly, there is a shortage of analyses on the uncertainties regarding the sulfur content of ship fuel. Previous studies only investigated the feasibility of the monitoring method, and they did not reveal the uncertainties regarding the sulfur content of ship fuel using exhaust-gas monitoring, meaning that the method cannot be applied to a broader range of waters.
Some monitoring technologies for exhaust gas are already in use [16,17,18,19,20,21,22]. For example, ship-waste-gas online-monitoring technology can record the instantaneous emission of various pollutants on board; this can be used for the real-time management and traceability analyses of ship-exhaust gas [16,17]. This technology has the advantage of high monitoring accuracy, and can cover the whole process of a ship. However, as it is inconvenient for administrative departments to directly monitor and supervise exhaust gas during the voyages of ships in ECAs, technologies that do not interfere with voyaging ships are recommended. Differential optical absorption spectroscopy (DOAS) technology can be used to monitor and analyze the NOx/CO2- and SO2/CO2-volume-concentration ratio by detecting the emission port or diffusion process of a ship’s exhaust gas [18,19,20]. The advantage of this technology is that it can be used for remote monitoring and active monitoring. Ship-waste-gas unmanned aerial vehicle (UAV) monitoring technology can be used to collect the concentration or concentration ratio of the exhaust gas through a drone flight across the exhaust gas [21,22]. Its advantage lies in its innovative approach, but it is significantly affected by meteorological conditions. Ship-sniffing-monitoring technology relies on monitoring stations built on land or water to capture and monitor the waste gas from ships [18]. Although this technology has high algorithmic requirements, it has a wide range of water coverage and a high level of automation.
In this study, (1) we established a theoretical model to calculate the NOx-emission intensity of ships and the sulfur content of ship fuel, and collected online and metadata by conducting the online real-time monitoring of gaseous pollutants (i.e., NOx, SO2, and CO2) to verify the reliability and availability of the model. (2) Based on the model and raw data, we calculated the instantaneous NOx-emission intensity and sulfur content of ship fuel, and statistically analyzed the uncertainty regarding the sulfur content with a probability-distribution curve. (3) We proposed a practical workflow for the monitoring of the NOx-emission intensity and fuel-sulfur-content-compliance judgment process to provide a reference for the monitoring and supervisory regulatory threshold of the sulfur and NOx in ship fuel.

2. Research Methods

2.1. Online Empirical Test of Models

Main information on the demonstration ship. The route track of the demonstration ship is shown in Figure 1; the sampling was conducted in the East China Sea to the east of Dalian, China. The tonnage (gross weight/net deadweight) of the demonstration ship was 6000 t; the ship was built in 2006 with a designated speed of 18 knots and equipped with a two-stroke engine (model MAN 6S35ME-C) with a total power of 4400 kW and rated speed of 170 r·min−1. The density of ship fuel was 938.5 kg·m−3, sulfur content was 0.49% m/m, as measured in the laboratory provided by the fuel supplier’s bunker delivery note, and carbon content was 87.1%. The consumption rate of fuel (brake-specific fuel consumption, which involves mechanical losses) reached 185 g·(kW·h)−1; it was measured by the mass flowmeter on board. The engine-load data were collected from the actual engine records.
Online monitoring method for gaseous pollutants. The integrated online monitoring system was applied to perform the real-time NOx, SO2, and CO2 measurements, with a time resolution of 1 min. The monitoring system was fixed to the inside of the exhaust pipe of the ship’s main engine, about 5 m from the exhaust outlet. This system (model: RJ-SEMD) is a piece of professional exhaust gas-monitoring equipment developed by the program founded by the National Key R&D Program of China and certified by China Classification Society (certification no. GZ88361647) and American Classification Society (certification no. 20-H51950735-PDA). In brief, non-dispersive infrared (NDIR) technology was used to measure the concentration of CO2, ultraviolet differential optical absorption spectrometry was used to measure the concentration of SO2, and chemiluminescence (CLD) technology was used to measure the concentration of NOx. The accuracy of the methods met the technical requirements of the gaseous substances testing equipment set by IMO (Table 1). The ship was not equipped with an exhaust-gas-post-treatment device, and the online test of gaseous emissions was conducted by a direct sampling test in the main engine’s vertical section of the exhaust-gas pipeline.

2.2. Derivation of the Calculation Model for Ship NOx-Emission Intensity

The NOx-emission-intensity-calculation model and ship-fuel-sulfur-content calculation model were established based on previous reports [14,18,23]. Briefly, the basic principle of this method is to follow the law of the conservation of mass and ship characteristics. In the former, we assumed that the carbon element in the fuel is ultimately converted into CO2 in the exhaust gas produced by the sustainer motor of the ship, and all NOx is in the form of NO2. All the processing occurred under standard conditions. The model was derived as follows:
E I N O x =   m I E N O x P s   = C m a s s N O x · V P s   =   C m a s s N O x P s   · m I E C O 2 C m a s s C O 2   =   C m a s s N O x P s · M C O 2 M C · m I C C C m a s s C O 2   =   C m a s s N O x P s · M N O x M N O x · m I C C M C C m a s s C O 2 M C O 2   =   C m a s s N O x M N O x · m I C C C m a s s C O 2 · M N O x M C · M C O 2 P s · C C F C C F   =   C M N O x 1 · M N O x M C · 1 C M C O 2 · m I C C P s · C C F C C F   = C M N O x C M C O 2 · N A N A · M N O x M C · m I C C P s · C C F · C C F   = C N O x C C O 2 · 46.01 12.01 · S F C · 87.1 %   = 3.34 × C N O x C C O 2 × S F C
where EINOx = emission intensity of NOx (the emission mass of NOx emission per kW·h, g/kW·h); mIEi = instantaneous emission mass of contaminant i in the exhaust gas (g); mICi = instantaneous consumption mass of pollutant i in fuel (g); Ps = instantaneous power of ship (kW·h); Cmassi = instantaneous emission mass concentration of contaminant i in the exhaust gas (g/m3); CMi = instantaneous-emission molar concentration of contaminant i in the exhaust gas (mol/m3); Ci = instantaneous-emission molecule or atom concentration of contaminant i in the exhaust gas (ppm); V = volume of exhaust gas (m3); Mi= molar mass of pollutant i (g/mol); C is the abbreviation of element carbon; CCF is the mass percentage of carbon in fuel ( C C F = m I C C m I C f u e l ). The default value of CCF was set to 87.1% [24]. The NA means Avogadro Constant (6.02 × 10²³/mol). The SFC is the abbreviation of ship fuel-consumption rate, which is related to the ship engine and cruising status. S F C = m I C f u e l P s   = m I C C P s   · C C F . The value can be replaced by the rated fuel-consumption rate of the ship in the static database under the condition that the instantaneous fuel-consumption rate of the ship is unavailable. The calculation model of the nitrogen-oxide emission intensity of ships at sea based on exhaust-gas-concentration measurements is as follows:
E I N O x = 3.34 × C N O x C C O 2 · S F C
Thus, if the concentration of NOx, concentration of CO2, or the concentration ratio of NOx to CO2, and unit consumption rate of fuel are detected during monitoring and supervision, the instantaneous emission intensity of nitrogen oxides of ships can be calculated.

2.3. Derivation of the Calculation Model of Sulfur Content in Ship Fuel

Assuming that sulfur and carbon in ship fuel are entirely converted to SO2 and CO2, the percentage of sulfur fuel content by mass can be calculated as follows:
P   = m S m f u e l × 100 % = m S O 2   ·   M S M S O 2 m C C C F × 100 % = C m a s s S O 2   · V ·   M S M S O 2 m C C C F × 100   = C m a s s S O 2   ·   M S M S O 2   ·   C C F m C V   × 100 % = C m a s s S O 2   ·   M S M S O 2   ·   C C F m C O 2 V   ·   M C M C O 2 × 100 %   = C m a s s S O 2 M S O 2   ·   M S · C C F   C m a s s C O 2 M C O 2   ·   M C × 100 % = C M S O 2 C M C O 2 · M S M C · C C F × 100 % = C M S O 2 C M C O 2 · N A N A · M S M C · C C F × 100 % = C S O 2 C C O 2 · 32.07 12.01 × 87.1 % × 100 % = 2.33 × C S O 2 C C O 2 × 100 %
where P means the mass percentage of sulfur in fuel (%), mi = consumption mass of contaminant i in fuel in per unit time (g), and the S is the abbreviation of the element sulfur. For other definitions, please refer to Section 2.2. Thus, the calculation model of sulfur content in ship fuel based on exhaust-gas-concentration measurement can be obtained:
P = 2.33 × C S O 2 C C O 2 × 100 %
It can be seen that the sulfur content of fuel oil used by ships can be judged under the condition that the concentration of SO2 and CO2, or the ratio of SO2 and CO2 concentration of ships, can be detected.

3. Results and Discussion

3.1. The Online Measurements for Voyaging Ships

By applying the established monitoring system mentioned in Section 2.2 and Section 2.3, we measured and recorded the instantaneous fuel-consumption rate and the real-time concentrations of NOx, CO2, and SO2 in the exhaust gas from the engine within 3397 min. The overall process included the sailing period (77 min), cruising period (3231 min), and anchoring period (89 min).
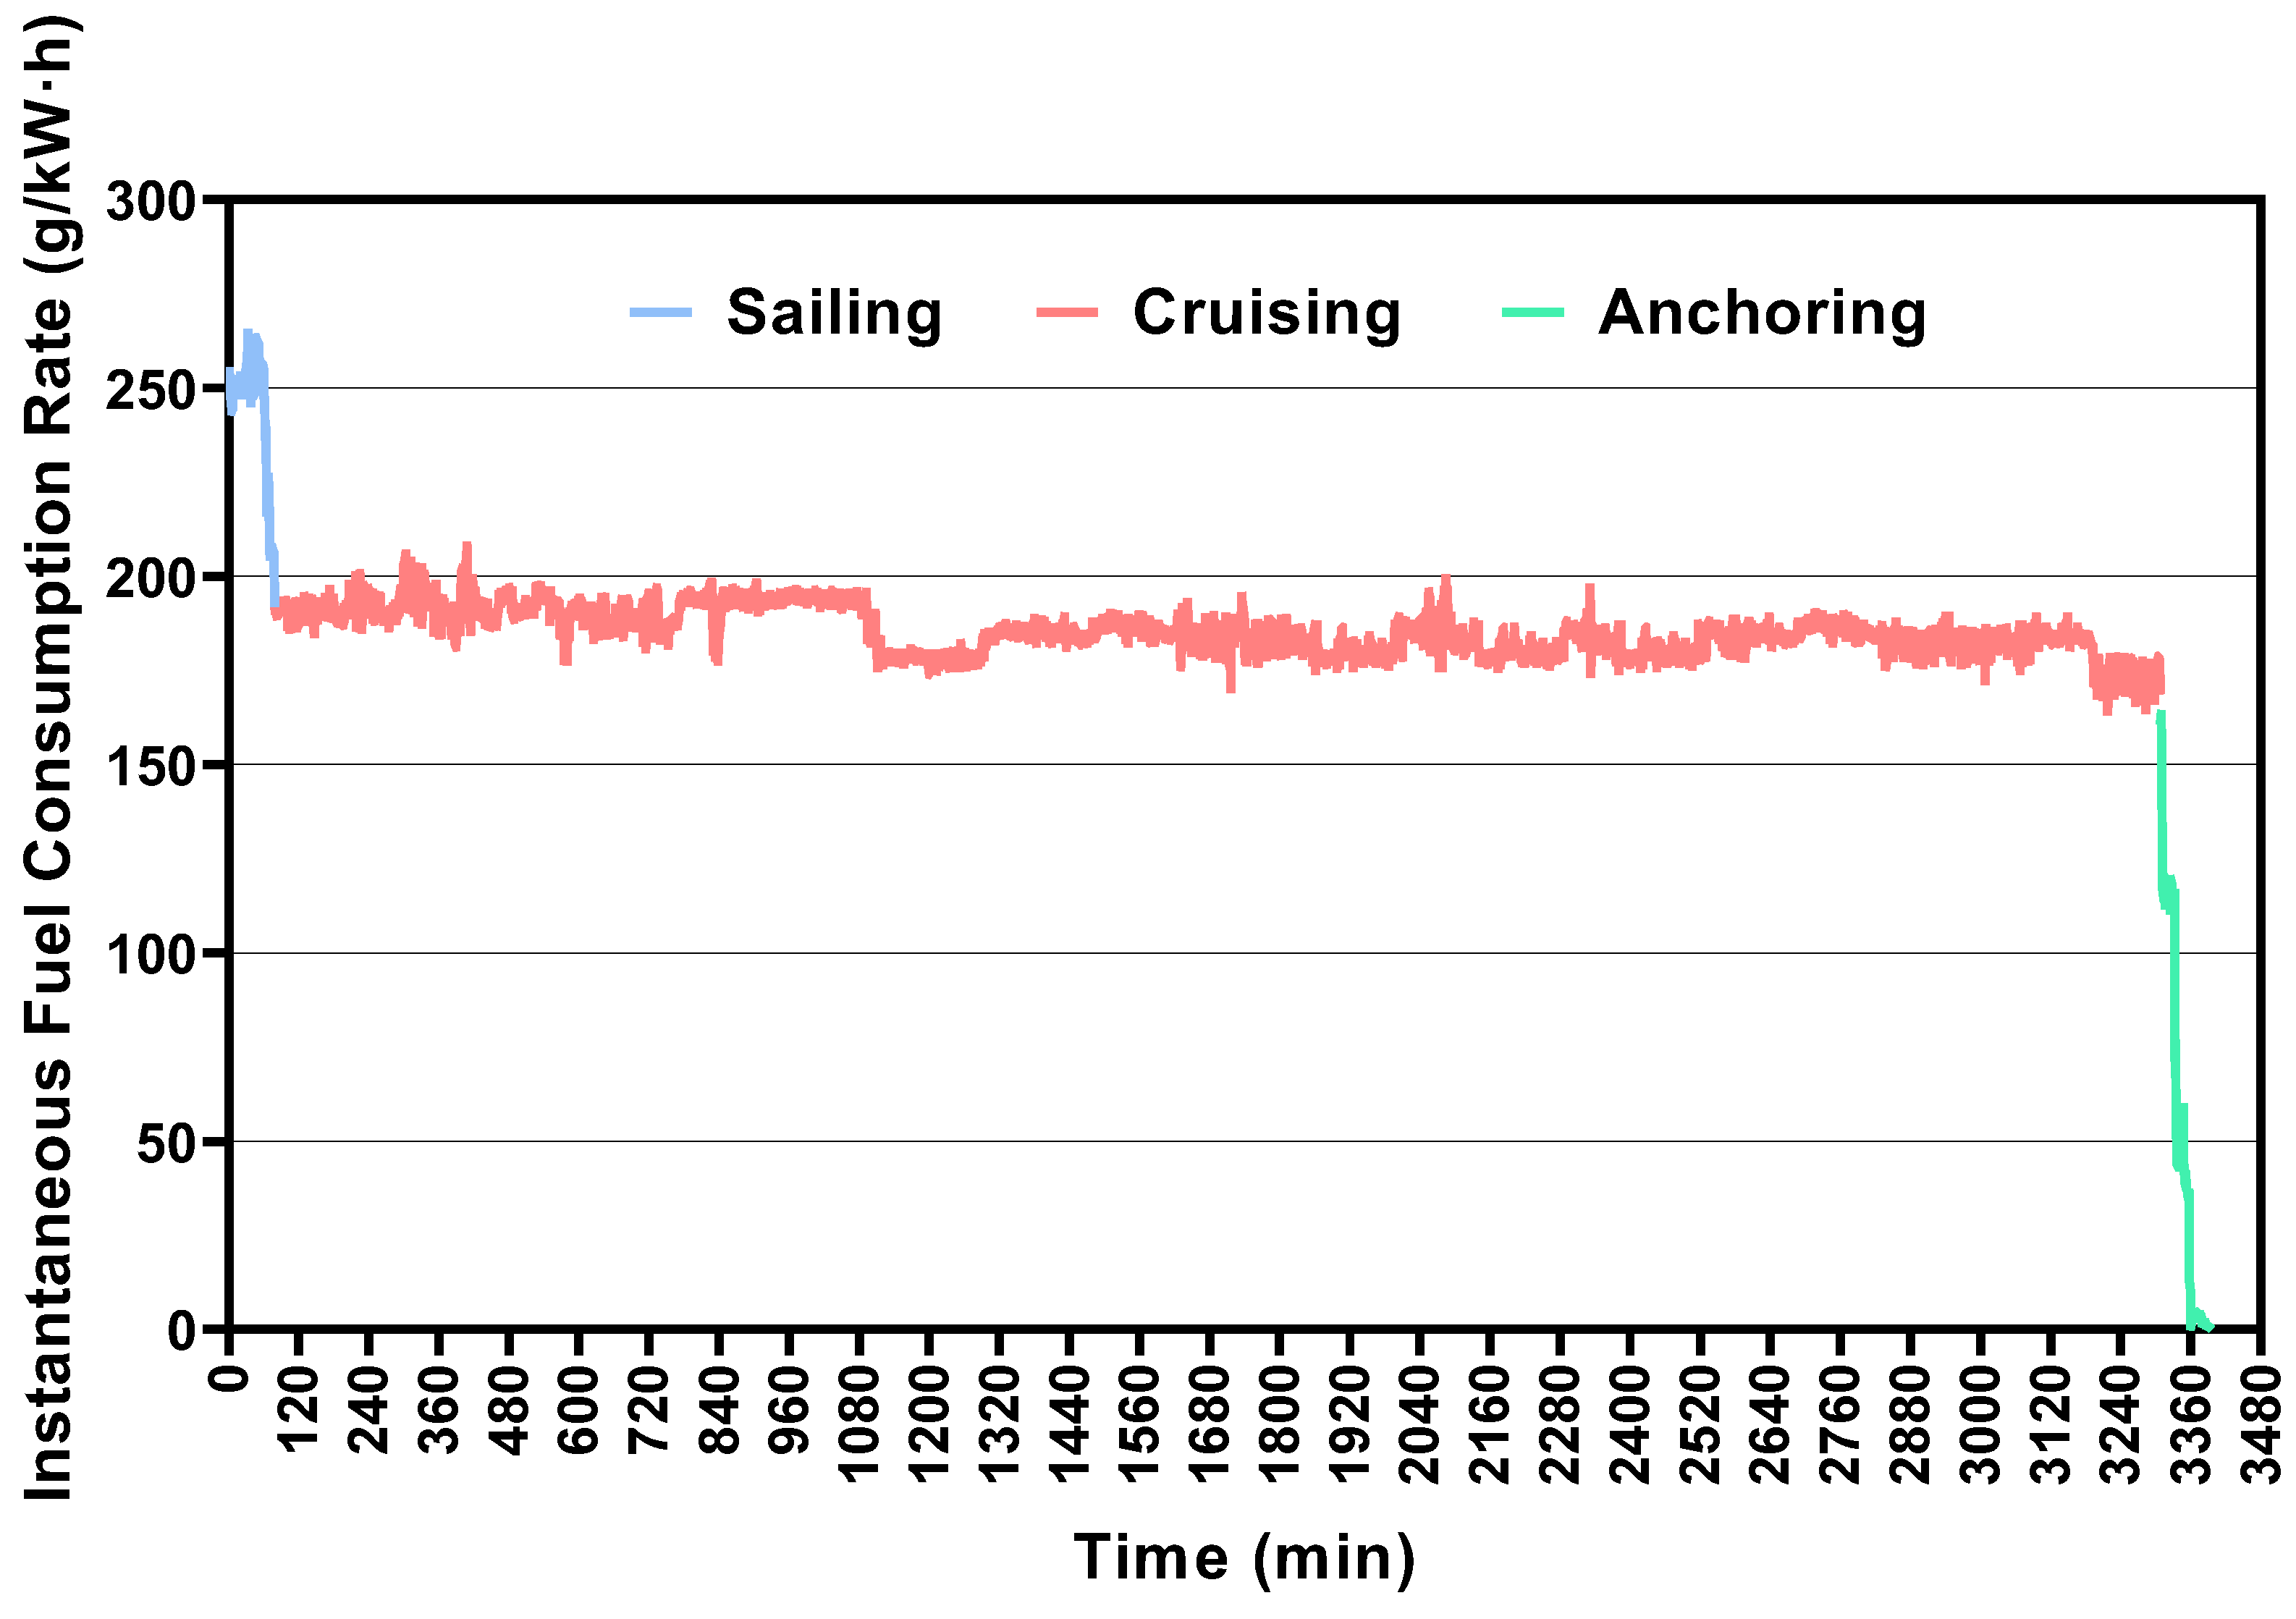
Consumption of fuel. The instantaneous fuel-consumption rate of the ship was obtained by recording real-time data on the fuel consumption, as shown in Figure 2. The instantaneous fuel consumption of the ship dramatically increased from ~250 to 263 g·(kW·h)−1 at the beginning of the 47 min, decreased to essentially the same level as the cruising stage within 30 min and, subsequently, in the cruising stage, fluctuated between 175 and 200 g·(kW·h)−1, before demonstrating a sharp fall in the anchoring stage. The increase in the sailing period was due to the massive increase in the throttle at this stage, which resulted in an excessive fuel supply. The consumption rate of the fuel was relatively stable at around 185.31 g·(kW·h)−1 (ranging from 175 to 200 g·(kW·h)−1) throughout the whole cruising stage (Figure 2).
Measured results of pollutant concentration in the ship-exhaust gas. The instantaneous-emission concentrations of the SO2, NOx, and CO2 in the ship exhaust gas for every minute are shown in Figure 3. The variation trends in the concentrations of the SO2, NOx, and CO2 were consistent with each other and rapidly increased in the sailing period from 0 to 77 min, remained steady in the cruising stage from 77 to 3308 min, and decreased in the anchoring stage from 3308 to 3397 min. The ranges of the instantaneous-emission concentrations of the SO2, NOx, and CO2 were 58.3 ppm~90.1 ppm, 653.21 ppm~974.61 ppm, and 31,000 ppm~43,000 ppm, respectively.

3.2. NOx-Emission Intensity and Sulfur Content of Ship Fuel

Given the significant distinction between the three stages, we calculated the NOx-emission intensity in each period.
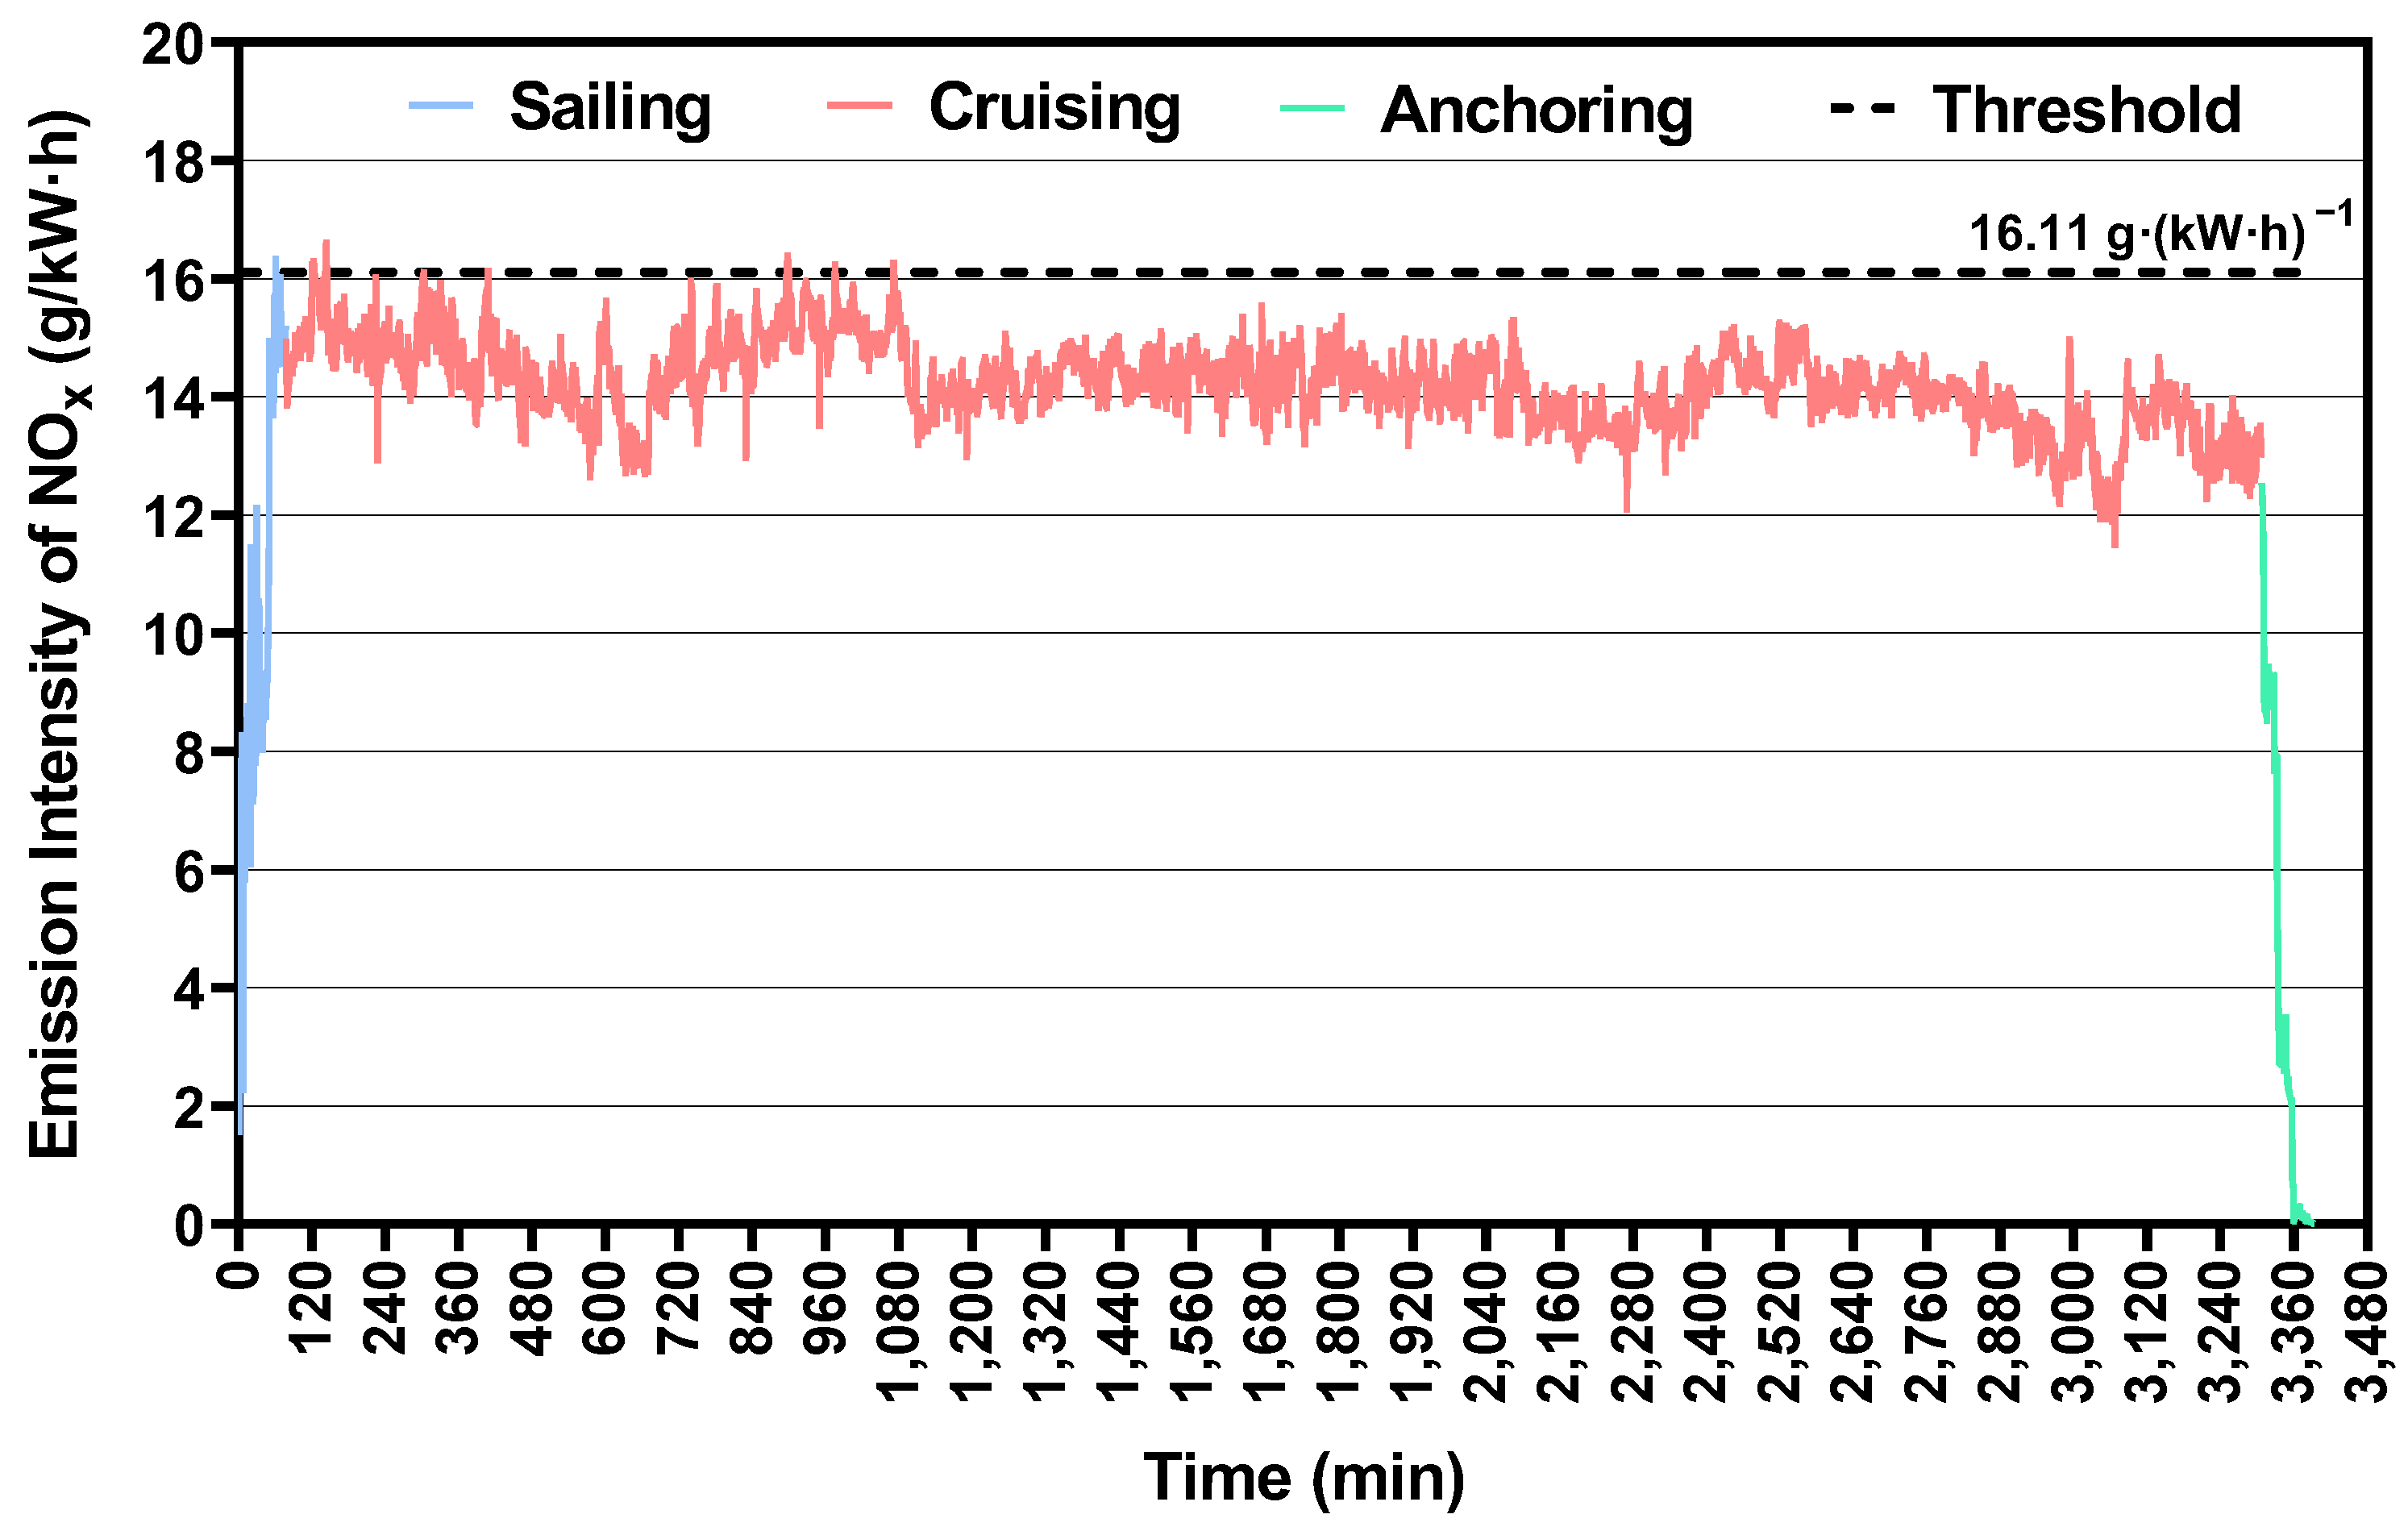
Calculation results and analysis of ship NOx-emission intensity. By substituting the recorded real-time data into the model of the ship (Formula (1)) established in Section 2.1, the ships’ instantaneous NOx-emission intensity at every minute was obtained and is shown in Figure 4. The NOx-emission intensity of the ship also demonstrated three stages (increase, maintenance of stability, and decrease), corresponding to the three stages of sailing, cruising, and anchoring, respectively, throughout the test process. The emission intensity of the NOx in the cruising stage ranged from 11.50 to16.60 g·(kW·h)1, and the average intensity was 14.22 g·(kW·h)1. According to Tier I of the MARPOL Convention, the threshold of the NOx-emission intensity of demonstration ships manufactured before 2006 should be less than the value of “45 × (the engine rotational speed to the power of −0.2) [g·(kW·h)1]” [10]. Since the engine-rotation speed of the demonstration ship is 170 r·min1, the threshold of the NOx-emission intensity was calculated as 16.11 g·(kW·h)1 (black dashed line in Figure 4). During the whole 3397-min voyage, there were 22 min in which the NOx-emission intensity exceeded the permissible value, which accounted for 0.65% of the entire process.
The results indicate that the NOx-emission intensity of voyaging ships can be calculated when the real-time NOx/CO2-concentration ratio and the fuel-consumption rate are obtained. Further, the emissions intensity of NOx for voyaging ships can be evaluated and controlled through comparison with the emission standards.
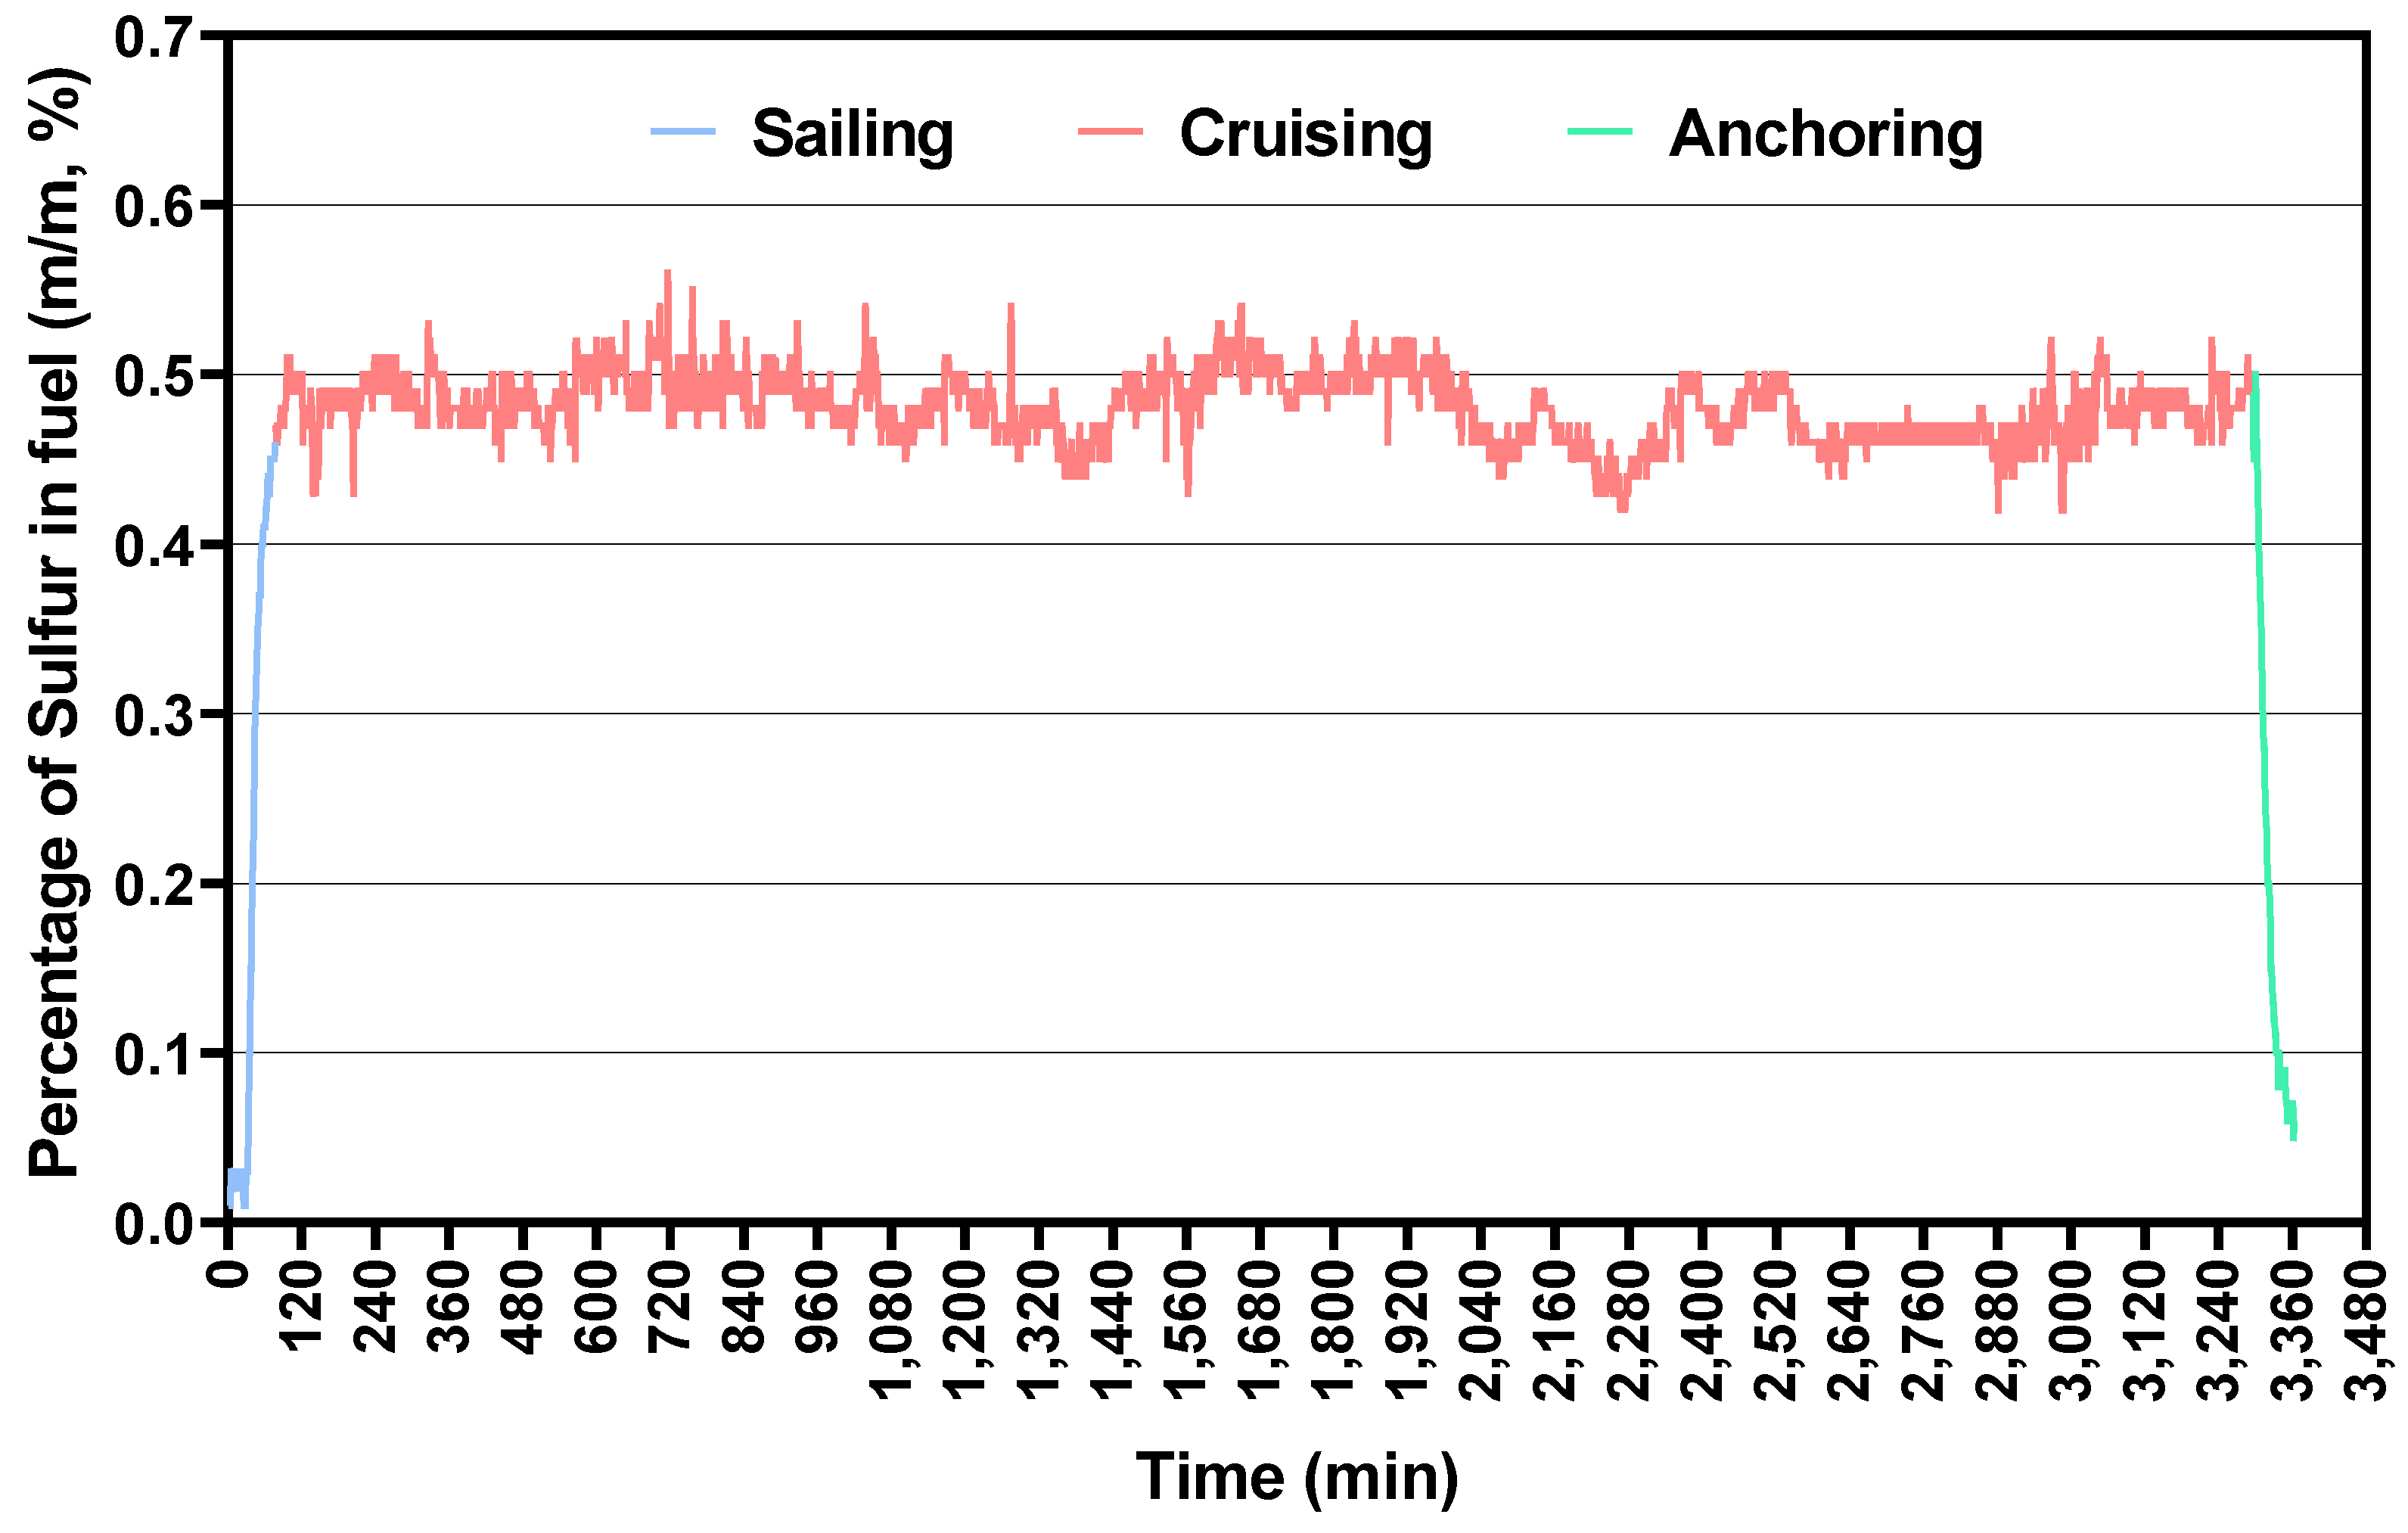
Sulfur content in ship fuel. By substituting the recorded real-time data into the model of the sulfur content of the ship fuel (Formula 2) established in Section 2.3, the sulfur content of the ship fuel at every minute was calculated (Figure 5).
The calculation results of the sulfur content in the ship fuel also showed three stages, corresponding to the fuel consumption of the three stages in this test period. Due to the instability of the fuel combustion, the calculated sulfur content varied significantly with the percentage changes in SO2 in the exhaust gas at the first and third stages of the voyage. Therefore, the steady cruising stage (from 77 min to 3308 min) was selected as the most logical stage in which to calculate the sulfur content. The results showed that the sulfur content in the fuel of voyaging ships can be calculated when the real-time SO2/CO2 concentration ratio is obtained.
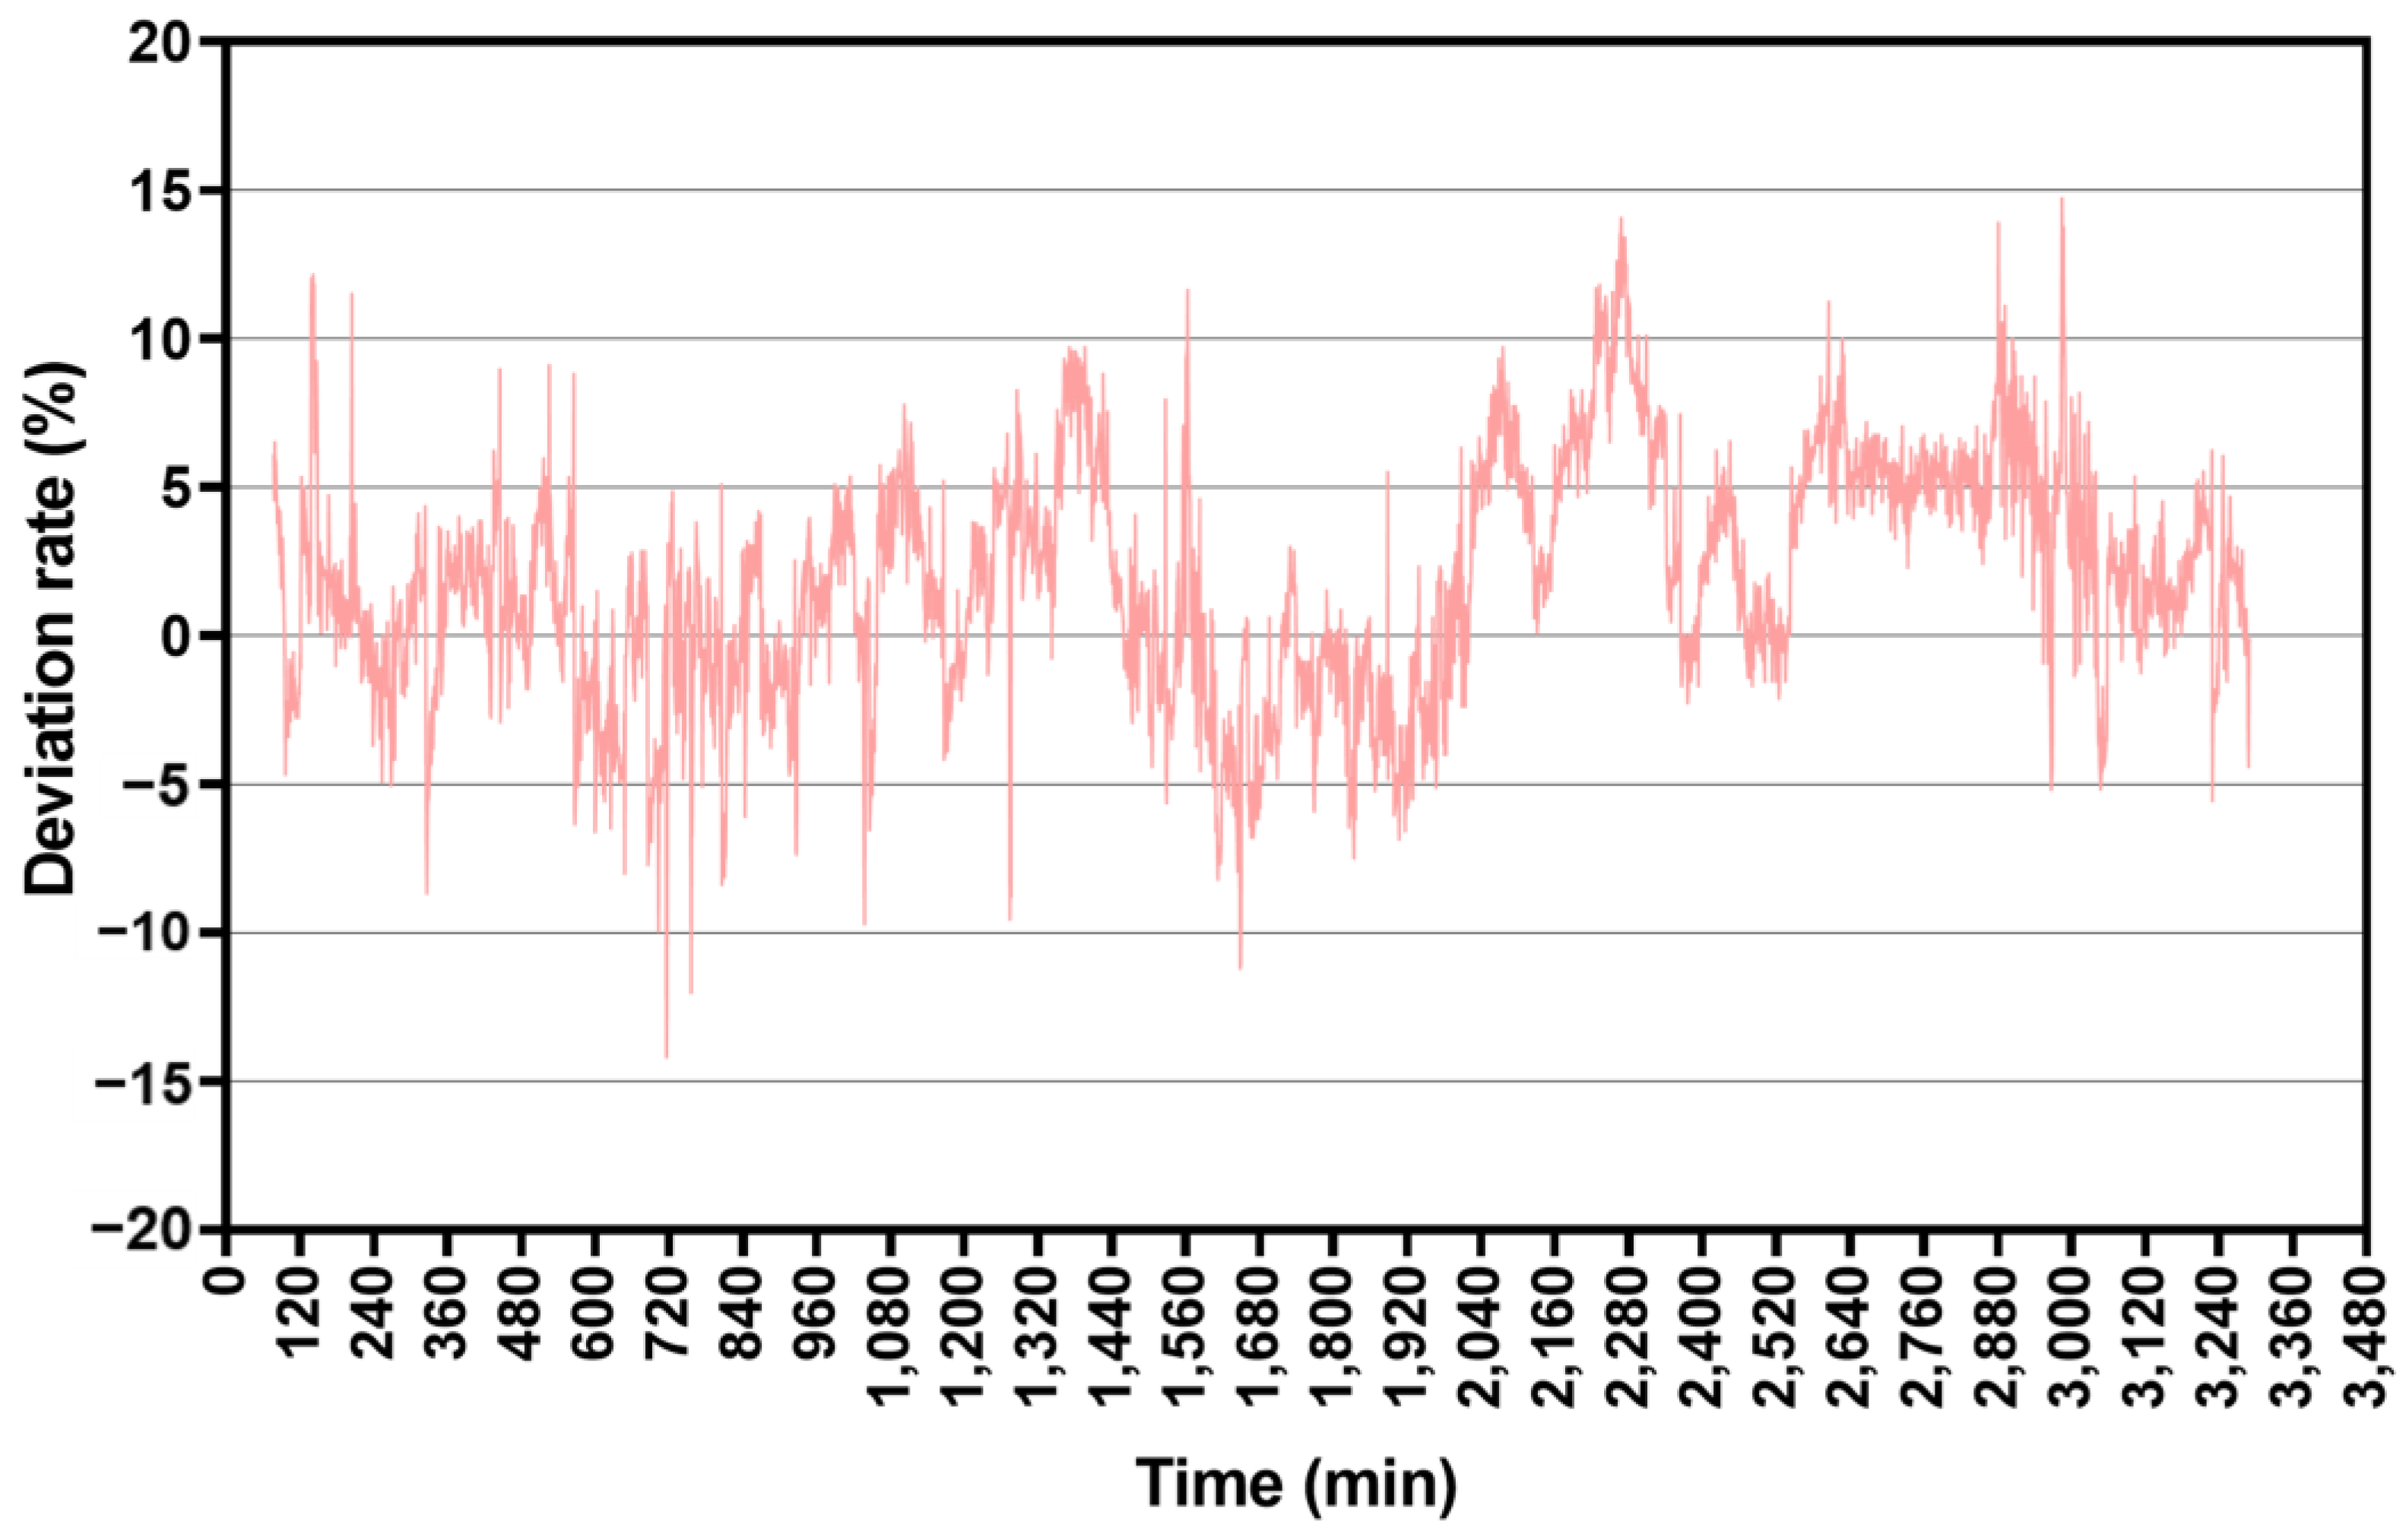
Furthermore, the sulfur content in fuel can be supervised through a comparison with the specific standards implemented in the ECAs. Combined with the sulfur-content value, 0.49% (m/m), measured in the laboratory, the deviation of the calculated results was calculated during the cruising stage. As can be seen from Figure 6, the median deviation of the results calculated by the real-time monitoring of the SO2 and CO2 concentrations in the exhaust gas was 1.86% and ranged from −14.19% to +14.71%. The frequency distribution of the deviation of the calculated results accorded with the normal distribution (the quantiles of 5% and 95% were −4.18% and 8.18%, respectively), which indicated that the calculated results of the sulfur content based on the SO2 and CO2 concentrations were relatively stable. These advantages of the model imply that it can be used as a basis for practical supervision.
In addition, the calculated sulfur content of fuel is restricted by the assumptions, monitoring environment, and equipment accuracy. Therefore, the uncertainty range should be considered in practical supervision to prevent missing data and misreporting. Based on the analysis results of the current study (Figure 7), we suggest that the sulfur content of fuel should be monitored by detecting the SO2/CO2-concentration ratio in the exhaust gas of ships, and that the deviation should be within ±15%.

3.3. Compliance Determination

Based on the established model and the real-time monitoring data of ships, a regulation workflow for the compliance determination of NOx-emission intensity regarding the exhaust-gas and fuel sulfur contents in ship fuel was designed in this study to assist the maritime administration department by establishing a monitoring-and-supervision system. As shown in Figure 8, the workflow consists of (1) an exhaust-gas-monitoring module (inside the green box), (2) an instantaneous-fuel-consumption-recording module (inside the red box), (3) a static-and-dynamic-database module (inside the blue box), and (4) a compliance-determination module (inside the purple box). Modules (1) and (2) are the front-end-detection-hardware equipment, while modules (3) and (4) belong to the back-end-software system.
The back-end software system was the core of the regulation workflow, which was used to process the raw data and execute compliance determination [25]. In brief, the software system receives raw data from the frond-end hardware system and runs the calculation algorithm or models with reverse-identification technology to determine compliance. The static-and-dynamic-database module collects static data, such as ship names, construction time, and engine power, as well as the dynamic data of the ship at an on-voyage state to provide essential support. The detailed process of the compliance-determination modules is shown in Figure 9. The algorithm of ships’ gaseous-pollutant-emission intensity involves the static data mentioned above; if the data are missing, the uncertainty in the evaluation results is significantly increased. Therefore, relevant departments should strengthen the quality control of ships’ static data.

4. Conclusions and Countermeasures

4.1. Conclusions

(1) The concentration or concentration ratio of the pollutants in ships’ exhaust gas can provide a basis for determining the pollutant compliance of voyaging ships. By detecting the concentration ratio of NOx to CO2 in the exhaust gas and the fuel-consumption rate of a ship, the NOx-emission intensity of the ship can be obtained. The sulfur content of ship fuel oil can be obtained by detecting the concentration or concentration ratio of the SO2 and CO2 in the exhaust gas.
(2) Ship-exhaust-gas-monitoring technology can be used as an essential support technology for maritime supervision. By building a reasonable monitoring-and-supervision system for ship-exhaust-gas emissions, the ability to supervise ship air-pollutant emissions from ships in the ECAs can be effectively improved. Assuming that the diffusion of all the pollutants in a ship’s exhaust gas occurs in equal proportions, optical telemetry and sniffer-monitoring technologies can be applied to ship-exhaust-gas monitoring and the determination of the NOx-emission intensity and sulfur content in fuel. The calculation results and the determination of compliance with the pollutant-emission levels, screening, and supervision of ships rely on accurate monitoring, static, and dynamic data.
(3) Uncertainty analyses of different measures must be taken into account when conducting supervision using ship-exhaust-gas tests. When monitoring the sulfur content of fuel by detecting the SO2/CO2 concentration ratio of ships, the deviation variation should not exceed ±15%.
In conclusion, we built an algorithm flow for the compliance judgment of the marine-NOx-emission intensity and sulfur content of fuel oil for voyaging ships in the present study. At the same time, we propose the use of the recommended maximum deviation value for the calculation of the sulfur content of ship fuel. Further, the feasibility of the algorithm proposed in this study for the monitoring of ship pollutants was verified.

4.2. Countermeasures and Suggestions

Firstly, we should actively conduct research into and the development of monitoring-and-supervision technology for ship-air-pollutant-emission control. This empirical study proves that the new technology is necessary and that it has been optimized to improve the effectiveness of the regulation of ship emissions in ECAs, which would not only help marine-management departments to expand their scope of supervision and improve their regulatory capacity but also reduce the costs of human and material resources. Transport-administration departments, ecological- and environmental-administration departments, and other relevant government departments should increase their investment in the research into and development of technologies to monitor the atmospheric-pollutant emissions from ships, or set up special projects to upgrade the monitoring technologies used for this purpose.
Secondly, ship-static-data quality control should be strengthened. Data are the basis of intelligence in the intelligent era. Ships’ static data are the cornerstone of accurate monitoring and supervision. Transport-administration departments should be aware of the importance of the quality control of basic data to ensure that basic databases are credible and reliable.

Author Contributions

Conceptualization, C.Q. and Z.L.; methodology Z.W. and C.P.; software, Z.W.; validation, Z.W. and Z.Z.; formal analysis, Z.W. and Q.M.; investigation, Z.W. and C.Q.; resources, Z.W.; data curation, Z.W; writing—original draft preparation, Z.W.; writing—review and editing, Q.M.; supervision, J.C.; project administration, J.C.; funding acquisition Z.W. All authors have read and agreed to the published version of the manuscript.

Funding

This work was supported by the National Key Research and Development Program of China (grant no. 2016YFC0208300), the Basic Research Funding Program of the Ministry of Finance of China (grant nos. WTI62211 and WTI62207).

Institutional Review Board Statement

Not applicable.

Informed Consent Statement

Informed consent was obtained from all subjects involved in the study.

Data Availability Statement

Due to the nature of this research, participants of this study did not agree for their data to be shared publicly, so supporting data is not available.

Conflicts of Interest

The authors declare no conflict of interest.

References

  1. Lin, B.; Lin, C.Y. Compliance with international emission regulations: Reducing the air pollution from merchant vessels. Mar. Policy 2006, 30, 220–225. [Google Scholar] [CrossRef]
  2. Liu, Z.M.; Lu, X.H.; Feng, J.L.; Fan, Q.Z.; Zhang, Y.; Yang, X. Influence of ship emissions on urban air quality: A comprehensive study using highly time-resolved online measurements and numerical simulation in Shanghai. Environ. Sci. Technol. 2016, 51, 202–211. [Google Scholar] [CrossRef] [PubMed]
  3. Eyring, V.; Isaksen, I.S.A.; Berntsen, T.; Collins, W.J.; Corbett, J.J.; Endresen, O.; Grainger, R.G.; Moldanova, J.; Schlager, H.; Stevenson, D.S. Transport impacts on atmosphere and climate: Shipping. Atmos. Environ. 2010, 44, 4735–4771. [Google Scholar] [CrossRef]
  4. Marine Environment Protection Committee 78th Session of Agenda Item 11: Identification and Protection of Special Areas, ECAs and PSSAs—Proposal to Designate the Mediterranean Sea, As a Whole, As an Emission Control Area for Sulphur Oxides; International Maritime Organization (IMO): London, UK, 2022.
  5. Pyć, D. ECA compliance and enforcement—legal regime for ships. SHS Web Conf. 2018, 58, 01026. [Google Scholar] [CrossRef]
  6. Liu, H.; Fu, M.L.; Jin, X.X.; Shang, Y.; Shindell, D.; Faluvegi, G.; Shindell, C.; He, K.B. Health and climate impacts of ocean-going vessels in East Asia. Nat. Clim. Chang. 2016, 6, 1037. [Google Scholar] [CrossRef]
  7. IMO. Emission Control Areas (ECAs) Designated under MARPOL Annex VI. Available online: https://www.imo.org/en/OurWork/Environment/Pages/Emission-Control-Areas-(ECAs)-designated-under-regulation-13-of-MARPOL-Annex-VI-(NOx-emission-control).aspx (accessed on 5 December 2022).
  8. IMO. Mediterranean Sea Emission Control Area for Sulphur Oxides Approved. Available online: https://www.imo.org/en/MediaCentre/MeetingSummaries/Pages/MEPC-78th-session.aspx (accessed on 5 December 2022).
  9. Bergqvist, R.; Turesson, M.; Weddmark, A. Sulphur emission control areas and transport strategies-the case of Sweden and the forest industry. Eur. Transp. Res. Rev. 2015, 7, 10. [Google Scholar] [CrossRef] [Green Version]
  10. IMO. Nitrogen Oxides (NOx)—Regulation 13. Available online: https://www.imo.org/en/OurWork/Environment/Pages/Nitrogen-oxides-(NOx)-%E2%80%93-Regulation-13.aspx (accessed on 5 December 2022).
  11. 2021 Statistical Bulletin on the Development of Transportation Industry (in Chinese); Ministry of Transport of the People’s Republic of China: Beijing, China, 2022. Available online: http://www.gov.cn/shuju/2022-05/25/content_5692174.htm (accessed on 21 November 2022).
  12. Kotchenruther, R.A. The effects of marine vessel fuel sulfur regulations on ambient PM2.5 at coastal and near coastal monitoring sites in the US. Atmos. Environ. 2017, 151, 52–61. [Google Scholar] [CrossRef]
  13. Zhang, Q.; Zheng, Z.Q.; Wan, Z.; Zheng, S.Y. Does emission control area policy reduce sulfur dioxides concentration in Shanghai? Transport. Res. Part D-Transport. Environ. 2020, 81, 11. [Google Scholar] [CrossRef]
  14. Clean Shipping Project Platform. Best Practice Report on Compliance Monitoring of Ships with Respect to Current and Future IMO Regulation; Chalmers University of Technology: Göteborg, Sweden, 2021. [Google Scholar]
  15. IMO MARPOL Annex VI. Regulations for the prevention of air pollution from ships. Resolut. MEPC 2005, 176, 58, Adopted by the Protocol of 1997, 15–26 September 1997. [Google Scholar]
  16. Kattner, L.; Mathieu-Uffing, B.; Burrows, J.P.; Richter, A.; Schmolke, S.; Seyler, A.; Wittrock, F. Monitoring compliance with sulfur content regulations of shipping fuel by in situ measurements of ship emissions. Atmos. Chem. Phys. 2015, 15, 10087–10092. [Google Scholar] [CrossRef] [Green Version]
  17. Celik, S.; Drewnick, F.; Fachinger, F.; Brooks, J.; Darbyshire, E.; Coe, H.; Paris, J.D.; Eger, P.G.; Schuladen, J.; Tadic, I.; et al. Influence of vessel characteristics and atmospheric processes on the gas and particle phase of ship emission plumes: In situ measurements in the Mediterranean Sea and around the Arabian Peninsula. Atmos. Chem. Phys. 2020, 20, 4713–4734. [Google Scholar] [CrossRef]
  18. Loov, J.M.B.; Alfoldy, B.; Gast, L.F.L.; Hjorth, J.; Lagler, F.; Mellqvist, J.; Beecken, J.; Berg, N.; Duyzer, J.; Westrate, H.; et al. Field test of available methods to measure remotely SOx and NOx emissions from ships. Atmos. Meas. Tech. 2014, 7, 2597–2613. [Google Scholar] [CrossRef] [Green Version]
  19. Krause, K.; Wittrock, F.; Richter, A.; Schmitt, S.; Pohler, D.; Weigelt, A.; Burrows, J.P. Estimation of ship emission rates at a major shipping lane by long-path DOAS measurements. Atmos. Meas. Tech. 2021, 14, 5791–5807. [Google Scholar] [CrossRef]
  20. Seyler, A.; Meier, A.C.; Wittrock, F.; Kattner, L.; Mathieu-Uffing, B.; Peters, E.; Richter, A.; Ruhtz, T.; Schonhardt, A.; Schmolke, S.; et al. Studies of the horizontal inhomogeneities in NO2 concentrations above a shipping lane using ground-based multi-axis differential optical absorption spectroscopy (MAX-DOAS) measurements and validation with airborne imaging DOAS measurements. Atmos. Meas. Tech. 2019, 12, 5959–5977. [Google Scholar] [CrossRef] [Green Version]
  21. Zhou, F.; Hou, L.W.; Zhong, R.; Chen, W.; Ni, X.P.; Pan, S.D.; Zhao, M.; An, B.W. Monitoring the compliance of sailing ships with fuel sulfur content regulations using unmanned aerial vehicle (UAV) measurements of ship emissions in open water. Atmos. Meas. Tech. 2020, 13, 4899–4909. [Google Scholar] [CrossRef]
  22. Zhou, F.; Pan, S.D.; Chen, W.; Ni, X.P.; An, B.W. Monitoring of compliance with fuel sulfur content regulations through unmanned aerial vehicle (UAV) measurements of ship emissions. Atmos. Meas. Tech. 2019, 12, 6113–6124. [Google Scholar] [CrossRef] [Green Version]
  23. Berg, N.; Mellqvist, J.; Jalkanen, J.P.; Balzani, J. Ship emissions of SO2 and NO2: DOAS measurements from airborne platforms. Atmos. Meas. Tech. 2012, 5, 1085–1098. [Google Scholar] [CrossRef] [Green Version]
  24. Cooper, D.A. Exhaust emissions from ships at berth. Atmos. Environ. 2003, 37, 3817–3830. [Google Scholar] [CrossRef]
  25. Wang, Z.; Qin, C.H.; Liu, C.L.; Peng, C.S.; Zhu, L.; Zhang, W.; Chen, J.F. A Method for Compliance Judgment and Violation Identification of Ship Fuel Oil (in Chinese); CN201910141501.4; China National Intellectual Property Administration: Beijing, China, 2021. [Google Scholar]
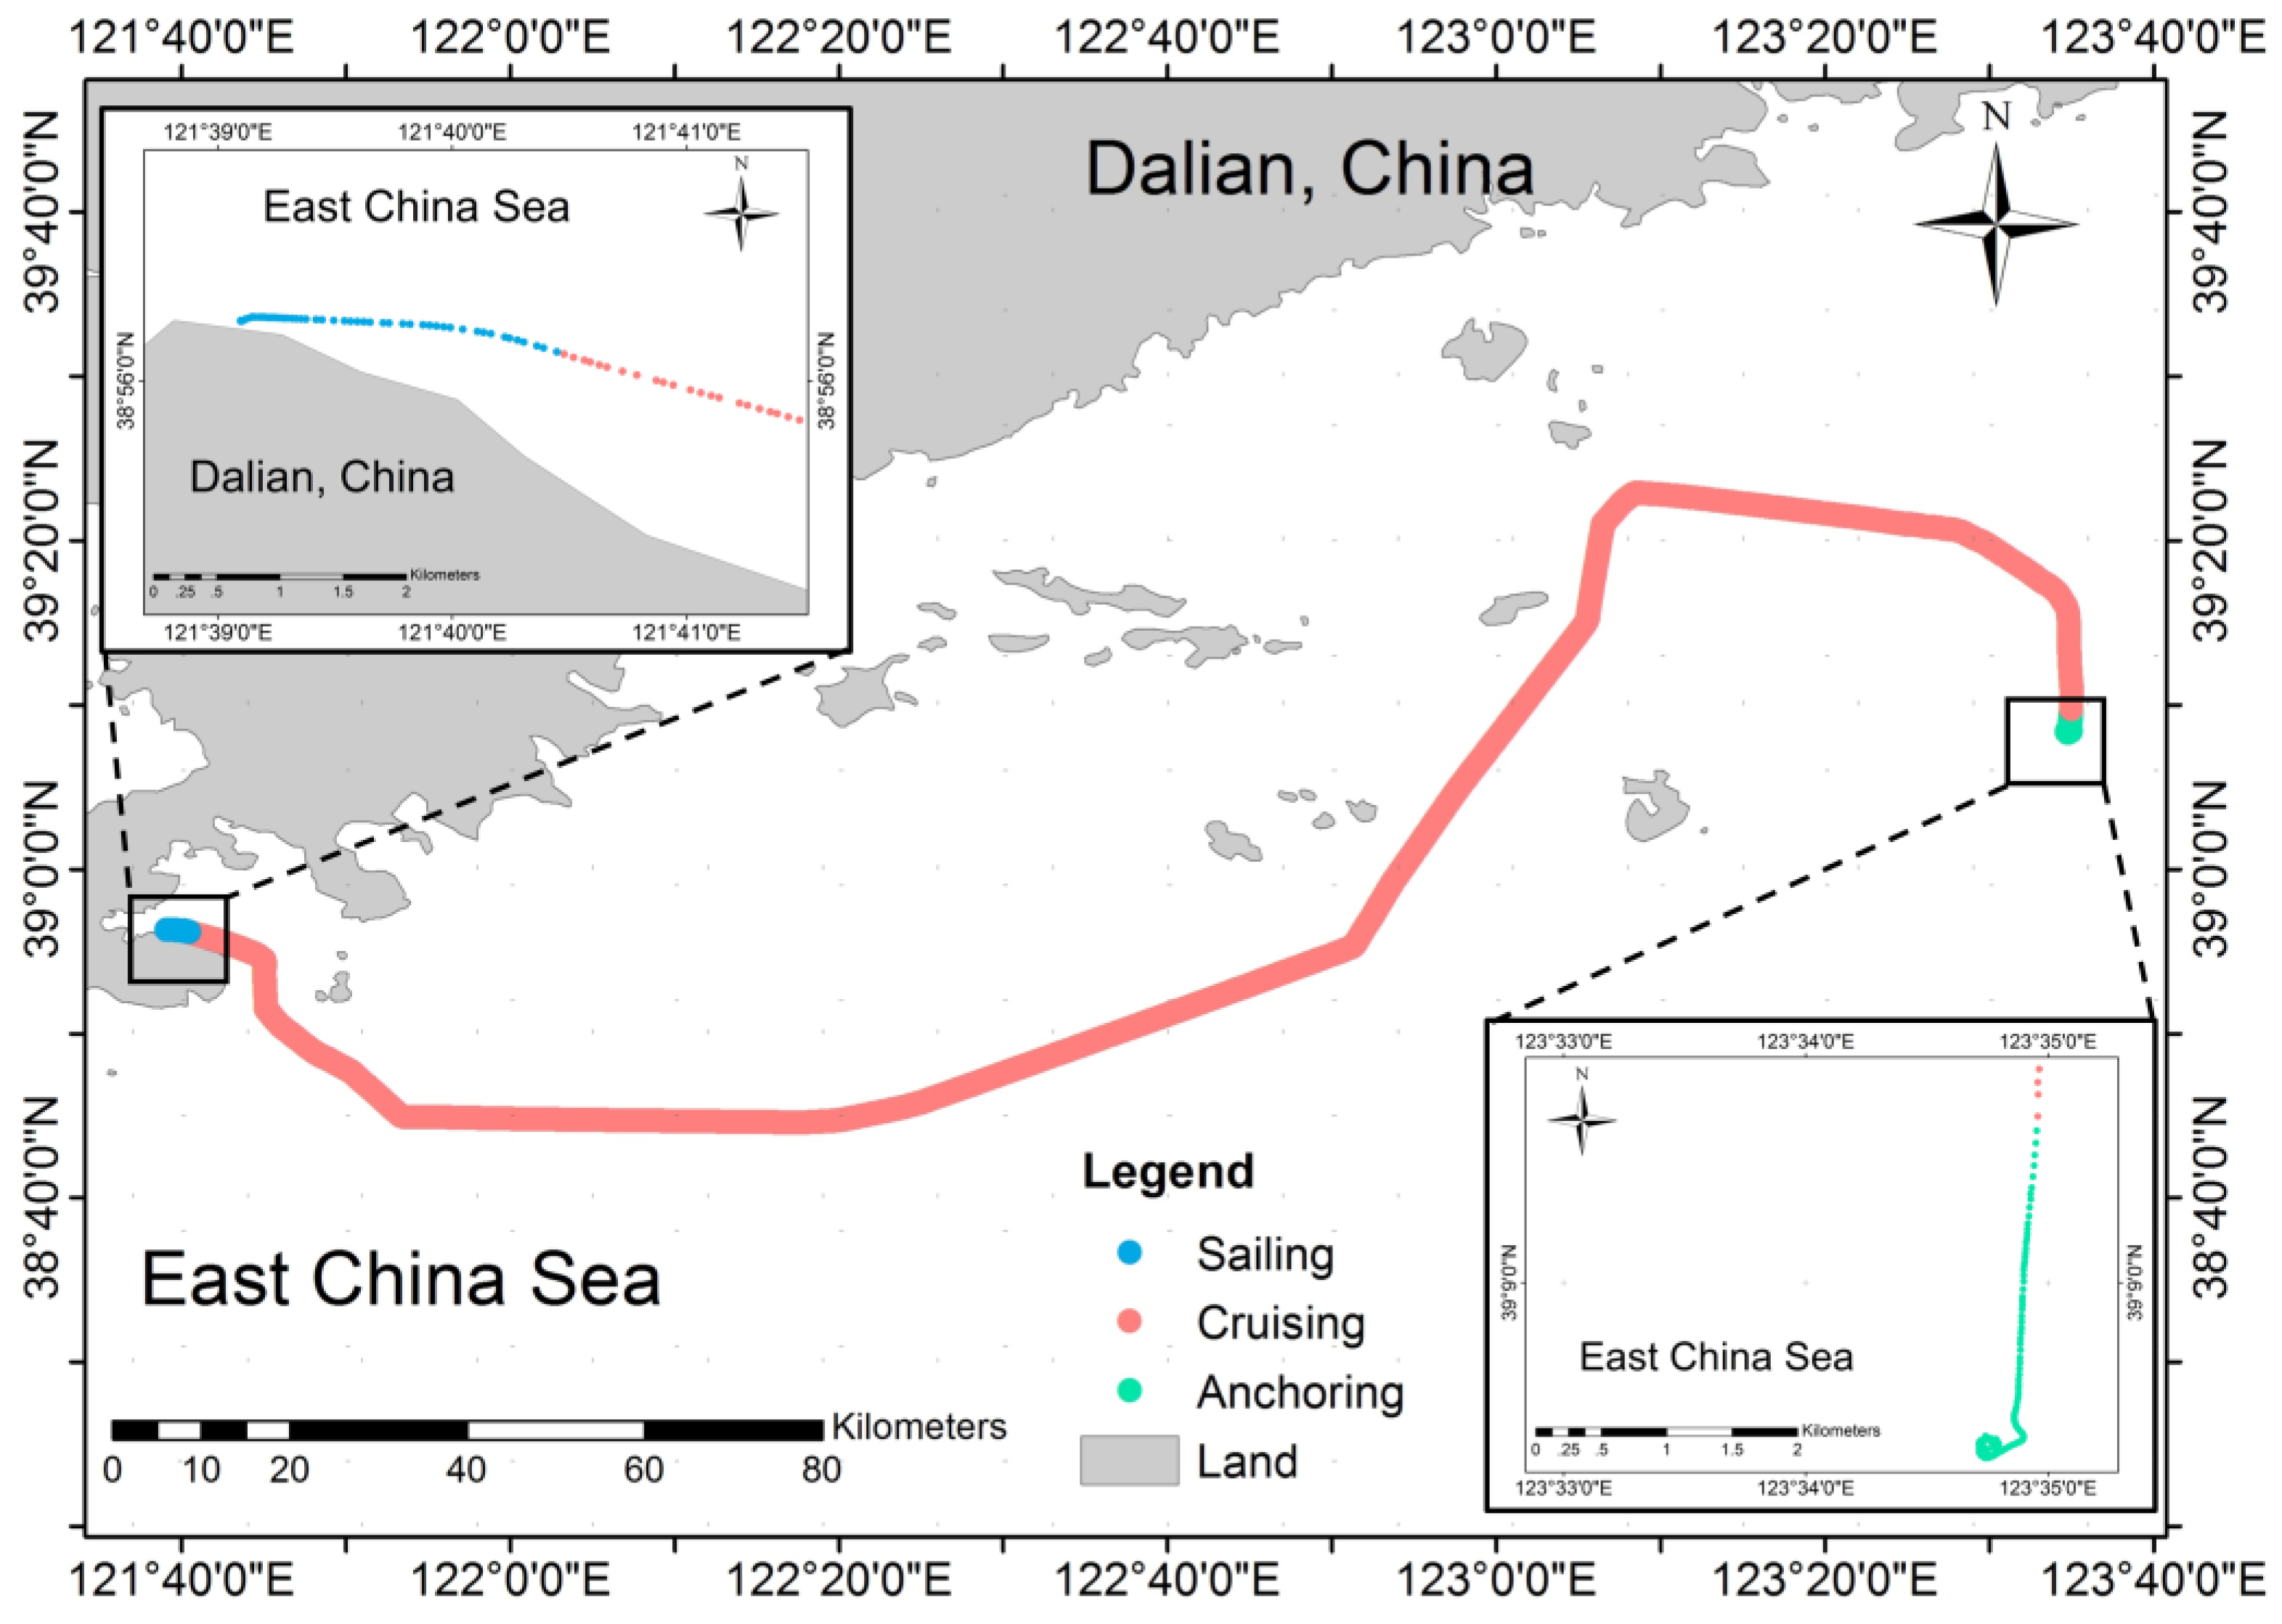
Figure 1. Route map of the ship during the whole sampling time.
Atmosphere 14 00175 g001
Figure 2. Instantaneous fuel-consumption rate of the ship over the entire voyage.
Atmosphere 14 00175 g002
Figure 3. Instantaneous-emission concentrations of contaminants in the ship exhaust gas.
Atmosphere 14 00175 g003
Figure 4. Derivation results of ships’ instantaneous NOx-emission intensity.
Atmosphere 14 00175 g004
Figure 5. Calculation results of sulfur content in fuel oil.
Atmosphere 14 00175 g005
Figure 6. Predicted deviation rate of sulfur content of ship fuel during the voyage.
Atmosphere 14 00175 g006
Figure 7. Statistical distribution of deviation rate in sulfur-content calculation of ship fuel oil.
Atmosphere 14 00175 g007
Figure 8. Regulation workflow for the compliance determination of NOx-emission intensity and sulfur content in fuel for voyaging ships.
Atmosphere 14 00175 g008
Figure 9. Algorithm flow of compliance judgment, screening, and supervision of voyaging ships.
Atmosphere 14 00175 g009
Table 1. The parameters of the real-time monitoring system.
ItemsRangePrecision Error
CO20~20 Vol. %<2%
SO20~1000 ppm<2%
NOx0~2000 ppm<2%
Disclaimer/Publisher’s Note: The statements, opinions and data contained in all publications are solely those of the individual author(s) and contributor(s) and not of MDPI and/or the editor(s). MDPI and/or the editor(s) disclaim responsibility for any injury to people or property resulting from any ideas, methods, instructions or products referred to in the content.