Abstract
Emissions of airborne particulate matter are a major cause of air pollution. A numerical approach was used to establish a single-filter-bag cleaning model based on the discrete phase particle deposition distribution law to study the effect of pulse backflushing operation parameters on the cleaning performance of the specific structure of the dust collector. It was found that increasing the pulse blowing pressure (0.2 MPa to 0.6 MPa) and extending the pulse width (0.02 s to 0.1 s) resulted in an increase in the side wall pressure of the filter bag and, thus, improved its cleaning effect. The influence of the injection pressure on the side wall pressure peak of the filter bag was more obvious than that of the pulse width. However, it cannot be concluded that the greater the injection pressure and pulse width, the better the cleaning effect. Therefore, in the actual production application, the operating cost of the equipment needs to be taken into account, as well as the amount of dust on the surface of the filter bag.
1. Introduction
Solid airborne particles are an important cause of air pollution, and the processing industry is an important source of airborne particulate emissions. Effectively reducing particulate emissions and adapting to China’s increasingly stringent air pollutant emission standards is an important issue that process industries must focus on [1,2,3]. The coal chemical industry, which has developed rapidly in recent years, is characterized by a large number of particulate leakage points and a large surface area, which is of particular concern. Pulverized coal filters are usually in the form of bag filters, which are currently a relatively effective technical device for managing air pollution. Metal fiber filter bags are a new type of filter used in chemical, metallurgical, petroleum, and environmental protection applications to intercept solid contaminants in fluids [4]. Compared with a traditional cloth filter bag, which has high-temperature resistance, corrosion resistance, processability, a long service life, and other beneficial characteristics, metal bags can be a good solution to the harsh working conditions that occur under the conditions of paste films, bags being burned by high temperatures, or broken filter bags resulting in dust leakage and other problems, effectively reducing the production costs of enterprises and improving the production capacity of equipment [5,6,7].
Dust cleaning is the main way to keep the baghouse running properly over a long period. The basic requirement for cleaning is to strip the dust deposited from the filter bag quickly and evenly, while maintaining a certain dust layer to not damage the bag and consume less power [8]. The main pulse cleaning mechanism is a high-pressure gas pulse applied to the surface of the filter bag to enable its dust stripping. Research has shown that the peak pressure [9] and pressure rise rate of the side wall [10] can be used to measure the effect of dust cleaning. Among them, the pressure rise rate is calculated by the peak pressure of the side wall of the filter bag. As it is only the result of the action of the peak pressure of the side wall of the filter bag [11], the present study will use the peak pressure of the side wall of the filter bag as the main criterion for evaluating the performance of ash cleaning.
In this work, a metal fiber filter bag was used as the object of study [12], and the metal fiber material composing the filter bag was 06Cr19Ni10. The structural characteristics of the screen were analyzed, and a numerical approach was used to establish a single-bag cleaning model based on the discrete phase particle deposition distribution law to investigate the effect of pulse blowback operating parameters on the cleaning performance of a particular structure of dust collector. A theoretical basis is provided for the selection of operating conditions for metal fiber filter bags in practical industrial applications.
2. Materials and Methods
2.1. Model Assumptions and Simplifications
Due to the relatively complex internal structure and flow field of the baghouse, the following assumptions and simplifications are made for the convenience of modeling and calculation:
- (1)
- The presence of solid particles (type of solid particles and forces applied to them) is assumed not to affect flow patterns;
- (2)
- The filter bag is represented as a cylindrical surface, and its deformation in operation is not considered;
- (3)
- Air parameters at room temperature are used for the gas parameters;
- (4)
- A uniform inlet air velocity distribution is assumed;
- (5)
- The fluid is assumed to be isothermal and incompressible for constant flow.
2.2. Airflow Phase Model
Inside the baghouse is a three-dimensional turbulent flow field, to which both the unsteady continuity equations and the Navier–Stokes equations were applied. The computational fluid dynamics (CFD) software ANSYS-Fluent 19.2 was employed in all the simulation works.
The current numerical simulation methods for engineering airflow are Reynolds-averaged models and large eddy simulations. The four most frequently used and recommended turbulence models are the standard k–ε, RNG k–ε, Realizable k–ε, and Reynolds stress models.
The flow field of the baghouse test bench is relatively simple, and the standard k-ε model is applied to simple flow field situations where the flow field is entirely turbulent. In the related research [13,14,15], the standard k-epsilon model is used for the internal flow field of a pulsed baghouse, which is also investigated in the present study; thus, the standard k–ε model was used in the simulations in this paper. The pulse-blowing time of compressed air in engineering is generally around 0.1 s [9]. In this paper, the pulse blowing time was set to 0.1 s in the numerical calculation, and the time step was taken as 0.00001 s. The SIMPLE algorithm was applied for the pressure–velocity coupling.
For ease of calculation, the fluid is assumed to be isothermal and incompressible for constant flow, and the control equations are divided into the continuity equation and the momentum equation.
The continuity equation is expressed as Equation (1):
The momentum equation is expressed as Equation (2):
where and are the velocity component; and are the coordinate component; is the gas density; is the static pressure; is the stress tensor; is the gravitational acceleration component; includes other model-related source terms such as porous media and custom source terms.
2.3. Discrete Phase Model
The movement of the flue gas inside the dust collector can be considered as a complex, three-dimensional, gas-solid, two-phase flow, assuming that there are no large particles in the flue gas entering the dust chamber. When the flow field characteristics inside the dust collector were simulated, the influence of solid particles in the flue gas on its flow field was not taken into account. When the total volume of the dispersed phase is less than 10–12%, the discrete phase model (DPM) provided in ANSYS–Fluent 19.2 assumes that particle–particle interactions and the effect of particle volume on the continuous phase can be neglected. The Euler–Lagrange discrete particle model was chosen for the simulations, i.e., fluid as a continuous medium and particles as a discrete medium. The article is based on a discrete-phase particle deposition model with a one-way coupling approach.
2.4. Geometric Models
The middle 3 filter bag with the highest dust load was selected as the object of study [16], assuming a uniform velocity distribution of the blowing airflow and different particle deposition processes on the four parts of the filter bag to make the simulated ash cleaning process closer to the real situation.
The filter-bag cleaning model was used for numerical calculations, as shown in Figure 1. The parameters were: a tube diameter of 50 mm; the inner diameter of the filter bag of 130 mm; the blowing mouth aperture of 20 mm; the length of the blowing tube of 40 mm; the distance between the blowing tube and the flower plate 75 mm; and the upper end of the filter bag mouth with a 146 mm-long diversion tube, compared with the venturi tube, which does not affect the effective filtration area of the filter bag under the condition of reducing the direct scouring of the upper end of the high-pressure airflow for the filter bag.
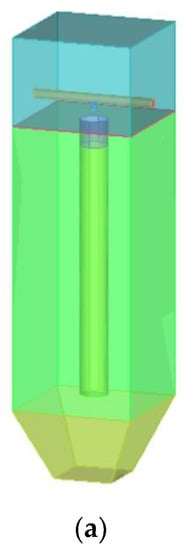
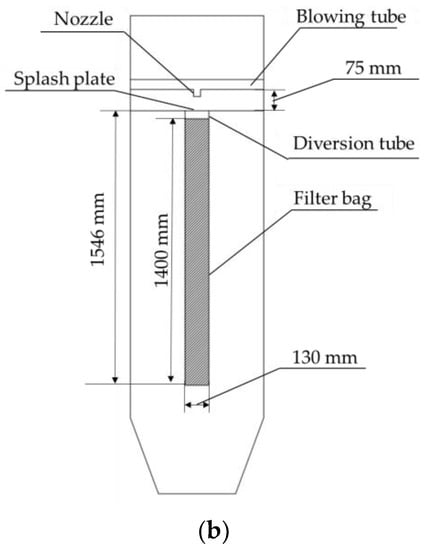
Figure 1.
Dust removal model of dust remover. (a) Three-dimensional geometric model drawing; (b) Schematic diagram of the structure.
2.5. Boundary Conditions
The boundary conditions included three types, as detailed below:
- (1)
- Inlet and outlet boundary conditions: the speed of the gas was less than 68 m/s; the compressibility of the gas could be ignored [17]. Due to the pulse blowing cleaning, its blowing airflow was released from the nozzle within a very short time at a speed greater than 68 m/s, so the gas compressibility could not be ignored. The inlet boundary condition was, therefore, set as a pressure inlet. The outlet boundary conditions were set to pressure outlet boundary conditions.
- (2)
- Wall boundary conditions: the model of the entire box wall, flower plate, the bottom of the filter bag, blowing tube, and nozzle outer wall were set as the wall boundary conditions; each wall was set to no slip.
- (3)
- The boundary conditions of the filter bag: using a porous jump media model, under the different particle deposition distributions, in the simulation of the dust collector pulse cleaning process, the 1400 mm-long filter bag was divided into four parts.
2.6. Validation of Numerical Calculation Models
In this paper, before using the software ANSYS-Fluent 19.2 for flow-field analysis, the model file must be meshed. The meshing includes structured mesh, unstructured mesh, and hybrid mesh. After delineating the mesh, a mesh independence analysis was performed on the feature model, before the formal simulation was performed. Four different numbers of hexahedral structural meshes, with mesh numbers of 2.08 million, 4.02 million, 6.08 million, and 8.16 million, were divided for the model. In this paper, the model uses 6.08 million hexahedral structured meshes to ensure the accuracy and independence of the meshes.
Under experimental conditions [18] with a bag length of 1500 mm, an internal diameter of 127 mm, a blowing pressure of 294 kPa, a blowing distance of 150 mm, and a nozzle internal diameter of 13 mm, comparisons were made to verify the reliability of the numerical calculation model to simulate the dust cleaning system of the dust collector. The peak pressures at four points, 200 mm, 600 mm, 1000 mm, and 1400 mm from the top of the filter bag, were measured. A comparison of the numerical simulations with the pressure peaks obtained from the experimental measurements of Lu et al. [18] can be seen in Figure 2.
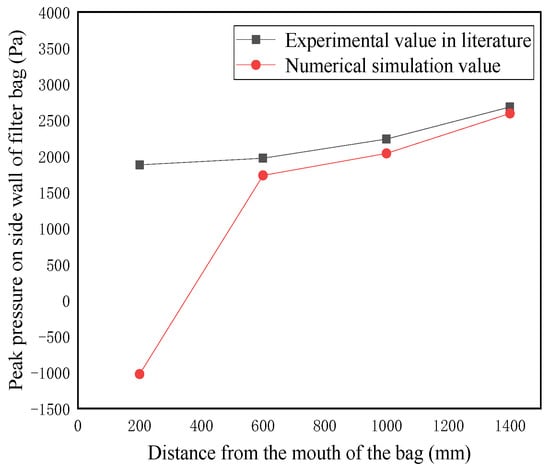
Figure 2.
Comparison of the literature experimental value and numerical simulation value of the side wall pressure peak of the filter bag.
It can be observed from Figure 2 that the numerical simulation values are in general agreement with the literature experimental values. Except for the measurement point 200 mm from the bag opening, the trend is that the further the measurement point is from the bag mouth, the greater the pressure value on the side wall of the filter bag, with the error within 15%. In Lu et al.’s experiments [18], the pressure sensor was the positive pressure sensor, and the negative pressure could not be measured. However, in fact, due to the effect of the venturi, the speed of the gas at the mouth of the filter bag was very large, and high-speed gas induced part of the gas into the bag, and, thus, the pressure at the mouth of the bag was negative. Consequently, the first measurement point of the experimental value did not accurately reflect the true pressure value. Based on the above analysis, the numerical model chosen in this paper can be used to study the dust cleaning performance of the dust collector.
3. Results and Discussion
3.1. Influence of Blowing Pressure on the Effect of Ash Cleaning
The pulsed air inlet was used to feed the air from the inlet of the blowpipe, and the pulse-blowing dust cleaning device was generally sprayed at a pressure between 0.2 and 0.7 MPa [19,20,21]. Therefore, when the pulse width was 60 ms, the flow field of the soot cleaning with blowing pressures of 0.2 MPa, 0.4 MPa, and 0.6 MPa was simulated using the computational fluid dynamics software ANSYS-Fluent 19.2. It can be observed from Figure 3 that, when the blowing pressure increased from 0.2 MPa to 0.6 MPa, the flow rate of the blowing gas also increased. In the same blowing time, with the direction of spraying along the nozzle, the length of airflow diffusion is gradually increased, and the expansion area of the gas in the filter bag also increased. With the blowing pressure of 0.4 Pa and 0.6 Pa, the number of particles deposited in the second section of the filter bag is high, indicating that the airflow is fully expanded.
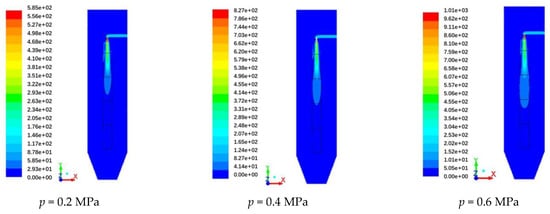
Figure 3.
Cloud chart of velocity distribution under different injection pressures (z = 0 mm, Unit: m/s).
The peak pressure of the side wall of the filter bag under different blowing pressures is shown in Figure 4. To observe the force of the blowing airflow on the entire filter bag, measurements were taken along the height of the bag in the direction of nine evenly spaced points [22,23]: 140, 280, 420, 560, 700, 840, 980, 1120, and 1260 mm. It can be observed from Figure 4 that, as the blowing pressure increased from 0.2 MPa to 0.6 MPa, the pressure peak at the side wall of the filter bag increased.
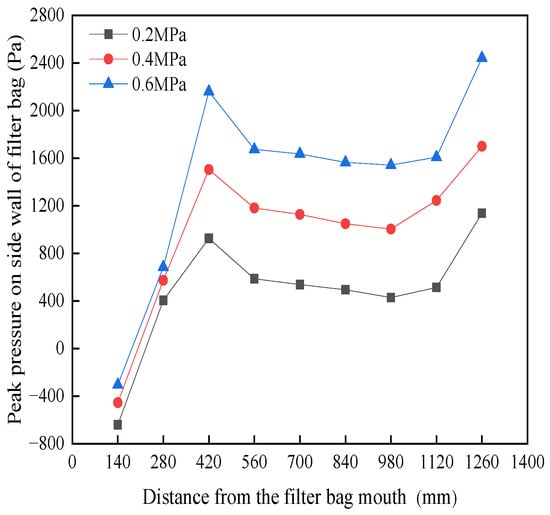
Figure 4.
Peak side wall pressure of filter bag under different injection pressure.
The high-pressure airflow from the nozzle was converted to power by passing through the straight tube at the top of the filter bag to form a low-pressure area, where the pressure was converted to power and a secondary air flow was induced. It can be observed from Figure 4 that, in terms of the overall distribution, the upper (420 mm) and bottom (1260 mm) filter bag side wall pressure was more variable, while the central and lower (560–1120 mm) areas were more uniform, showing a gradual reduction in the trend. This was mainly because, in the process of downward airflow, the induced airflow was first ejected from the induced flow tube and then rapidly expanded; the airflow was obstructed by the filter bag wall and spread outwards, and the side wall was subjected to higher pressure, reaching a peak at the third measurement point, i.e., 420 mm from the filter bag mouth. Then the airflow expanded and overflowed and, with the loss of dynamic pressure, the side wall pressure of the filter bag began to fall. Finally, as the bottom of the metal fiber filter bag closed, a small amount of airflow reached the bottom of the bag, and the velocity instantly dropped to zero. The airflow diffused towards the wall of the filter bag, and the combined effect of the dominant airflow and the airflow diffusing towards the wall of the filter bag led to a larger pressure peak at the lower side of the bag.
The following conclusions can be drawn from the above analysis: the pulse blowing pressure has a certain influence on the dust cleaning effect of the dust collector, and the pressure on the side wall of the filter bag increases with the rise of the pulse blowing pressure, thus improving the dust cleaning effect. However, high-pressure blowing also has a negative impact. Although the increase in blowing pressure improves the cleaning effect, the higher pressure can also scour the filter bag and lead to a shorter life. In actual production applications, taking into account the operating costs of the equipment, the energy consumption of high-pressure blowing is greater. Therefore, the blowing pressure should be reasonably determined according to the amount of dust on the surface of the filter bag.
3.2. Influence of Pulse width on Ash Cleaning Effect
The pulse time of the pulse-blown baghouse in the project is roughly 0.1 s. Under the condition of 0.6 MPa blowing pressure, the flow field in the filter bag was simulated when the pulse width was 0.02 s, 0.04 s, 0.06 s, 0.08 s, and 0.1 s. It can be observed from Figure 5 that the greater the pulse width of the extension, the greater the expansion of the airflow in the filter bag inside the expansion area. Meanwhile, the airflow along the height of the filter bag with direction downward, the diffusion velocity gradually became smaller, while in the upper part of the bag velocity it was larger, and in the lower part of the bag the velocity was relatively small.
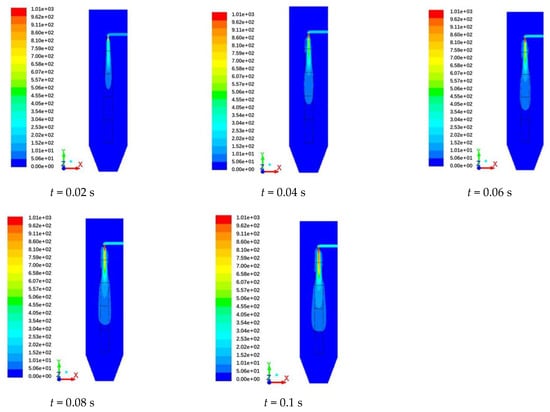
Figure 5.
Cloud chart of velocity distribution under different pulse widths (z = 0 mm, Unit: m/s).
It can be observed from Figure 6 that, when the pulse width of 0.02 s extended to 0.1 s, the pressure peak of the side wall of the filter bag gradually increased. When the blowing time was 0.02 s, the pressure decay was more rapid compared to the other three blowing times, reaching a maximum at 420 mm and then decaying rapidly, while for pulse widths of 0.04 s, 0.06 s, 0.08 s, and 0.1 s, the maximum pressure at 560 mm was followed by a decline. When the pulse blowing was 0.02 s, the lower part of the side wall pressure of the filter bag did not rise; this was because the blowing time was too short, thus the airflow did not reach the bottom of the filter bag. There was a completely diffused expansion overflow, hence the lower end of the filter bag was not conducive to cleaning ash. When the pulse width was 0.04 s, 0.06 s, 0.08 s, and 0.1 s, with a small amount of blowing airflow to the bottom of the closed metal fiber filter bag, the speed dropped to 0, and there was airflow to the bottom of the filter bag wall near the diffusion, and the peak pressure at the side wall of the filter bag at 1260 mm went back up. With the increase in pulse width, the 0.08 s and 0.1 s points of the peak pressure curve of the side wall of the filter bag nearly coincided.
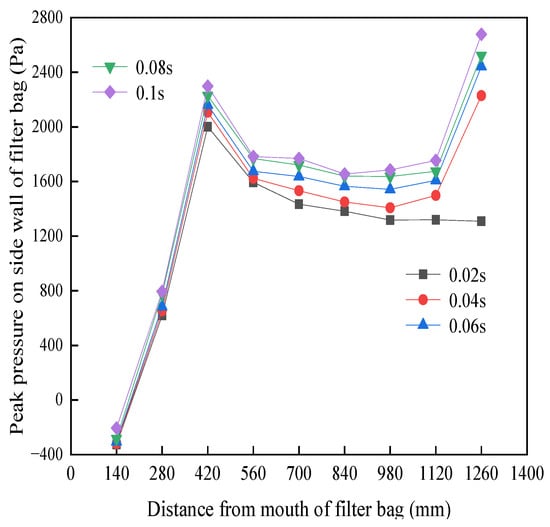
Figure 6.
The peak value of the side wall pressure of the filter bag under different pulse widths.
It can be concluded that the peak pressure on the side wall of the filter bag increases with the increase in the pulse width, but the blowing time within a certain range, according to the length of the filter bag and the dust content of the filter bag surface, must be reasonably determined. When the ideal cleaning effect is achieved and we increase the blowing time, more of the air volume will be consumed, but the cleaning effect is not greatly improved.
3.3. Optimum Operating Parameters for Ash Cleaning
For the dust collector cleaning model based on the discrete phase particle deposition distribution law studied in this paper, the above analysis focuses on the effect of blowing pressure and pulse width on the cleaning effect during the pulse cleaning process. To provide a more comprehensive theoretical reference for large-pulse baghouse dust cleaning systems, the dust cleaning effects of a total of 15 parameter combinations at different blowing pressures (0.2 MPa, 0.4 MPa, and 0.6 MPa) and different pulse widths (0.02 s, 0.04 s, 0.06 s, 0.08 s, and 0.1 s) were investigated separately using numerical simulations, thus obtaining the optimal operating parameters for the structure model.
It can be observed from Figure 7 that the impact of blowing pressure on the peak pressure of the filter bag side wall was more obvious, compared to the pulse width. In the case of the same blowing pressure and a pulse width of 0.02 s, the peak pressure curve of the filter bag side wall pressure trend rapidly rose, followed by a slow decline, while the lower side of the filter bag pressure did not rise, indicating that the 0.02 s blowing time relative to the 1.4 m-long filter bag was too short, the airflow had not yet reached the bottom of the filter bag after the diffusion, and a good cleaning effect could not be achieved for the whole filter bag. When the pulse width reached 0.08 s, at 3 different blowing pressures, increasing the pulse width to 0.1 s at the filter bag side wall pressure peak did not have an obvious effect. This means that, when the pulse width meets the requirements of ash cleaning, it is increased, and the effect of ash cleaning cannot be improved, but the gas volume is consumed, resulting in unnecessary waste. Therefore, a pulse width of 0.08 s can be selected.
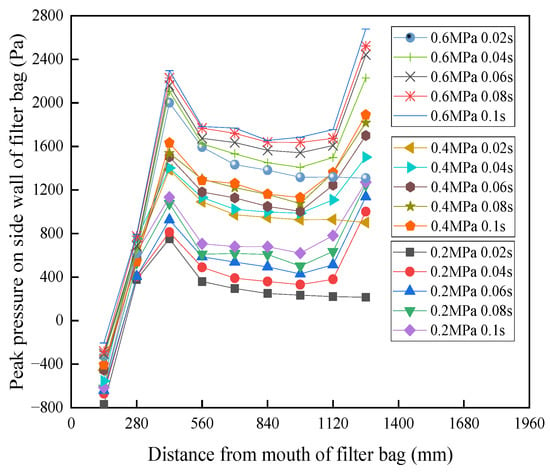
Figure 7.
The peak value of the side wall pressure of the filter bag under different operating parameters.
It can be observed from Figure 7 that, during the downward movement of the airflow, in addition to the formation of a negative pressure area at the mouth of the bag, the pressure on the overall side wall of the filter bag under all 3 blowing pressures is around 300–2500 Pa, proving that the device can effectively clear ash under all 3 blowing pressures. Moreover, as the blowing pressure increases from 0.2 MPa to 0.6 MPa, the peak pressure on the side wall of the filter bag increases, and the dust collector cleaning effect is enhanced, hence a blowing pressure of 0.6 MPa is chosen.
In summary, 0.6 MPa and 0.08 s were selected as the optimum operating parameters for the dust cleaning model with a small dust load on the filter bag surface. With these operating parameters, the best possible cleaning effect can be guaranteed while avoiding excessive cleaning. In practice, the dust cleaning operating parameters should be flexibly adjusted, taking into account the dust adhesion on the surface of the filter bag and the length of the filter bag.
4. Conclusions
Based on the above analysis, our specific conclusions are as follows:
- (1)
- The peak pressure on the side wall of the filter bag increases with the increase in the pulse width, but the blowing time should be determined within a certain range, according to the length of the filter bag and the dust content on the surface of the filter bag.
- (2)
- The effect of blowing pressure on the peak pressure on the side wall of the filter bag is more obvious compared to the pulse width. In actual production, we must choose the dust cleaning operation parameters by considering the dust adhesion on the surface of the filter bag and the length of the filter bag; when the filter bag is longer, the pulse width should also be increased to a certain extent.
- (3)
- When the dust load on the surface of the filter bag is small, 0.6 MPa and 0.08 s are selected as the best operating parameters. These operation parameters guarantee an excellent dust cleaning effect to the maximum extent, while avoiding excessive dust cleaning. At the same time, in actual production, the dust cleaning operation parameters should be flexibly adjusted, taking into account the dust adhesion on the surface of the filter bag and the length of the filter bag, which has a guiding meaning for the regulation of operating parameters.
Author Contributions
Z.X. conducted the research and analyzed the results under the supervision of X.L. and W.L. Z.X. contributed to the design of experiments and morphology analysis during the research activities. All authors have read and agreed to the published version of the manuscript.
Funding
The authors are grateful for the support provided by the National Natural Science Foundation of China, grant number 52075050; Natural Science Foundation of Jiangsu Province, grant number BK20201448; Natural Science Foundation of Jiangsu Province, grant number BK20210854; Jiangsu Province Engineering Research Center of Intelligent Manufacturing Technology for the New Energy Vehicle Power Battery, grant number ERC202204; and Postgraduate Research & Practice Innovation Program of Jiangsu Province, grant number KYCX22_3022.
Institutional Review Board Statement
Not applicable.
Informed Consent Statement
Not applicable.
Data Availability Statement
Not applicable.
Conflicts of Interest
The authors declare no conflict of interest.
References
- Zhang, M.; Qin, W.; Ma, X.; Liu, A.; Yan, C.; Li, P.; Huang, M.; He, C. An Environmentally Friendly Technology of Metal Fiber Bag Filter to Purify Dust-Laden Airflow. Atmosphere 2022, 13, 13030485. [Google Scholar]
- Wang, P.; Cao, Y.; Luo, H.; Li, T.; Yang, B.; Li, H.; Liang, T.; Yu, J.; Wang, L.; Ma, F.; et al. Remarkable enrichment of heavy metals in baghouse filter dust during direct-fired thermal desorption of contaminated soil. J. Hazard. Mater. 2022, 430, 128301. [Google Scholar]
- Lv, Z.Y.; Yu, Y.; Ren, M.; Dang, T.; Wu, S.; Zhou, H.; Gao, L.; Yue, J.; Zhang, H.; Chen, J. Spraying polyacrylamide solution to improve the removal of particle-phase dioxins by bag filter in a full-scale municipal solid waste incineration system. Chemosphere 2021, 285, 131392. [Google Scholar] [CrossRef] [PubMed]
- Liu, X.; Shen, H. Effect of Venturi Structures on the Cleaning Performance of a Pulse Jet Baghouse. Appl. Sci. 2019, 9, 3687. [Google Scholar]
- Thomas, D.; Penicot, P.; Contal, P.; Leclerc, D.; Vendel, J. Clogging of fibrous filters by solid aerosol particles experimental and modelling study. Chem. Eng. Sci. 2001, 56, 3549–3561. [Google Scholar] [CrossRef]
- Jeon, K.J.; Jung, Y.-W. A simulation study on the compression behavior of dust cakes. Powder Technol. 2004, 141, 1–11. [Google Scholar] [CrossRef]
- Simon, X.; Chazelet, S.; Thomas, D.; Bémer, D.; Régnier, R. Experimental study of pulse-jet cleaning of bag filters supported by rigid rings. Powder Technol. 2007, 172, 67–81. [Google Scholar] [CrossRef]
- Wilis Cândido Pereira, T.; Bezerra Marques, F.; Fábio de Assis Ressel, P.; Cunha Ribeiro, D.; Mara Santana Rocha, S. The influence of the fabric filter layout of in a flow mass filtrate. J. Clean. Prod. 2016, 111, 117–124. [Google Scholar] [CrossRef]
- Lo, L.M.; Hu, S.C.; Chen, D.R.; Pui, D.Y. Numerical study of pleated fabric cartridges during pulse-jet cleaning. Powder Technol. 2009, 198, 75–81. [Google Scholar] [CrossRef]
- Rothwell, E. Pulse-driven injectors for fabric dust filters III: Comparative performance of model and commercial assemblies. Filtr. Sep. 1990, 27, 345–349. [Google Scholar] [CrossRef]
- Danyin, Z.; Chun, W. Handbook of Pulsed Baghouse Dust Collectors, 1st ed.; Chemical Industry Press: Beijing, China, 2011; p. 125. [Google Scholar]
- Rongrong, A.; Xuedong, L.; Wenming, L.; Xinyue, D.; Tao, P. Analysis of airflow field uniformity in metal fiber bag dust collector. China Powder Technol. 2020, 26, 22–30. [Google Scholar]
- Yanzhen, Y.; Yuanhui, Y.; Jiangyuan, L.; Liangjun, L. Research on the uniformity of airflow in the internal flow field of baghouse dust collectors. Mach. Manag. Dev. 2013, 5, 45–46. [Google Scholar]
- Ling, P.; Yanzhen, Y. Numerical simulation of the internal flow field of baghouse dust collectors. J. Environ. Eng. 2012, 8, 2750–2754. [Google Scholar]
- Jingxia, Z.; Henggen, S.; Aimin, F.; Jin, L. Numerical simulation analysis of airflow in the blowing tube of baghouse dust collector. Power Environ. Prot. 2008, 3, 30–32. [Google Scholar]
- Rocha, S.; Marques, F.; Pereira, F. Applications of CFD techniques in the design of fabric filters. Chem. Eng. Trans. 2014, 39, 1369–1374. [Google Scholar]
- Zengji, C.; Tianyu, L. Fluid Mechanics Pumps and Fans, 5th ed.; China Construction Industry Press: Beijing, China, 1999; p. 154. [Google Scholar]
- Liu, H.C.; Tsai, C.J. Influence of Design and Operation Parameters on Bag-Cleaning Performance of Pulse-Jet Baghouse. J. Environ. Eng. 1999, 125, 583–891. [Google Scholar]
- Cirqueira, S.S.R.; Tanabe, E.H.; Aguiar, M.L. Experimental investigation of particle deposition in filter media during filtration cycles with regeneration by pulse jet cleaning. Process Saf. Environ. Prot. 2019, 127, 288–298. [Google Scholar] [CrossRef]
- He, C.; Yan, C.; Tang, C.; Huang, M.; Ren, L.; Zhang, M. Nitrogen pulse jet cleaning of the pleated filter cartridge clogged with adhesive hygroscopic dusts. Process Saf. Environ. Prot. 2021, 147, 430–438. [Google Scholar]
- Piao, C.X.; Ha, H.C.; Kim, S.J. Experimental Study on Optimum Pulse Jet Cleaning Conditions of a Cartridge Filter System. J. Korean Soc. Occup. Environ. Hyg. 2015, 25, 542–553. [Google Scholar]
- Chen, L.; Liu, Z.; Sun, Y.; Qian, F.; Han, Y.; Lu, J. Experimental Study on the Dust-Cleaning Performance of New Structure Microporous Membrane Filter Plate. Atmosphere 2022, 13, 817. [Google Scholar]
- Shi, D.; Li, J.; Du, Y.; Wu, Q.; Huang, S.; Huang, H.; Wu, D. Influence of Relative Humidity on the Characteristics of Filter Cake Using Particle Flow Code Simulation. Atmosphere 2022, 13, 770. [Google Scholar]
Disclaimer/Publisher’s Note: The statements, opinions and data contained in all publications are solely those of the individual author(s) and contributor(s) and not of MDPI and/or the editor(s). MDPI and/or the editor(s) disclaim responsibility for any injury to people or property resulting from any ideas, methods, instructions or products referred to in the content. |
© 2023 by the authors. Licensee MDPI, Basel, Switzerland. This article is an open access article distributed under the terms and conditions of the Creative Commons Attribution (CC BY) license (https://creativecommons.org/licenses/by/4.0/).