Article

Insight into Source and Evolution of Oxalic Acid: Characterization of Particulate Organic Diacids in a Mega-City, Shanghai from 2008 to 2020

1
School of Environmental and Chemical Engineering, Shanghai University, Shanghai 200444, China
2
Shanghai Environmental Monitoring Center, Shanghai 200235, China
3
School of Urban Construction and Environmental Engineering, Chongqing University, Chongqing 400044, China
*
Authors to whom correspondence should be addressed.
Atmosphere 2022, 13(9), 1347; https://doi.org/10.3390/atmos13091347
Submission received: 31 July 2022 / Revised: 15 August 2022 / Accepted: 17 August 2022 / Published: 24 August 2022
(This article belongs to the Section Air Quality)

Abstract

:
Organic acids are important aerosol compositions with significant implications on particle formation, growth, acidity, phase state, and environmental impacts. Oxalic acid was found to be the most abundant particulate organic diacid in Shanghai during the study period, accounting for ~58% of the total dicarboxylic acids (C2–C10). Biomass burning (BB) explained a small but non-negligible fraction (less than 10%) of oxalate. Significant correlations between oxalate and sulfate indicated a potentially synergistic formation mechanism of oxalate and sulfate. In addition, meteorological factors such as ambient temperature and relative humidity were found to influence the formation of oxalate. Higher oxalate relative to inorganic particulate content was found in summer. Potential source contribution function analysis suggested that most of the oxalate observed in Shanghai was produced locally. The formation of oxalate was largely impacted by atmospheric oxidation capacity as indicated by its significant correlations with both secondary organic carbon (SOC) and sulfur oxidation ratio (SOR). The evolution of oxalate, oxalate/sulfate, oxalate/organic carbon were consistent with the emission trend of volatile organic carbons (VOCs) in recent years, indicating that oxalate may be derived from secondary oxidation of VOCs, which is further confirmed by a positive relationship between Ox and oxalate/VOCs over the study period. With a detailed characterization of oxalate in Shanghai, our study highlights the importance of regulating primary emissions, such as VOCs, as well as mitigation of atmospheric oxidation capacity in controlling air pollution in a coastal megacity.

1. Introduction

Organic aerosol constitutes an important part of PM2.5, of which 40–80% are water-soluble compounds [1,2]. Due to their high water solubility, dicarboxylic acids (DCAs) are considered to be important components of water-soluble organic aerosol [3,4], which can act as cloud condensation nuclei (CCN) and thus are of great importance in the global climate system [5,6]. Among chemically identified water-soluble organics in atmospheric particles, oxalate is one of the most abundant species [7,8]. For example, Miyazaki et al. [4] reported that oxalate in New Delhi accounted for 5–10% of the total water-soluble organics (WSOC) in TSP (total suspended particulate). In addition, Feng et al. [7] showed that the contribution of oxalate to WSOC can reach up to 5% in a few PM2.5 episodes observed at a sea island downwind of the Asian continent. Oxalic acid accounted for 2.9% (summer) and 1.7% (winter) of WSOC in PM2.5 collected in Shenzhen, China [9]. Raman et al. [10] reported that among the water-soluble short-chain organic acids, oxalic acid was the most abundant in Potsdam and Stockton, NY, US. Sempere et al. [11,12] found that oxalic acid is the dominant dicarboxylic acid (50–70%) in Tokyo, Japan and western Pacific Ocean.
As major constituents of atmospheric aerosol, organic acids can originate either from primary processes such as biomass burning (BB) and fuel combustion (traffic emission) or secondary formation processes [13,14,15,16]. Yang et al. [17,18] reported that BB had a significant contribution to particulate oxalate in Shanghai. Ren et al. [19] argued that secondary aerosols (both from anthropogenic and biogenic sources) and BB emissions were the most important sources of carboxylic acids in Shanghai. Thepnuan et al. [20] collected samples in Chiang Mai Province, Thailand and found that the concentration of oxalate was strongly correlated to that of PM2.5 and levoglucosan, indicating that oxalate originates mainly from BB. By performing PMF analysis, Huang et al. [9] demonstrated that in-cloud processing was the most important source for oxalate. Zhou et al. [21] used PMF to analyze the sources of oxalate in Hong Kong and estimated that secondary formation processes, including secondary gas or aqueous oxidation processes (49%), oxidation processes of biomass burning emissions (37%), were the main sources of the particulate oxalate. Alternatively, Yu et al. [22] argued that oxalate was an ideal secondary model compound for further molecular level mechanistic studies in cloud/fog. Many factors can impact the secondary formation pathways of oxalate. Gong et al. [23] found that the mixing state of metals and oxalate are of great significance for studying the evolution of aerosols in the North China Plain. Zhang et al. [24] also reported that gas-particle partitioning of oxalic acid influenced by the dissolution of iron (Fe) might also contribute to the particulate oxalate content. Meng et al. [25] suggested that relative humidity (RH) and aerosol liquid water content (ALWC) played a key role in the formation of oxalic acid in particles. Tao et al. [26] found that higher aerosol pH favors oxalate partitioning into the particle phase. Studying the hygroscopic behavior of oxalic acid and atmospherically relevant oxalates (H2C2O4, (NH4)2C2O4, CaC2O4 and FeC2O4), Ma et al. [27] showed that hydrated particles can provide a stable condition for oxalic acid and oxalates. So far, systematic investigations on oxalate formation and impact factors in different regions are still incomplete.
In this study, we collected PM2.5 samples from two urban sites (Baoshan and Pudong) in Shanghai from 2008 to 2020. As the most abundant dicarboxylic acid observed in Shanghai, yearly and seasonal evolution of oxalate were analyzed with other pollutants such as ions, SO2, OC, and EC monitored. Potential impacts from primary source such as BB and secondary process on oxalate formation were discussed. Influences from factors such as atmospheric oxidation capacity, relative humidity (RH), and regional transportation on the evolution of oxalate were also investigated. Overall, our study provides a detailed characterization of oxalate in recent decades in a coastal mega-city, Shanghai, which would provide greater insight into aerosol evolution, PM composition and environmental impacts.

2. Experimental

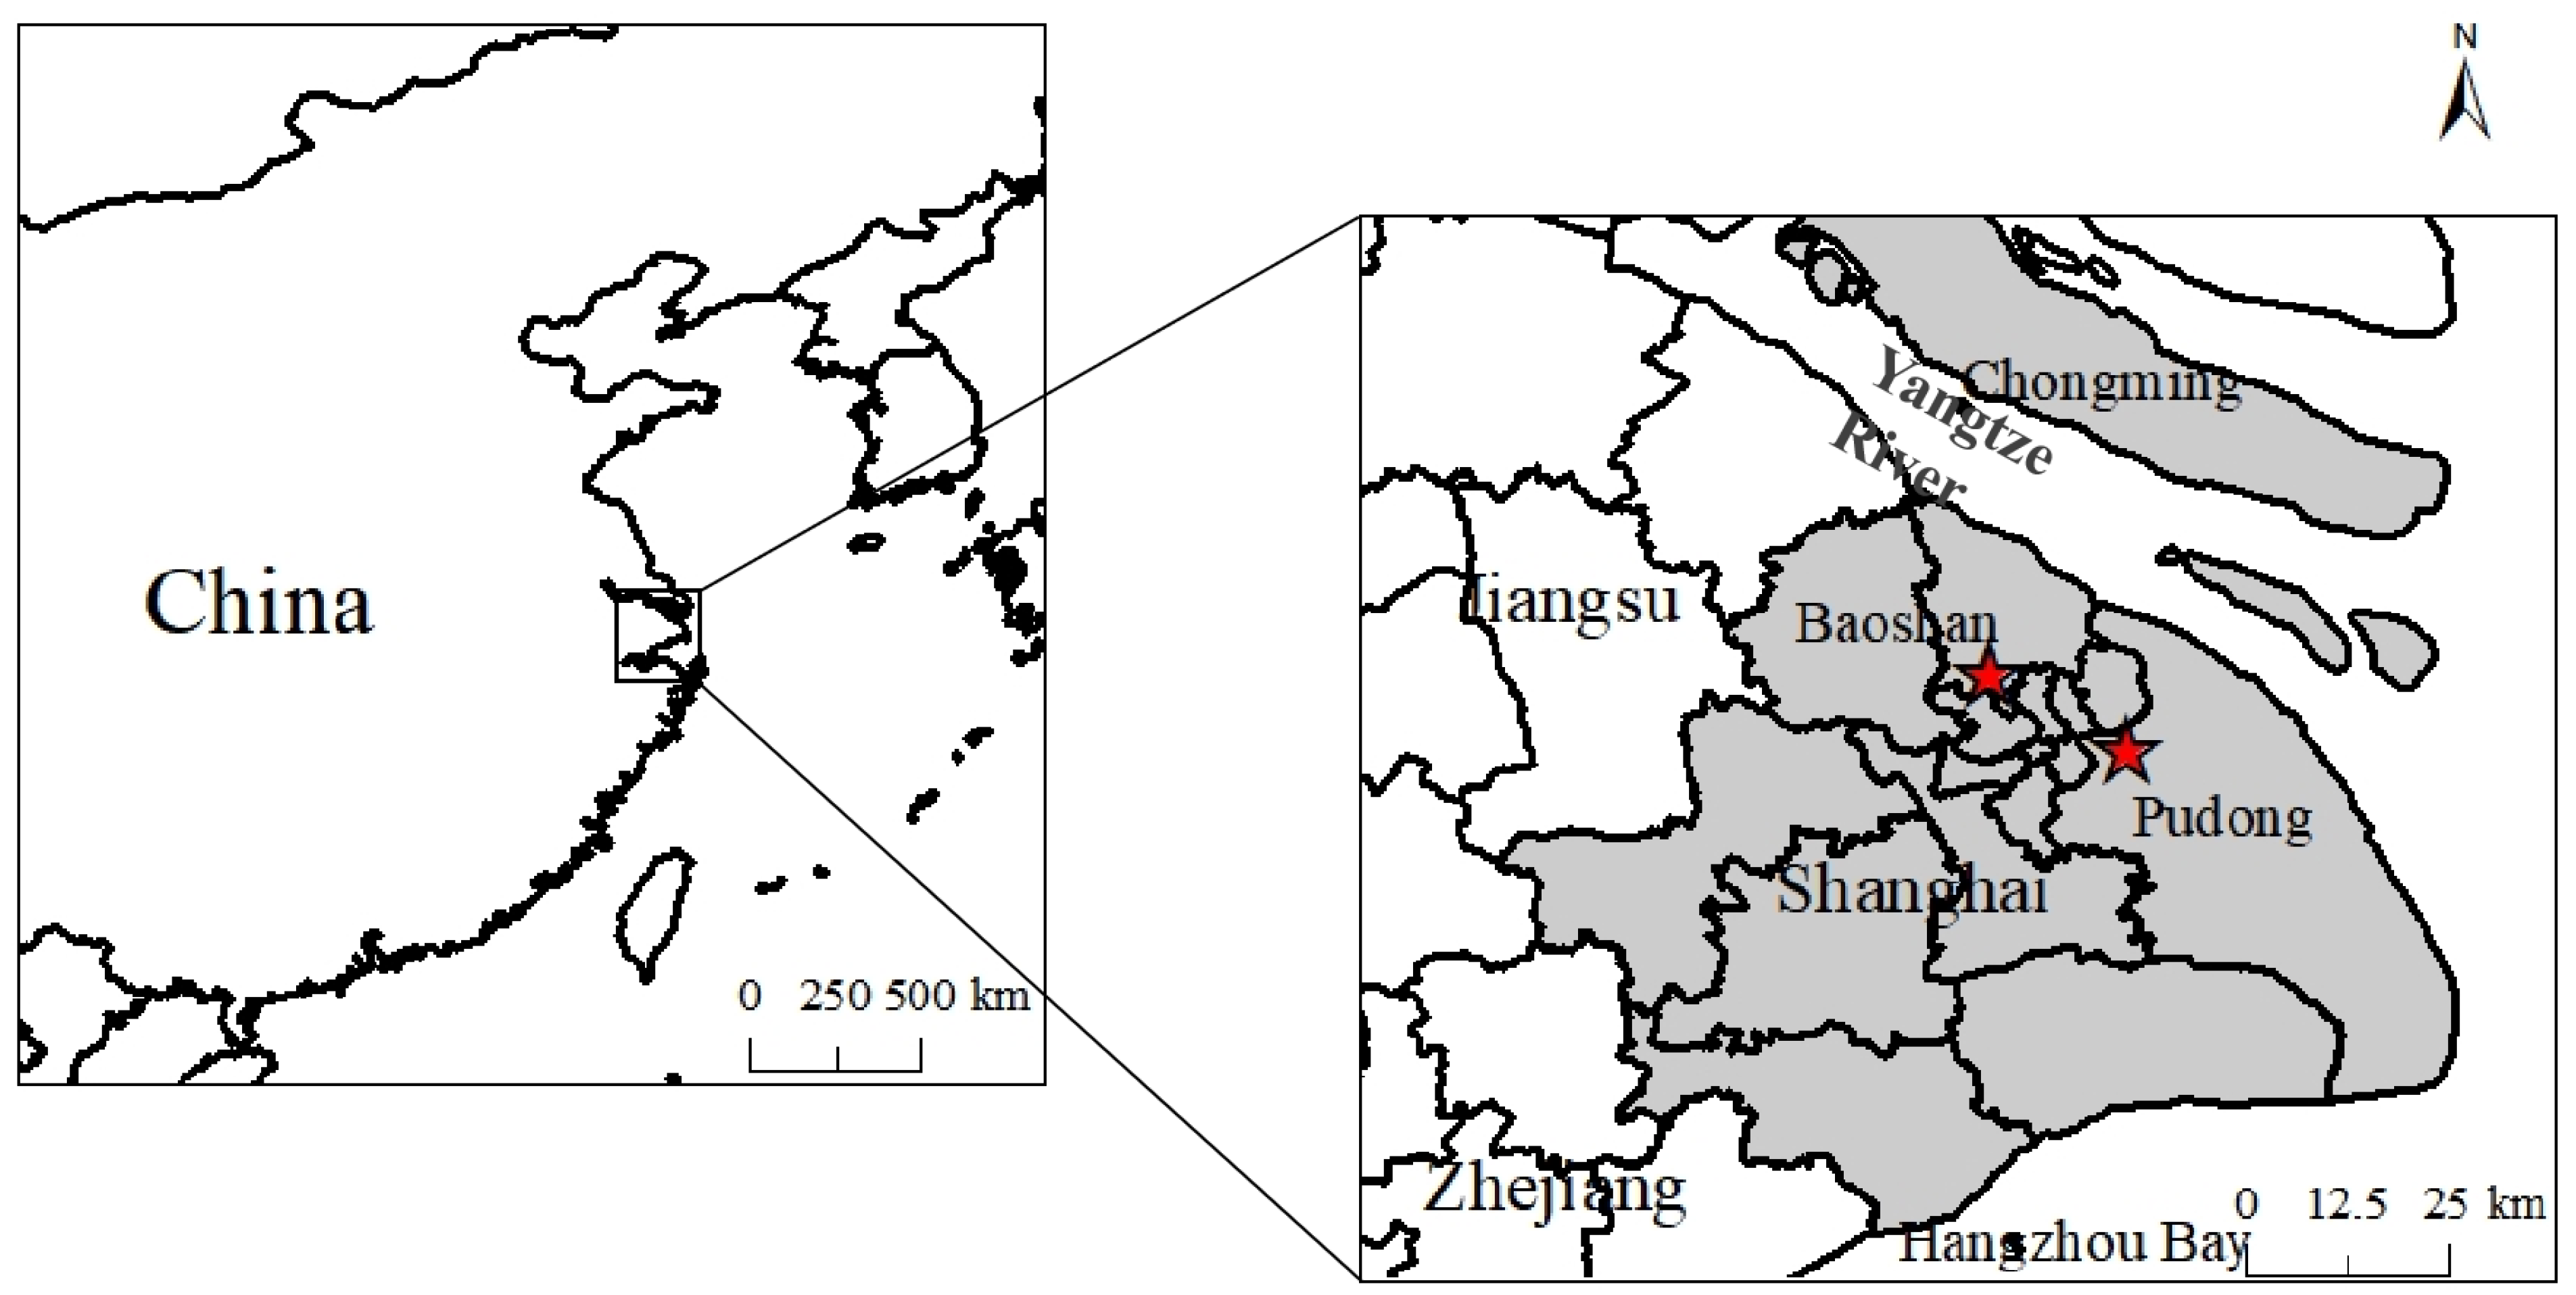
2.1. Sites and Sampling

As shown in Figure 1, this study involves monitoring data from two sites in Shanghai, namely Baoshan (BS) and Pudong (PD) sites. From 2008–2014, PM2.5 samples in Baoshan were collected on the rooftop of a lecture building at Shanghai University (121.394° E, 31.314° N), which is roughly 20 m above the ground and surrounded by traffic flows in the east and north direction, representing a typical suburban area under industrial impact. From 2016 to 2020, PM2.5 samples at the PD site were collected at the local Environmental Monitoring Station (121.545° E, 31.233° N), which is also 20 m above the ground, surrounded by residential and commercial areas, representing a densely populated area in Shanghai.
In total, 697 PM2.5 samples (2008: 131; 2010: 67; 2013: 53; 2014: 56; 2016: 58; 2017: 62; 2018: 64; 2019: 85; 2020: 121) were collected in Shanghai over four seasons. A high-volume PM2.5 sampler (Thermo-Andersen, Waltham, MA, USA, 1.13 m3 min−1) was used for sample collection with quartz fiber filters (20.0 × 25.4 cm, Whatman, Maidstone, UK). Prior to sampling, all the blank filters were baked in a muffle furnace for at least 4 h at 450 °C in order to remove the organic pollutants. The mass of PM2.5 on each filter was measured by weighing (20 °C, 45% relative humidity) the mass difference before and after sampling.

2.2. Chemical Analysis

2.2.1. Comparison of Extraction Methods for Diacids

Punches of the filter samples were ultrasonically extracted using 15 mL methanol/Milli-Q water (1:1 v/v) or Milli-Q water and repeated 3 times. The extracts were concentrated using a rotary evaporator, filtrated and blown dry with ultrapure nitrogen. The concentrates were then reacted with 100 μL of 14% BF3/n-butanol at 100 °C for 1 h. After being cooled to room temperature, pure water was added to quench the reaction, n-hexane was used to extract the organic phase from the aqueous phase with a separatory funnel and this was repeated three times. Residual water in the organic phase was removed with anhydrous sodium sulfate, and hexamethylbenzene was later added as internal standard for GC/MS analysis.
GC-MS analysis was conducted with an Agilent 6890 GC/5975 MSD. The GC was equipped with a DB-5MS capillary column (30 m × 0.25 mm × 0.25 μm film thickness, J&W Scientific). High-purity helium was used as carrier gas at a flow rate of 1.0 mL min−1. The MS was operated under EI mode at 70 eV with a scanning range of 50–550 amu, and the ion source temperature was 230 °C. The oven temperature program of the GC and the quantitative method of the target tracers have been described in our previous work, Feng et al. [28].
In previous work, water was ubiquitously used in the extraction process for the GC-MS analysis of organic acids [29,30]. Meanwhile, large molecule dicarboxylic acids (DCAs) are less hydrophilic, posing difficulties for achieving high extraction efficiency when using water. In this study, we compared the extraction efficiency of the two extraction methods (water vs. 1:1 methanol/water) prior to the GC-MS analysis of DCAs.
Figure S1 demonstrates that the two extraction methods had negligible differences in analyzing low carbon number DCAs (carbon number ≤ 5). However, the extraction method starts to play an increasingly important role in the GC-MS results as the carbon number increases. As indicated in Figure S2, when the carbon number of the DCAs increases (carbon number ≥ 6), the extraction efficiency of pure water tended to be significantly lower than the methanol/water (1:1 v/v) solvent, and the discrepancy increased with the increasing carbon number. As a result, we adopted methanol/water as the extraction solvent for all DCAs sample preparation in the present study.

2.2.2. OCEC, WSOC and Ion Determination

Additionally, organic carbon (OC) and elemental carbon (EC) were measured with a thermal/optical carbon analyzer (DRI-2001A) via the TOT (Thermal/Optical Transmission) method and IMPROVE temperature program [31].
A 6 cm2 sample filter was accurately punched and ultrasonically extracted with 20 mL Milli-Q water for 30 min under ice water bath. The extracts were filtered using syringe filters with 0.45 μm PTFE membrane to remove insoluble particles. The filtrate was divided into two aliquots for the analysis of WSOC and ions, respectively. The measurement was conducted on a dual-channel Metrohm ion chromatograph (Metrohm IC, Switzerland). A Metrosep A SUPP5-25 column (length 250 mm, inner diameter 4 mm and particle size 5 μm) was used to separate the anions (Cl, NO3, SO42, C2O42), and a Metrosep C2-250 column (length 250 mm, inner diameter 4 mm and particle size 7 μm) for the cations (Na+, NH4+, K+, Ca2+, Mg2+). A mixed solution of 3.2 mmol L1 Na2CO3 and 1.0 mmol L1 NaHCO3 was used as the anionic eluent, and a mixed solution of 4 mmol L1 tartaric acid and 0.75 mmol L1 pyridine dicarboxylic acid for cations. Replicates were made every 10 samples and the measurement precision was calculated to be less than 5%. The limit of detection (LOD) of each ion was calculated as 3 times the standard deviation of measuring a 0.5 ppm standard sample. The LOD values for the major ions were found to be within the order of 10 ppb. The concentration of WSOC was quantified using a TOC analyzer (TOC-LCSH, Shimadzu, Kawaguchi, Japan). The LOD of WSOC was about 0.2 μg m−3.

2.2.3. Air Mass Back Trajectories and PSCF Analysis

The 48 h back-trajectories were calculated using the Hybrid Single Particle Lagrangian Integrated Trajectory Model (HYSPLIT) provided by NOAA https://www.ready.noaa.gov/HYSPLIT.php (accessed on 29 June 2022) and Global Data Assimilation System (GDAS) meteorological data from the NOAA Air Resources Laboratory’s web server. Three-dimensional (latitude, longitude and height) back-trajectories of our samples were computed every 6 h; 1460 trajectories were obtained for clustering analysis of back-trajectories. The height of trajectories was set to 500 m.
Potential source contribution function (PSCF) is a method based on the HYSPLIT model to identify regional pollution sources. In this study, the PSCF calculation space range was 110° E, 20° N and 130° E, 40° N. Gridding was performed with a resolution of 0.25° × 0.25°. The main contaminant was oxalate with threshold set at 0.5 μg m−3.

3. Results and Discussion

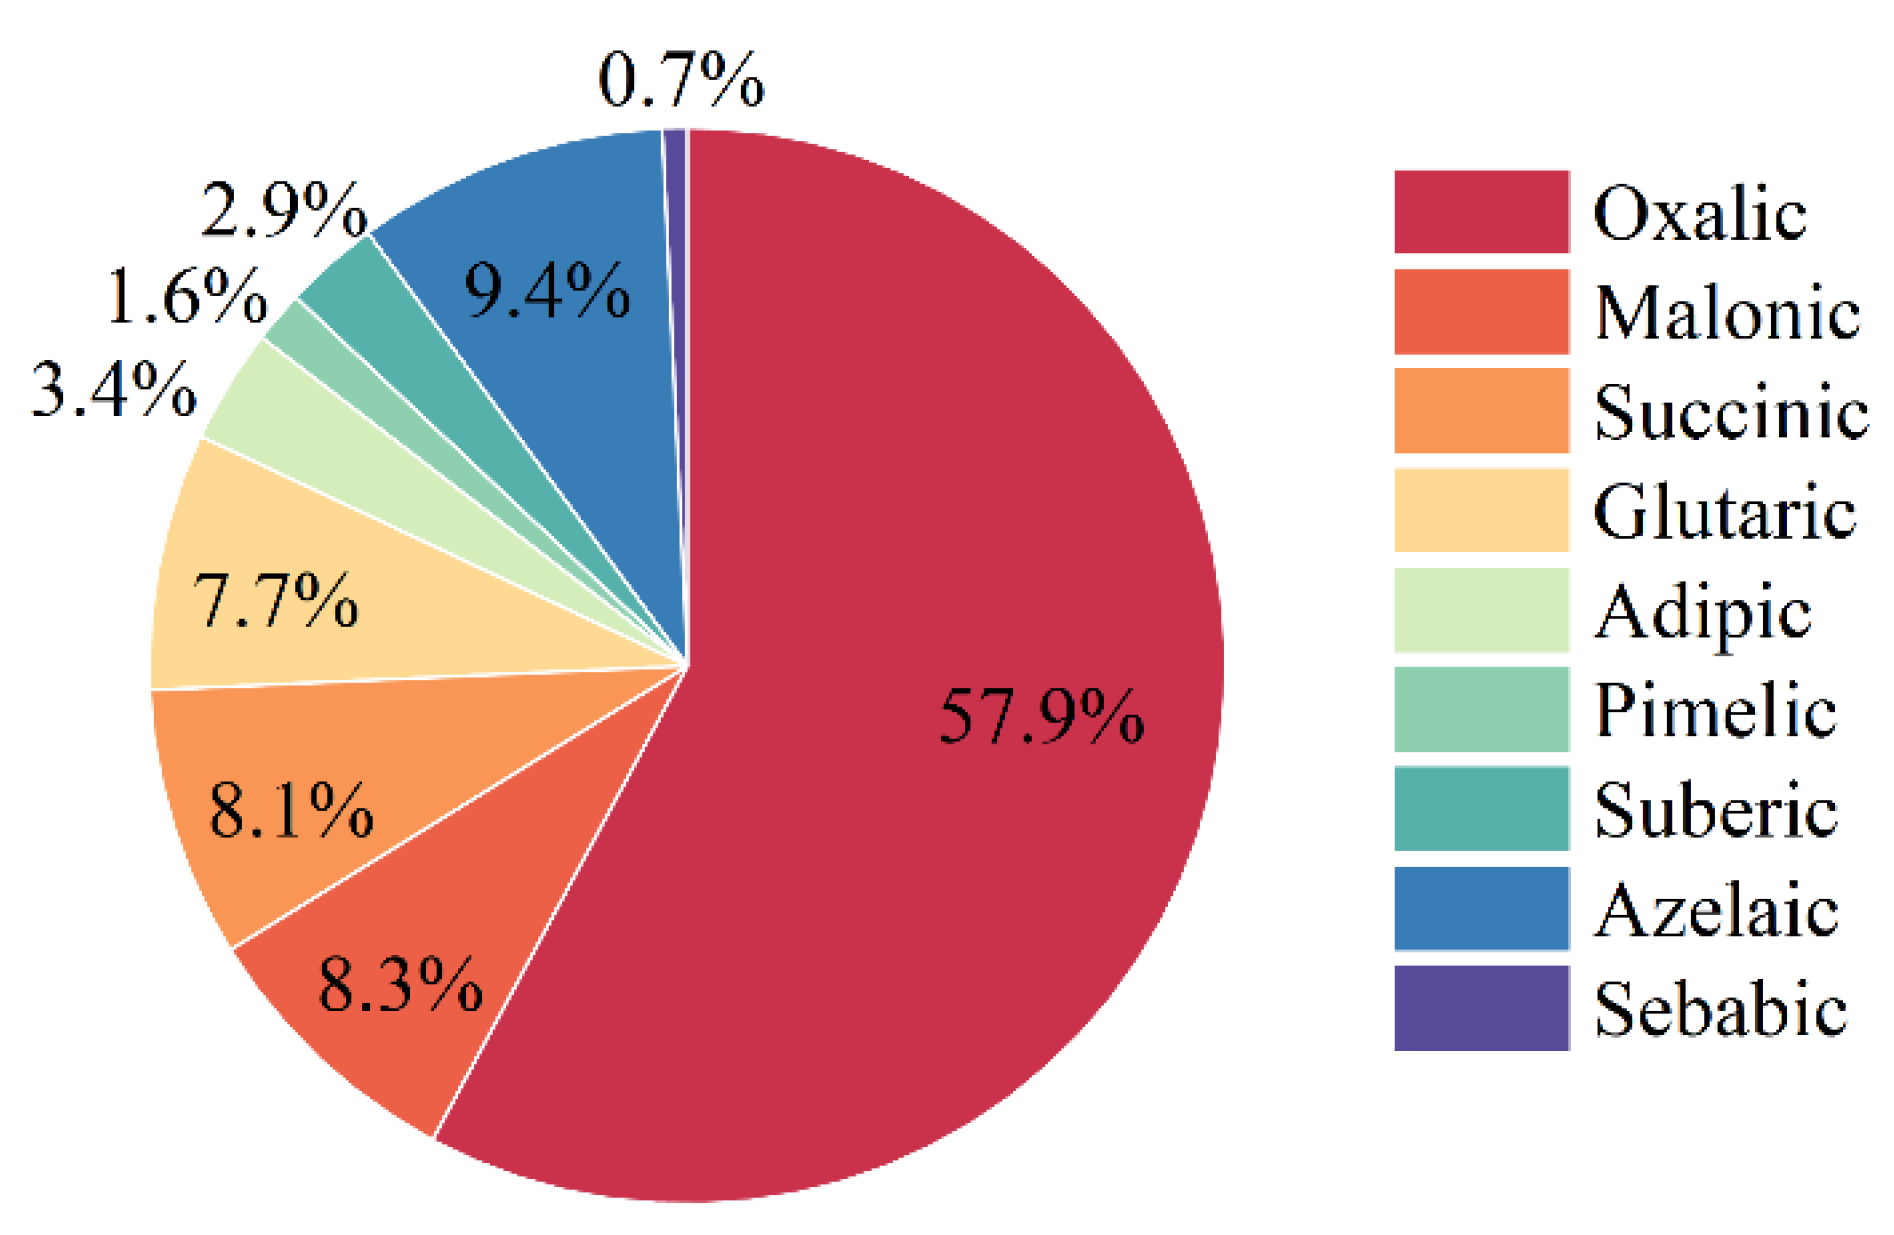
3.1. Characterization of DCA in Shanghai

As shown in Figure 2, oxalic acid was found to be the most abundant dicarboxylic acid in PM2.5 in Shanghai, followed by azelaic acid, malonic acid and succinic acid, which is consistent with other studies. When analyzing aerosol composition in Tokyo, Kawamura et al. found oxalic acid contributed 52% of the total DCAs in PM2.5 [32]. Oxalic acid is also the most abundant DCA in marine aerosol [29]. As the simplest organic diacid, oxalic acid has been regarded as the terminal product from the reaction chain between VOCs and atmospheric oxidants [33]. In this study, oxalate was consistently observed to be the most dominant (55%–60%) DCA (Figure S3) in different seasons, with 58%, 57%, 59% and 58% in spring, summer, autumn and winter, respectively, indicating that the source of oxalate in Shanghai is relatively stable across different seasons. Meanwhile, the concentration and contribution of malonic acid in PM2.5 in Shanghai was obviously higher in summer than in other seasons (Figure S3). The seasonal C3/C4 ratio (0.91, 1.96, 0.95, and 0.71 for spring, summer, autumn, and winter, respectively) showed a distinct seasonal trend of higher in summer and lower in winter. It was found that the ratio of C3/C4 can be used as an indicator for photochemical aging of aerosol in the atmosphere [33], so the seasonal distribution of the C3/C4 ratio in Shanghai indicated a more significant extent of atmospheric photochemical aging in summer compared to the other three seasons.

3.2. Sources of Oxalate

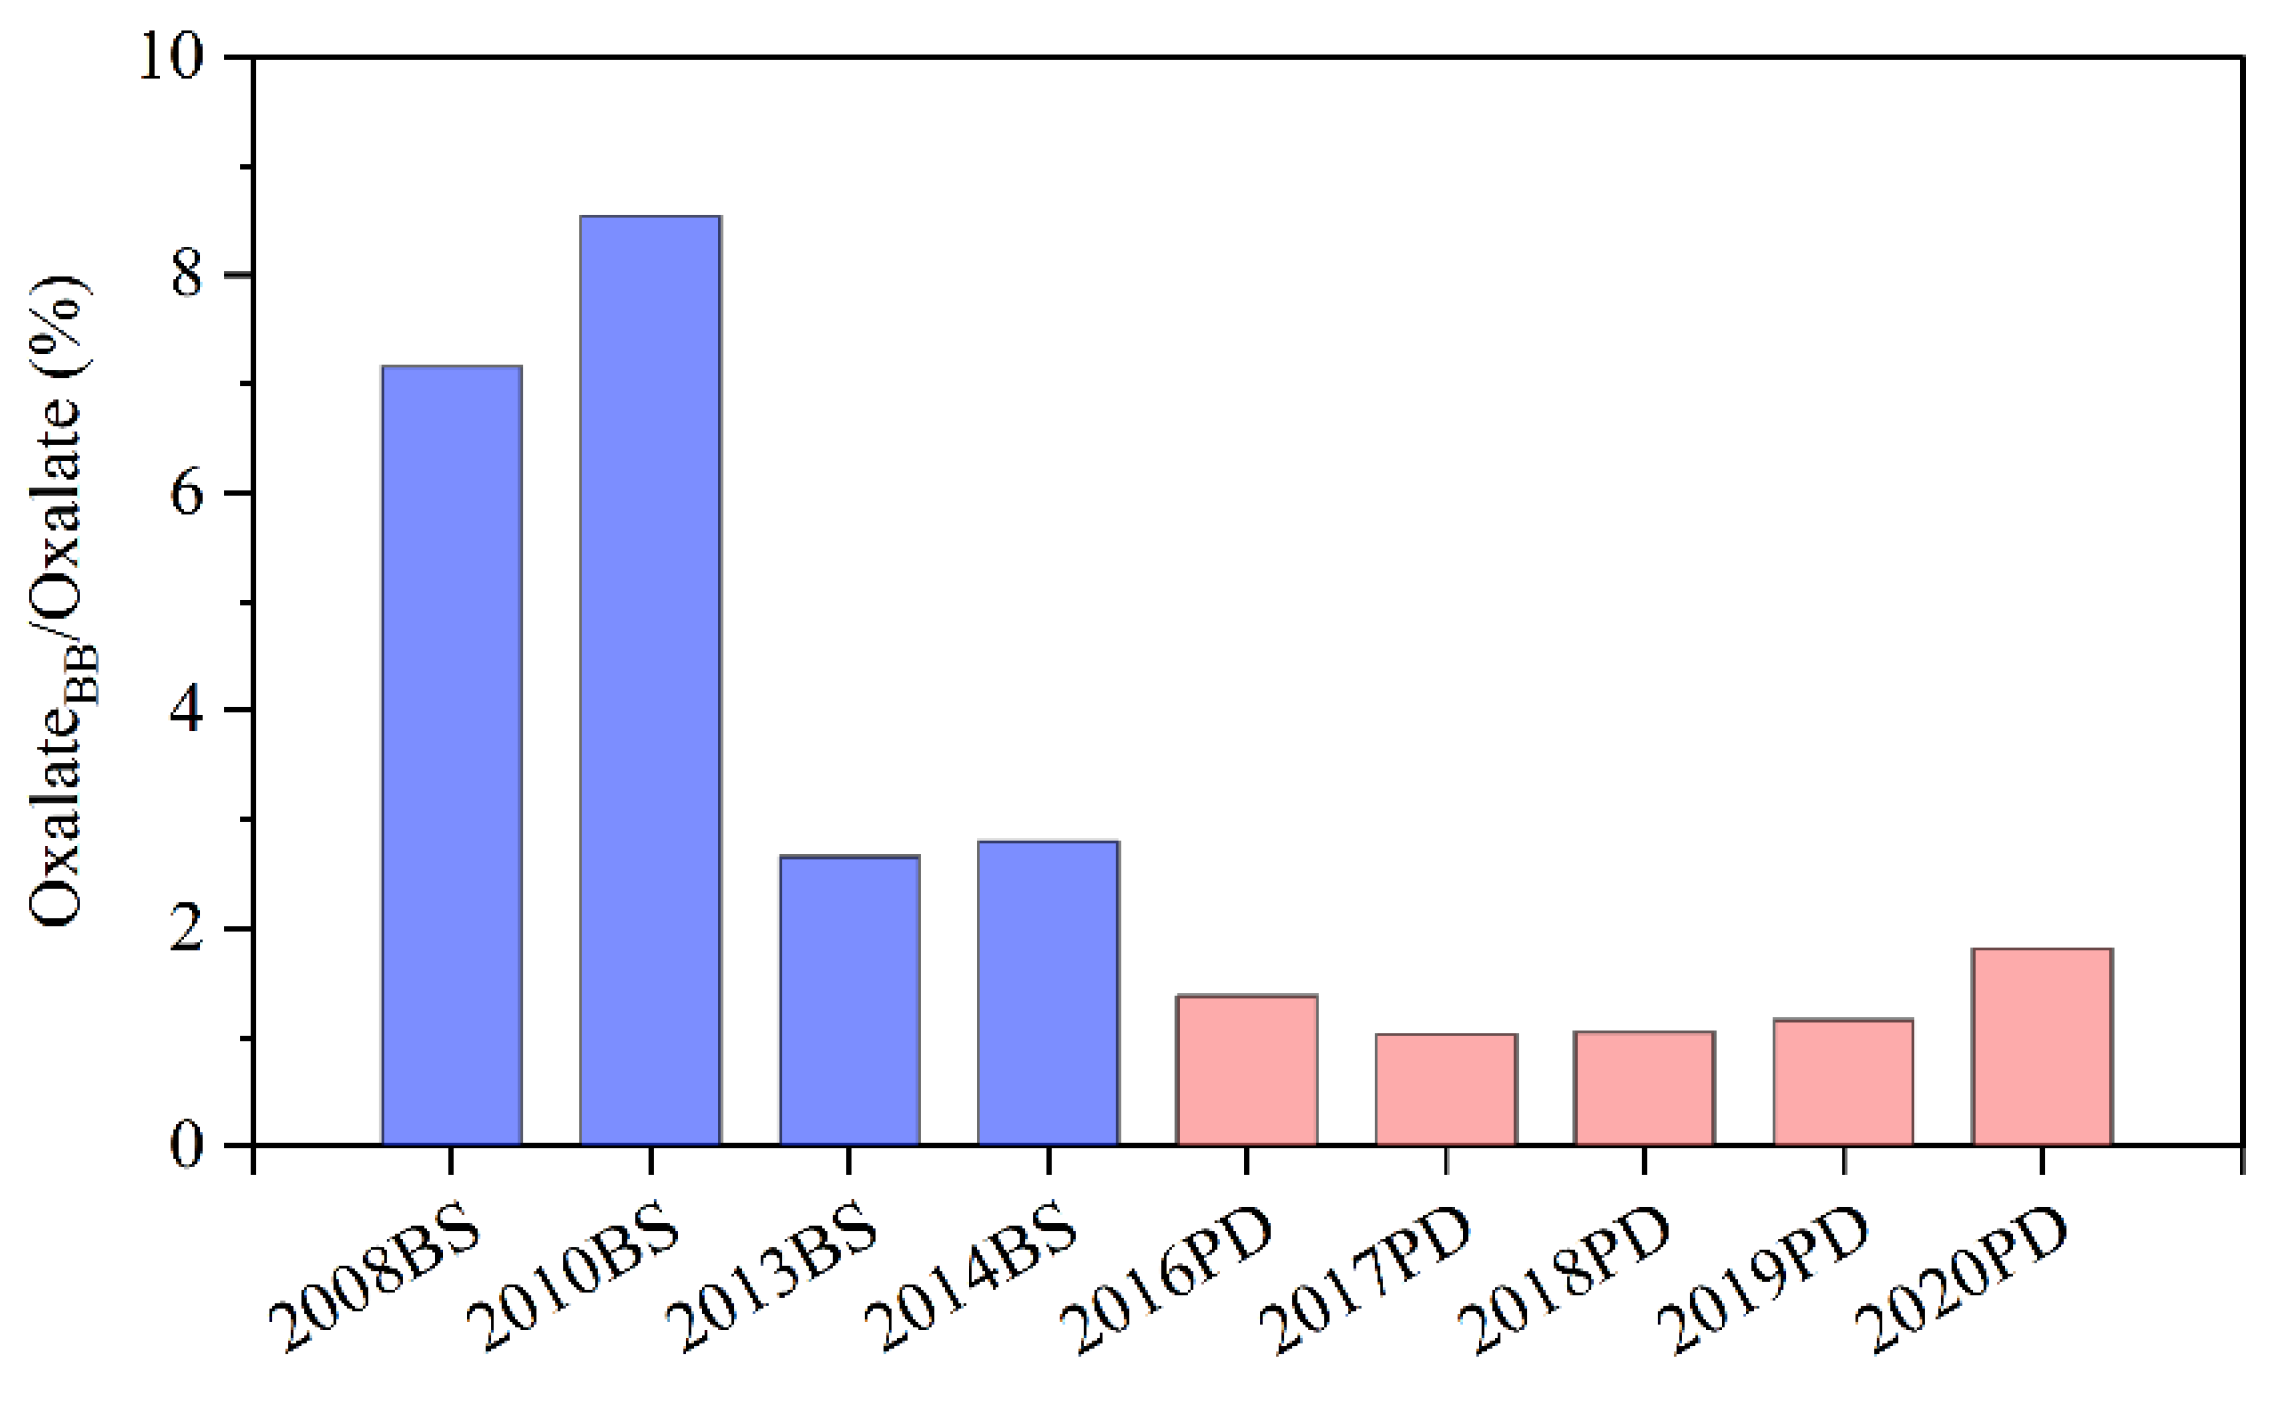
3.2.1. Estimation of Oxalate from BB

BB has been regarded as one of the major primary sources of oxalate in many studies [17,18]. In this work, weak correlations can be observed (Figures S4 and S5) between oxalate and the typical BB tracer, K+, indicating that there could be impacts from BB events [20]. Thus, we estimated the potential contribution from BB to the oxalate in Shanghai. The oxalate concentration from BB can be estimated using following equations:
[Oxalate]BB = [K+]BB × R
[K+]BB = [K+]measured − [K+]seasalt − [K+]crustal
[K+]crustal = 0.13 × [Ca2+]crustal
[Ca2+]crustal = [Ca2+]measured − [Ca2+]seasalt − 0.15 × [K+]BB
where [K+]BB is the concentration of K+ from BB, and R is the [Oxalate]/[K+] ratio in BB aerosol [7]. [K+]measured is the measured concentrations of K+ and [Ca2+]measured is the measured concentrations of Ca2+ in PM2.5. [K+]seasalt and [Ca2+]seasalt refer to concentrations from sea salt and estimated as 0.037 × [Na+]measured and 0.038 × [Na+]measured. [K+]crustal/[Ca2+]crustal ratio was taken as 0.13, and a [Ca2+]BB/[K+]BB ratio of 0.15 was estimated based on previous literature values as summarized in Table S1. More details for the estimation of [Oxalate]BB can be found in previous literature [34].
The BB contribution to oxalate (Figure S6) was estimated to range from 0 to 30%, and 0–5% for BS (2008–2014) and PD (2016–2020), respectively. The annual average contribution of BB to oxalate in PM2.5 in Shanghai exhibited a decreasing trend from 2008 to 2020 (Figure 3), and BB was found to play a minor role (less than 10%) in particulate oxalate in Shanghai. Temporal variation of the BB contribution to oxalate (Figure S6) was found to be conspicuously higher in winter, for which the transported pollutants from the inland areas should be an important factor based on the seasonal back trajectory of air parcels arriving in Shanghai (Figure S7). The limited contribution of BB since 2017 (less than 2%) was in agreement with the prohibition of open BB in China [35].

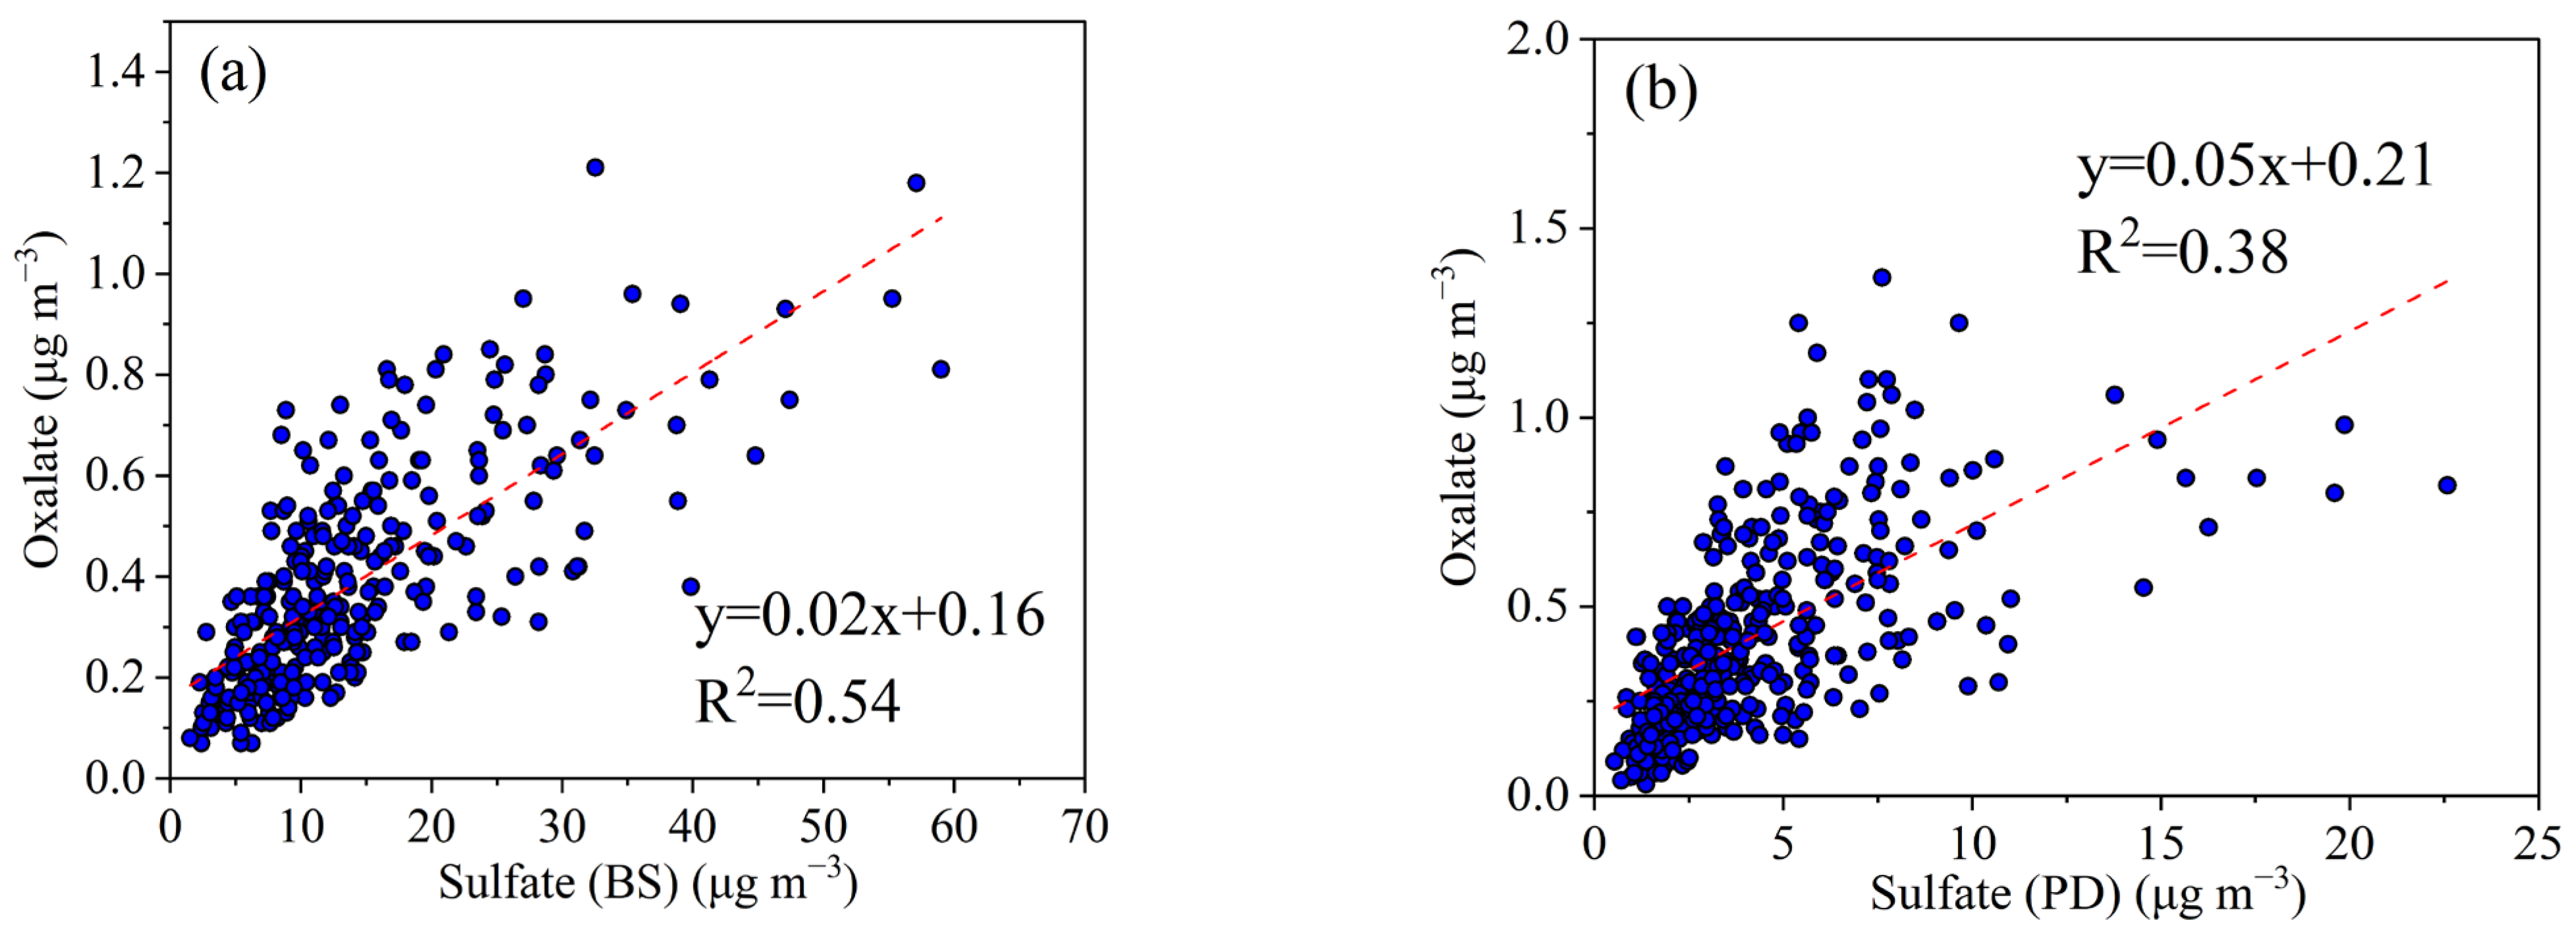
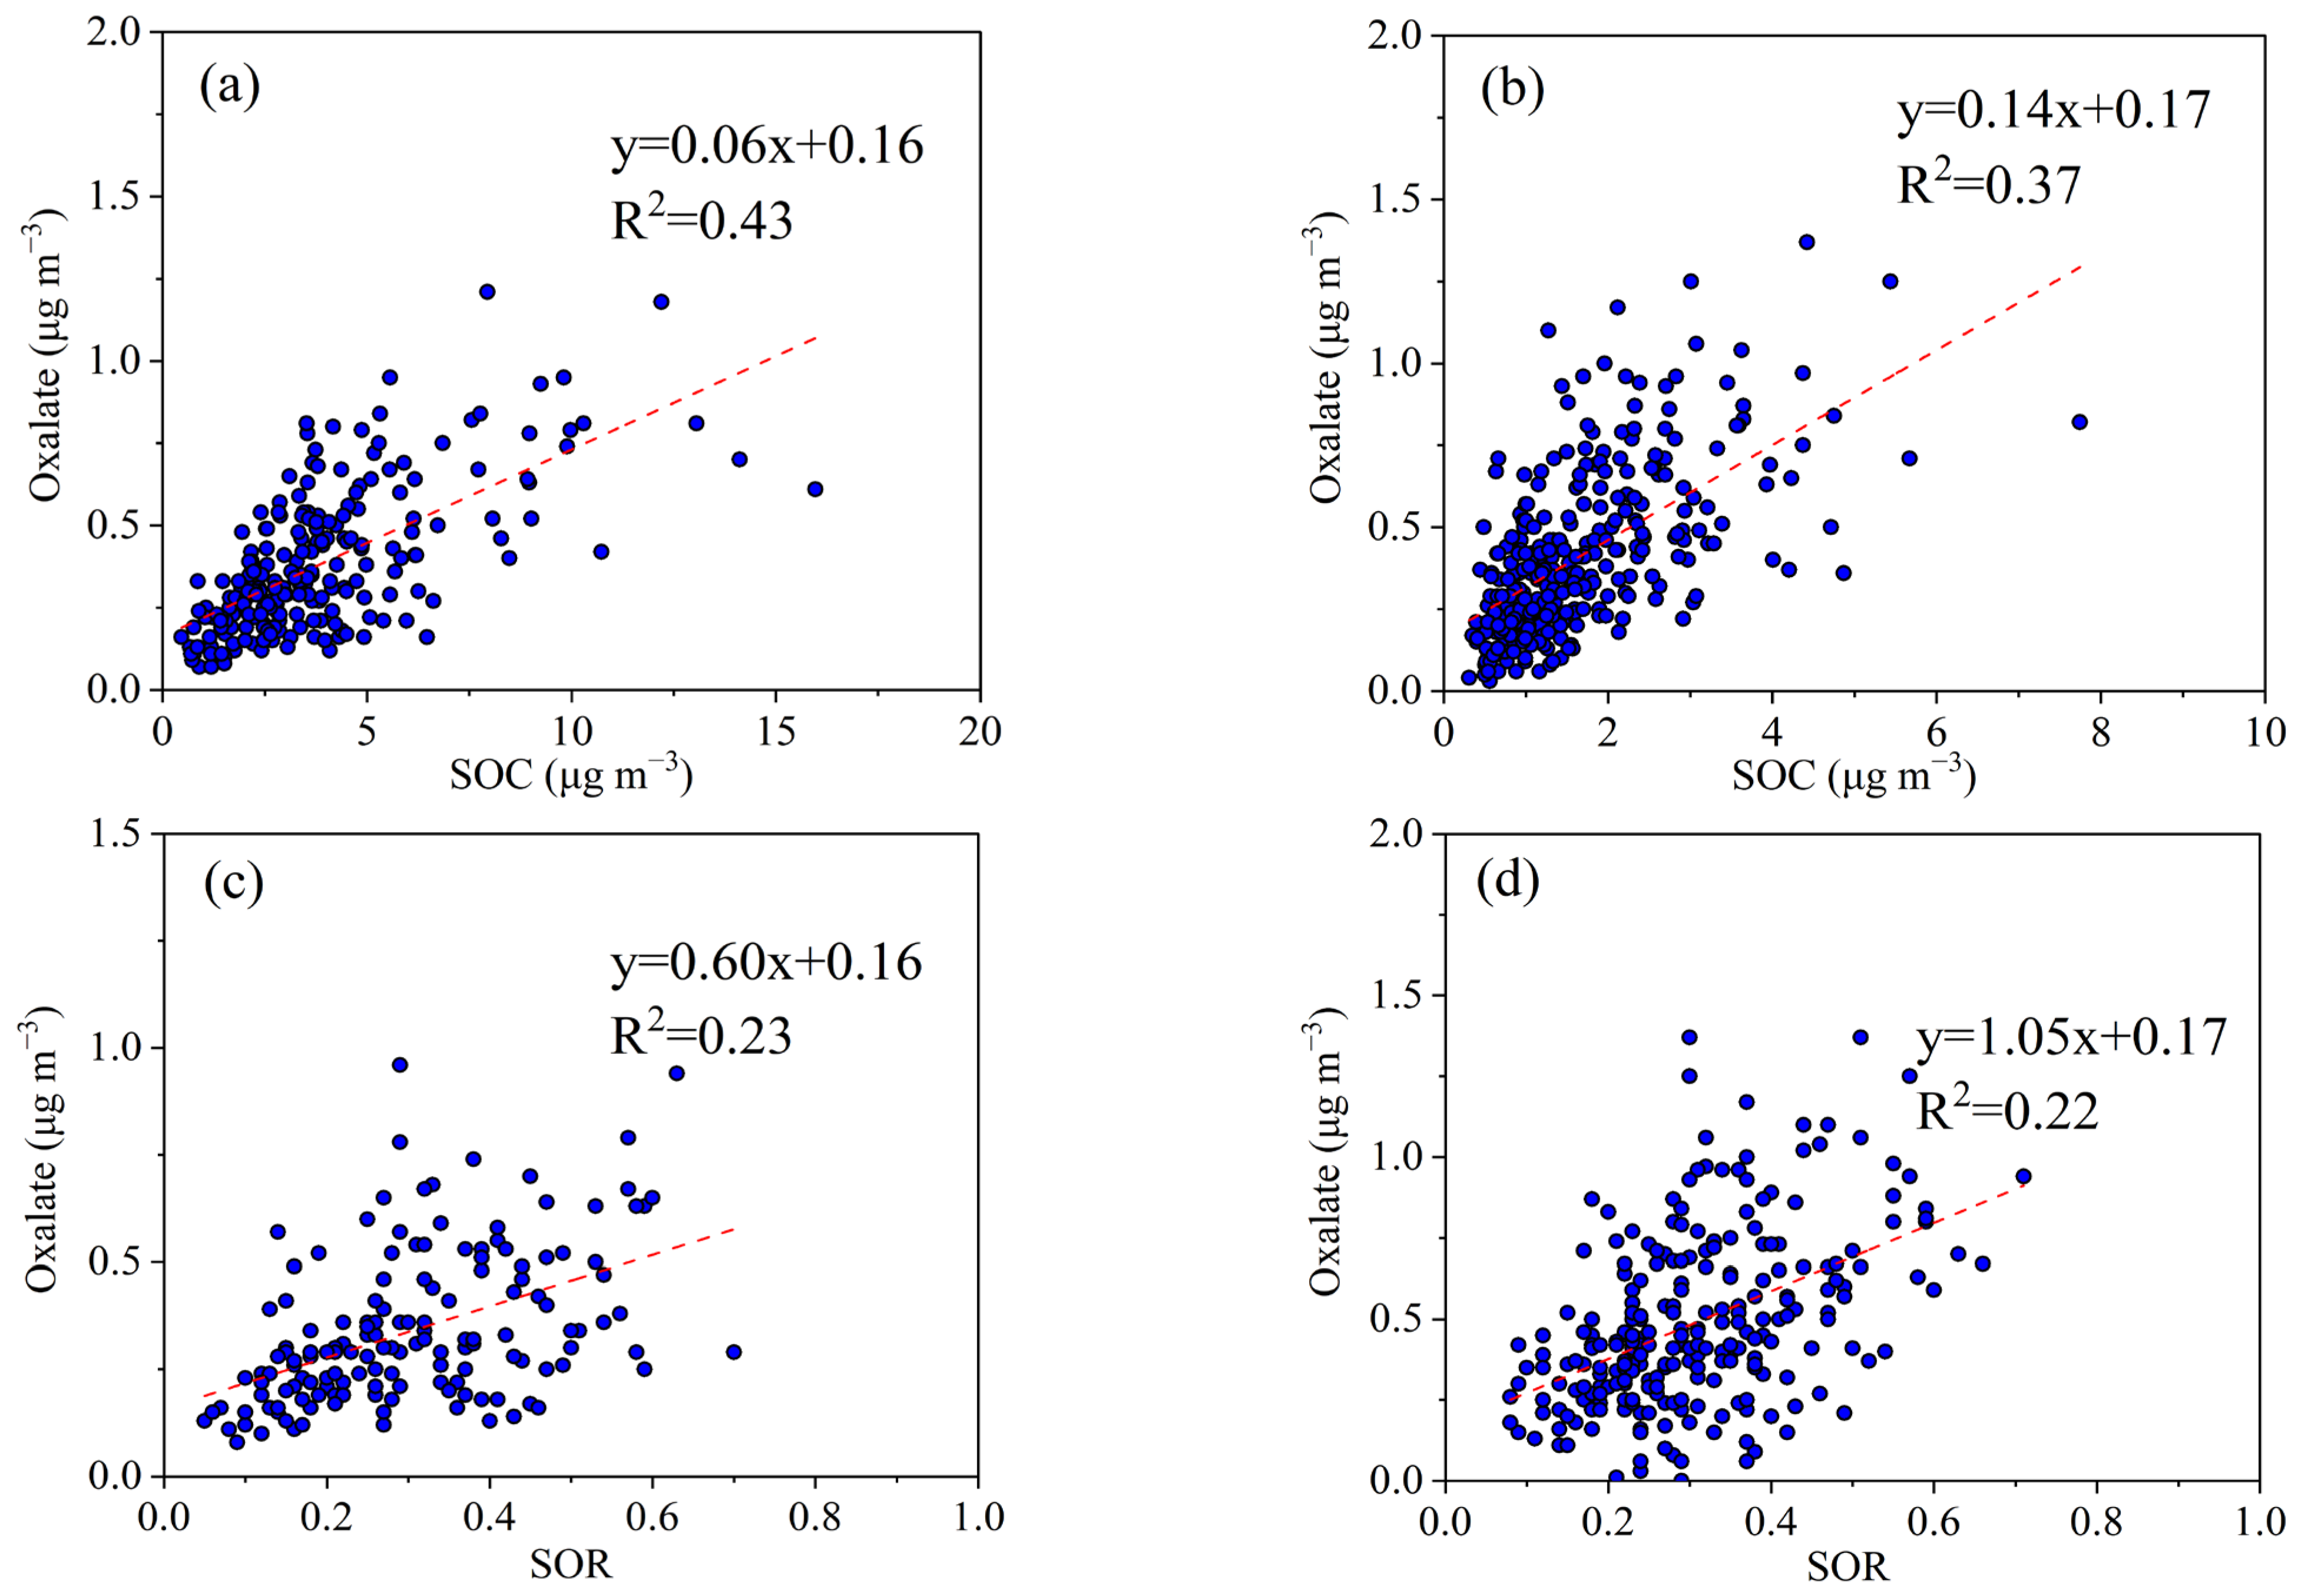
3.2.2. Secondary Formation of Oxalate

In addition to primary sources, such as BB discussed above, studies revealed that oxalate should be formed mainly from secondary processes in the atmosphere [19,21,22]. In this study, a strong positive correlation between oxalate and sulfate (Figure 4) was observed in Shanghai, indicating a similar formation mechanism between the two PM species. Since sulfate is known to be formed from atmospheric secondary oxidation of sulfur dioxide [36,37], the significant correlation between sulfate and oxalate indicates the secondary origination of oxalate in Shanghai. Yu et al. [22] reported a similar positive correlation between aerosol sulfate and oxalate in various locations around the world, and argued that the robust correlation was likely a result of the dominance of the in-cloud formation pathway for both sulfate and oxalate. Yao et al. [38,39] also suggested the importance of in-cloud formation for aerosol oxalate on the basis of size-distributed correlation between sulfate and oxalate. Due to the differences in the emission sources of SO2 and the oxalate precursors and the year-by-year decrease of SO2 over the last decade in Shanghai, the correlation between oxalate and sulfate in different years showed different characteristics (Figure S8).
Previous studies showed that WSOC in fine particles is mainly composed of secondary organic aerosol (SOA) and BB particles [40,41,42]. As shown in eqn.5, SOC can be estimated by subtracting WSOCBB from total WSOC, where WSOCBB was estimated as 8 × [levoglucosan] as reported in previous work [43].
SOCWSOC-based = WSOCtotal − WSOCBB
Significant positive correlations were found between oxalate with SOC, SOR (sulfur oxidation ratio: SO42/(SO42 + SO2)) and NOR (nitrogen oxidation ratio: NO3/(NO3 + NO2)) at BS and PD sites (Figure 5, results for different years can be found in Figures S9 and S10, oxalate correlation with NOR in Figure S11). Secondary formation of oxalate involves photo-oxidation of volatile organic compounds (VOCs) in the gas-phase, aqueous phase, and heterogeneous processes as mentioned by Kundu et al. [22,44], which could explain the significant correlations we observed between oxalate and SOC as well as oxalate and SOR in this study. In addition, the main secondary formation route of oxalate in Shanghai discovered in the current study is consistent with the findings of previous studies.

3.3. Effects of Meteorological Conditions on the Formation of Particulate Oxalate

Temperature could be an impact factor for particulate oxalate. As presented in Figure 6a (year of 2017 was used as an example, similar trend was found in other years of the study period), the oxalate to major PM inorganic ions (SO42 + NO3) ratio was found to be higher in summer than in other seasons during the year, which is consistent with previous findings [26,45]. Tao et al. [26] reported a significantly higher mass ratio of oxalate to sulfate and nitrate in Canada when the temperature was higher, which could be attributed to a higher abundance of oxalate precursors such as glyoxal and methylglyoxal, fast photochemical rate, and higher solubility of chelation metals with higher aerosol acidity in summer. In addition, the pH of aerosol in Shanghai was found to be lower during summer compared to other seasons in a recent work [46], indicating a similar interplay among precursor emission, photochemical rate, and metal solubility may account for the higher oxalate content observed in Shanghai under higher temperatures in this work.
To further prove that temperature favors the formation of oxalate, C2/C4 and C3/C4 were used as two indicators for the photochemical aging of aerosol [33]. Higher ratio of C2/C4 (7.1, 9.1, 8.5, and 7.5 in spring, summer, autumn and winter in Shanghai, respectively) and C3/C4 in summer indicated the enhanced formation of secondary DCAs under higher temperatures. The stronger correlation between C3/C4 and temperature (r = 0.8) than that of C2/C4 (Figure 6b) suggested that ambient temperature had a stronger effect on the formation of malonic acid while the formation of oxalate was less dependent on temperature.
In addition to temperature, RH is another meteorological factor that impacts the formation of oxalate. Field observation and laboratory simulations have found that RH is of great significance for the secondary formation of oxalate [25,47,48]. Significant correlations were also found between aerosol liquid water content, RH, and the number of oxalate-containing particles in the Northern part of China [25]. It can be seen from Figure 7 that the correlations between oxalate and SOR, and oxalate and PM2.5 under higher RH (>80%) were consistently stronger than what was measured under a lower RH (30% < RH ≤ 80%) condition, illustrating that higher RH potentially enhances the heterogeneous as well as aqueous phase formation of particulate oxalate. A similar effect of RH was also found for the correlation between oxalate and NOR. Meanwhile, Ox could be another driver for oxalate formation besides RH. As shown in Figure S12, under low RH condition, higher Ox might dominate the formation of oxalate, which could partially explain the weak dependence of oxalate formation on RH. In a recent work by Yang et al. [49], chemical processes involving O3, OX, and Cl across different RH ranges were proved to have an important influence on the particulate oxalate level, especially under higher RH conditions (30% < RH ≤ 80%), and HONO was also found to have a greater effect on oxalate formation at RH ≤ 30% in winter and 30% < RH ≤ 80% in summer in Nanjing. While HONO was not monitored in this study, future work is needed to illustrate the RH impacts on different oxalate formation pathways in detail.

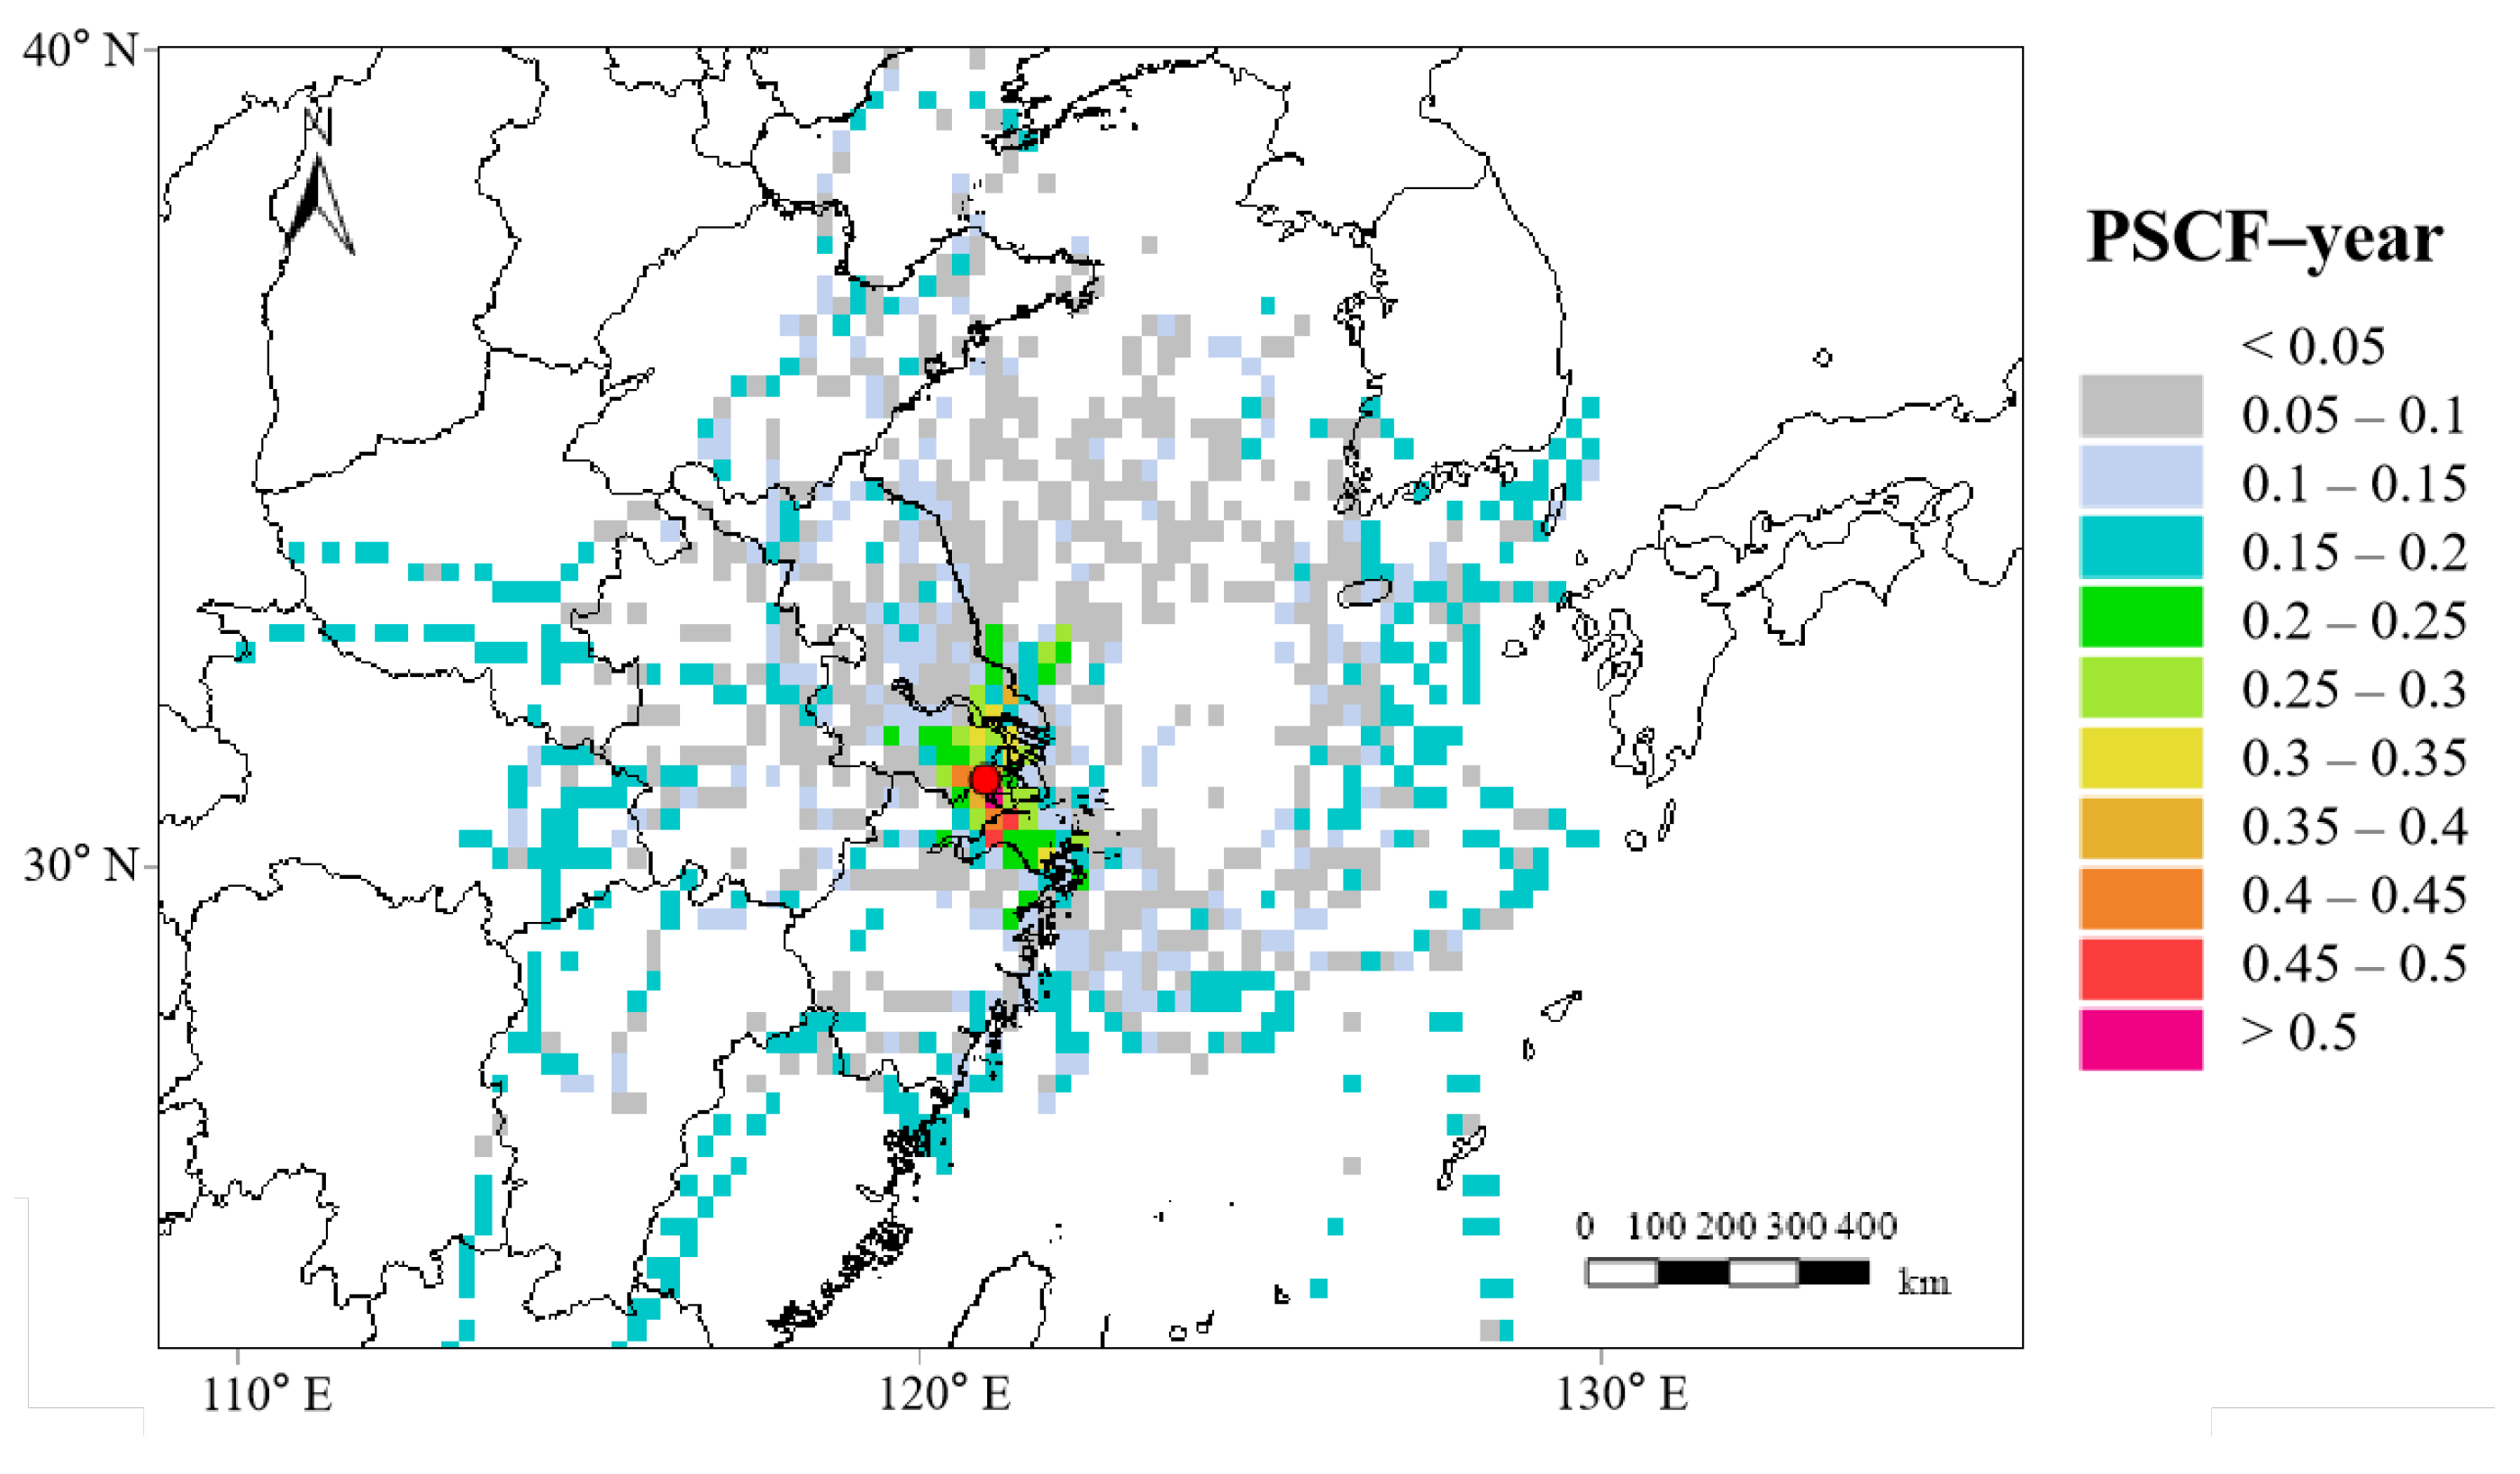
3.4. Regional Transportation of Oxalate in SH

To identify the impact of regional transport, we performed back-trajectory analysis using the HYSPLIT model. There are significant seasonal differences in air mass in Shanghai (Figure S7). The air mass trajectories were similar in spring and autumn, which mainly originated from the northeast. The summer air mass mainly came from the ocean, and the winter air mass stemmed mainly from the northwest. The PSCF results showed that during the sampling period, the concentration of oxalate in Shanghai was mainly affected by local and nearby emissions. Long-range regional transport of pollutants had little effect on the oxalate level observed in this study (Figure 8).

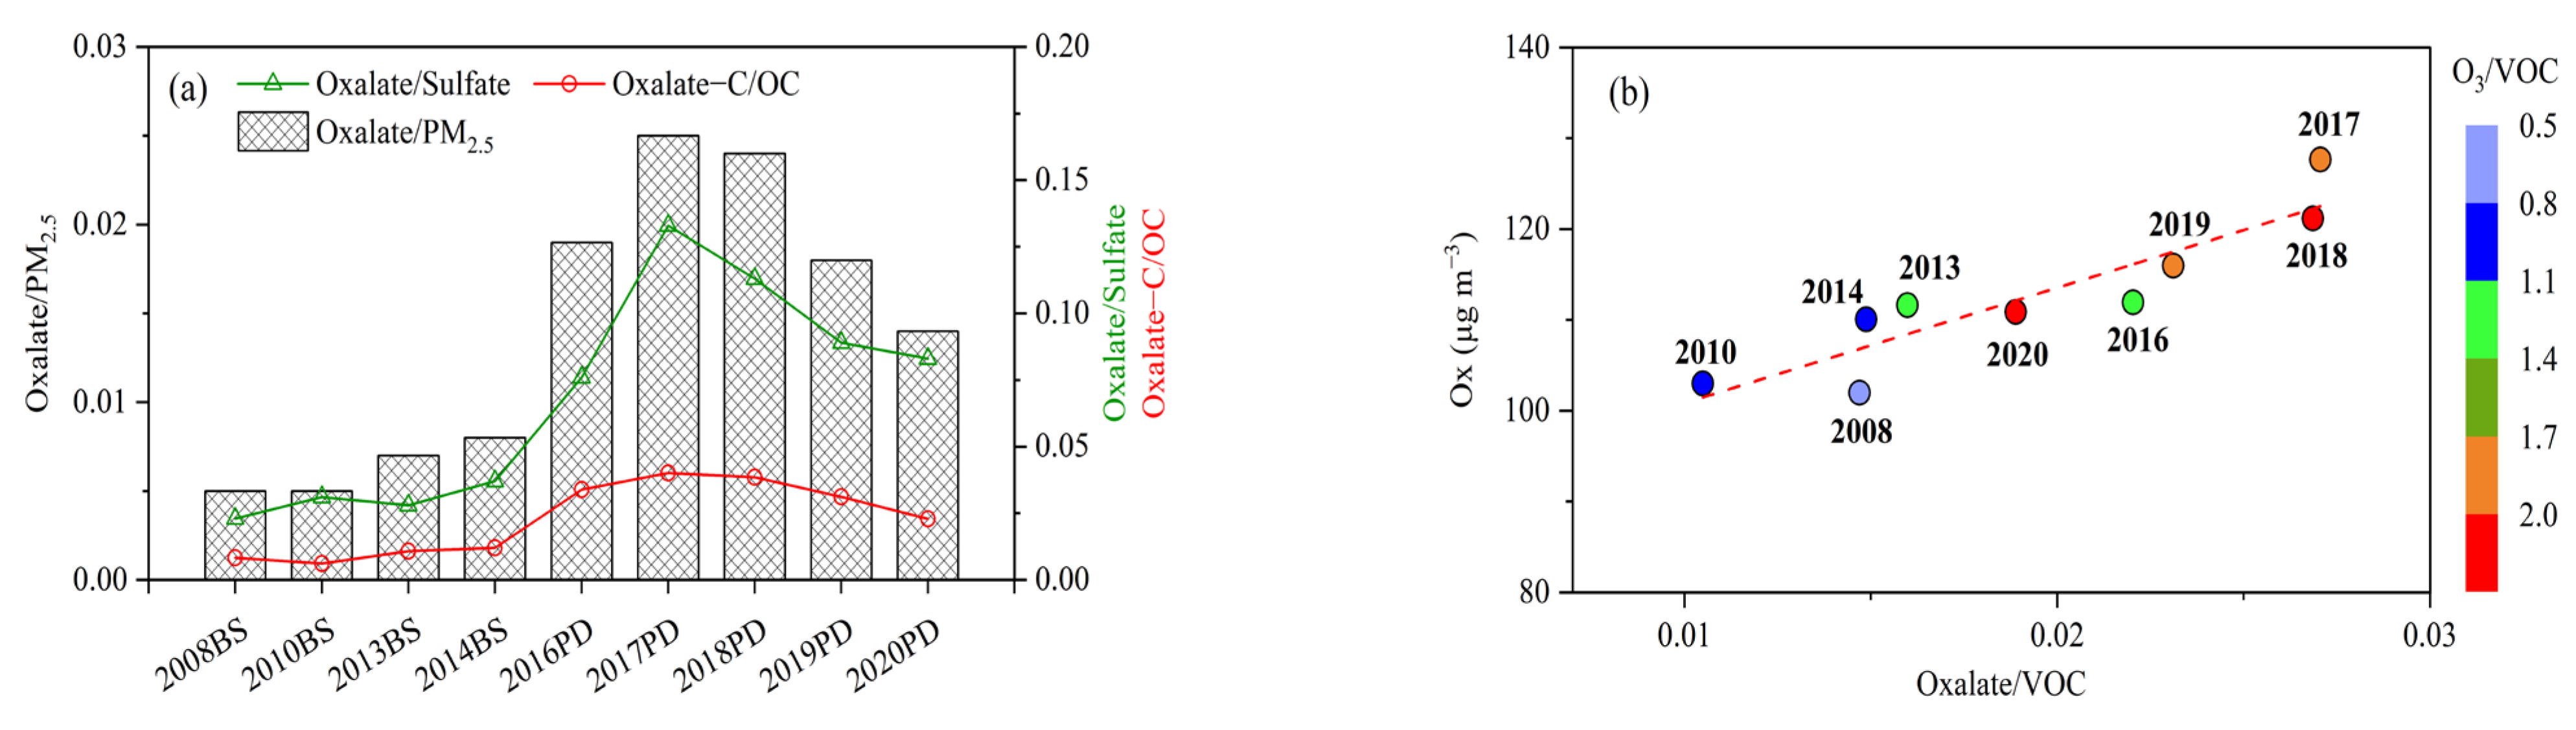
3.5. Interannual Variation of Oxalate in Shanghai during 2008–2020

By analyzing online PM2.5 monitoring results across nine different stations in Shanghai, Zhong et al. [35] showed that carbonaceous aerosols in Shanghai had small spatial variation from 2015 to 2019. In the present study, we extended the investigation period to 2021, and reached a similar conclusion (Table S2). Previous studies also found that carbonaceous matter in PM2.5 at different sites in Shanghai had similar concentrations [28,50]. Analysis on the oxalate concentrations in PM2.5 samples collected simultaneously at BS and Xujiahui (an urban site in Shanghai, Figure S13) in 2010 showed a strong correlation and very similar concentrations, indicating that spatial variation is not a significant impact factor of particulate oxalate in Shanghai. Therefore, comparisons and discussions on the distribution of oxalate from BS and PD sites should be reasonable.
The annual average concentration of oxalate remained stable between 2008 and 2014 (the lower concentration in 2010 might be due to pollution control measures during the Shanghai EXPO), increased slightly to a peak concentration in 2017 and then decreased steadily till 2020 (Figure S14). Such a temporal distribution was distinctly different from other pollutants such as PM2.5, sulfate, nitrate and K+ (Figure S15), which exhibited a decreasing trend during 2008–2020. The oxalate/OC and oxalate/sulfate ratios exhibited similar interannual variation, which increased slowly from 2008 to 2014, peaked in 2017, and then underwent a decreasing process (Figure 9a). Refer to the concentration distribution of other pollutants in Shanghai during the same period (Figure S15), the lower oxalate/OC and oxalate/sulfate ratios observed between 2008 to 2014 can be mainly attributed to the high concentrations of sulfate and OC. It also indicates that the contribution of SOA to PM2.5 in Shanghai before 2015 was less important than that of sulfate, nitrate, and primary OC.
Being the main precursors of oxalate, the concentration of VOCs in Shanghai declined from 2008–2020. However, the concentration of oxalate was relatively stable in 2008–2014 before the drop from 2017 to 2020 (Figure S13). Studies by Fu et al. [51] and Huang et al. [52] reported that VOC emissions in Yangtze River Delta increased from 2007 to 2013. Li et al. [53] estimated an increased trend for anthropogenic non-methane VOC emission in China from 1990–2017. The measured VOC concentrations before 2017 in Shanghai did not follow the trend of emission by the inventory analysis, but should be reliable as much of the anthropogenic VOC emissions came from factories located in suburb/rural areas and more stringent control measures were in place for factories remaining within the urban areas. From 2017 to 2020, with the implementation of more effective VOC control measures, the VOC concentration continued to decline, with which O3 also started to decline (Figure S14), similar to the observed trends for oxalate/PM2.5, oxalate/OC, and oxalate/sulfate (Figure 9a). The synchronous decline of oxalate with VOC indicated that the reduction of VOC emission was the main cause of the decreasing oxalate between 2017 and 2020. Further analysis showed that the oxalate/VOC ratio was strongly correlated with the Ox (O3 + NO2) concentration and the O3/VOCs ratio (Figure 9b), showing that the concentration of oxalate was determined by the precursor concentration and the atmospheric oxidation capacity. The O3/VOC ratio was the highest in 2020, but the oxalate/VOC ratio in 2020 was lower than expected (Figure 9b), the changed source emissions due to the COVID-19 pandemic is likely the main cause. Further study is needed to address the secondary atmospheric reactions during the COVID-19 pandemic in China. Though still at high levels, the decreasing oxalate/sulfate and oxalate/OC ratios from 2017 to 2020 suggest the reducing contribution of SOA to PM2.5 in recent years. Considering the reducing contribution of SOA to PM2.5 in Shanghai and the relatively stable concentration of OC, sulfate, and nitrate (Figure S15), more efforts should be made to mitigate the “traditional” primary emissions together with VOCs and the atmospheric oxidation capacity for further improving air quality in Shanghai.

4. Conclusions

Oxalate is an important component of atmospheric organic aerosol. In this study, we analyzed the concentration of oxalate in PM2.5 samples in Shanghai (BS and PD sites) from 2008 to 2020. Our study compared different extraction methods using 100% water and 1:1 water:methanol (v:v) solution, and found that the 50% methanol–water solution shows better extraction efficiency during DCA GC-MS analysis. Oxalate was observed to be the most abundant DCA with a relatively stable source in Shanghai. BB was estimated to be a minor but non-negligible primary contributor to oxalate. Good correlations between oxalate and SOR, and oxalate and SOC indicate that oxalate in Shanghai was mainly formed from atmospheric secondary oxidation. In addition, temperature and humidity can influence the abundance of particulate oxalate. The decline in oxalate beginning from 2017 was consistent with the decline of VOCs. Overall, the good correlation between oxalate and secondary products in Shanghai indicates that oxalate can potentially be used as a tracer for atmospheric secondary oxidation. Effective mitigation of VOCs and atmospheric oxidation capacity can be reflected by the significant reduction in particulate oxalate content. Our study offers a detailed characterization of particulate oxalate in a coastal mega-city in China, helping to achieve a better understanding of aerosol impacts on global climate and human health.

Supplementary Materials

The following supporting information can be downloaded at: https://www.mdpi.com/article/10.3390/atmos13091347/s1, Figure S1: Comparison of the measured concentrations of different diacids in PM2.5 extracted with 100% water and 1:1 methanol/water solution (v/v); Figure S2: Differences in concentrations of particulate diacids measured by extraction with 1:1 methanol/water solution (v/v) compared to 100% water; Figure S3: Seasonal variation of the diacid content in PM2.5 at the BS site; Figure S4: Correlation between oxalate and K+ in (a):2008; (b):2010; (c):2013; (d):2014 at the BS site; Figure S5: Correlation between oxalate and K+ in (a):2016; (b):2017; (c):2018; (d):2019 at the PD site; Figure S6: Time series of BB contribution to oxalate in BS (a) and PD (b); Figure S7: Clusters of backward trajectories for air parcels arriving in Shanghai during 2019; Figure S8: Oxalate correlation with sulfate: (a-i:BS2008-PD2020); Figure S9: Oxalate correlation with SOC (a-g:BS2008-PD2020); Figure S10: Oxalate correlation with SOR (a-g:BS2010-PD2019); Figure S11: Oxalate correlation with NOR for BS (a) and PD(b); Figure S12: (a) RH distribution of oxalate and Ox; (b) RH distribution of oxalate/PM2.5 and Ox; Figure S13: Oxalate correlation in BS and XJH; Figure S14: Interannual variation of the concentrations of oxalate [54,55]; Figure S15: Evolution of pollutants for Shanghai; Table S1: The ratio of Ca2+/K+ in biomass burning aerosol reported in previous studies [56,57,58,59]; Table S2: Annual PM2.5 concentrations at 9 monitoring stations in Shanghai during 2015–2021.

Author Contributions

Conceptualization, J.F. and S.W.; Methodology, J.F.; Data curation, J.F. and M.H.; Investigation, N.Z., Y.F. and F.F.; Formal analysis, N.Z. and S.W; writing—original draft preparation, N.Z.; writing—review and editing, J.F., S.W. and J.C.; Resources, J.F. and Q.F.; Project administration, J.F. and Q.F. All authors have read and agreed to the published version of the manuscript.

Funding

This research was financially supported by the National Natural Science Foundation of China (Grant No: 41877373).

Institutional Review Board Statement

Not applicable.

Informed Consent Statement

Not applicable.

Data Availability Statement

The data that support the findings of this study are available from the corresponding author, upon reasonable request.

Conflicts of Interest

The authors declare no conflict of interest.

References

  1. Timonen, H.; Aurela, M.; Carbone, S.; Saarnio, K.; Hillamo, R. High time-resolution chemical characterization of the water-soluble fraction of ambient aerosols with PILS-TOC-IC and AMS. Atmos. Meas. Tech. 2010, 3, 61–69. [Google Scholar] [CrossRef]
  2. Zhang, Y.L.; Kawamura, K.; Cao, F.; Lee, M. Stable carbon isotopic compositions of low-molecular-weight dicarboxylic acids, oxocarboxylic acids, α-dicarbonyls, and fatty acids: Implications for atmospheric processing of organic aerosols. J. Geophys. Res. 2015, 121, 3707–3717. [Google Scholar] [CrossRef]
  3. Kawamura, K.; Bikkina, S. A review of dicarboxylic acids and related compounds in atmospheric aerosols: Molecular distributions, sources and transformation. Atmos. Res. 2016, 170, 140–160. [Google Scholar] [CrossRef]
  4. Miyazaki, Y.; Aggarwal, S.G.; Singh, K.; Gupta, P.K.; Kawamura, K. Dicarboxylic acids and water-soluble organic carbon in aerosols in New Delhi, India, in winter: Characteristics and formation processes. J. Geophys. Res. 2009, 114, D19206. [Google Scholar] [CrossRef]
  5. Zhang, R.; Suh, I.; Zhao, J.; Zhang, D.; Fortner, E.C.; Tie, X.; Molina, L.T.; Molina, M.J. Atmospheric new particle formation enhanced by organic acids. Science 2004, 304, 1487–1490. [Google Scholar] [CrossRef]
  6. Yu, S. Role of organic acids (formic, acetic, pyruvic and oxalic) in the formation of cloud condensation nuclei (CCN): A review. Atmos. Res. 2000, 53, 185–217. [Google Scholar] [CrossRef]
  7. Feng, J.L.; Guo, Z.G.; Zhang, T.R.; Yao, X.H.; Chan, C.K.; Fang, M. Source and formation of secondary particulate matter in PM2.5 in Asian continental outflow. J. Geophys. Res. 2012, 117, D03302. [Google Scholar] [CrossRef]
  8. Huang, X.F.; Chen, D.L.; Lan, Z.J.; Feng, N.; He, L.Y.; Yu, G.H.; Luan, S.J. Characterization of organic aerosol in fine particles in a mega-city of South China: Molecular composition, seasonal variation, and size distribution. Atmos. Res. 2012, 114–115, 28–37. [Google Scholar] [CrossRef]
  9. Huang, X.F.; Yu, J.Z.; He, L.Y.; Yuan, Z. Water-soluble organic carbon and oxalate in aerosols at a coastal urban site in China: Size distribution characteristics, sources, and formation mechanisms. J. Geophys. Res. 2006, 111, D22212. [Google Scholar] [CrossRef]
  10. Sunder Raman, R.; Hopke, P.K.; Holsen, T.M. Carbonaceous aerosol at two rural locations in New York State: Characterization and behavior. J. Geophys. Res. 2008, 113, D12202. [Google Scholar] [CrossRef]
  11. Sempére, R.; Kawamura, K. Comparative distributions of dicarboxylic acids and related polar compounds in snow, rain and aerosols from urban atmosphere. Atmos. Environ. 1994, 28, 449–459. [Google Scholar] [CrossRef]
  12. Sempéré, R.; Kawamura, K. Low molecular weight dicarboxylic acids and related polar compounds in the remote marine rain samples collected from Western Pacific. Atmos. Environ. 1996, 30, 1609–1619. [Google Scholar] [CrossRef]
  13. Van Pinxteren, D.; Neusüß, C.; Herrmann, H. On the abundance and source contributions of dicarboxylic acids in size-resolved aerosol particles at continental sites in central Europe. Atmos. Chem. Phys. 2014, 13, 32093–32131. [Google Scholar] [CrossRef]
  14. Cong, Z.; Kawamura, K.; Kang, S.; Fu, P. Penetration of biomass-burning emissions from South Asia through the Himalayas: New insights from atmospheric organic acids. Sci. Rep. 2015, 5, 9580. [Google Scholar] [CrossRef]
  15. Dabek-Zlotorzynska, E.; Celo, V. Measurement of low-molecular-weight carboxylic acids in ambient air and vehicle emission by capillary electrophoresis. Methods Mol. Biol. 2008, 384, 43. [Google Scholar]
  16. Claeys, M.; Graham, B.; Vas, G.; Wu, W.; Vermeylen, R.; Pashynska, V.; Cafmeyer, J.; Cuyon, P.; Andreae, M.O.; Artaxo, P. Formation of secondary organic aerosols through photooxidation of isoprene. Science 2004, 303, 1173–1176. [Google Scholar] [CrossRef]
  17. Yang, F.; Chen, H.; Wang, X.; Yang, X.; Du, J.; Chen, J. Single particle mass spectrometry of oxalic acid in ambient aerosols in Shanghai: Mixing state and formation mechanism. Atmos. Environ. 2009, 43, 3876–3882. [Google Scholar] [CrossRef]
  18. Li, L.; Wu, W.; Feng, J.; Zhang, D.; Li, H.; Gu, Z.; Wang, B.; Sheng, G.; Fu, J. Composition, source, mass closure of PM2.5 aerosols for four forests in eastern China. Environ. Sci. 2010, 022, 405–412. [Google Scholar] [CrossRef]
  19. Ren, G.; Yan, X.; Ma, Y.; Qiao, L.; Li, L. Characteristics and source apportionment of PM2.5-bound saccharides and carboxylic acids in Central Shanghai, China. Atmos. Res. 2019, 237, 104817. [Google Scholar] [CrossRef]
  20. Thepnuan, D.; Chantara, S.; Lee, C.T.; Lin, N.H.; Tsai, Y.I. Molecular markers for biomass burning associated with the characterization of PM2.5 and component sources during dry season haze episodes in Upper South East Asia. Sci. Total Environ. 2019, 658, 708–722. [Google Scholar] [CrossRef]
  21. Zhou, Y.; Huang, X.H.; Bian, Q.; Griffith, S.M.; Louie, P.K.K.; Yu, J.Z. Sources and atmospheric processes impacting oxalate at a suburban coastal site in hong kong: Insights inferred from 1year hourly measurements. J. Geophys. Res. 2015, 120, 9772–9788. [Google Scholar] [CrossRef]
  22. Yu, j.; Huang, x.; Xu, j.; Hu, m. When aerosol sulfate goes up, so does oxalate: Implication for the formation mechanisms of oxalate. Environ. Sci. Technol. 2005, 39, 128–133. [Google Scholar] [CrossRef] [PubMed]
  23. Gong, H.; Cheng, C.; Li, M.; Yang, S.; Zhou, Q.; Zhong, Q.E.; Zhang, Y.; Xie, Y.; Zhou, Z. The enhanced mixing states of oxalate with metals in single particles in Guangzhou, China. Sci. Total Environ. 2021, 783, 146962. [Google Scholar] [CrossRef]
  24. Zhang, G.; Lin, Q.; Peng, L.; Yang, Y.; Jiang, F.; Liu, F.; Song, W.; Chen, D.; Cai, Z.; Bi, X.; et al. Oxalate formation enhanced by Fe-containing particles and environmental implications. Environ. Sci. Technol. 2019, 53, 1269–1277. [Google Scholar] [CrossRef] [PubMed]
  25. Meng, J.; Li, Z.; Zhou, R.; Chen, M.; Li, Y.; Yi, Y.; Ding, Z.; Li, H.; Yan, L.; Hou, Z.; et al. Enhanced photochemical formation of secondary organic aerosols during the COVID-19 lockdown in Northern China. Sci. Total Environ. 2021, 758, 143709. [Google Scholar] [CrossRef] [PubMed]
  26. Tao, Y.; Murphy, J.G. The mechanisms responsible for the interactions among oxalate, pH, and Fe dissolution in PM2.5. ACS Earth Space Chem. 2019, 3, 2259–2265. [Google Scholar] [CrossRef]
  27. Ma, Q.; He, H.; Liu, C. Hygroscopic properties of oxalic acid and atmospherically relevant oxalates. Atmos. Environ. 2013, 69, 281–288. [Google Scholar] [CrossRef]
  28. Feng, J.; Li, M.; Zhang, P.; Gong, S.; Zhong, M.; Wu, M.; Zheng, M.; Chen, C.; Wang, H.; Lou, S. Investigation of the sources and seasonal variations of secondary organic aerosols in PM2.5 in Shanghai with organic tracers. Atmos. Environ. 2013, 79, 614–622. [Google Scholar] [CrossRef]
  29. Bikkina, S.; Kawamura, K.; Miyazaki, Y.; Fu, P. High abundances of oxalic, azelaic, and glyoxylic acids and methylglyoxal in the open ocean with high biological activity: Implication for secondary OA formation from isoprene. Geophys. Res. Lett. 2014, 41, 3649–3657. [Google Scholar] [CrossRef]
  30. Bi, X.; Sheng, G.; Chen, Y.; Fu, J. Size distribution of n-alkanes and polycyclic aromatic hydrocarbons (PAHs) in urban and rural atmospheres of Guangzhou, China. Atmos. Environ. 2005, 39, 477–487. [Google Scholar] [CrossRef]
  31. Chow, J.C.; Watson, J.G.; Pritchett, L.C.; Pierson, W.R.; Frazier, C.A.; Purcell, R.G. The dri thermal/optical reflectance carbon analysis system: Description, evaluation and applications in U.S. Air quality studies. Atmos. Environ. 1993, 27, 1185–1201. [Google Scholar] [CrossRef]
  32. Kawamura, K.; Ikushima, K. Seasonal changes in the distribution of dicarboxylic acids in the urban atmosphere. Environ. Sci. Technol. 1993, 27, 2227–2235. [Google Scholar] [CrossRef]
  33. Kawamura, K.; Sakaguchi, F. Molecular distributions of water soluble dicarboxylic acids in marine aerosols over the Pacific Ocean including tropics. J. Geophys. Res. 1999, 104, 3501–3509. [Google Scholar] [CrossRef]
  34. Yang, F.; Gu, Z.; Feng, J.; Liu, X.; Yao, X. Biogenic and anthropogenic sources of oxalate in PM2.5 in a mega city, Shanghai. Atmos. Res. 2014, 138, 356–363. [Google Scholar] [CrossRef]
  35. Zhong, Y.; Chen, J.; Zhao, Q.; Zhang, N.; Feng, J.; Fu, Q. Temporal trends of the concentration and sources of secondary organic aerosols in PM2.5 in Shanghai during 2012 and 2018. Atmos. Environ. 2021, 261, 118596. [Google Scholar] [CrossRef]
  36. Ye, C.; Lu, K.; Song, H.; Mu, Y.; Chen, J.; Zhang, Y. A critical review of sulfate aerosol formation mechanisms during winter polluted periods. J. Environ. Sci. 2022, in press. [Google Scholar] [CrossRef]
  37. Hilario, M.; Crosbie, E.; Baaga, P.A.; Betito, G.; Braun, R.A.; Cambaliza, M.O. Particulate oxalate-to-sulfate ratio as an aqueous processing marker: Similarity across field campaigns and limitations. Geophys. Res. Lett. 2021, 48, e2021GL096520. [Google Scholar] [CrossRef]
  38. Yao, X.; Lau, A.P.S.; Fang, M.; Chan, C.K.; Hu, M. Size distributions and formation of ionic species in atmospheric particulate pollutants in Beijing, China: 2—Dicarboxylic acids. Atmos. Environ. 2003, 37, 3001–3007. [Google Scholar] [CrossRef]
  39. Yao, X.; Ming, F.; Chan, C.K. Size distributions and formation of dicarboxylic acids in atmospheric particles. Atmos. Environ. 2002, 36, 2099–2107. [Google Scholar] [CrossRef]
  40. Weber, R.J.; Sullivan, A.P.; Peltier, R.E.; Russell, A.; Yan, B.; Zheng, M.; De Gouw, J.; Warneke, C.; Brock, C.; Holloway, J.S. A study of secondary organic aerosol formation in the anthropogenic-influenced southeastern United States. J. Geophys. Res.-Atmos. 2007, 112, D13302. [Google Scholar] [CrossRef]
  41. Kondo, Y.; Miyazaki, Y.; Takegawa, N.; Miyakawa, T.; Weber, R.J.; Jimenez, J.L.; Zhang, Q.; Worsnop, D.R. Oxygenated and water-soluble organic aerosols in Tokyo. J. Geophys. Res.-Atmos. 2007, 112, D01203. [Google Scholar] [CrossRef]
  42. Mayol-Bracero, O.L.; Guyon, P.; Graham, B.; Roberts, G.; Andreae, M.O.; Decesari, S.; Facchini, M.C.; Fuzzi, S.; Artaxo, P. Water-soluble organic compounds in biomass burning aerosols over Amazonia 2. Apportionment of the chemical composition and importance of the polyacidic fraction. J. Geophys. Res.-Atmos. 2002, 107, LBA-59. [Google Scholar] [CrossRef]
  43. Yuan-xun, Z.; Min, S.; Yuan-hang, Z.; Li-min, Z.; Ling-yan, H.; Bin, Z.; Yong-jie, W.; Xian-lei, Z. Source profiles of particulate organic matters emitted from cereal straw burnings. J. Environ. Sci. (China) 2007, 19, 167–175. [Google Scholar]
  44. Kundu, S.; Kawamura, K.; Andreae, T.W.; Hoffer, A.; Andreae, M.O. Molecular distributions of dicarboxylic acids, ketocarboxylic acids and α-dicarbonyls in biomass burning aerosols: Implications for photochemical production and degradation in smoke layers. Atmos. Chem. Phys. 2010, 10, 2209–2225. [Google Scholar]
  45. Meng, J.; Wang, G.; Hou, Z.; Liu, X.; Wei, B.; Wu, C.; Cao, C.; Wang, J.; Li, J.; Cao, J. Molecular distribution and stable carbon isotopic compositions of dicarboxylic acids and related SOA from biogenic sources in the summertime atmosphere of Mt. Tai in the North China Plain. Atmos. Chem. Phys. 2018, 18, 15069–15086. [Google Scholar] [CrossRef]
  46. Fu, Z.; Cheng, L.; Ye, X.; Ma, Z.; Wang, R.; Duan, Y.; Juntao, H.; Chen, J. Characteristics of aerosol chemistry and acidity in Shanghai after PM2.5 satisfied national guideline: Insight into future emission control. Sci. Total Environ. 2022, 827, 154319. [Google Scholar] [CrossRef]
  47. Martinelango, P.K.; Dasgupta, P.K.; Al-Horr, R.S. Atmospheric production of oxalic acid/oxalate and nitric acid/nitrate in the Tampa Bay airshed: Parallel pathways. Atmos. Environ. 2007, 41, 4258–4269. [Google Scholar] [CrossRef]
  48. Meng, J.; Wang, G.; Li, J.; Cheng, C.; Ren, Y.; Yao, H.; Cheng, Y.; Cao, J.; Zhang, T. Seasonal characteristics of oxalic acid and related SOA in the free troposphere of Mt. Hua, central China: Implications for sources and formation mechanisms. Sci. Total Environ. 2014, 493, 1088–1097. [Google Scholar] [CrossRef]
  49. Yang, C.; Zhou, S.; Zhang, C.; Yu, M.; Cao, F.; Zhang, Y. Atmospheric Chemistry of Oxalate: Insight into the role of relative humidity and aerosol acidity from high-resolution observation. J. Geophys. Res.-Atmos. 2022, 127, e2021JD035364. [Google Scholar] [CrossRef]
  50. Ye, B.; Ji, X.; Yang, H.; Yao, X.; Chan, C.K.; Cadle, S.H.; Chan, T.; Mulawa, P.A. Concentration and chemical composition of PM2.5 in Shanghai for a 1-year period. Atmos. Environ. 2003, 37, 499–510. [Google Scholar] [CrossRef]
  51. Fu, X.; Wang, S.; Zhao, B.; Xing, J.; Cheng, Z.; Liu, H.; Hao, J. Emission inventory of primary pollutants and chemical speciation in 2010 for the Yangtze River Delta region, China. Atmos. Environ. 2013, 70, 39–50. [Google Scholar] [CrossRef]
  52. Huang, C.; Chen, C.H.; Li, L.; Cheng, Z.; Wang, H.L.; Huang, H.Y.; Streets, D.G.; Wang, Y.J.; Zhang, G.F.; Chen, Y.R. Emission inventory of anthropogenic air pollutants and VOC species in the Yangtze River Delta region, China. Atmos. Chem. Phys. 2011, 11, 4105–4120. [Google Scholar] [CrossRef]
  53. Li, M.; Zhang, Q.; Zheng, B.; Tong, D.; He, K. Persistent growth of anthropogenic non-methane volatile organic compound (NMVOC) emissions in China during 1990-2017: Drivers, speciation and ozone formation potential. Atmos. Chem. Phys. 2019, 19, 8897–8913. [Google Scholar] [CrossRef]
  54. Peng, Y.; Wang, H.; Wang, Q.; Jing, S.; An, J.; Gao, Y.; Huang, C.; Yan, R.; Dai, H.; Cheng, T. Observation-based sources evolution of non-methane hydrocarbons (NMHCs) in a megacity of China—Science Direct. J. Environ. Sci. (China) 2022, 124, 794–805. [Google Scholar] [CrossRef]
  55. Xu, J.; Tie, X.; Gao, W.; Lin, Y.; Fu, Q. Measurement and model analyses of the ozone variation during 2006 to 2015 and its response to emission change in megacity Shanghai, China. Atmos. Chem. Phys. 2019, 19, 9017–9035. [Google Scholar] [CrossRef]
  56. Wu, J.; Kong, S.; Yan, Y.; Yao, L.; Yan, Q.; Liu, D.; Shen, G.; Zhang, X.; Qi, S. Neglected biomass burning emissions of air pollutants in China-views from the corncob burning test, emission estimation, and simulations. Atmos. Environ. 2022, 278, 119082. [Google Scholar] [CrossRef]
  57. Ni, H.; Tian, J.; Wang, X.; Wang, Q.; Han, Y.; Cao, J.; Long, X.; Chen, L.; Chow, J.C.; Watson, J.G. PM2.5 emissions and source profiles from open burning of crop residues. Atmos. Environ. 2017, 169, 229–237. [Google Scholar] [CrossRef]
  58. Zhang, H.; Hu, J.; Qi, Y.; Li, C.; Chen, J.; Wang, X.; He, J.; Wang, S.; Hao, J.; Zhang, L. Emission characterization, environmental impact, and control measure of PM2.5 emitted from agricultural crop residue burning in China. J. Cleaner Prod. 2017, 149, 629–635. [Google Scholar] [CrossRef]
  59. Tian, J. Study on Emission Characteristics of PM2.5 from Crop Residue Burning and Residential Coal Combustion in China. Ph.D. Thesis, University of Chinese Academy of Sciences, Xi’an, China, October 2016. [Google Scholar]
Figure 1. Map of the two sampling sites, BS and PD (red stars).
Atmosphere 13 01347 g001
Figure 2. Annual average distribution of dicarboxylic acids at BS from 2013 to 2014.
Atmosphere 13 01347 g002
Figure 3. Annual BB contribution to oxalate in Shanghai. Blue bars represent BS and red bars represent PD.
Atmosphere 13 01347 g003
Figure 4. Oxalate correlation with sulfate: BS (a) and PD(b).
Atmosphere 13 01347 g004
Figure 5. Correlations of oxalate with SOC for BS (a) and PD (b), and correlations of oxalate with SOR for BS (c) and PD (d).
Atmosphere 13 01347 g005
Figure 6. (a) Annual temperature distribution of oxalate/(sulfate + nitrate) for PD (2017); (b) Relationship between C2/C4, C3/C4, and temperature, respectively.
Atmosphere 13 01347 g006
Figure 7. RH effect on particulate oxalate formation and its relationship with SOR (triangles) (a) and PM2.5 (squares) (b). Blue triangles or squares represent samples with RH > 80, and red triangles or squares represent samples with 30 < RH ≤ 80.
Atmosphere 13 01347 g007
Figure 8. PSCF analysis result at Shanghai during the sampling period in 2019. Data from the PD site were selected for analysis.
Atmosphere 13 01347 g008
Figure 9. (a) Interannual variation of the oxalate/PM2.5, oxalate/sulfate and oxalate-C/OC ratios in Shanghai; (b) Oxalate/VOC correlation with Ox (2008–2020).
Atmosphere 13 01347 g009
Publisher’s Note: MDPI stays neutral with regard to jurisdictional claims in published maps and institutional affiliations.

