1. Introduction
Natural gas development and exploration can have a significant impact on air quality [
1,
2]. Shale gas production contributes to emissions into the air, including methane (CH
4), nonmethane hydrocarbons (NMHC), carbon dioxide (CO
2), and hydrogen sulfide (H
2S) [
3], although individual stages of gas production generate different sets of air pollutants [
4,
5]. The first stage of shale gas production (preparation and drilling) engages a large number of diesel-powered engines (e.g., trucks and pumps) that emit mainly nitrogen oxides (NO
x), volatile organic compounds (VOCs), CO
2, and fine particulate matter (PM
2.5 and PM
10) [
6,
7]. Research by Purvis et al. [
8] highlights that the preoperational phase, covering 20 weeks of intensive activities related to preparation for hydraulic fracturing, leads to a significant increase of the annual mean of nitrogen oxide (NO) (3-fold) and NOx (2-fold) equal to 5.3 ppb and 10.9 ppb, respectively. Hydraulic fracturing processes often result in uncontrolled CH
4 leaks [
9]. At the stage of completion of the well, the process of venting shale gas above the surface can result in increased emission of VOCs [
10]. The problem of air pollution is linked to direct emission because drilling and hydraulic fracturing may concern not only the borehole area, but the transport of these pollutants to downwind regions, especially those inhabited by people, which is equally important [
11]. The measurements performed by Orak et al. [
12] in Marcellus Shale (USA) at the turn of 2015 and 2016 indicated significant increase of NO
x during the fracturing phase and of C
2H
6 (ethane) and CH
4 for the flowback phase. The values of the 25th percentile equaled 12.5 ppb, 24 ppb and 2.5 ppm for NO
x, C
2H
6 and CH
4, respectively, which were significantly higher than for other phases.
Shale gas is regarded as a low-carbon fuel, and its exploitation results in lower CO
2, NO
x, and sulfur oxides (SO
x) emissions than conventional coal or oil combustion [
12,
13,
14]. According to Song et al. [
15] replacing coal with shale gas in China reduced the mean monthly concentration of PM
2.5 during the time period 2013–2014 by 70%, compared with the same period in 2011–2012. Similar results were obtained by Zhang et al. [
16]. Substitution of coal and biomass fuel by shale gas reduced PM emissions in 2017 in China by 123 kt/y. According to Wang et al. [
17], the full environmental impact (mainly associated with water consumption and combustion of diesel fuel during the development of the well) of shale gas is 12.5% greater than natural gas. In contrast, replacing fossil fuels (especially coal and biomass) by shale gas could efficiently reduce emission of PM. Among the conventional/unconventional methods of generating electricity and related to the reduction of harmful effects of pollutant emissions on the environment, the investigations with thermal power plants are worth mentioning. Investigations of Abadan Combined Cycle Power Plant (CCPP) in Iran aimed at improving its performance and reducing emissions, indicated that introducing parabolic solar collectors and a multi-effect desalination cycle decreased CO
2 emissions from 58.05 to 54.97 kg/MWh of electricity [
18]. Further investigations of Abadan (CCPP) showed that the implementation of a multigeneration system caused environmental effects of the modeled system on air pollution production (NO
x, CO, CO
2) equal to 8.975 kg/s, which indicated a decrease of pollutant emissions equal to 9.8% [
19]. Specific configurations of Abadan CCPP with a solar power tower [
20] could reduce emissions into the atmosphere up to 345 63 tons/year. There are numerous objections to uncontrolled methane leakages from natural gas systems during exploration activities [
13,
21]. CH
4 is the main component of shale gas and the second main greenhouse gas (GHG), and it is much more efficient in absorbing radiation than CO
2 [
21]. Many studies have focused on the contribution of natural gas production to CH
4 emissions and GHG budget, although their results differ from each other. According to observations by Karion et al. [
22], the total fugitive emission of CH
4 from shale gas operations can be up to 17.3% of total gas production. Research by Shaw et al. [
23] showed the results of air quality measurements performed near the UK’s first shale gas hydraulic fracturing area (Lancashire, England) at the turn of 2018 and 2019. Observations during flowback operations revealed elevated CH
4 mixing ratios (30-min mean of up to 5 ppm) after artificial nitrogen lifting of a well. The estimate of mean CH
4 flux using modeling approaches was approximately 16 g s
−1.
In the vicinity of the borehole area, a significant emission of NO
x and VOC contributes to surface O
3 formation and results in high O
3 episodes [
24,
25]. Schnell et al. [
1] analyzed surface O
3 concentrations in the rural area of the Upper Green River Basin, Wyoming (UGRBWY), during February 2008. Under conditions of a high-pressure system, freezing temperature, snow cover, low wind, and clear sky, the hourly average O
3 concentration rose from 30 ppb (night) to above 140 ppb (afternoon). Measurements performed by Rappenglück et al. [
26] in UGRBWY from January to March 2011 also indicated repeated episodes of the air quality standard (>75 ppb) being exceeded during the winter season. Large amounts of NO
x and NMHC emitted during fossil fuel activities accumulate below the shallow stable (≈50 m.a.g.l.) boundary layer, thereby affecting surface O
3 formation, which reaches maximum 1-h average values above 160 ppb. Cheadle et al. [
27] reported that in the North Colorado Range Front (NCRF) in Colorado, on individual summer days with high O
3 levels, emission related to oil and natural gas extraction activities could contribute up to 30 ppb to O
3 formation locally. According to Benedict et al. [
28] elevated VOC concentrations associated with greater oil and natural gas determine episodes of high O
3 concentration in NCFR in Colorado. Emission connected with gas exploitation contributed up to 20 ppbv excess O
3. Similar results were obtained by Lindaas et al. [
29]. They found that amounts of long-lived VOCs, related to oil and natural gas exploitation, are so high that processes of their oxidation during the day produce sufficient peroxy radicals to significantly impact on O
3 production in NCFR in Colorado during high O
3 days in this region.
The success of shale gas in the United States at the beginning of the 21st century has become a phenomenon on a global scale, mainly due to advantages of geological and natural physical conditions (shallow shale gas formation with a high index of total organic carbon and relatively big thickness) [
30]. Additionally, favorable government policies and regulation systems supported development of local shale infrastructure, advanced techniques and technology, especially hydraulic fracturing. In comparison with the United States, the natural conditions in Europe, in terms of geology, topography and water abundance, are more complicated [
31]. Additionally, local hostility and lack of acceptance by the population, due to concerns about extreme environmental and health risks, has appeared in many places where attempts have been made to exploit shale gas [
32]. Selected shale gas research approaches, with regards air pollutant measurements are listed in
Table 1.
The shale rock formation located in the Wysin area belongs to the Baltic-Podlasie-Lublin Basin. This is the largest unconventional gas reservoir in Poland. According to the most reliable estimations, it contains 346–768 × 10
9 m
3 of recoverable shale gas resources (on average four times more than the documented conventional gas resources in Poland) with a maximum of 1.92 × 10
12 m
3 [
34]. The shale gas exploratory activities in Poland began a few years ago. The first horizontal drilling was performed in 2011 near the Łebień village in the Pomeranian voivodeship (about 90 km from Wysin). According to a series of measurements of potential air pollution indicators (SO
2, NO
x, CO, C
6H
6, and H
2S) made in Łebień by the Regional Inspectorate for Environmental Protection in Gdańsk, no exceeding of the acceptable level of air pollution were observed [
35].
This study covers two- years (from August 2015 to July 2017) of continuous observation of the main atmospheric air pollutants (CO, O3, PM10, NO, NO2, and NOx), as well as pollutants directly associated with shale gas exploration activities, such as drilling and hydraulic fracturing (CH4, NMHC, and CO2), from the Stary Wiec station located in the village of Wysin, about 1 km from the borehole area. The measurement campaign was performed within a framework of the SHEER (Shale gas exploration and exploitation induced risk) project realized under the Horizon 2020 program. The main goal of this work was to present the variation in air pollutant levels at different stages of the natural gas extraction activities and to indicate the potential impact of shale gas exploration activities on the air quality in relation to background levels. For this purpose, a number of statistical analyses were performed: indication of average pollution concentration in different time scales, estimation of high pollutant concentrations, determination of episodes with a particular emphasis on pollutants directly linked to shale gas exploration, and comparison of results obtained at the Stary Wiec station with those from neighboring stations.
2. Materials and Methods
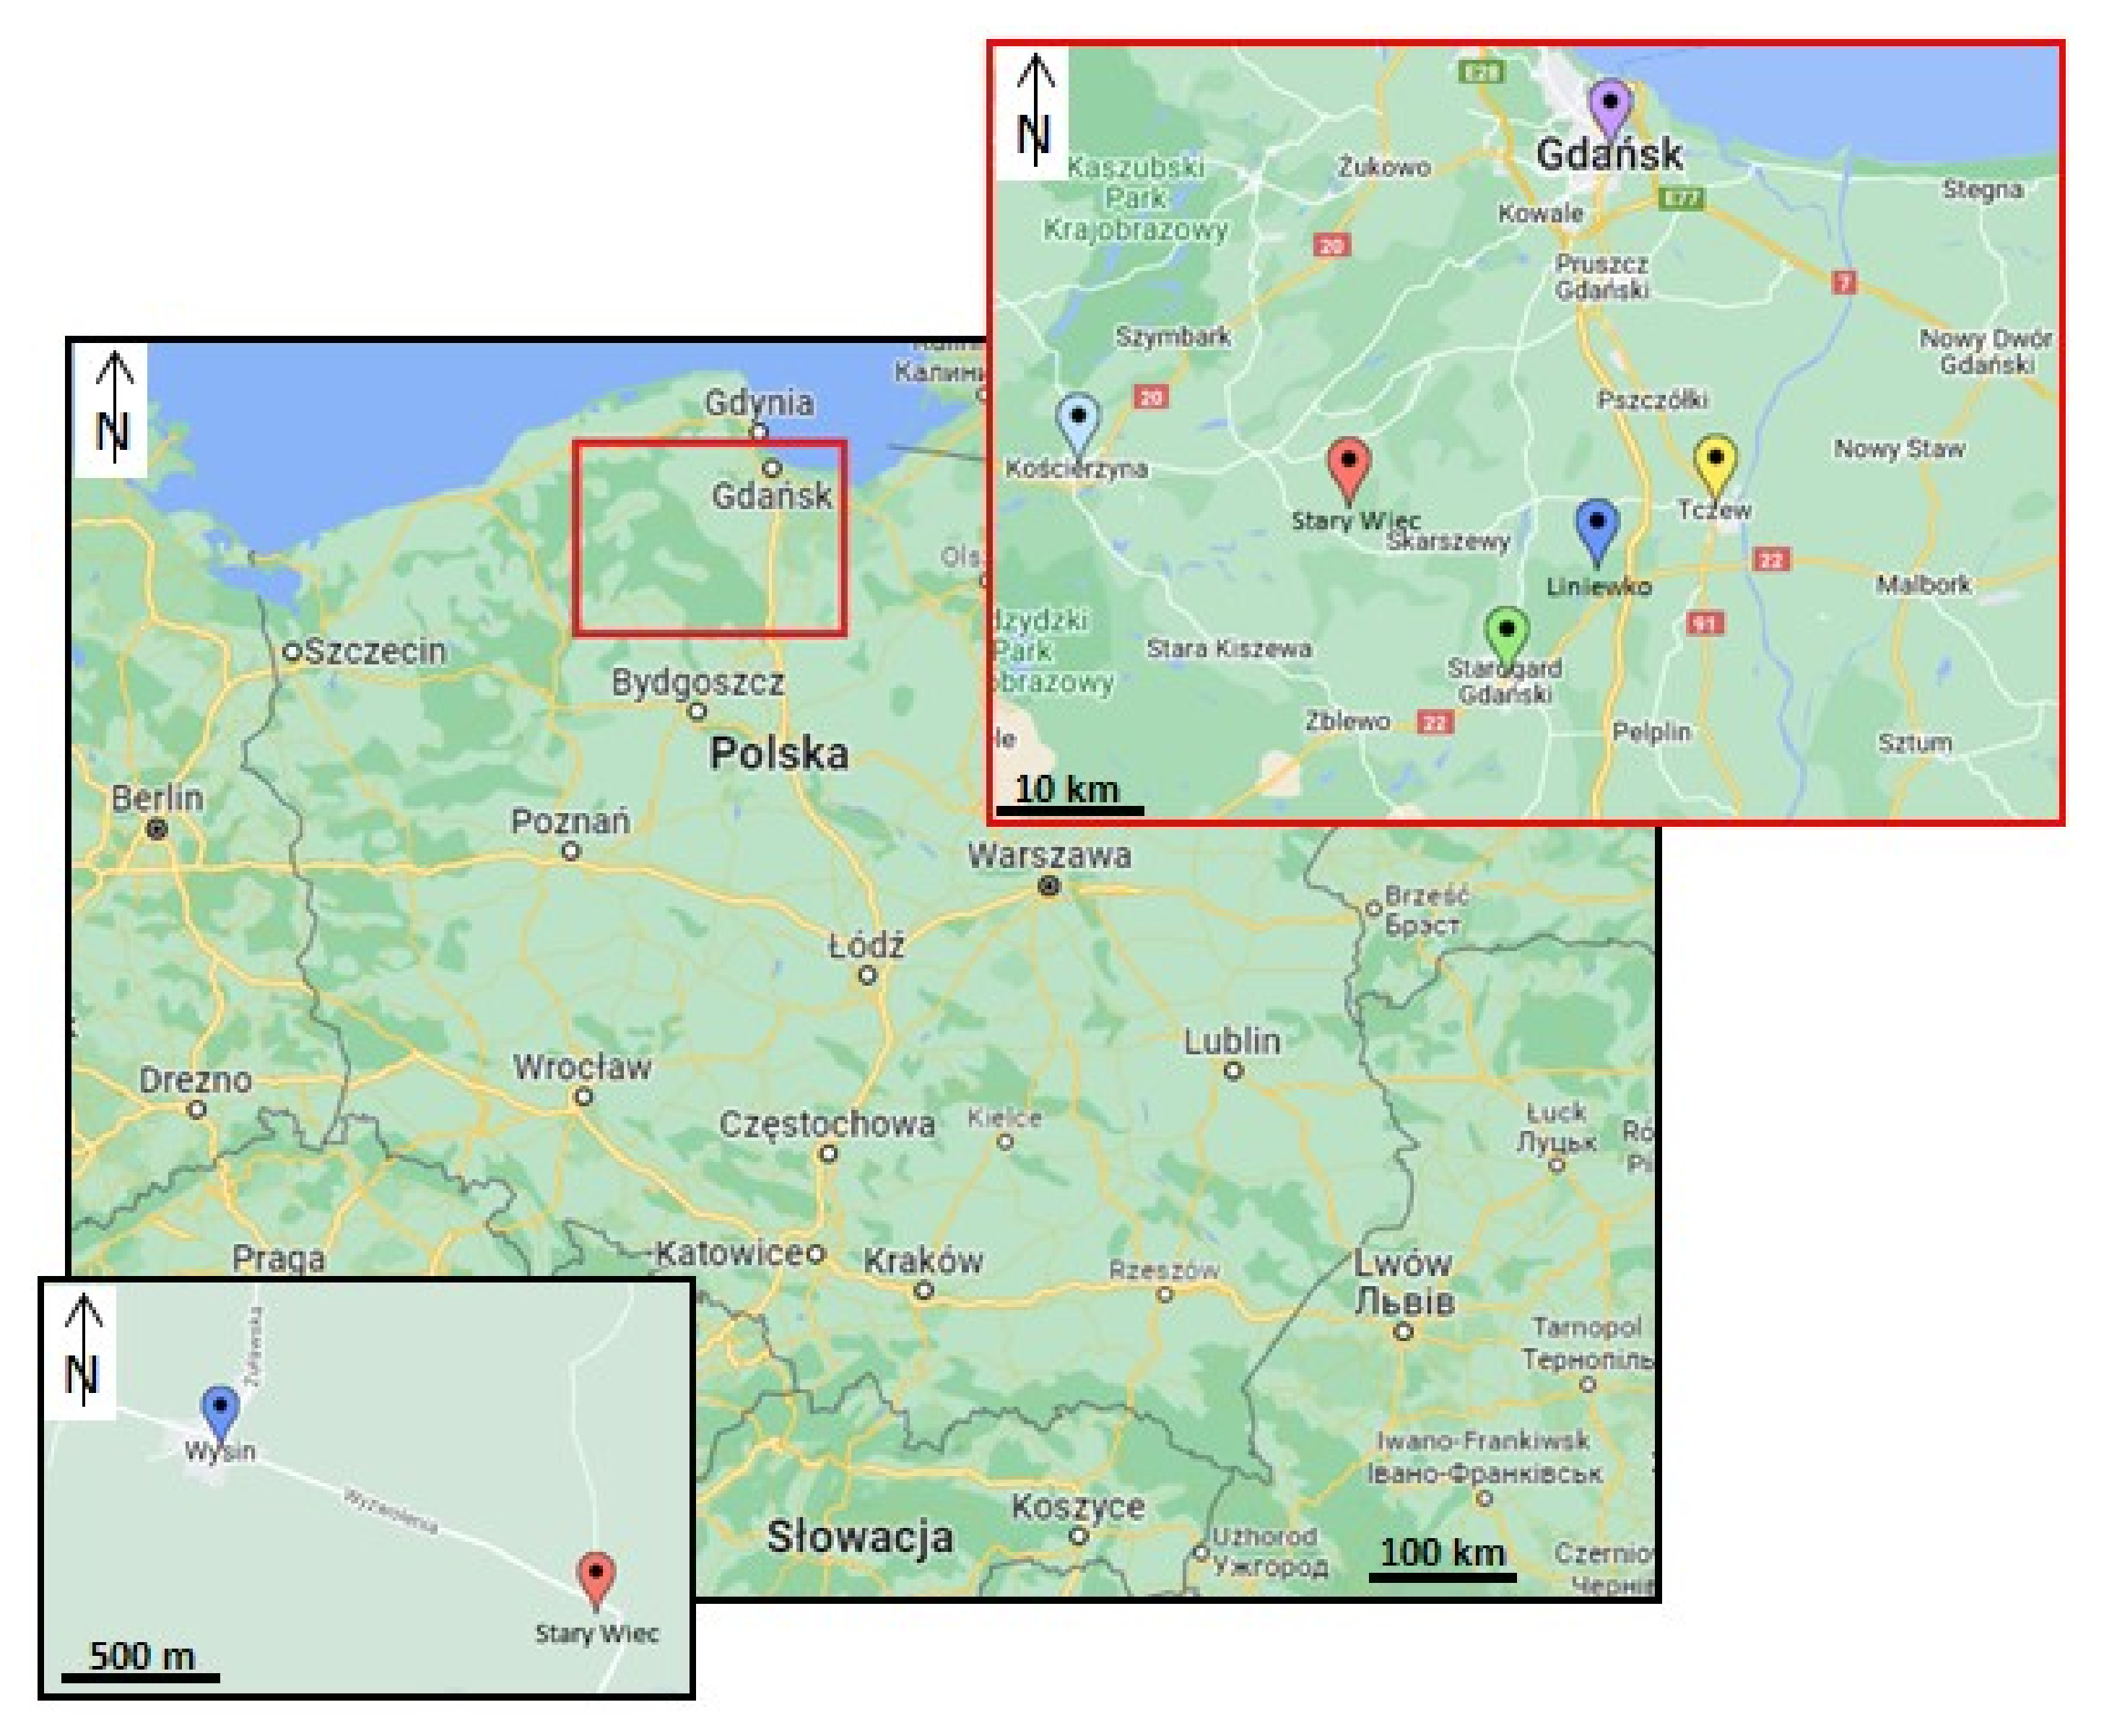
An air pollution monitoring station was set up in the small village of Stary Wiec (54.1° N, 18.3° E, 170 m a.s.l.), the closest inhabited place to the boreholes. The distance between the wells area and the station was approximately 1100 m. (
Figure 1).
Location of the station relative to the wells considering the prevailing wind directions in this region. Approximately 55% of the winds originated from the western directions during the measurement campaign. Moreover, only for 0.8% of the measurement time was the wind speed less than 1 m/s. In this situation, the possible emissions of air pollutants from the drilling site had a good chance of being recorded by the measuring equipment installed at the station. The closest vicinity of the station is dominated by small villages with a population of up to 600 inhabitants. The nearest small town (Skarszewy), with a population of more than 7000, is located 8 km east of the station. Local anthropogenic sources of air pollution were small and typical for rural conditions: several neighboring houses and a small local road located 50 m from the station. Residential buildings mainly included single family houses heated by coal- and wood-burning stoves and several multifamily houses connected to the heat distribution networks. The measuring station was located in the northwest part of the village. In the immediate vicinity of the station, there was a closed pig farm. Since the pig farm was nonfunctional, it had no effect on the level of pollution in the vicinity of the station. During the westerly winds (which prevail in this region), when there was an inflow of air from the direction of the borehole area, the combustion processes in these houses had no significant effect as they are on the leeward side of the station. The road was occasionally used, with traffic of a dozen cars per hour. Additional heavy traffic, related to activities at the wells area, occurred during the period of exploitation of the wells. In addition, a park with a small pond located in the vicinity of the station was a potential natural source of gases, such as CO
2 and CH
4. The surrounding landscape was dominated by farmlands and small forests. The nearest significant urban sources of air pollution were located at a distance of 25–50 km from the station (see
Figure 1).
The station’s container was equipped with a standard set of analyzers measuring concentrations of the air pollutants: NO, NO
2, NO
x (sum of NO and NO
2), CO, O
3, and PM10. Gaseous pollutants were measured by the API analyzer, models 200, 300, and 400, while PM10 concentration was measured by a TEOM analyzer, model 1400. This standard air pollution monitoring measurement program was extended by measurements of the concentration of CO
2 using a Thermo 410i analyzer and concentrations of CH
4 and NMHC (sum of NMHCs) with a Horiba APHA370 analyzer. Technical specifications of the analyzers employed during the measuring campaign are listed in
Table A1 in the
Appendix A. Meteorological parameters were recorded by a collocated automatic weather station.
To ensure adequate data quality, i.e., total measurement uncertainty less than 15% in accordance with the requirements used in air quality monitoring networks in Poland, standard quality assurance procedures analogous to those routinely used in air pollution monitoring networks were applied during measurements, including regular calibrations with certified gas mixtures and a certified photometer (in the case of ozone), data verification and validation, and regular control of, and servicing of, analyzers and container systems. Instantaneous values of all pollutants’ concentrations were converted into 1-h averages, and these averages were used for further analysis.
The measuring campaign in Stary Wiec covered a wide range of air pollutants, both main gaseous pollutants measured as standard at state air quality monitoring stations (NO, NO2, NOx, CO, O3, PM10) and, additionally, those directly related with shale gas related activities (CO2, CH4, NMHC). The measurements were performed continuously for two years, from August 2015 to July 2017. This long period of uninterrupted measurements ensured detection of possible air pollution episodes related to all stages of the life cycle of wells: preparatory phase, drilling, hydrofracturing, and closing activities. Additionally, 24 months of monitoring covered two full seasonal cycles, which was important for identifying the natural local variability of each pollutant and possible local sources of pollution not related to the wells’ activities, thus allowing the determination of the background values of each analyzed pollutant. In this work we investigated the shale gas industrial development in a rural area in the North of Poland in terms of accompanying air pollutants and GHGs emissions. In this connection, the analysis of the potential impact of activities related to shale gas exploration and exploitation processes on ambient air quality, in the context of environmental protection and the local community, was performed. The comparative analysis of pollutant concentrations during an entire work cycle of the wells (as well as in the period before and after), taking into account meteorological conditions, was considered in terms of the following: (1) whether the National ambient Air Quality Criteria were exceeded (2) occurrence of peaks and deviations from the background values (3) comparison concentrations of all pollutants during different shale gas operation life cycles (drilling and hydrofracturing) relative to the reference period (in this article defined as a remaining period). In order to perform this, we first used the data on the levels of air pollution and meteorological conditions from several of the nearest (7 to 30 km) stations to the regional air pollution monitoring network to assess air quality in the region before and during the measurement campaign. The analysis of the measurement data (from 2012 to 2017), presented in
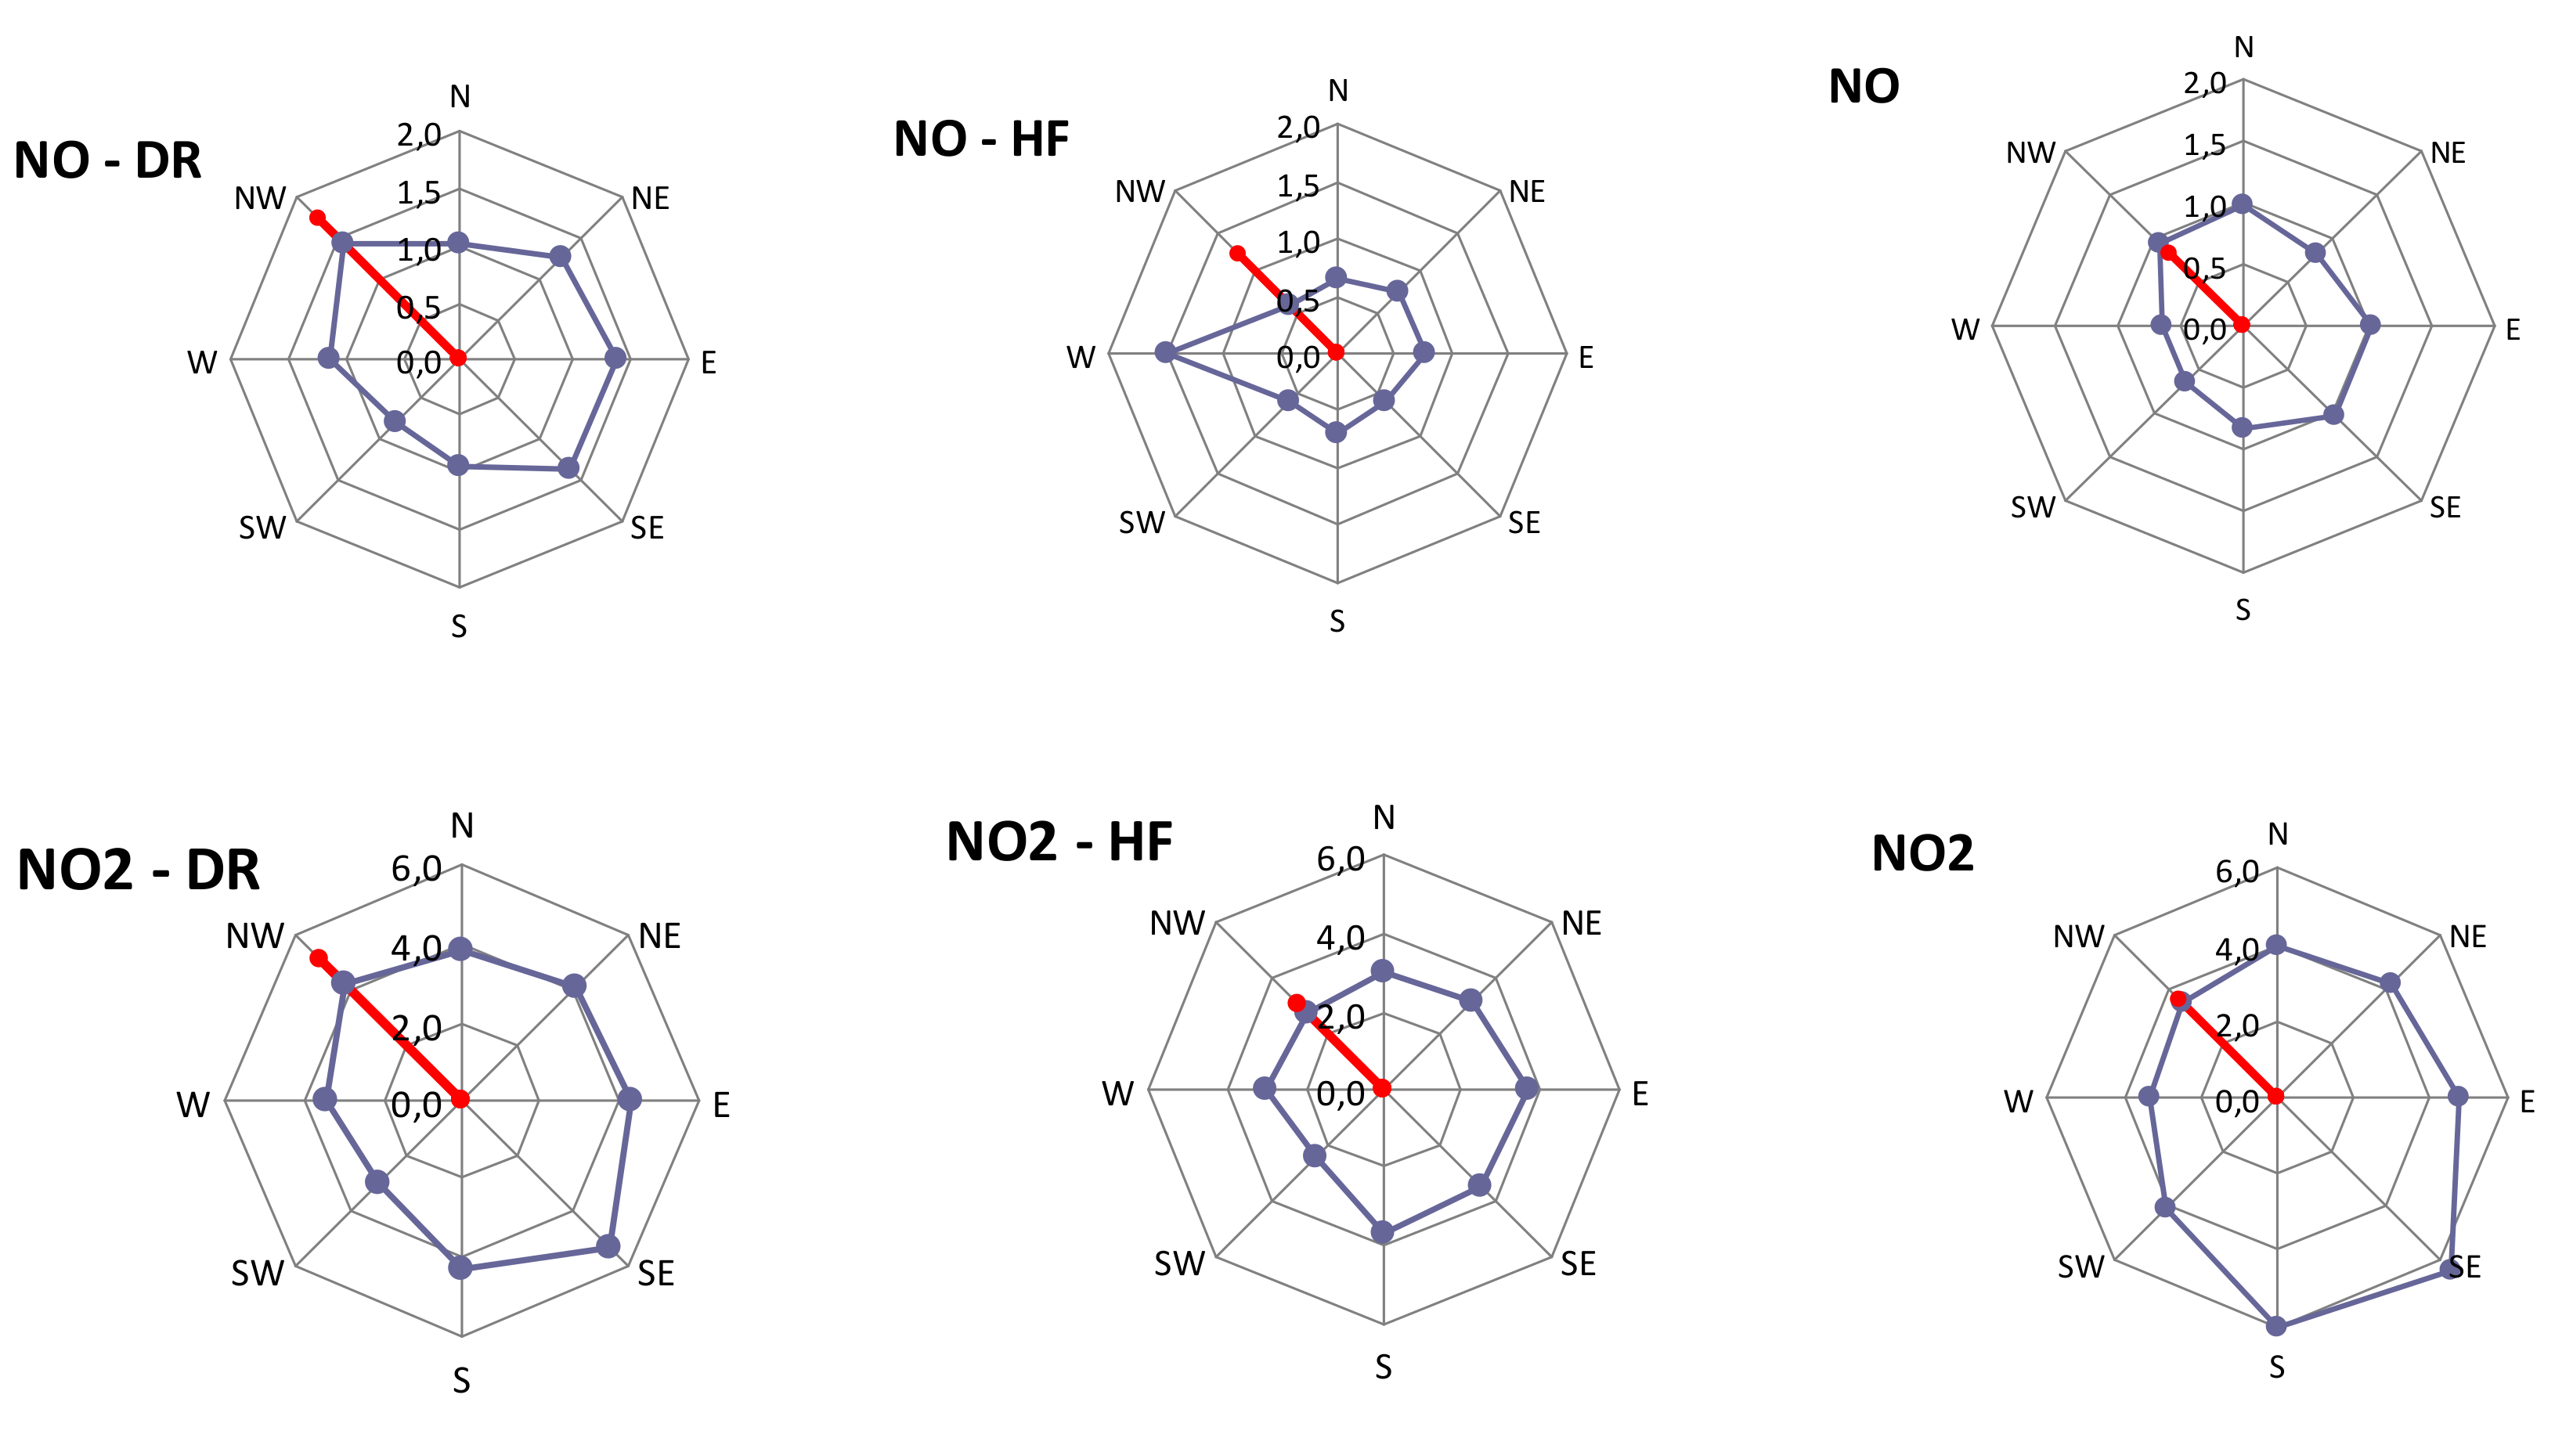
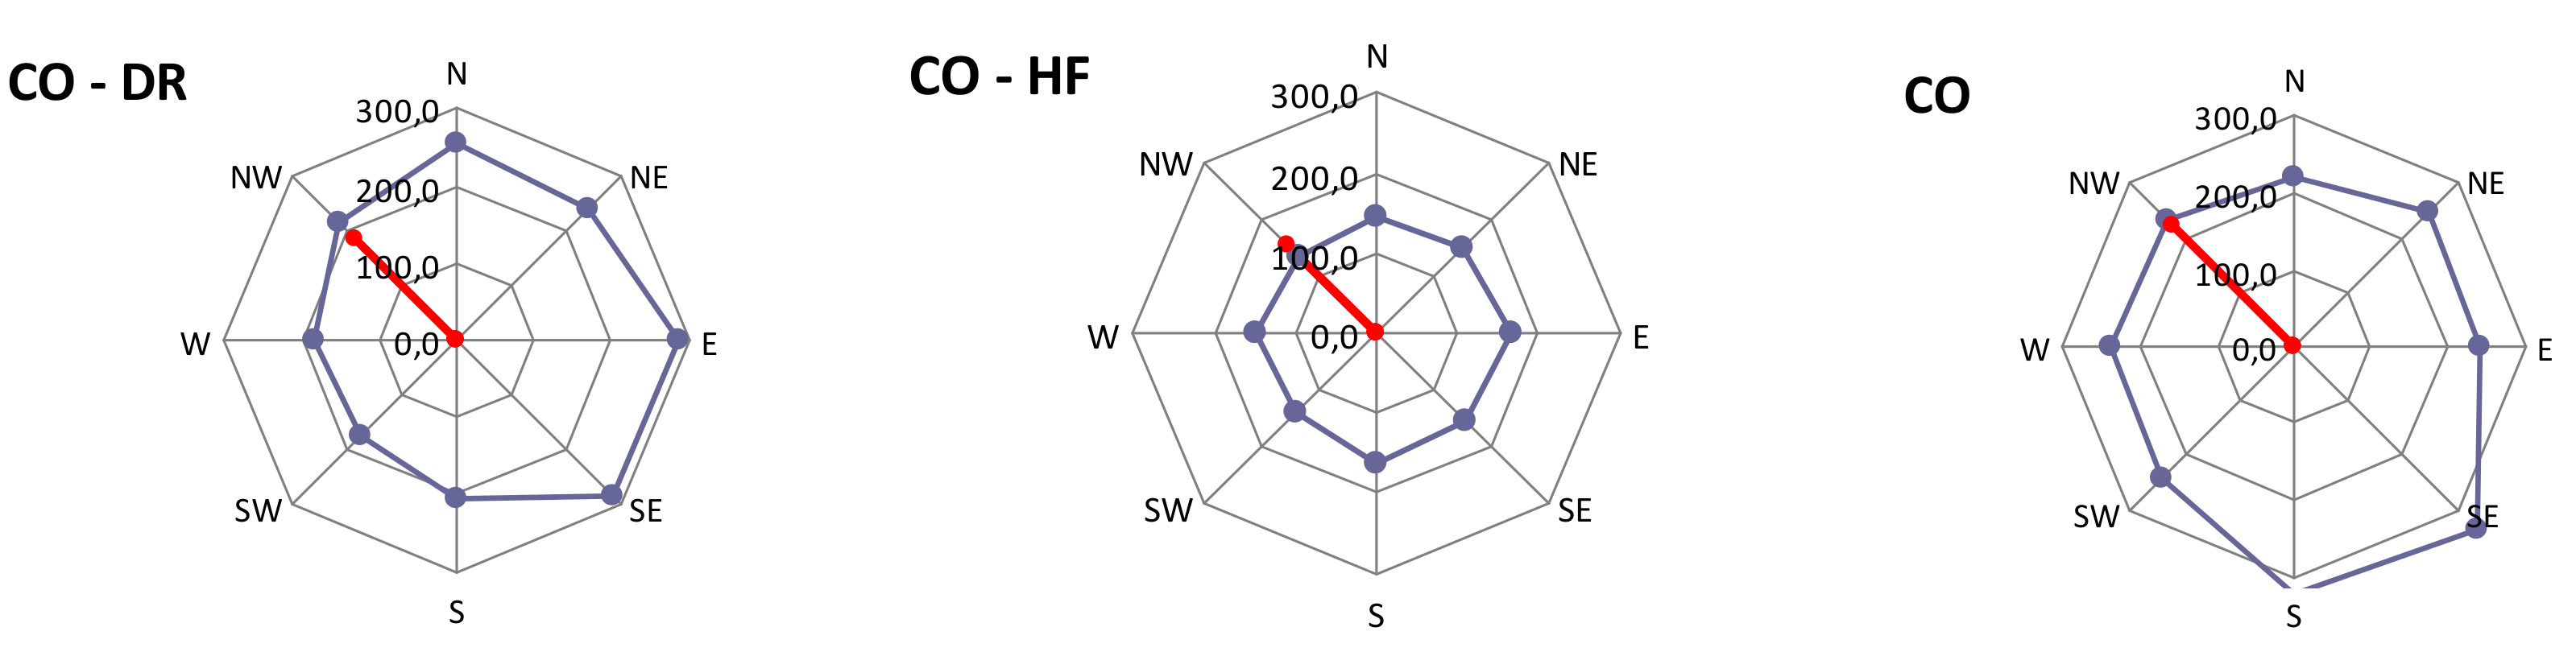
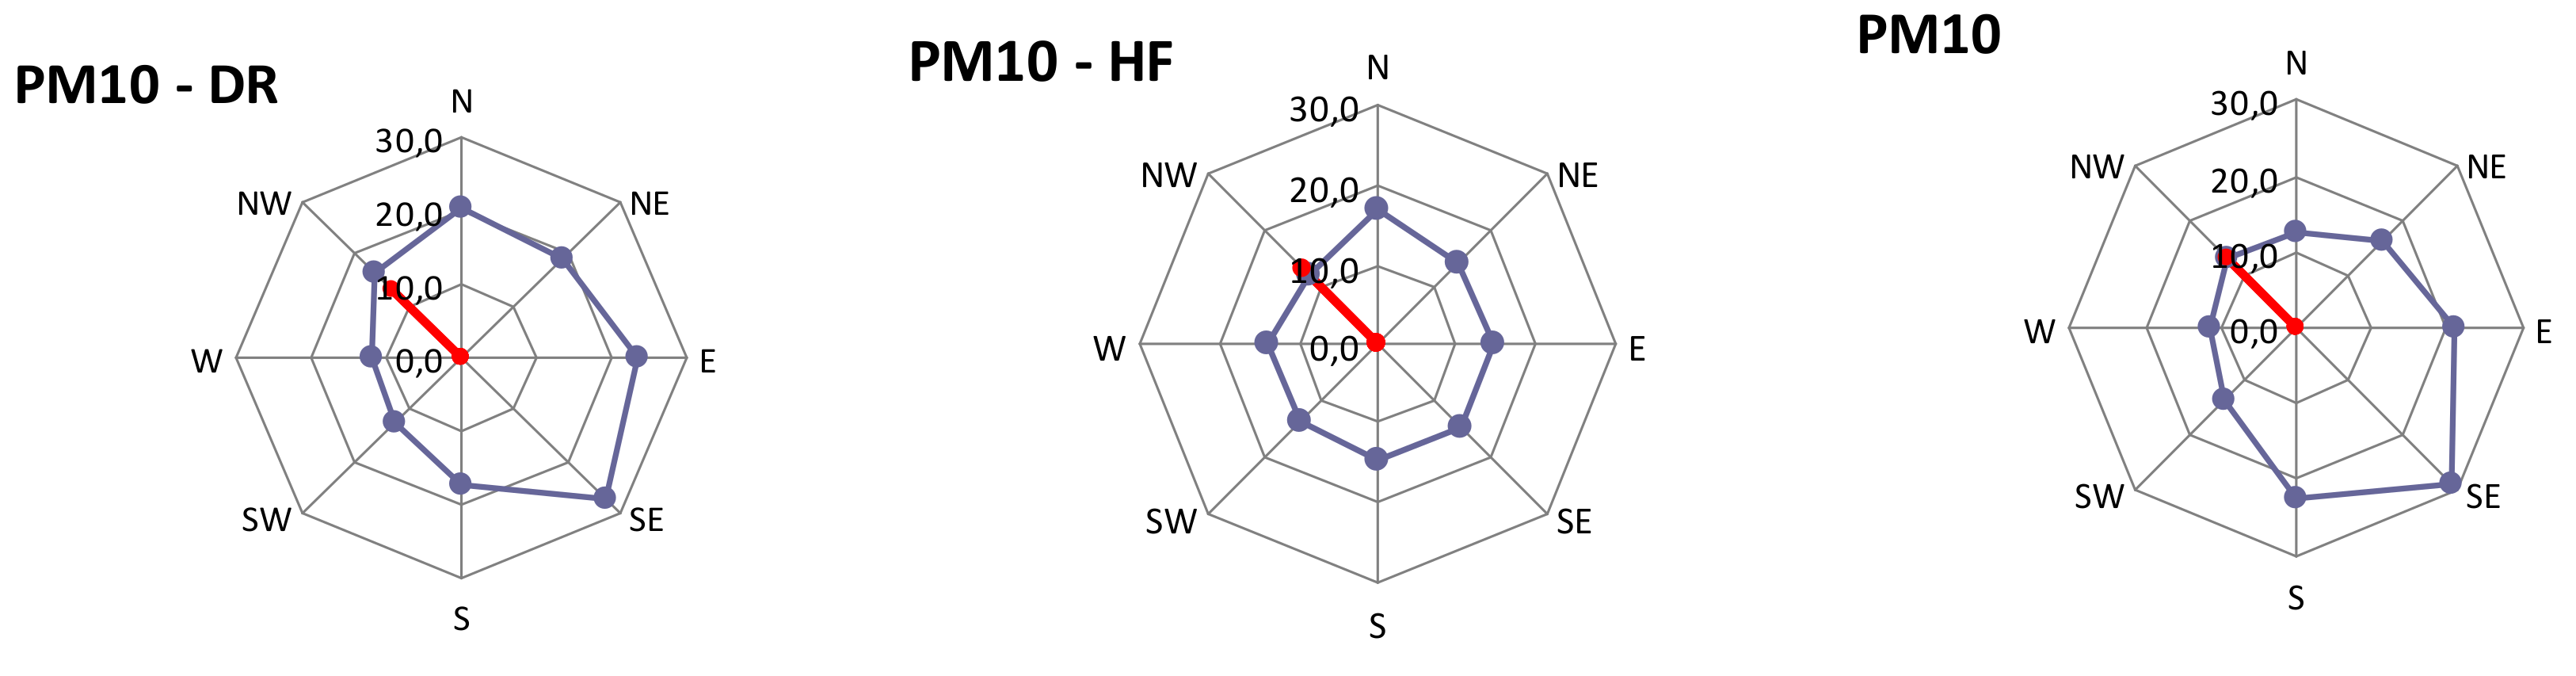
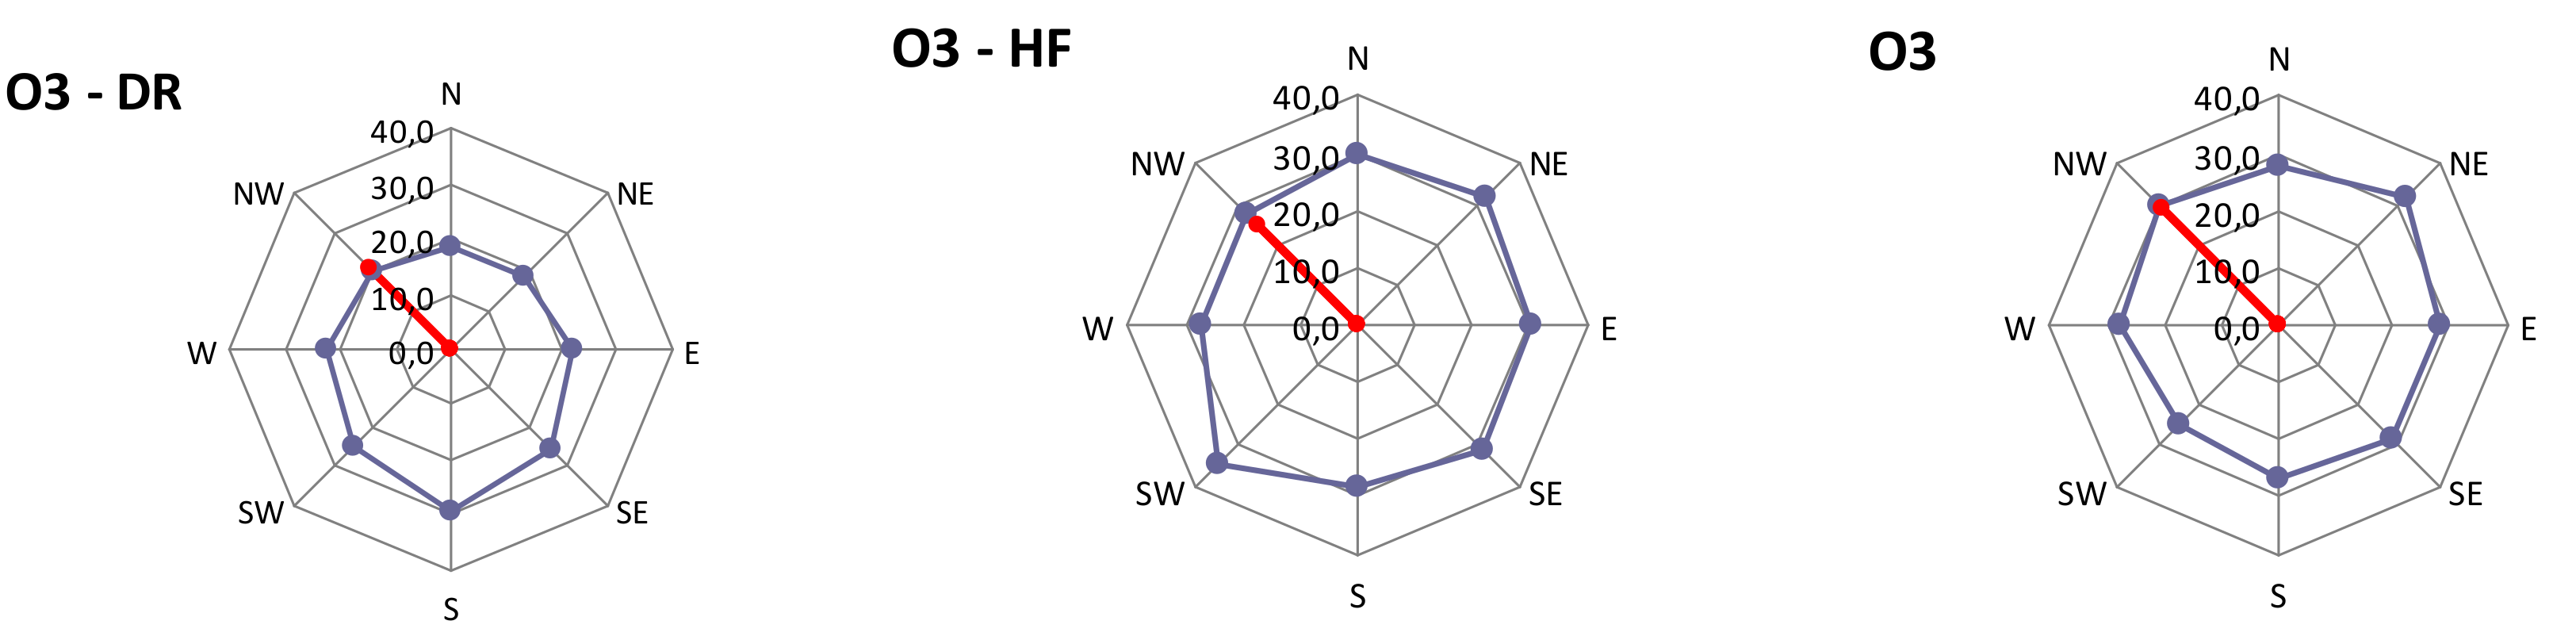
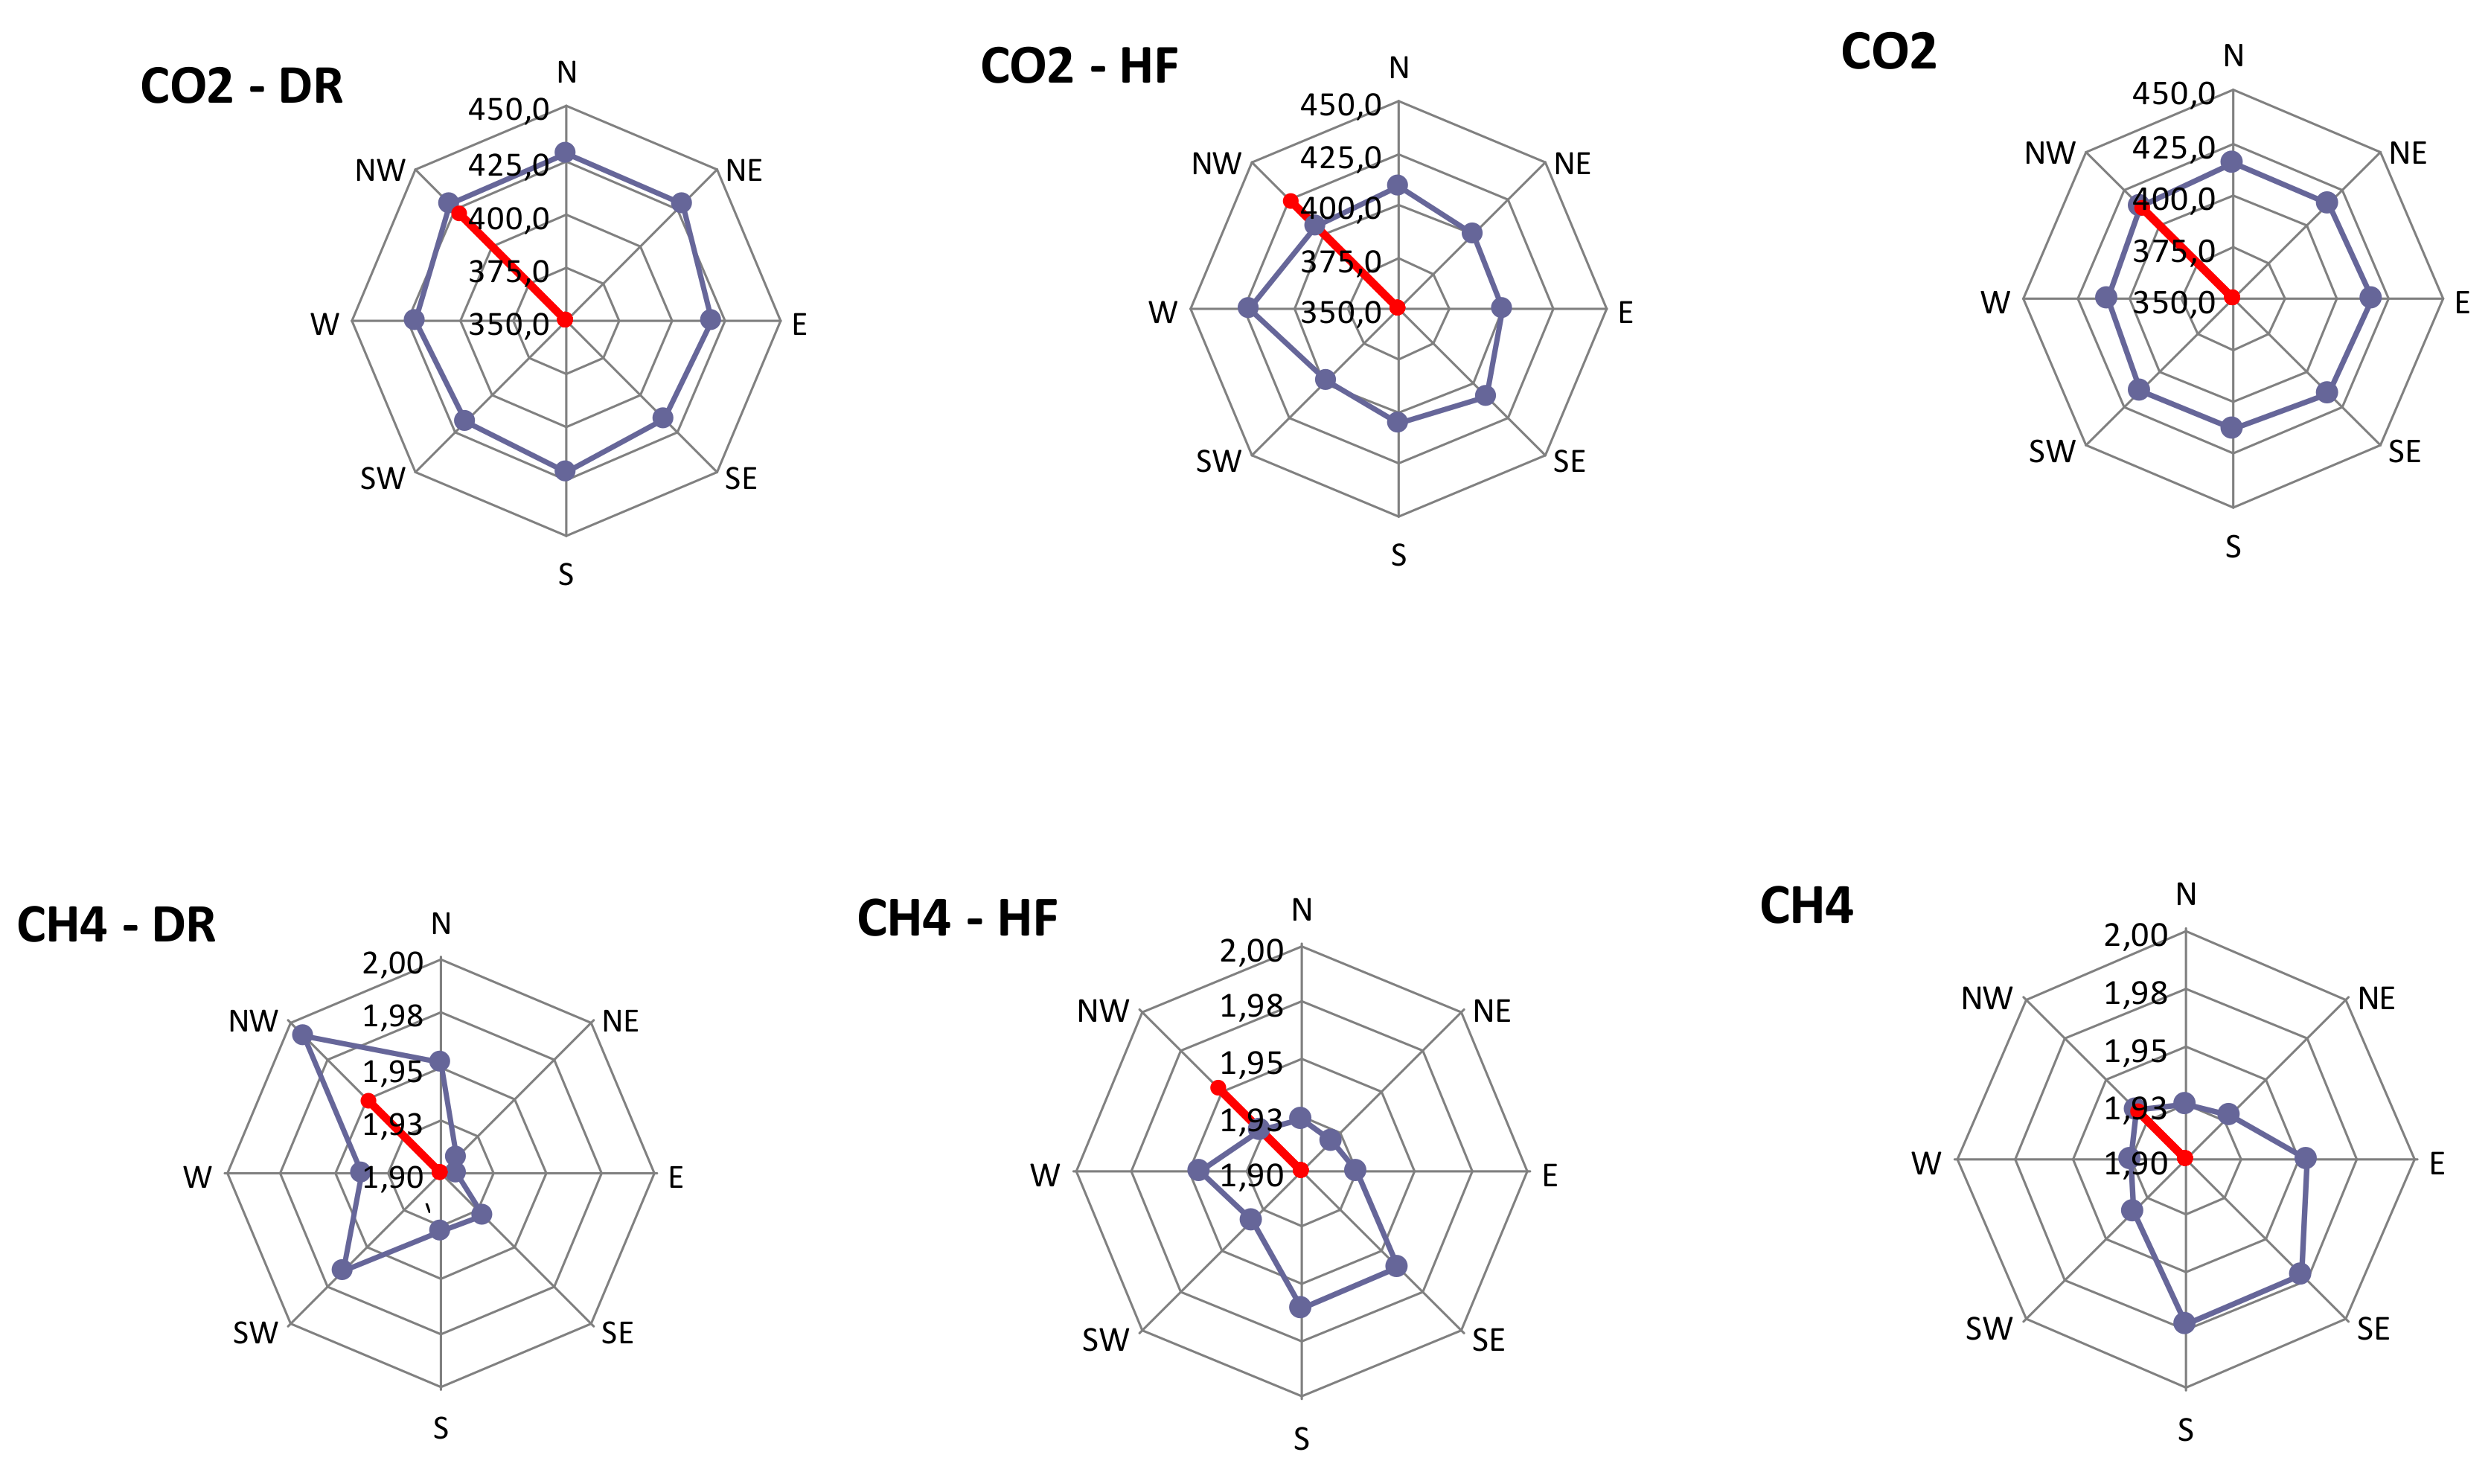
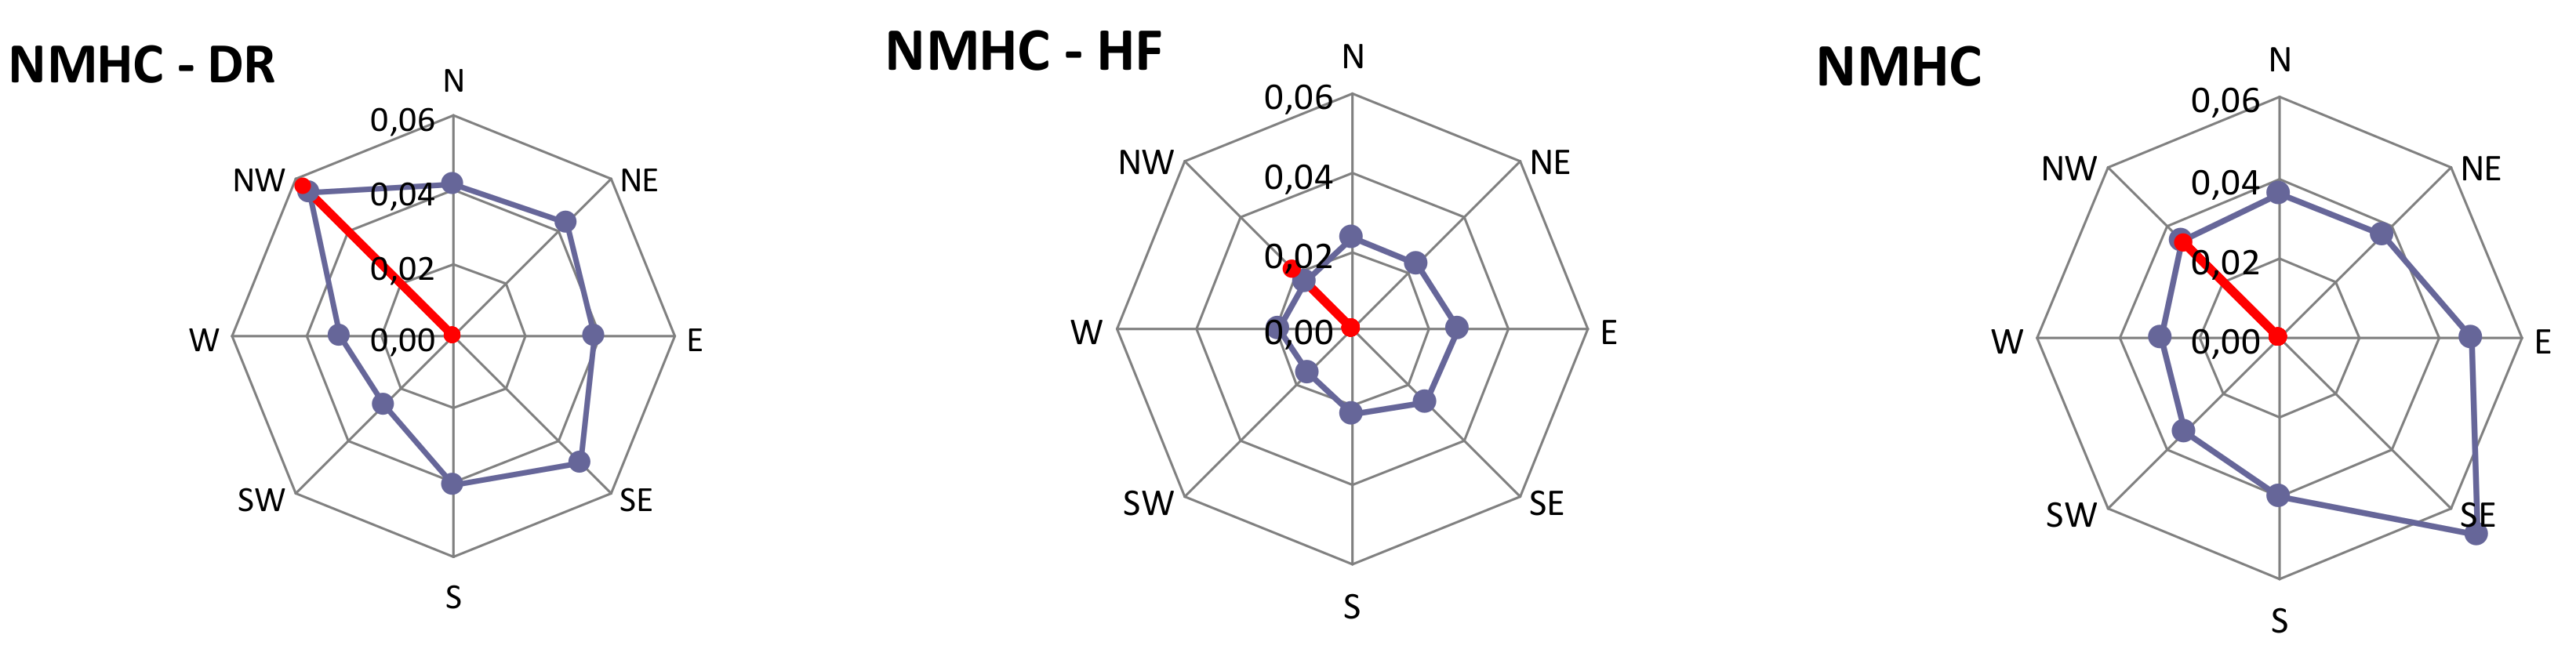
Figure 2, indicated the lack of significant difference in ambient air pollutants between the baseline period (2012–2014) and the period of intensive activity in the shale gas area (2015–2017). To enable the estimation of the potential impact of shale gas exploration on air quality, an examination on the influence of wind direction on the measured mixing ratios of each pollutant was performed (
Figure A1,
Figure A2,
Figure A3,
Figure A4 and
Figure A5 in
Appendix A). Air pollution data were assigned to one of eight wind direction compartments (N, NE, E, SE, S, SW, W, NW) depending on the phase of activity at the area of the wells. Furthermore, an additional compartment for wind coming directly (±5°) from the borehole area was determined. Wind rose graphs were used to present the amounts of pollutants averaged for each sector of the wind and to compare these with the amounts estimated for the wind coming directly from the shale gas site. To determine whether or not the air quality standards for human health and plant protection were met the compliance of NO, NO
2, CO, O
3 and PM
10 with the Air Quality Directive was evaluated. Finally, diurnal and seasonal analyses of CH
4, NMHC and CO
2 as the gases directly related to shale gas operations were carried out (
Figure 3). The detailed analysis of the high temporal resolution data revealed the existence of episodes of elevated concentrations of CH
4 and NMHC registered in the period 1–4 September 2016 (
Figure 4). To determine the origin (artificial or biogenic) of high GHGs concentration calculations of CO
2/CH
4 ratio were performed (
Figure 5). Additionally, statistical analysis of episodes recorded for the period 1–4 September 2016, based on correlation coefficient,
p-value and CH
4/NMHC ratio values, was performed to confirm whether or not the shale gas related emissions were a potential source of episodes of elevated concentrations of CH
4.
3. Results
3.1. Analysis of Measurement Results from the Regional Network of Air Pollution Monitoring
Measurement results of pollutants, namely NO, NO
2, CO, O
3, and PM10, from the five nearest air pollution monitoring stations, namely, Gdańsk, Starogard Gdański, Kościerzyna, Tczew (reflecting urban background conditions), and Liniewko Kościerskie (reflecting rural background conditions), were used for the general assessment of air quality level in the region before starting any activities related to shale gas exploration and during the measurement campaign in Stary Wiec. Data from the period 2012–2017 were used for the analysis. Results of the available measurements (monthly means) for primary (NO) and secondary (O
3) pollutants are shown in
Figure 2.
The analysis of data revealed distinct natural seasonal and year-to-year variations in concentrations of all measured air pollutants in the region. This variation resulted especially from changes in meteorological conditions during the year and changes in emissions from local anthropogenic sources (e.g., traffic and heating systems of buildings in the winter). The period 2015–2017 did not differ from previous years in terms of concentrations of individual pollutants (see
Table A2 in the
Appendix A). Statistics of pollutant levels measured at Stary Wiec and at nearby rural and urban stations during the measurement campaign are presented in
Table 2.
Air pollutant levels measured in Stary Wiec were representative of a clean, rural environment. Very low, close to zero, levels of NO, a pollutant with a lifetime of approximately 1 h, indicated the lack of significant engine exhaust type sources of air pollution in the vicinity of the station. Pollutants such as CO, NO
2, and PM10 were the lowest, or one of the lowest, in the region during the measurement period. However, the levels of the secondary pollutant O
3 were at a relatively high level, which is a known typical phenomenon for rural areas [
36]. Higher O
3 concentrations at rural stations than at urban stations are due to less efficient mechanisms for O
3 destruction [
37], the most important of which is the lack of efficient NO emission sources that can reduce the reactions of O
3 destruction (NO+O
3→NO
2+O
2). Most episodes of elevated pollutant concentrations registered at the Stary Wiec station during the 2015–2017 period resulted from regional scale phenomena, such as favorable meteorological conditions or transport of pollutants from regional sources, e.g., large cities of the Pomeranian Voivodeship.
3.2. Analysis of Air Pollutant Measurement Results from Stary Wiec Station
As described in
Section 1, there were no significant sources of air pollution in the immediate vicinity of the station; hence, it can be assumed that the levels of pollutants in the area of the station were largely due to their transportation to the place of measurement from more distant source areas. Thus, pollutants emitted in the Wysin wells area could have been registered by the station’s equipment if they were transported to the sampling point when favorable wind conditions occurred.
To assess the possible impact of pollutant emissions from the wells area on the ambient air quality in the vicinity of the station, an analysis of the distribution of air pollutant concentrations recorded at the station, depending on wind direction, was performed. For this purpose, the average concentrations of individual air pollutants were calculated for eight wind direction compartments. In addition, the average concentrations of pollutants for wind blowing directly (±5°) from the wells were determined. The measurement time was divided into three periods in accordance with the actions taken at the boreholes: the drilling period (September–October 2015), the hydrofracturing period (June–July 2016), and the remaining period of measurements (August 2015–July 2017, excluding drilling and hydrofracturing periods).
Significance of differences between the average values of concentrations of pollutants from the NW (north-west) sector and for air originating directly from the well was confirmed by the F-test (to determine whether the analyzed samples were characterized by equal/unequal variance) and the Student’s
t-test with two samples assuming equal or unequal variances (to determine whether the differences of mean values in two analyzed samples were statistically significant at the significance level of 0.05). Results are shown in
Table 3.
Measurement results are shown in
Figure A1,
Figure A2,
Figure A3,
Figure A4 and
Figure A5 in the
Appendix A. These figures show the dependence of the concentrations of pollutants on the wind direction for a previously defined period. It can be observed that the cleanest air conditions occurred during advection of air from the western directions, while the highest levels of pollutants appeared while air was coming to the measuring point from the east or south. This situation roughly corresponded to the distribution of sources of air pollution around the measurement site. Cleaner air coming from the West was often of North or West Atlantic origin, while the air from the eastern sectors, mainly of continental origin, passed over relatively close significant sources of air pollution (several larger cities and the motorway located nearby) on its way to the measuring point.
During the low activity period in the wells area, the concentrations of air pollutants registered at the Stary Wiec station did not increase significantly when direct transport from the area of the wells occurred, in comparison to that when the air was coming from the entire NW sector. The relative differences in concentrations were small, in the order of a few percent (up to 5%), except for NO (−13%). For most air pollutants, nonsignificant changes in concentrations were recorded in the air coming directly from the well region as compared to their average values for the whole sector. Significantly lower values were only recorded for O3; however, the absolute differences remained very small (approximately 1 ppb).
A different situation occurred during the periods of increased activity at the wells, especially during hydrofracturing. Most of the pollutants occurred in lower concentrations during this period, because of natural seasonal variation. Hydrofracturing was performed in the summer, when the levels of air pollutants (except for O3) were usually at the lowest of the year. However, the levels of some of the pollutants in the air arriving at the measurement point directly from the wells area increased significantly according to the t-test results, compared to the average values registered at the same time for the air coming from the NW sector during the hydrofracturing period. A significant relative increase (108% and 18%) occurred for NO and CO, respectively. Increase in the levels of NO2 (12%), PM10 (7%), and NMHC (21%), although not statistically significant, were also detected. All the aforementioned pollutants were the components of engine exhausts. Therefore, an observed increase in air pollution levels could be the result of intense work of, for example, the pump systems. Moreover, smaller (by 11%) levels of O3 observed simultaneously with higher NO concentrations confirmed this hypothesis, as O3 levels are usually anti-correlated with NO levels, especially when close to the source of emission, because of chemical reactions occurring between them. Slight increases in the concentrations of CH4 and CO2 were also detected.
For the drilling period, the results were ambiguous. A statistically nonsignificant increase in NOx (by approximately 20%) occurred. However, for the other pollutants, the concentrations were usually lower than the average for the NW sector, up to 19% lower for PM10. In two cases, those relating to PM10 and CH4, the lower values were statistically significant.
The analysis of the above results showed that, despite a relatively high increase in the concentrations of some pollutants during the hydrofracturing period, their absolute concentrations remained at a very low level; for example, 1.2 ppb for NO or 5.0 ppb for NO
2, during the hydrofracturing and drilling periods, respectively. Thus, even in the periods of intense activity at the boreholes, the air in the vicinity of the Stary Wiec station remained relatively clean. The analysis of compliance with the Air Quality Directive applicable to the pollutants (
Table 4) also showed that the relevant air quality criteria were met for most pollutants.
By analyzing the air quality standards for human health protection, it can be stated that during the two-year measuring period, most noticeable were the relatively high values in ambient O3 concentrations. The information target value was exceeded twice in August 2015. Although the air quality limit values for O3 were frequently exceeded during summer months, it should be noted that exceedances registered in the period 2015–2017 originated from episodes of a larger, regional scale, which were not related to works at the area of the wells. Permissible levels of the remaining pollutants (NO2, PM10, and CO) for the protection of human health were not exceeded.
3.3. Methane, NMHCs, and CO2 Concentration Measurement Results
The monitoring of CH
4, NMHC, and CO
2 levels was included into Stary Wiec station’s measurement program to track the possible emissions of these gases accompanying the exploration, and subsequent exploitation, of shale gas wells in Stary Wiec. The analysis of the data collected during the two years of measurements showed the existence of well-known seasonal (summer minimum and winter maximum) and diurnal (minimum during the day and maximum at night) cycles of CO
2 and CH
4 related to the activity of natural sources and sinks, namely photosynthesis and respiration of the biosphere for CO
2 and methanogenesis for CH
4. CO
2 is the basic substrate of the photosynthesis process occurring with the participation of light energy, most often solar energy. Photosynthesis processes are an important sink of CO
2 in the natural ecosystem during the daytime. In contrast, the processes of respiration of plants and soil are significant natural sources of CO
2 and contribute to its increase during the night (in the absence of photosynthesis). Methanogenesis is the process of biological formation of CH
4 during decomposition of organic compounds (e.g., acetate, formate, CO
2, hydrogen) by anaerobic microorganisms (mainly from the Archaea domain).
Figure 3 shows the results of measurements of diurnal variations of CO
2 and CH
4 performed over the entire experimental period.
Both gas species had similar, distinct diurnal distribution, characterized by maximum values during late night–early morning (02:00–04:00 for CO2 and 03:00–05:00 for CH4), followed by a gradual decrease, reaching a minimum around 12:00–16:00, and then a gradual increase through the evening and night until the maximum peak the next day. Thus, it can be stated that the concentration values of both gases (CO2 and CH4) were cumulated and constantly increasing in the afternoon through evening and night until an early morning maximum on the next day. The maximum values of CO2 varied between 431.5 ppm and 433.6 ppm, while the lowest value was around 399 ppm. Daily concentration values of CO2 were characterized by a very high amplitude in the summer months, with the maximum reaching around 100 ppm. Hence, high values probably resulted from the presence of important natural sources and sinks in the vicinity of the station (pond and park with deciduous trees). During winter, the amplitude values were almost negligible, oscillating around several ppm. The maximum values of CH4 increased to around 1.962 ppm, while the minimum dropped to 1.916 ppm. Stronger amplitudes of diurnal variation were noted during summer, with the maximum values in July 2016, reaching 0.125 ppm.
The mean values at Stary Wiec for the recording period of August 2015–July 2017 were 1.936 ± 0.064 ppm for CH
4, 414 ± 29 ppm for CO
2, and 0.039 ± 0.034 ppmc for NMHC. These levels were equal to, or slightly higher than, those reported for the Poland remote mountain region [
38,
39].
Concentrations of all three analyzed components in the air coming directly from the wells were higher than the average values for the NW sector in the hydrofracturing period, ranging from 1% for CH4 up to 21% for NMHC. However, this increase was not statistically significant. For the remaining period, the corresponding differences were below 1% for CH4 and CO2 and below 5% for NMHC.
Variability in CH
4 concentrations recorded at Stary Wiec was relatively small (standard deviation 0.06 ppm); hence, more attention was paid to the analysis of episodes of elevated CH
4 concentrations, as potentially coming from the wells. The highest concentration of CH
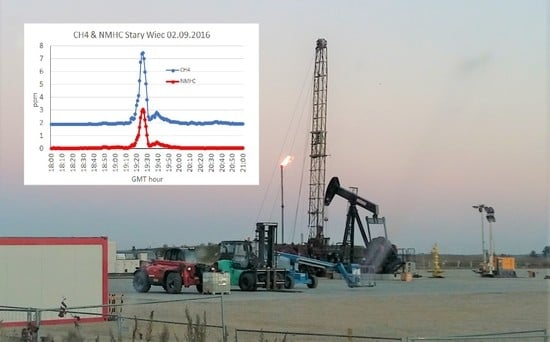
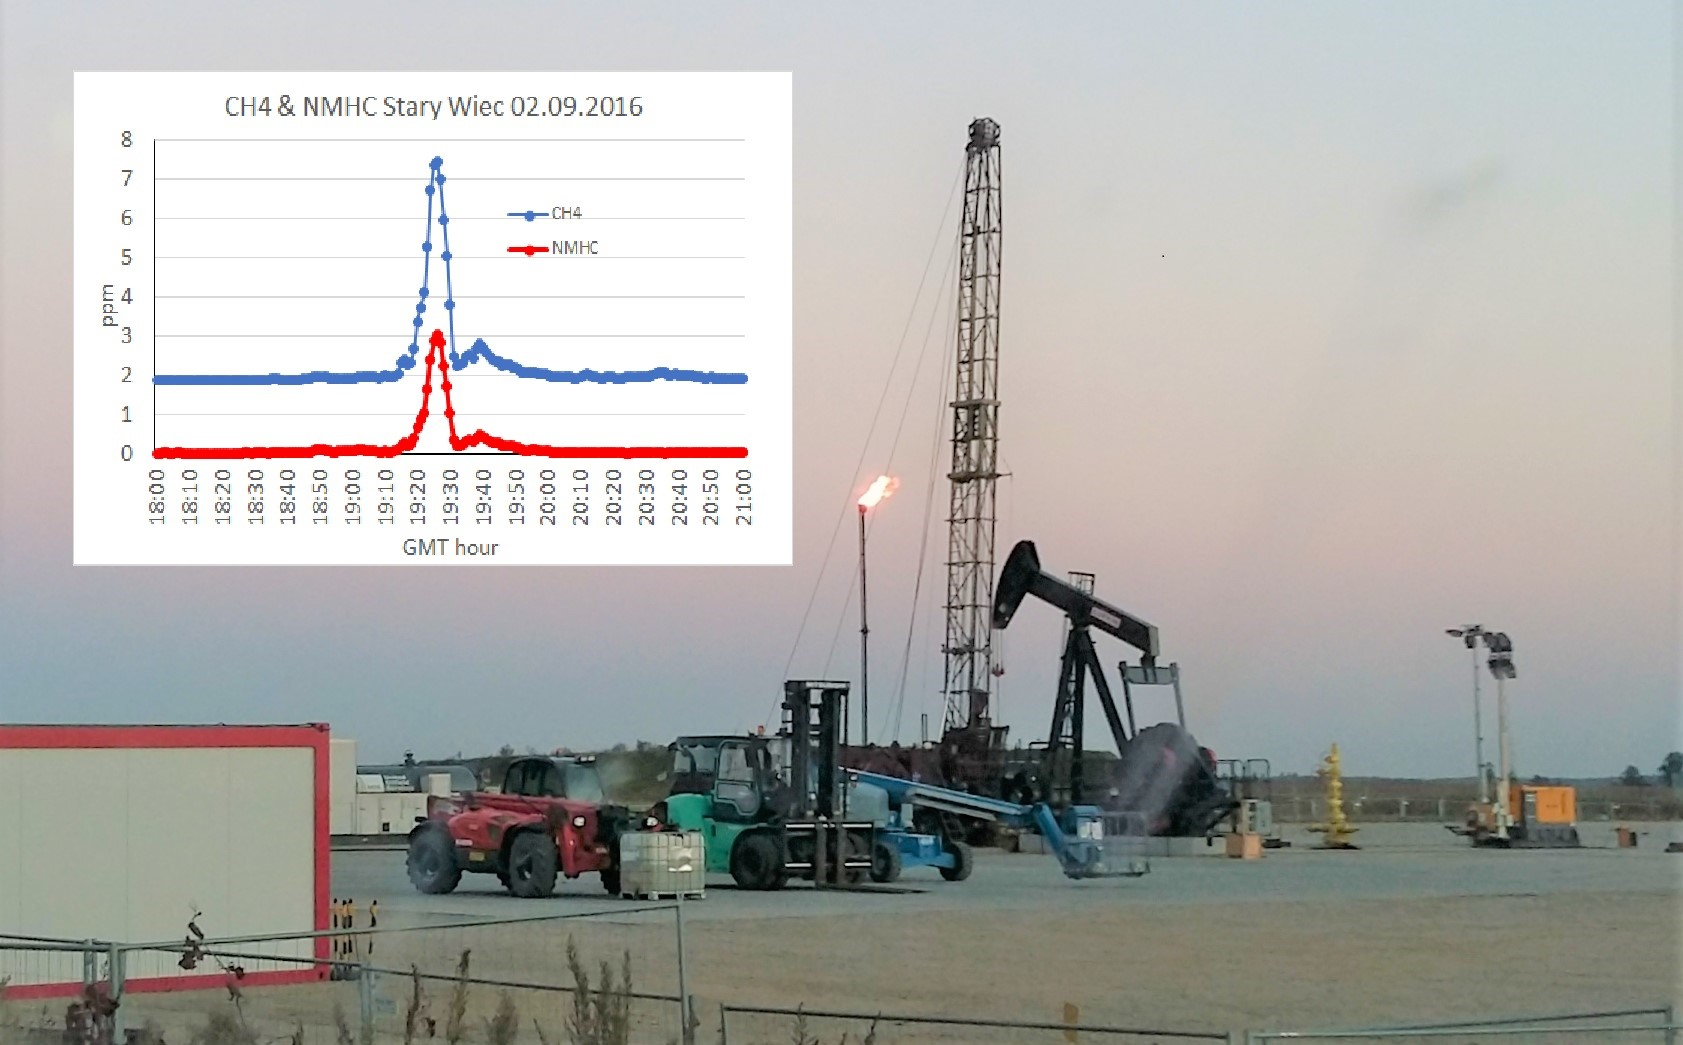
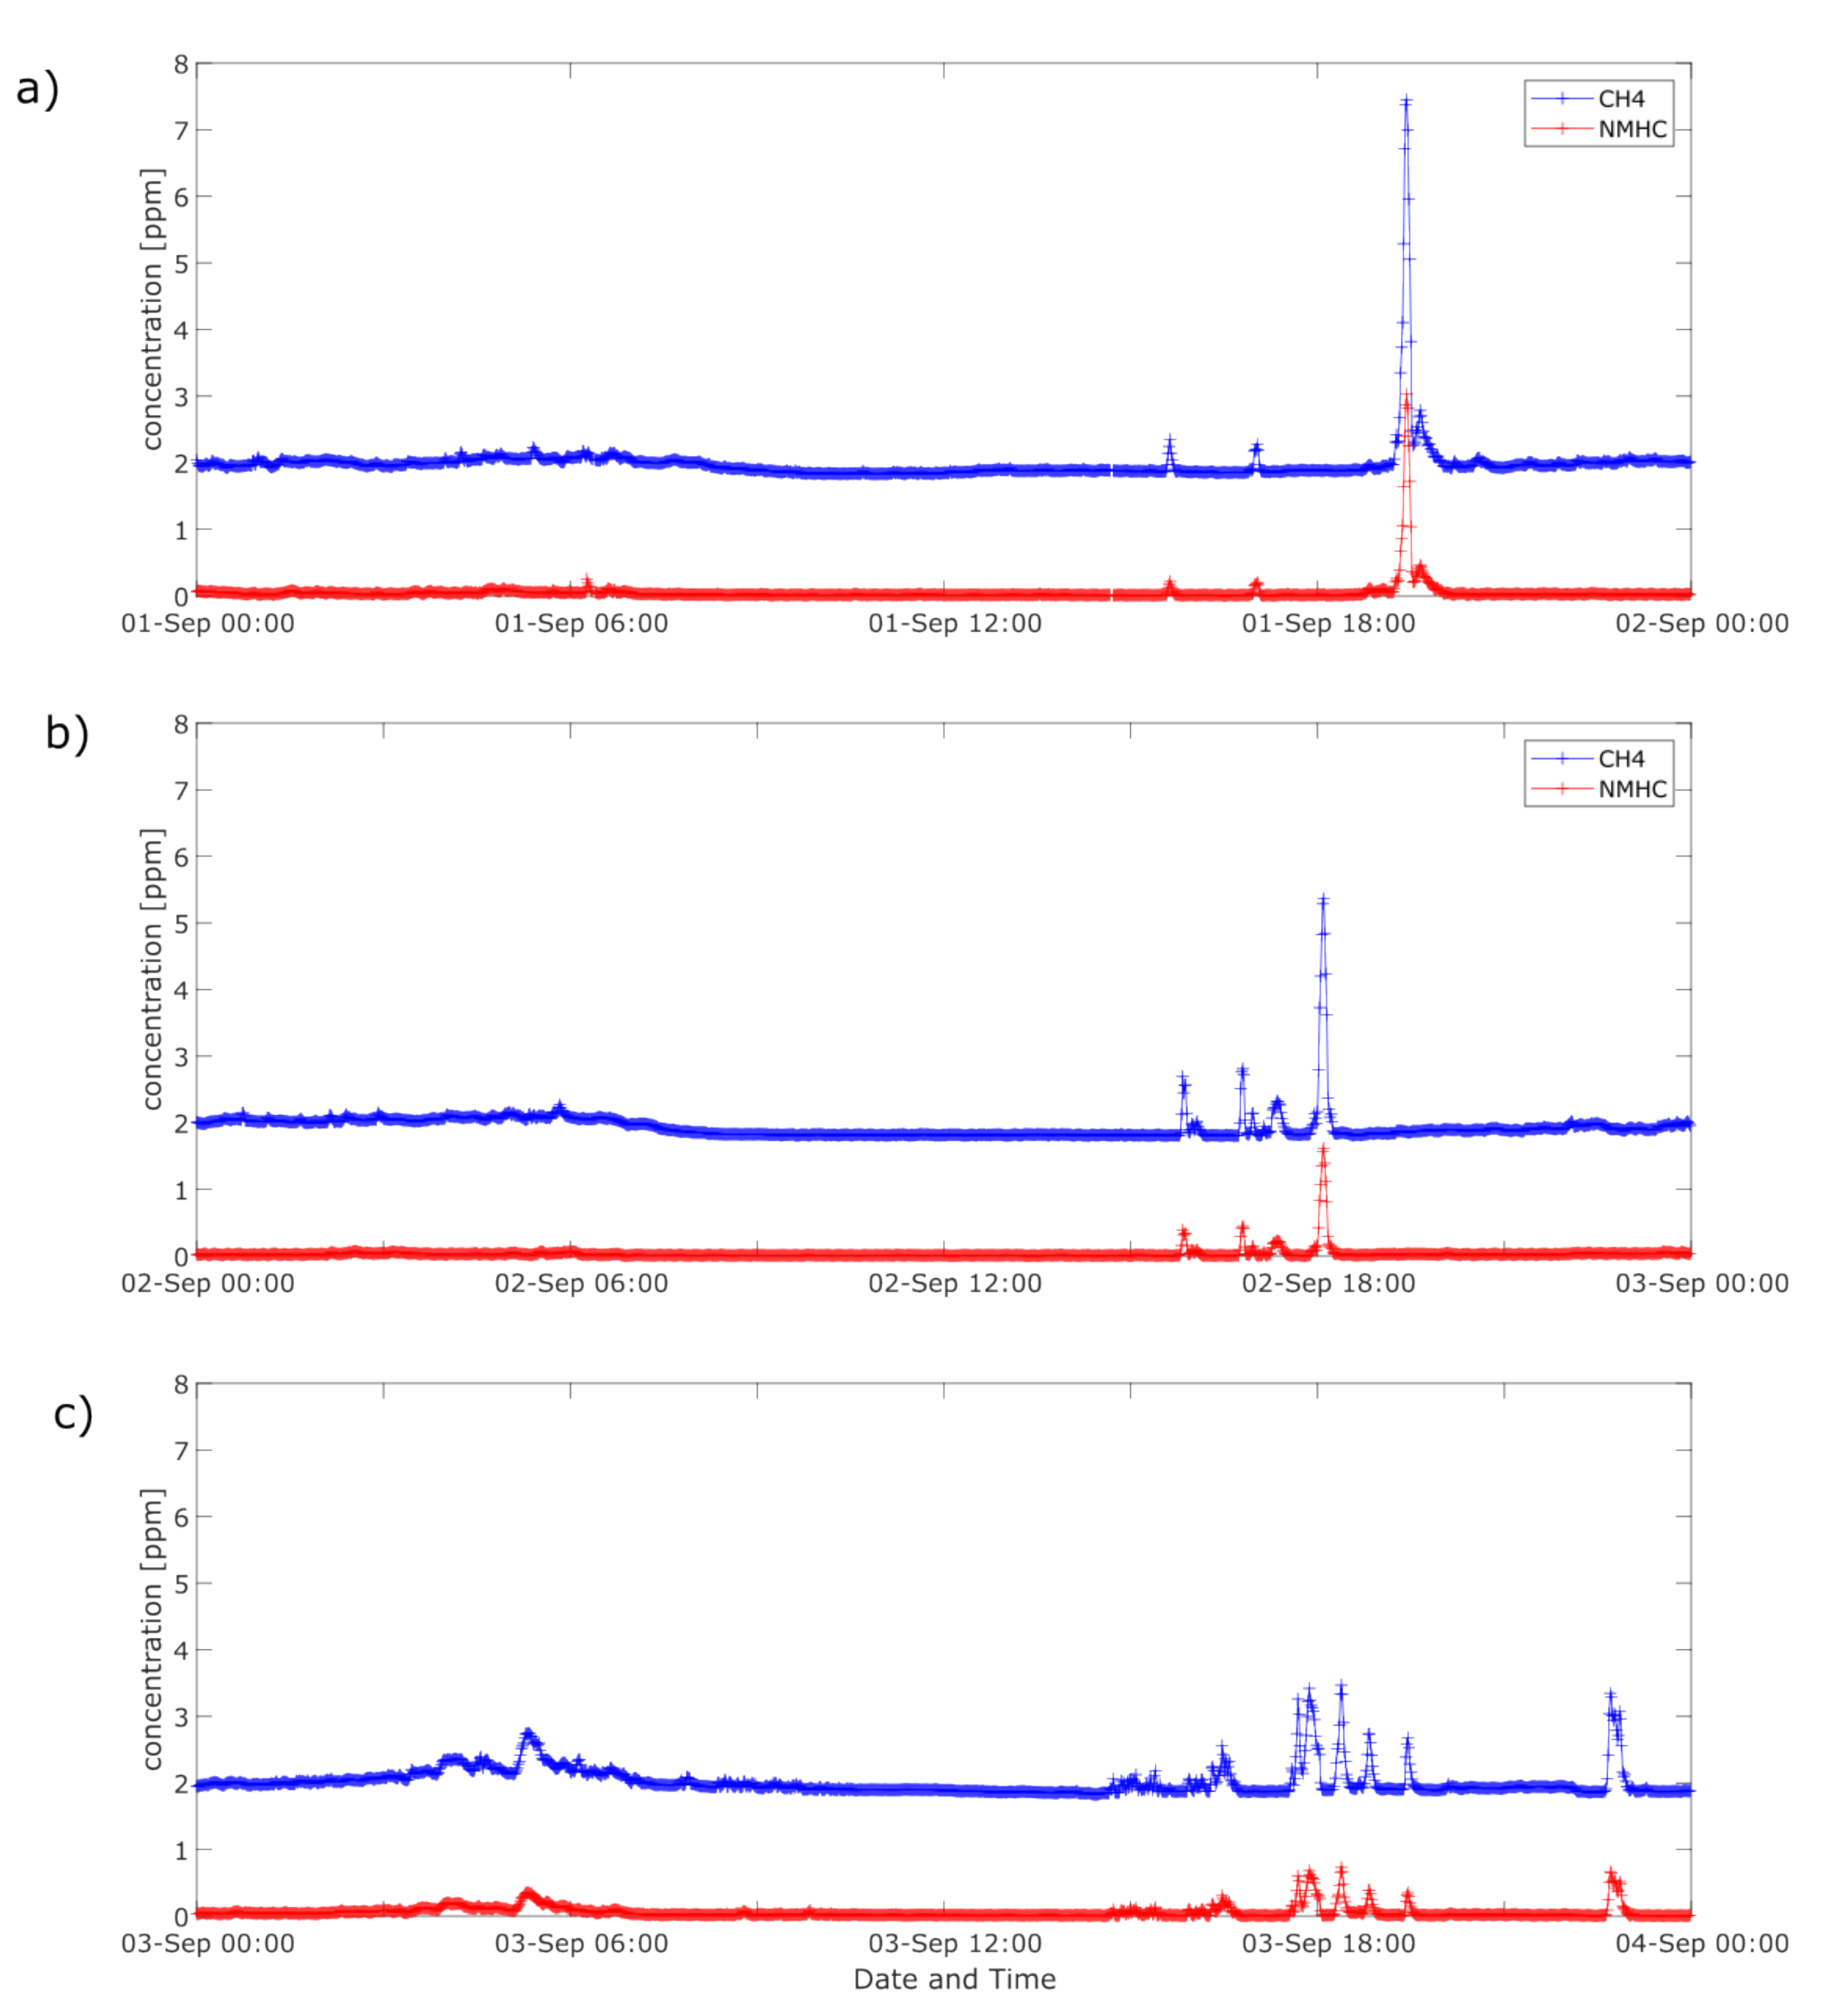
4 (1-h average), 2.81 ppm with more than 10 standard deviations from the average value, was registered on 1 September 2016, outside the drilling and hydrofracturing period. A more detailed analysis of the one-minute concentrations of CH
4, CO
2, and NMHC for this, and for several subsequent days, revealed a series of short CH
4 and NMHC concentration peaks, up to 7.45 ppm for CH
4 and up to 3.03 ppm for NMHC. CO
2 concentrations remained at mean levels. The results of the measurements are shown in
Figure 4.
The configuration and times of occurrence of the concentration peaks were similar for three consecutive days, with decreasing concentration values, indicating their artificial origin. The wind direction analysis for this period indicated the wells area as a possible methane source.
Analysis of CO
2 and CH
4 concentration ratio (ppm/ppm) is sometimes used as a tracer in investigating the origin of GHGs [
40]. A low CO
2/CH
4 ratio is often interpreted as an indicator of significant anthropogenic impact [
41]. This analysis was performed for the time of occurrence of the abovementioned CH
4 and NMHC episodes. The graph of these ratios is shown in
Figure 5.
Usually, its values remained relatively stable during the daytime, and the mean value for the entire measurement period was 219 ± 12, with an increase during nights, because of strong CO2 production through vegetation in a park near the station. During the duration of the episodes, the ratio systematically dropped down to 53, indicating a non-biogenic source of CH4, probably due to some technical procedures at the wells, which was associated with the release of certain amounts of CH4 directly into the atmosphere. Unfortunately, the site operator did not provide information about the type of activity being conducted at this time at the Wysin site.
Additionally, to investigate the predominance of the thermogenic origin of increased CH
4 concentration during the episodes, an analysis, based on the relationship between CH
4 and NMHC, was performed. Characteristics of the total number of episodes observed for the period 1–4 September 2016 are presented in
Table 5.
The concentration values of CH4 (1-min average) qualified as episodes were greater than the average value by at least 5 deviations, reaching the maximum value of 7.45 ppm (mean 2.91 ± 0.92 ppm), whereas almost all the values of NMHC were greater than the average value by at least 3 standard deviations. The maximum value of NMHC was 3.03 ppm (mean 0.43 ± 0.49 ppm). A significant correlation was observed between CH4 and NMHC levels (p < 0.05) with correlation coefficient above 0.6, and a low value of the CH4/NMHC ratio was recorded in almost all episode cases (except episode numbers 8 and 9). Correlation coefficient values, in most cases, were above 0.9, thus indicating a strong association between species. The CH4/NMHC ratio values were significantly lower than the mean value for the entire experiment (90) and dropped down to approximately 5. These calculations indicated the possible influence of a thermogenic source of the CH4 episodes. The origin of episode numbers 8 and 9 is not clear. Correlation coefficient values were slightly smaller than the others (0.680 and 0.859, respectively), and p-values (0.064 and 0.062, respectively) were above the adopted significance (p < 0.05). The CH4/NMHC ratio values were the highest of all (15.46 and 23.01, respectively), but remained significantly lower than the average value for the entire measurement period. The potential sources of elevated CH4 levels in episodes 8 and 9 may indicate that the CH4/NMHC ratio included both thermogenic and biogenic contributions, but these inferences are not unequivocal.
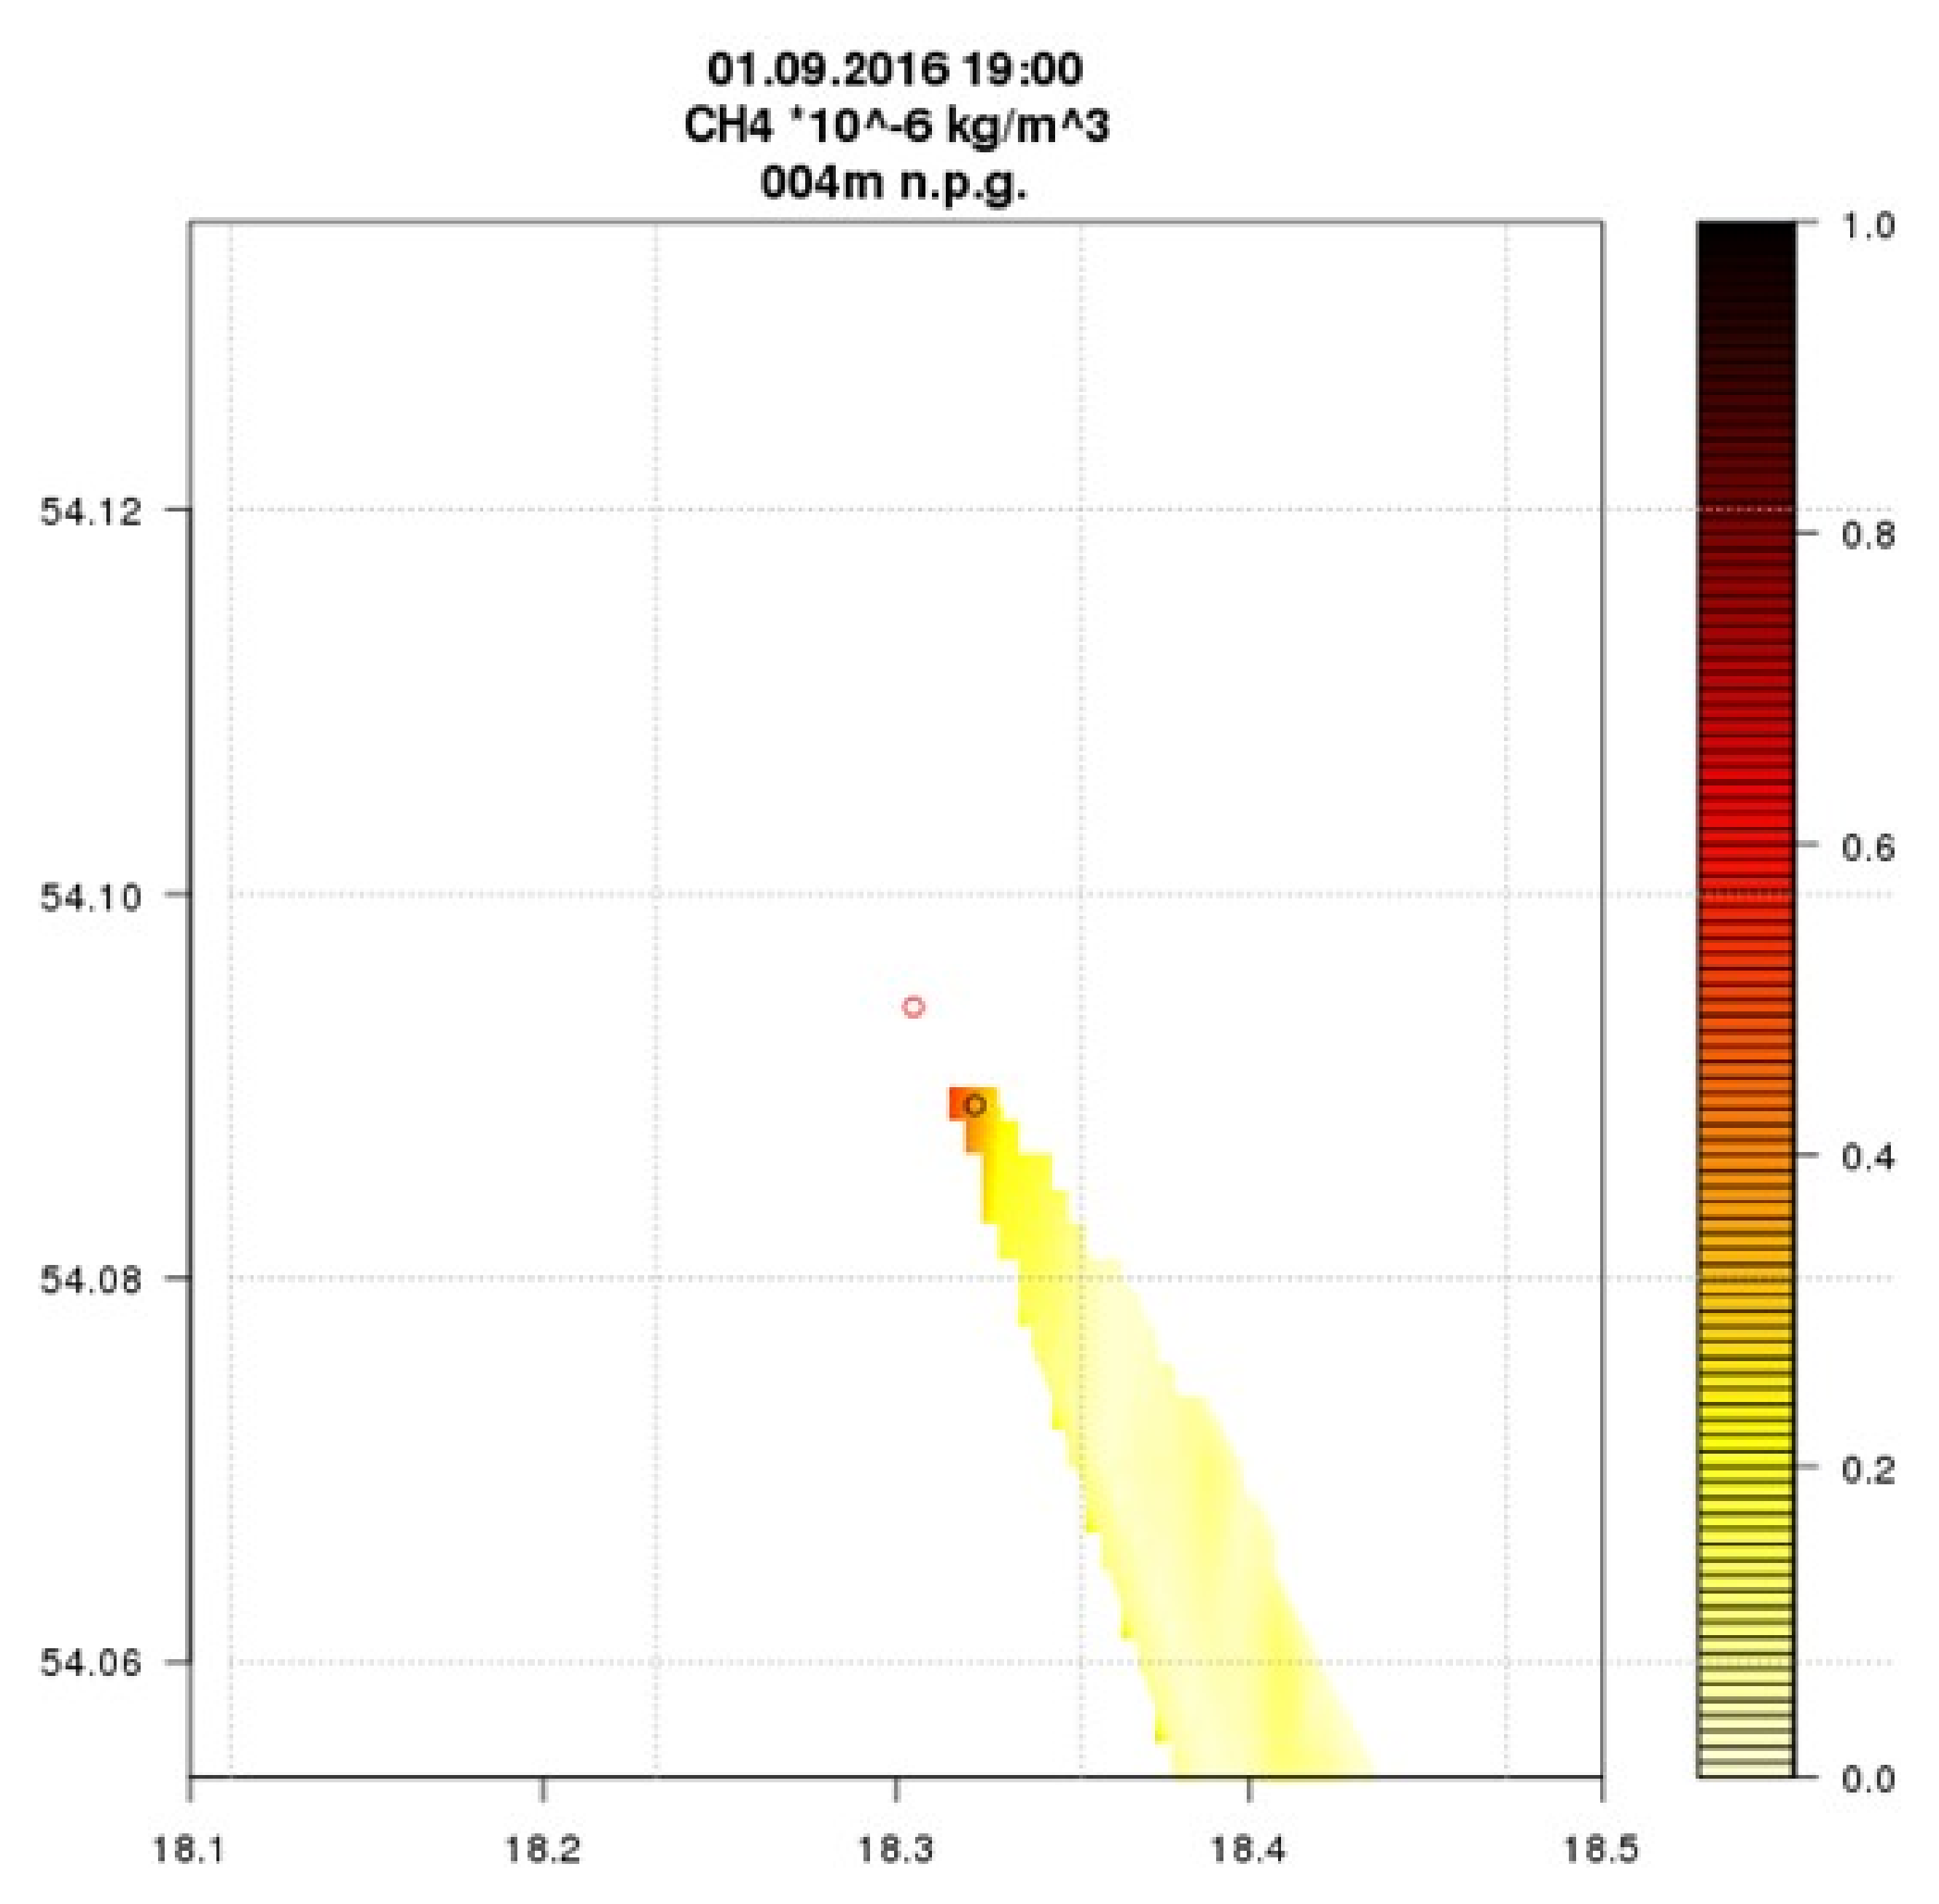
For episode number 1 the methane plume possibly emitted from the well was modeled by the HYSPLIT model. The results are shown on
Figure A6 in the
Appendix A.
4. Conclusions
This work presents the first long-term (two year) measurement assessment of the air quality impact of activities performed at a shale gas site in Poland.
The development of a shale gas exploration and exploitation site in Wysin (over the period 2015–2017) consisted of a full cycle of technical works, including the following phases, each of which has potential for pollution emission to the atmosphere: pre-operational phase, well drilling, hydro-fracturing, closing the well and site restoration. Continuous monitoring of levels of air pollutants in the vicinity of shale gas wells supported the hypothesis that emission from shale gas extraction activities in the Wysin area has a negligible impact on ambient air quality at a distance of about 1100 m from the wells on their leeward side.
Concentrations of pollutants measured at the station strongly depend on the kind of activities performed at the borehole area. The highest, partly statistically significant increases in level of selected pollutants were noted during increased activity at the wells (during drilling and hydro-fracturing periods) in the conditions of direct transport of air from the area of the wells to the measurement point. The works of drilling and hydro-fracturing involved intensified vehicle activity, due to delivery of equipment to the site and its operation, and led to significant increases, especially in NOx emissions. Concentration of NO during intensive activity at the borehole area increased to an average value of 1.72 ppb (during drilling) and 1.21 ppb (during hydro-fracturing), compared to 0.83 ppb measured during the remaining period when no activities related to the borehole were performed.
Based on the observations of CH4, CO2 and NMHC, the gases directly related to shale gas exploration activities, the average concentrations registered for the period 2015–2017 were equal to 1.936 ± 0.064 ppm for CH4, 414 ± 29 ppm for CO2, and 0.039 ± 0.034 ppm for NMHC. During the measurement period, several episodes of elevated CH4 concentration values, with maximum one-hour average equal to 2.81 ppm (more than 10 standard deviations from the average value). occurred in September 2016. Detailed analysis of the one-minute concentrations of CH4, CO2 and NMHC revealed a series of short CH4 and NMHC concentration peaks, up to 7.45 ppm for CH4 and up to 3.03 ppm for NMHC. The time of appearance of these peaks was similar for three consecutive days, with decreasing concentration values, which could indicate their artificial origins. CH4/CO2 ratio values during the measurement period were characterized by relatively stable values ≈ 219 ± 12. Over 1–4 September CH4/CO2 ratio values dropped down to 53. Due to lack of information from the site’s operator, we cannot unambiguously state what kind of operations were performed during these days at the borehole area and what exactly caused the high emission of CH4 and NMHC pollutants. However, analysis of wind direction during these days indicated the borehole area as a potential CH4/NMHC source.
Results of the analysis of measurements taken during shale gas exploration activities indicated that significant increases of concentrations of air pollutants (expect of NOx, CH4 and NMHC, mentioned before) were not observed. Taking into account the Air Quality Criteria, applicable to individual pollutants, no exceedances of threshold values (with the exception of O3) were observed. Relatively low levels of concentrations of air pollutants measured during drilling, hydraulic fracturing and shale gas extraction at Stary Wiec could be determined, especially by the scale of operations across the time and space, which were relatively small. Additionally, exploration activities concerned only two wells. It can be assumed that the use of shale gas extraction technology, taking into account: risk-mitigation measures and technical quality control, could ensure environmentally safe exploration and exploitation of shale gas.


