Abstract
Enhanced nitrogen (N) deposition has shown significant impacts on forest greenhouse gas emissions. Previous studies have suggested that Chinese forests may exhibit stronger N2O sources and dampened CH4 sinks under aggravated N saturation. To gain a common understanding of the N effects on forest N2O and CH4 fluxes, many have conducted global-scale meta-analyses. However, such effects have not been quantified particularly for China. Here, we present a meta-study of the N input effects on soil N2O emission and CH4 uptake in Chinese forests across climatic zones. The results suggest that enhanced N inputs significantly increase soil N2O emission (+115.8%) and decrease CH4 uptake (−13.4%). The mean effects were stronger for N2O emission and weaker for CH4 uptake in China compared with other global sites, despite being statistically insignificant. Subtropical forest soils have the highest emission factor (2.5%) and may respond rapidly to N inputs; in relatively N-limited temperate forests, N2O and CH4 fluxes are less sensitive to N inputs. Factors including forest type, N form and rate, as well as soil pH, may also govern the responses of N2O and CH4 fluxes. Our findings pinpoint the important role of Southern Chinese forests in the regional N2O and CH4 budgets.
1. Introduction
Nitrous oxide (N2O) and methane (CH4) are two important greenhouse gases, with significantly higher global warming potentials than carbon dioxide [1]. In recent decades, significant increases of both N2O and CH4 concentrations in the background atmosphere have raised worldwide concerns, of which a focus has been put on emissions from emerging economies such as China [2,3]. Terrestrial N2O and CH4 fluxes are mainly regulated by exchanges between soil and atmosphere (i.e., emission or uptake). In China, soils under natural vegetation are important N2O sources [4] and active CH4 sinks [5]. However, uncertainties in regional budgets of N2O and CH4 from natural soils are still much higher than from agricultural soils [6,7].
Forests cover almost 20% of the total land area of China [8], representing a major natural ecosystem type. Since the 1980s, atmospheric nitrogen (N) deposition has been reported to sharply increase due to reactive N emissions [9]. As a result, a number of forest soils in China have been reported as “N-saturated” [10,11], showing strong nitrate (NO3−) leaching [12], acidification [13] and loss of biodiversity [14]. In addition, long-term studies have shown that enhanced N deposition may accelerate soil carbon (C) sequestration [15] and change plant physiology [16]. These may exert significant influences on forest soil C and N cycling [17], and thus changing soil N2O and CH4 fluxes.
Forest soils are mostly considered as a net source of N2O [18]. Soil N2O production is mainly mediated by biological processes such as nitrification and denitrification, which are often found to occur in aerobic and anaerobic environments, respectively [19]. During nitrification, N2O is mostly produced as a by-product from the intermediate hydroxylamine, thus resulting in small emission potentials [20]. By contrast, a number of studies have shown that soil N2O fluxes are positively related to soil moisture in Chinese forests, indicating denitrification as an important source of N2O [21,22,23,24]. Therefore, N2O emission in forest soils is likely to be controlled by a series of climatic and edaphic factors, including temperature, moisture, soil pH, N substrates and carbon nutrient levels [25]. In addition, the last step of denitrification, which is the reduction of N2O to N2, can be strongly inhibited in low soil pH and result in high net emission of N2O [26]. In subtropical forests of South China, where soil pH is around 4, mean annual N2O emission accounts for almost 10% of total N deposition, indicating a strong N2O source potential [27].
Soil–atmosphere exchange of CH4 is dominated by two groups of microorganisms, commonly known as methanogens and methanotrophs [28,29]. Methanogens, which prefer anaerobic environments, are primarily responsible for soil CH4 generation. Methanotrophs oxidize methane for energy, which provides a major contribution to CH4 uptake. In upland forest soils, CH4 production is mostly smaller than consumption, thus contributing a net CH4 sink [30]. According to a literature review, enhanced soil N supply may stimulate methanotrophic activity in N-limited systems [31]. However, with high N levels (especially inorganic forms), soil CH4 uptake is frequently inhibited [28]. This could be explained by the mechanism that enhanced NH4+ concentration intensifies the competition with CH4 for CH4 mono-oxygenase catalyzing CH4 oxidation [32,33], and methanotroph bacteria prioritize NH4+ oxidation, resulting in reduced soil CH4 uptake. In a N-saturated forest in China, Yu et al. [22] even reported positive CH4 fluxes from upland soils. This confirms that CH4 uptake by methanotrophs is strongly dampened due to excessive N presented in soils. Further, there is evidence that elevated NO3− and NO2− concentration in soils may be toxic to methanotrophs [34]. Wang and Ineson [35] conducted incubation experiments and found that NO3− resulted in a stronger inhibition of CH4 uptake than NH4+ in temperate forest.
Within the last two decades, a growing number of studies have applied N fertilizer to Chinese forests to study the effects of enhanced N deposition on soil N2O and CH4 fluxes [36,37,38,39]. Regarding N2O, there is common understanding that enhanced N input leads to an increase of emissions; however, the response ratios may vary widely depending on N input forms, forest types, climatic zones and soil properties. For example, several studies (including tropical, subtropical and temperate sites) have observed an almost doubling of forest soil N2O emissions under N fertilization [36,40,41], while such an effect is moderate or null in a tropical forest site in South China [42]. In another southern site (Dinghushan site), Zheng et al. [43] reported that the impacts of N addition on soil N2O emission were different among various forest types, with old-growth forests being strongest. Further, studies have found that soil N2O emission in forests may respond non-linearly to N fertilization [44], with a trend similar to agricultural soils [45]. For CH4, a majority of findings based on the N fertilization approach point to the negative effects of N enrichment on CH4 uptake [36,38,43,46]. Nevertheless, some work reported no effect in a tropical site [47], or even stimulation of CH4 uptake by N input in a boreal forest [48]. It is noteworthy that, in addition to N effects, phosphorus availability may also affect CH4 uptake [49]. So far, a quantitative understanding of the N enrichment effects on forest soil CH4 uptake in China is still lacking.
While long-term studies of N input effects on forest soil N2O and CH4 are limited, it is more common to conduct regional and nationwide synthesis covering many sites [30,50,51]. For example, Liu and Greaver [30] made a global meta-analysis to explore N enrichment effects on N2O and CH4 fluxes across different ecosystems. They found that N addition increased N2O emission by 216% and decreased CH4 uptake by 38% on average. However, the N effects on N2O and CH4 reported by these global studies are often spread in a wide range, and cover only limited observations from China. This limits our understanding of the response of Chinese forests to enhanced N inputs. Considering the high N deposition loads in China [52], forest soils may act as an important contributor to the national greenhouse gas budget. Therefore, based on most up-to-date literature reviews, we have conducted a meta-analysis to look into the response of soil N2O emissions and CH4 uptake across forest ecosystems in China. This study aims at (1) quantifying the responses of forest soil N2O emissions and CH4 uptake to N inputs; (2) evaluating the roles of N deposition form, forest type, soil pH and climatic zone in regulating such responses; and (3) comparing the results of our meta-analysis with other global studies.
2. Materials and Methods
2.1. Data Collection
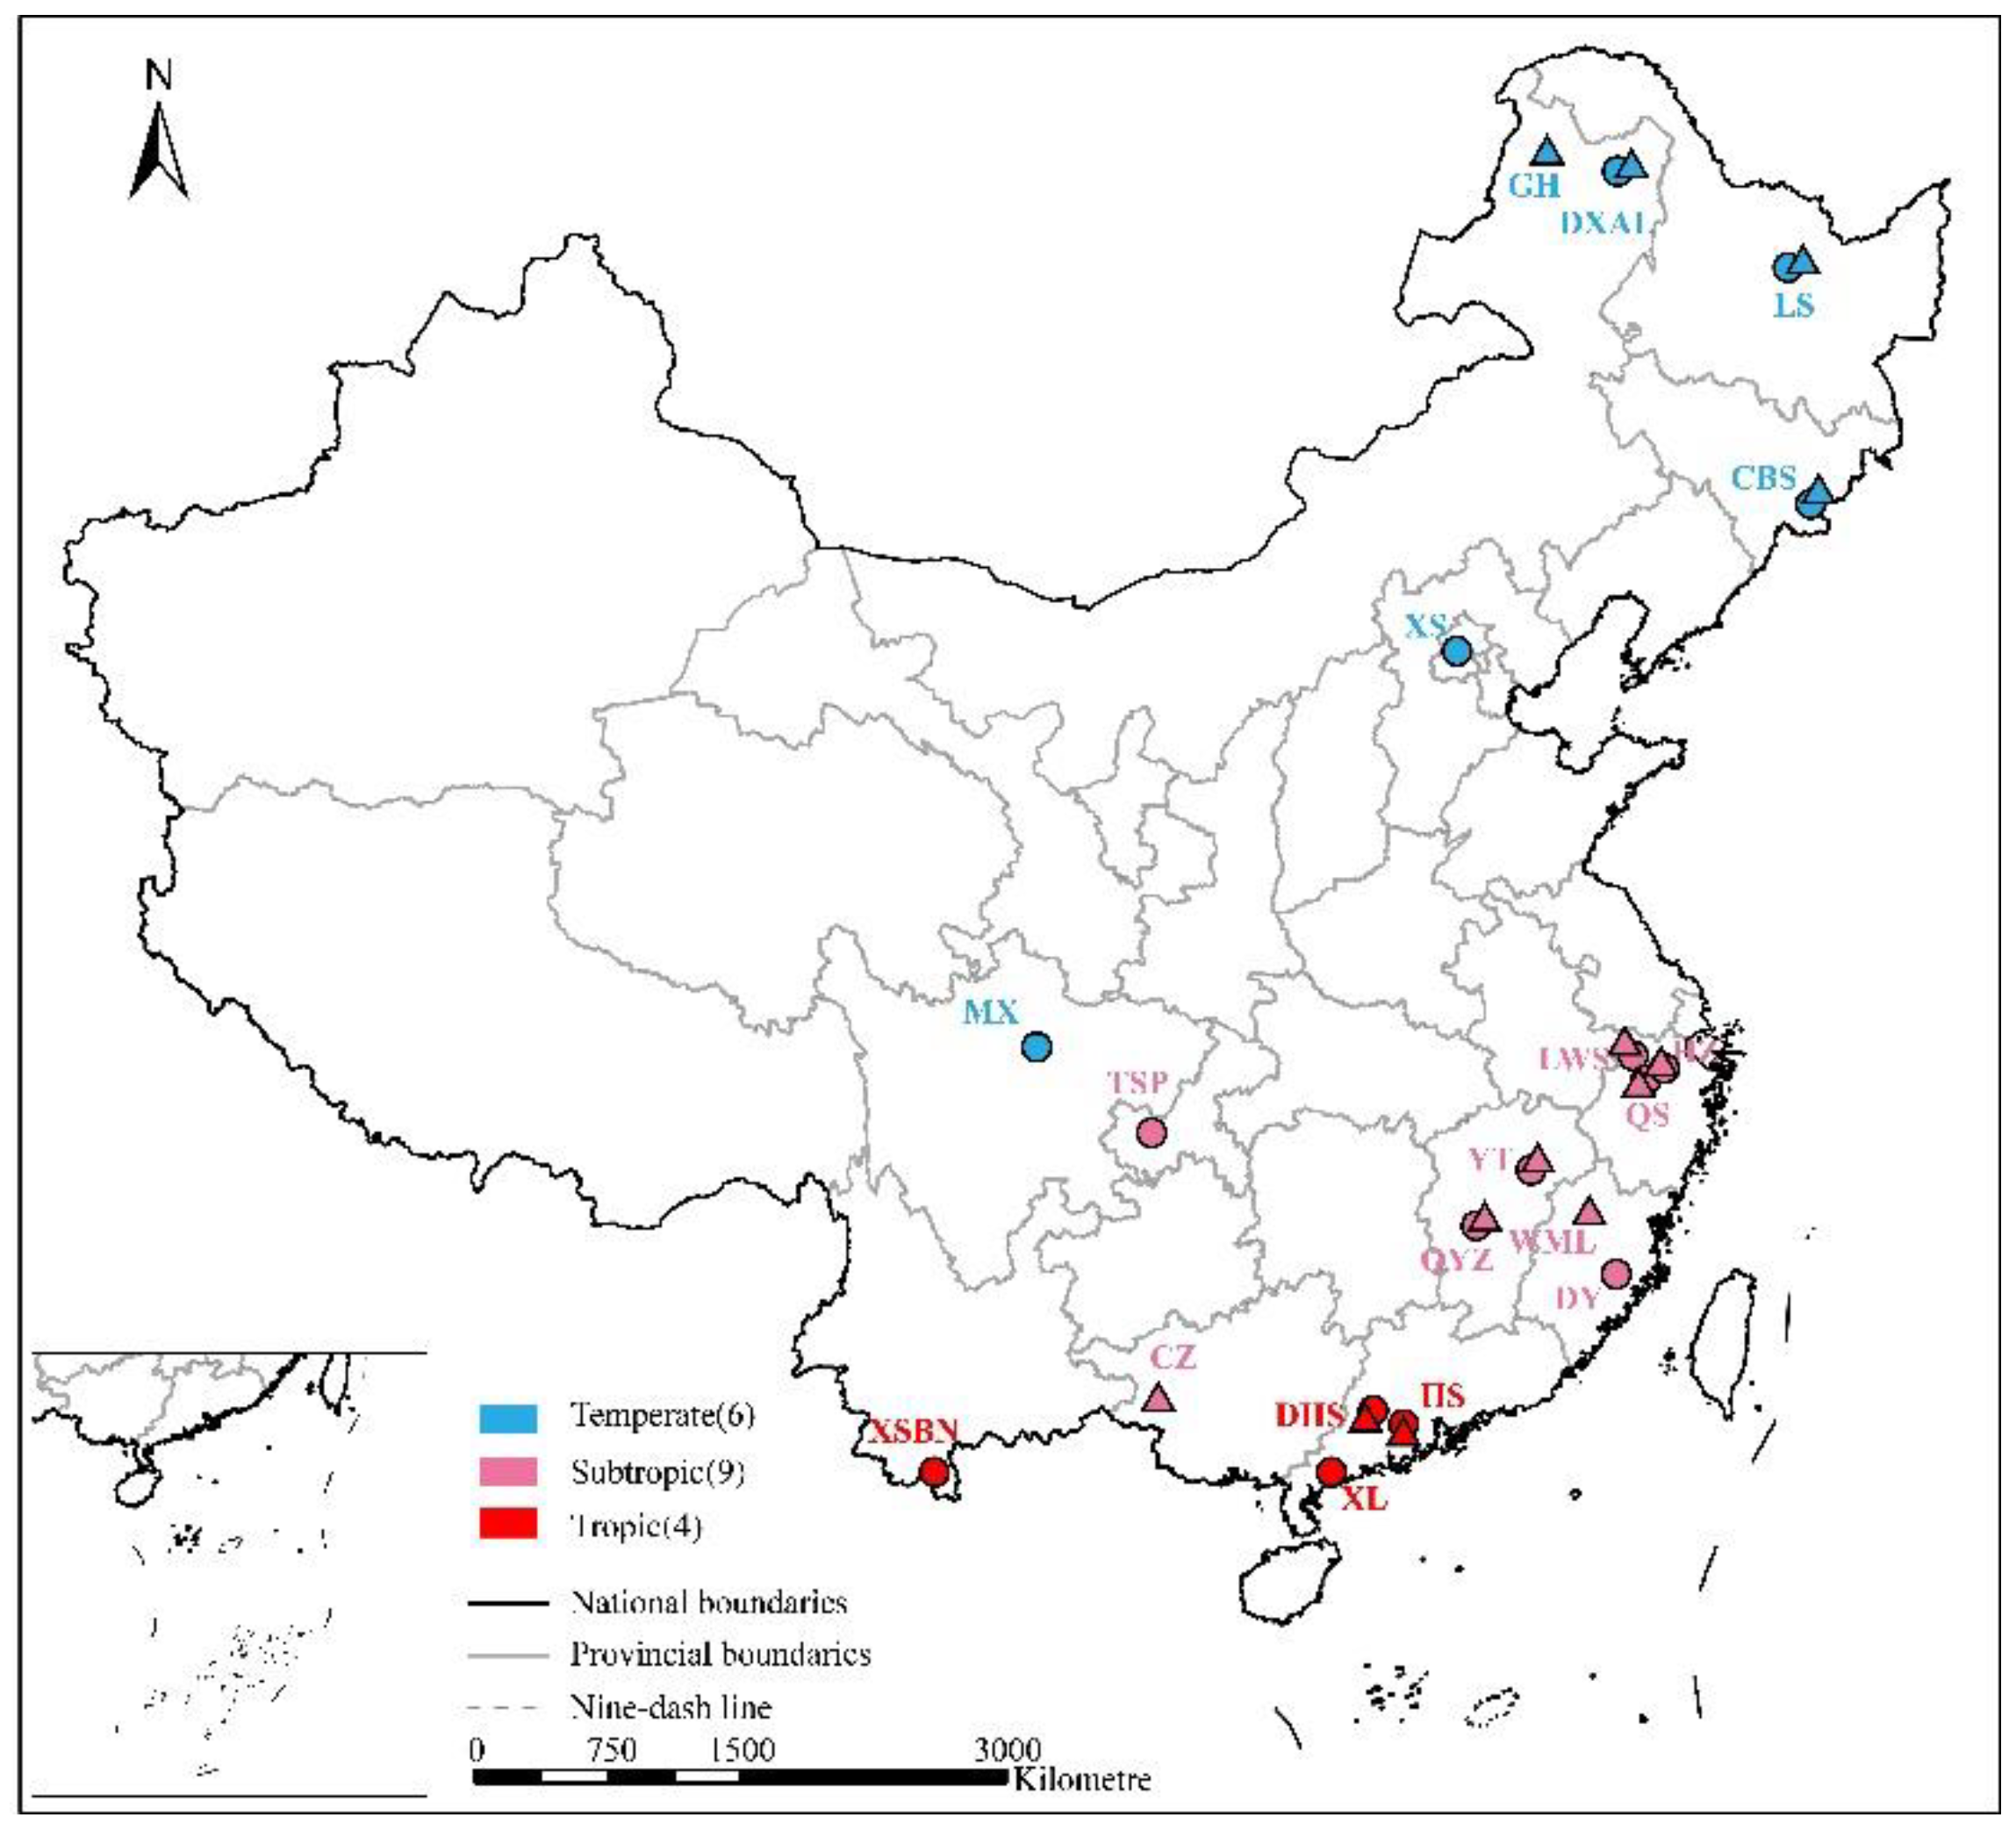
We searched publications since 2000 that reported on the response of soil N2O and CH4 fluxes to N addition experiments in forests in China using Google Scholar (Google Inc., Mountain View, CA, USA), Web of Science (Thomson Reuters, New York, NY, USA) and China Knowledge Resource Integrated Database (CNKI). We used the following combination of key terms: “forest” AND (“nitrous oxide” OR “N2O” OR “methane” OR “CH4”) AND (“nitrogen input” OR “nitrogen deposition” OR “nitrogen fertilization” OR “nitrogen elevation”). Publications with the following criteria were considered in study: (i) the paper reported the response of soil N2O or CH4 to simulated N deposition in Chinese forests; (ii) N input levels, forms and duration were recorded; (iii) duration of flux measurement were not less than three months; (iv) initial edaphic conditions were consistent between the controls and treatments. Results from different geographical locations and vegetation types, etc., in the same article were reasonably considered to be independent cases [30,53]. In total, our study included 75 observations from 24 publications covering 15 sites for N2O, and 67 observations from 19 publications covering 13 sites for CH4 (Figure 1).
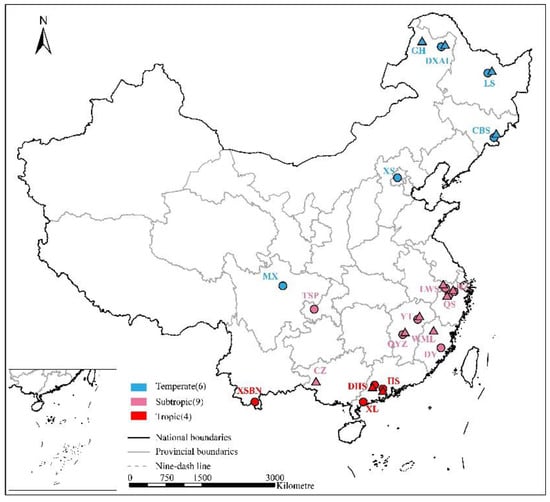
Figure 1.
Locations of the studied forest sites across China (n = 19). Circles and triangles represent the studied sites of N2O and CH4, respectively.
2.2. Data Extraction and Compilation
We extracted the means, replicates and standard deviations (SD) or standard errors (SE) from each study. When SD and SE were not reported, we assigned SD as 1/10 mean [54]. The SD was calculated when only SE was provided (). If the raw value were not accessible directly from the text, we used the GetData Digitizer software (http://getdata-graph-digitizer.com, accessed on 13 July 2022) to obtain data from charts. Error bars not noted in the figures were assumed to be SE [53]. Furthermore, we recorded background ambient variables from each research location including forest types, climatic zones, location, altitude (m), mean annual precipitation (mm), mean annual temperature (°C) and edaphic parameters (e.g., soil pH, NH4+ and NO3−). In most studies, N fertilizer was applied monthly. In addition, gas measurements were mainly conducted annually or during the growing (wet) season. When calculating the effects of simulated N deposition on forest soil N2O and CH4 fluxes, we categorized explanatory variables into subgroups: (1) forest types (bamboo forest, broadleaf forest, needle forest and mixed forest); (2) N input forms (NH4NO3, NH4+, NO3− and urea); (3) N input rates (<50 (low), 50–100 (middle) and >100 kg N ha−1 (high)); (4) N addition duration (<5 and 5–10 yr); (5) soil pH (<5, 5–7, >7); (6) climatic zones (tropical, subtropical and temperate). As no long-term study reporting the effects of N addition on forest CH4 fluxes was available, the subgroup of N addition duration was excluded in the meta-analysis for CH4 fluxes. Moreover, all CH4 fluxes in the control plots of literature covered in this work were negative, so we performed the meta-analysis only for CH4 uptake. However, it is noteworthy that, in one study [55], CH4 fluxes became positive after N treatment; for this case, we still consider it as “a negative effect on CH4 uptake”.
2.3. Meta-Analysis
Responses of N2O and CH4 fluxes to N input were evaluated by effect size, calculated [56,57,58] as follows:
With a variance of:
where RR is the effect size calculated as log response ratio for each comparison among control and treatment. , , , , and represent the standard deviations, sample sizes and mean values of fluxes under the treatment and control, respectively.
In this study, calculations of effect size, corresponding variance and confidence interval (CI) were performed in MetaWin Software 2.1 (Sinauer Associates Inc., Sunderland, MA, USA). Bias-corrected 95% CI was produced by bootstrapping (4999 interactions) [59] using a random-effects model, which included both within-study and between-study variances when calculating each effect size [60]. To better account for the effects of N input on N2O and CH4, mean effect size () and 95% CI shown in the figures were transformed back to percentage change using the following equation:
The effects of N input were considered not statistically significant with 95% CI that did not overlap 0 (α = 0.05). On the contrary, 95% CI greater than 0 and smaller than 0 indicated that N inputs promote and restrain emissions, respectively. To explain variance in N2O and CH4 fluxes responding to enhanced N deposition, we divided explanatory variables into different subgroups and ran a between-group heterogeneity (QB) test to compare the heterogeneity of weighted effect sizes on selected variables among different forest types, N forms, N input rates, N addition duration, soil pH and climatic zones. When the QB value was significant at p < 0.05, the weighted effect size significantly differed within subgroups.
To acquire a better understanding of the effects of N input on soil N2O and CH4 fluxes, we also estimated the N2O emission factor and CH4 uptake factor as follows:
where emisson factor and uptake factor were calculated relative to N addition amounts; emission and uptake refer to the changes in N2O emission (kg N2O-N ha−1 yr−1) and CH4 uptake (kg CH4-C ha−1 yr−1) induced by fertilization; addition refers to the nitrogen addition rates (kg N ha−1 yr−1).
2.4. Extraction of Global Data
Although our study focuses on the effects of N addition on soil N2O emission and CH4 uptake from Chinese forests, there have been several global meta-studies summarizing such effects. In order to compare ours with other global studies, we have additionally included other global datasets (sites outside China: 9 publications with 37 observations for N2O, and 8 publications with 23 observations for CH4) based on the meta-data provided in the two most recent publications. These global datasets were analyzed with the same meta-analysis approach and were compared side-by-side with Chinese datasets according to the different climatic zones.
3. Results
3.1. Response of Soil N2O Emission to N Input
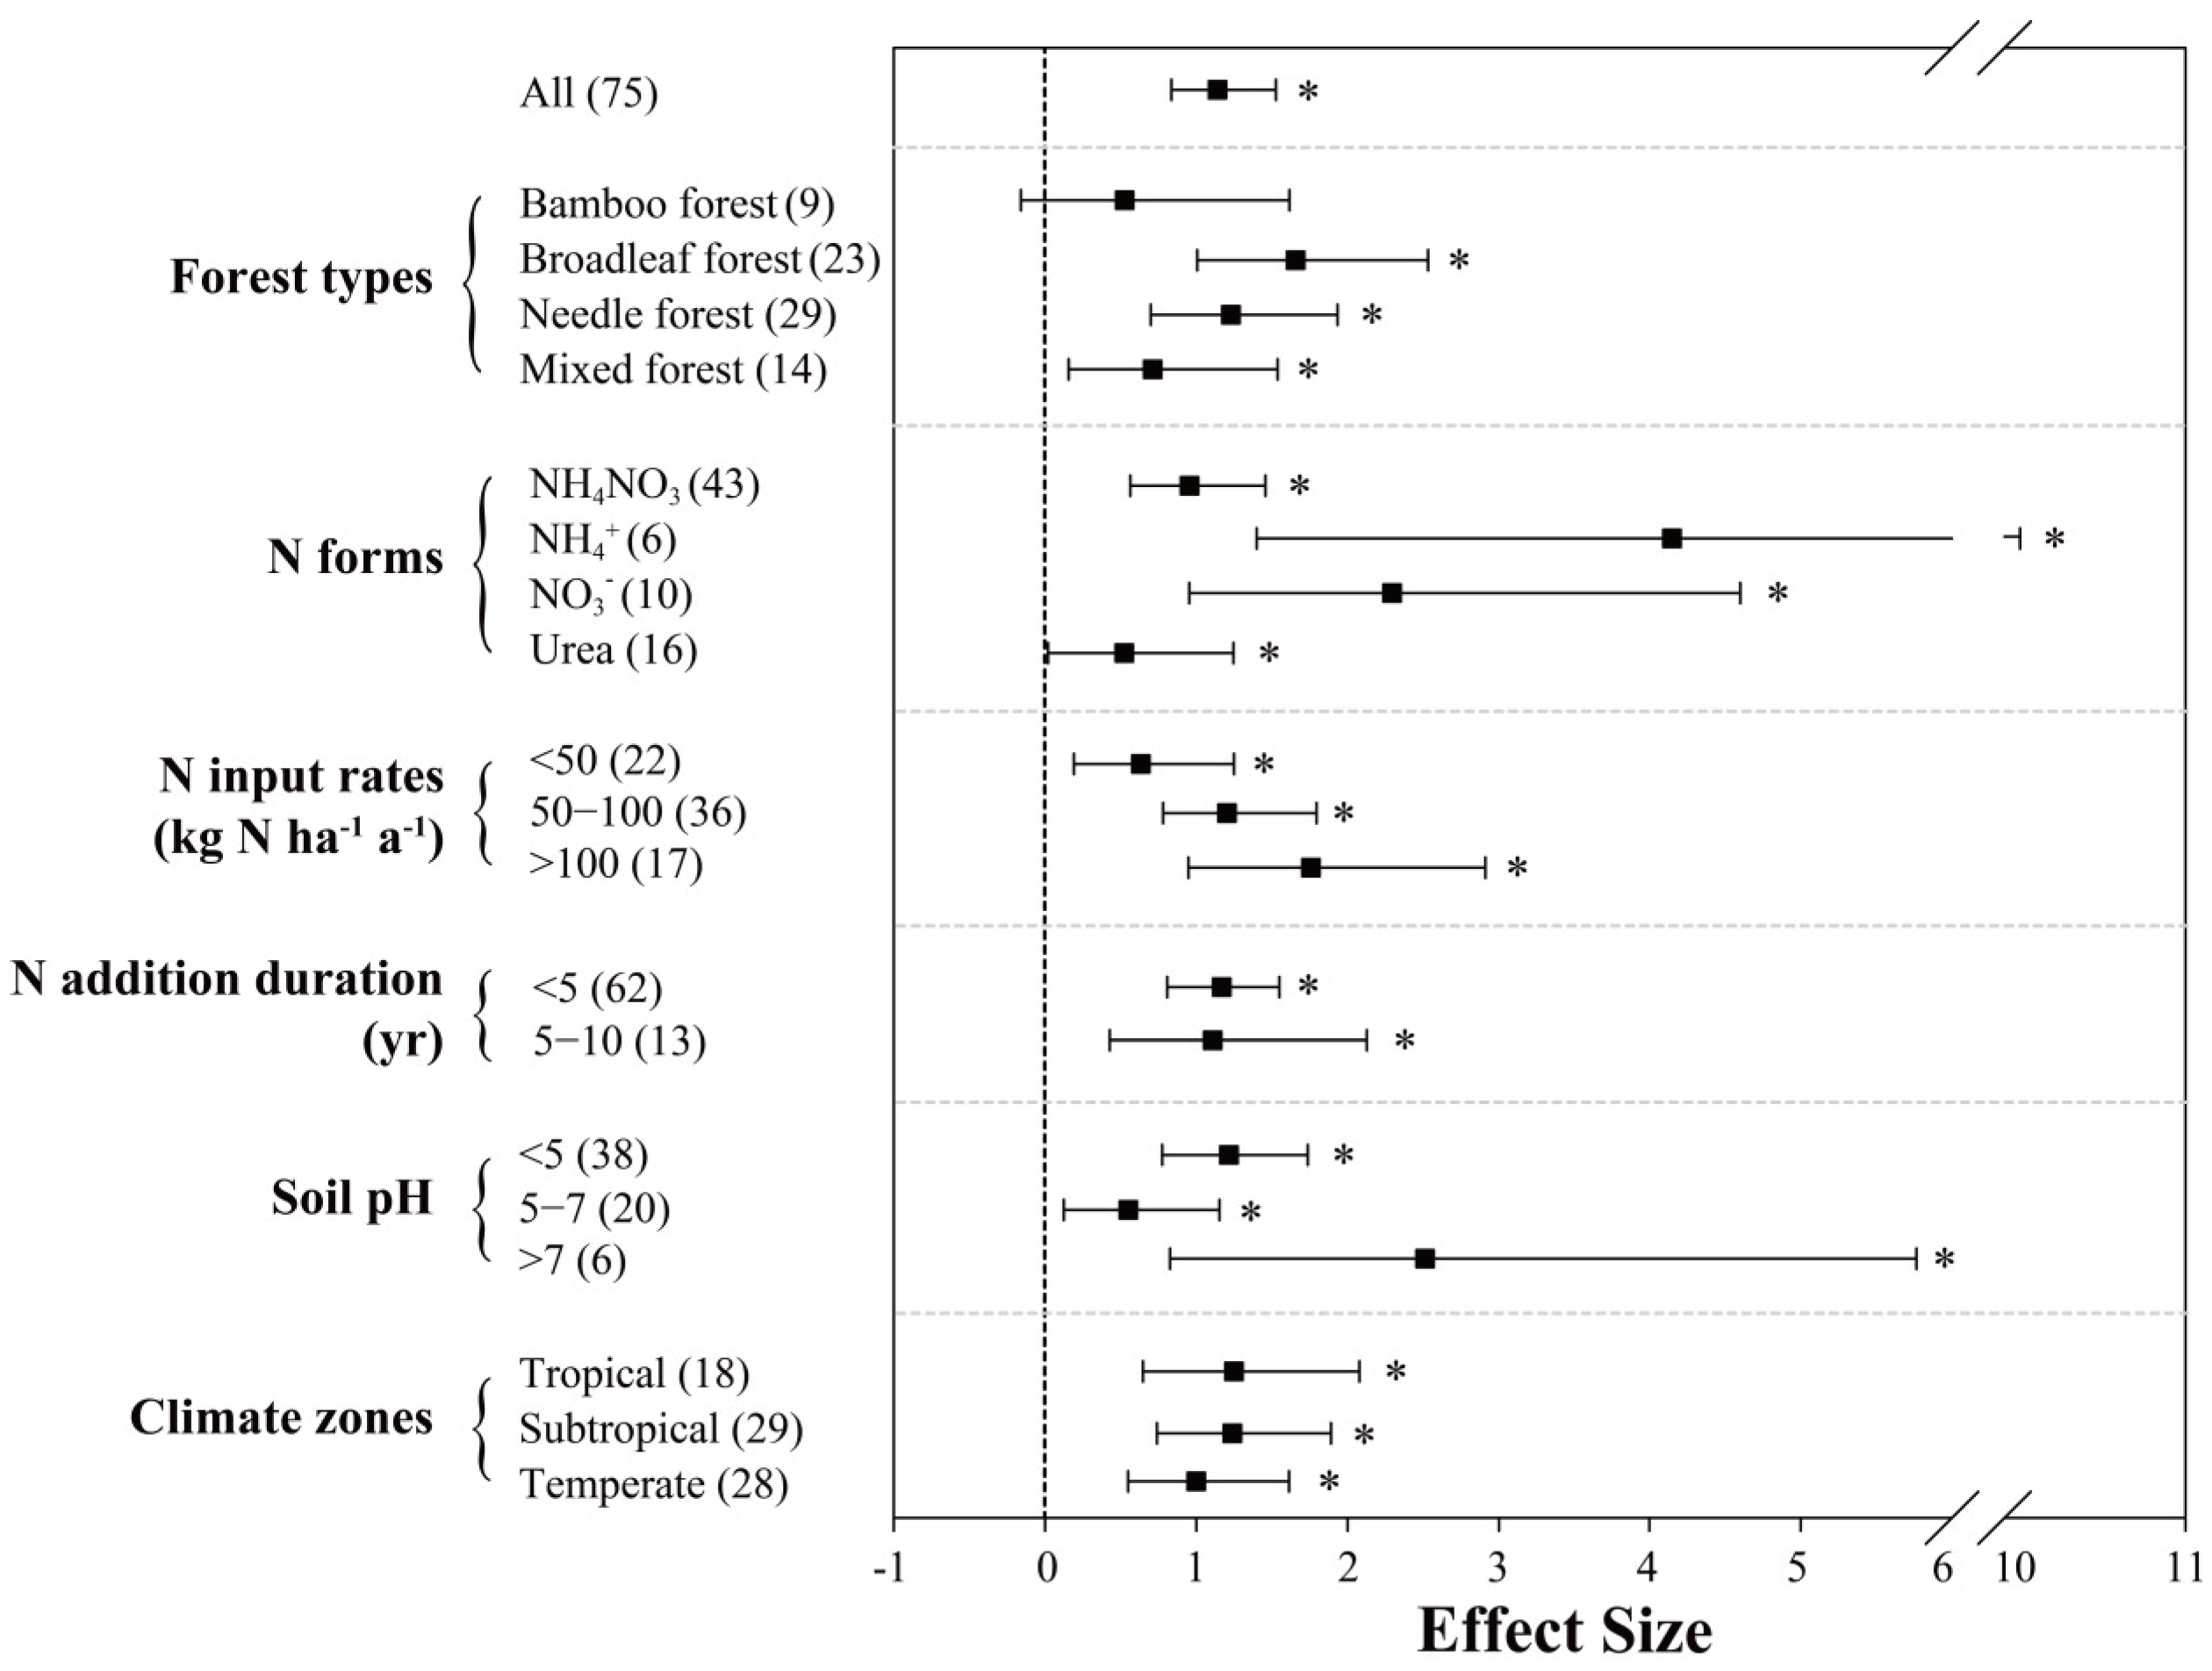
The positive effects of N inputs on N2O fluxes were mostly significant with a mean effect size of 115.8% (95% CI: 84.2–153.0%; n = 75; Figure 2), indicating that N addition increases soil N2O emissions in Chinese forests by 115.8% on average. Such positive effects were found in all three climatic zones, whereas tropical and subtropical forests (~125.0%) exhibited somewhat stronger responses than temperate forests (101.3%). Among different forest types, N inputs significantly increased soil N2O fluxes in broadleaf, needle and mixed forests (166.4%, 123.4% and 71.5%, respectively), but the N addition effect is small and insignificant for N2O emissions from bamboo forests.
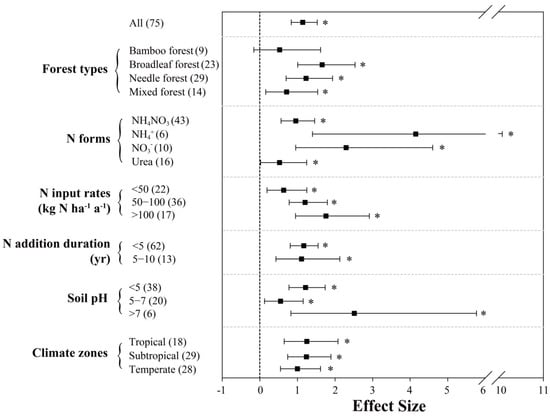
Figure 2.
Effects of N inputs on forest soil N2O emissions in China. Error bars represent 95% confidence intervals (CI). The vertical dashed line indicates effect size = 0. If the 95% CI does not overlap with zero, the effect of N input is considered as statistically significant and denoted by * in the figure. From top to bottom are the results of subgroups, including “forest types, N forms, N input rates (kg N ha−1 yr−1), N addition duration (yr), soil pH and climatic zones”. Numbers in parentheses represent the sample sizes.
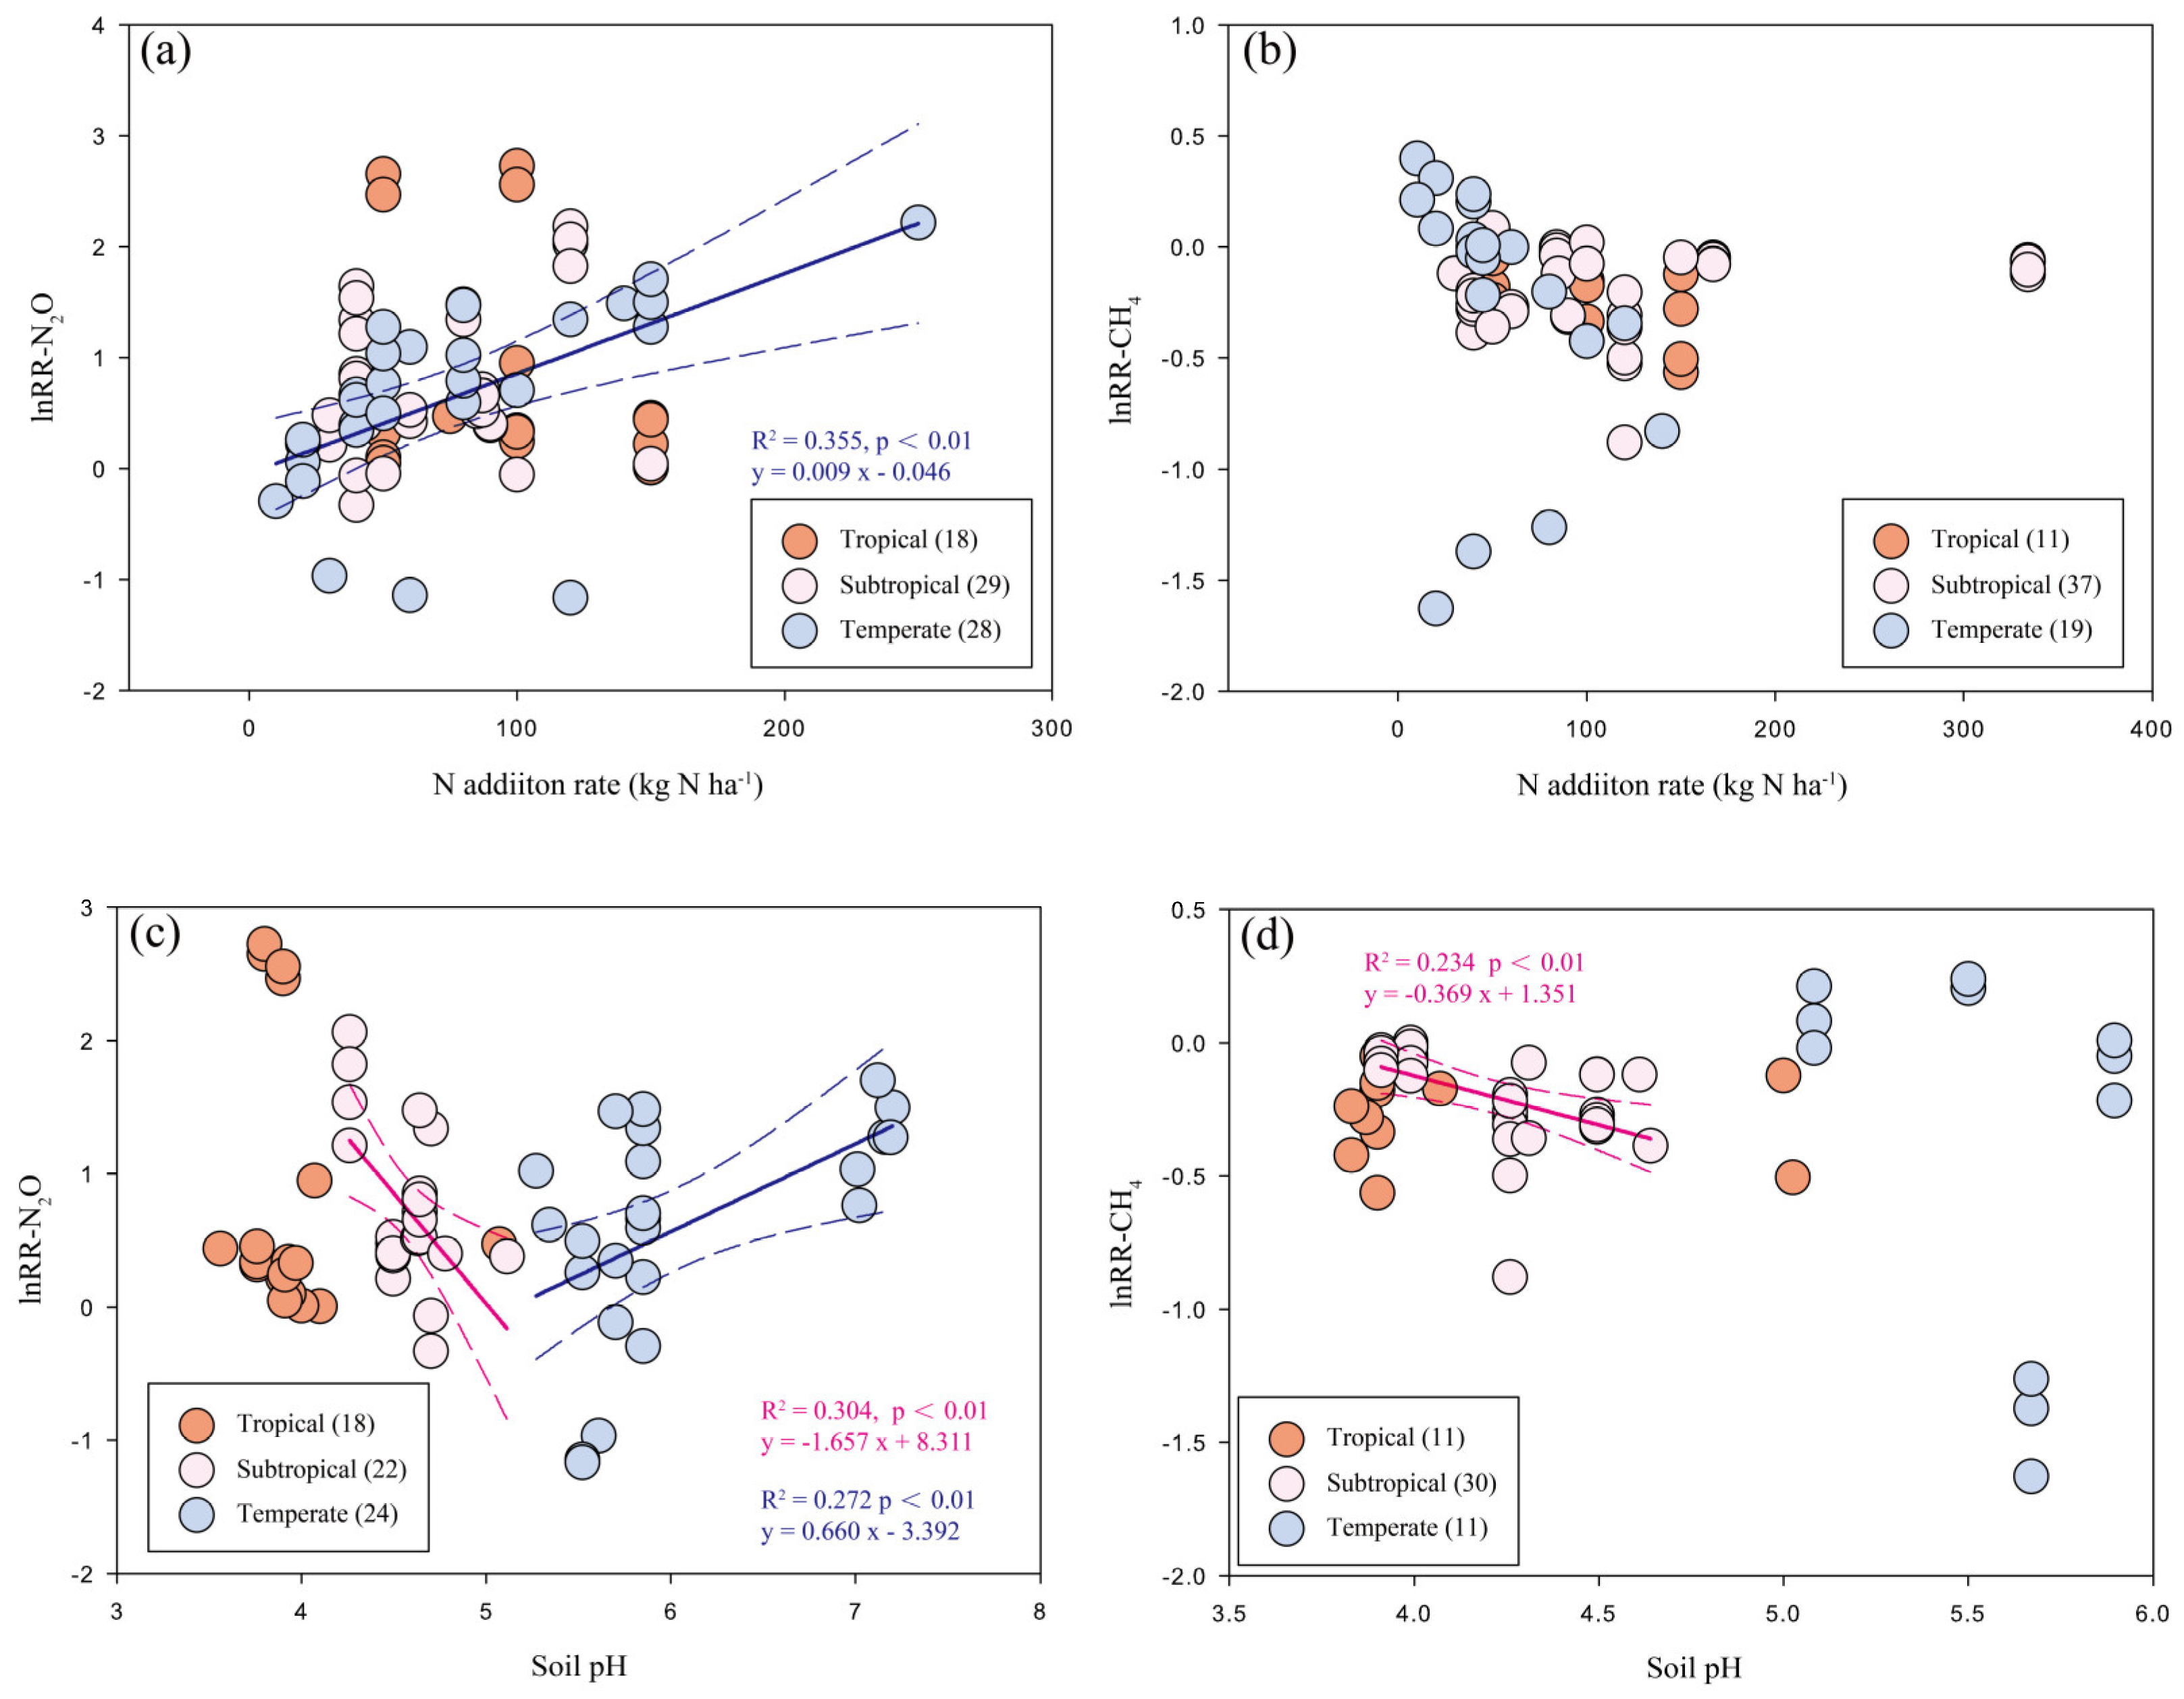
N fertilizer forms had a strong impact on the response of forest soil N2O emissions, with NH4+ and NO3− being the highest (415.9% and 230.9%, respectively); on the other hand, the stimulation effects induced by NH4NO3 (96.2%) and urea (51.6%) were significantly smaller. With the increase of N input rates (<50, 50–100 and >100 kg N ha−1 yr−1), the stimulation of N2O fluxes scaled accordingly (64.0%, 123.3% and 176.3%). However, the regression analysis showed only a significant correlation of N addition rate with a response ratio for N2O fluxes in temperate forests (Figure 3a). The meta-analysis result also indicates that N addition duration may influence the response of N2O emissions; however, with N fertilization for 5 to 10 years, the effects on forest soil N2O fluxes showed large uncertainties. Lastly, in soils with varying pH values, the responses of N2O emissions to N inputs varied greatly; at soil pH lower than 5, N2O fluxes were increased by about 120.7%, while stimulation effect was significantly smaller at soil pH between 5 and 7 (55.8%). When soil pH is above 7, which was only reported by one study [61], the effect size had a much larger mean (251.9%), despite varying widely. As shown in Figure 3c, the relationship between soil pH and response ratios of N2O fluxes are opposite between subtropical (negative) and temperate (positive) forests. Between-group heterogeneity (QB) suggests that N fertilizer forms and soil pH are the two significant categories that affect the response of N2O fluxes to N inputs (Table 1).
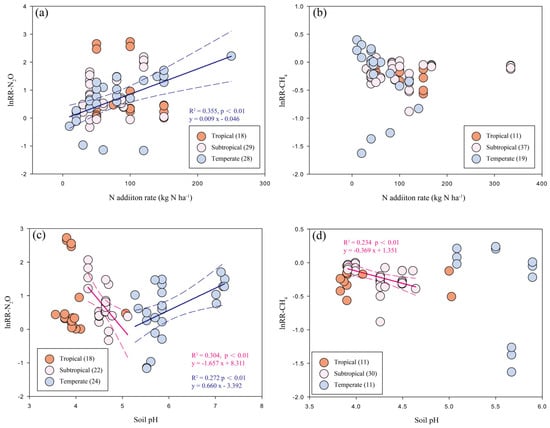
Figure 3.
Relationship of N addition rates (a,b) or soil pH (c,d) with the response ratios of N2O and CH4 fluxes to N inputs among different climatic zones in Chinese forests. Significance levels are set to p < 0.01. The solid lines represent the significant regression lines of different climatic zones.

Table 1.
Between-group heterogeneity (QB) showing potential as predictive variables influencing N2O and CH4 fluxes in response to N input σ.
3.2. Response of Soil CH4 Uptake to N Input
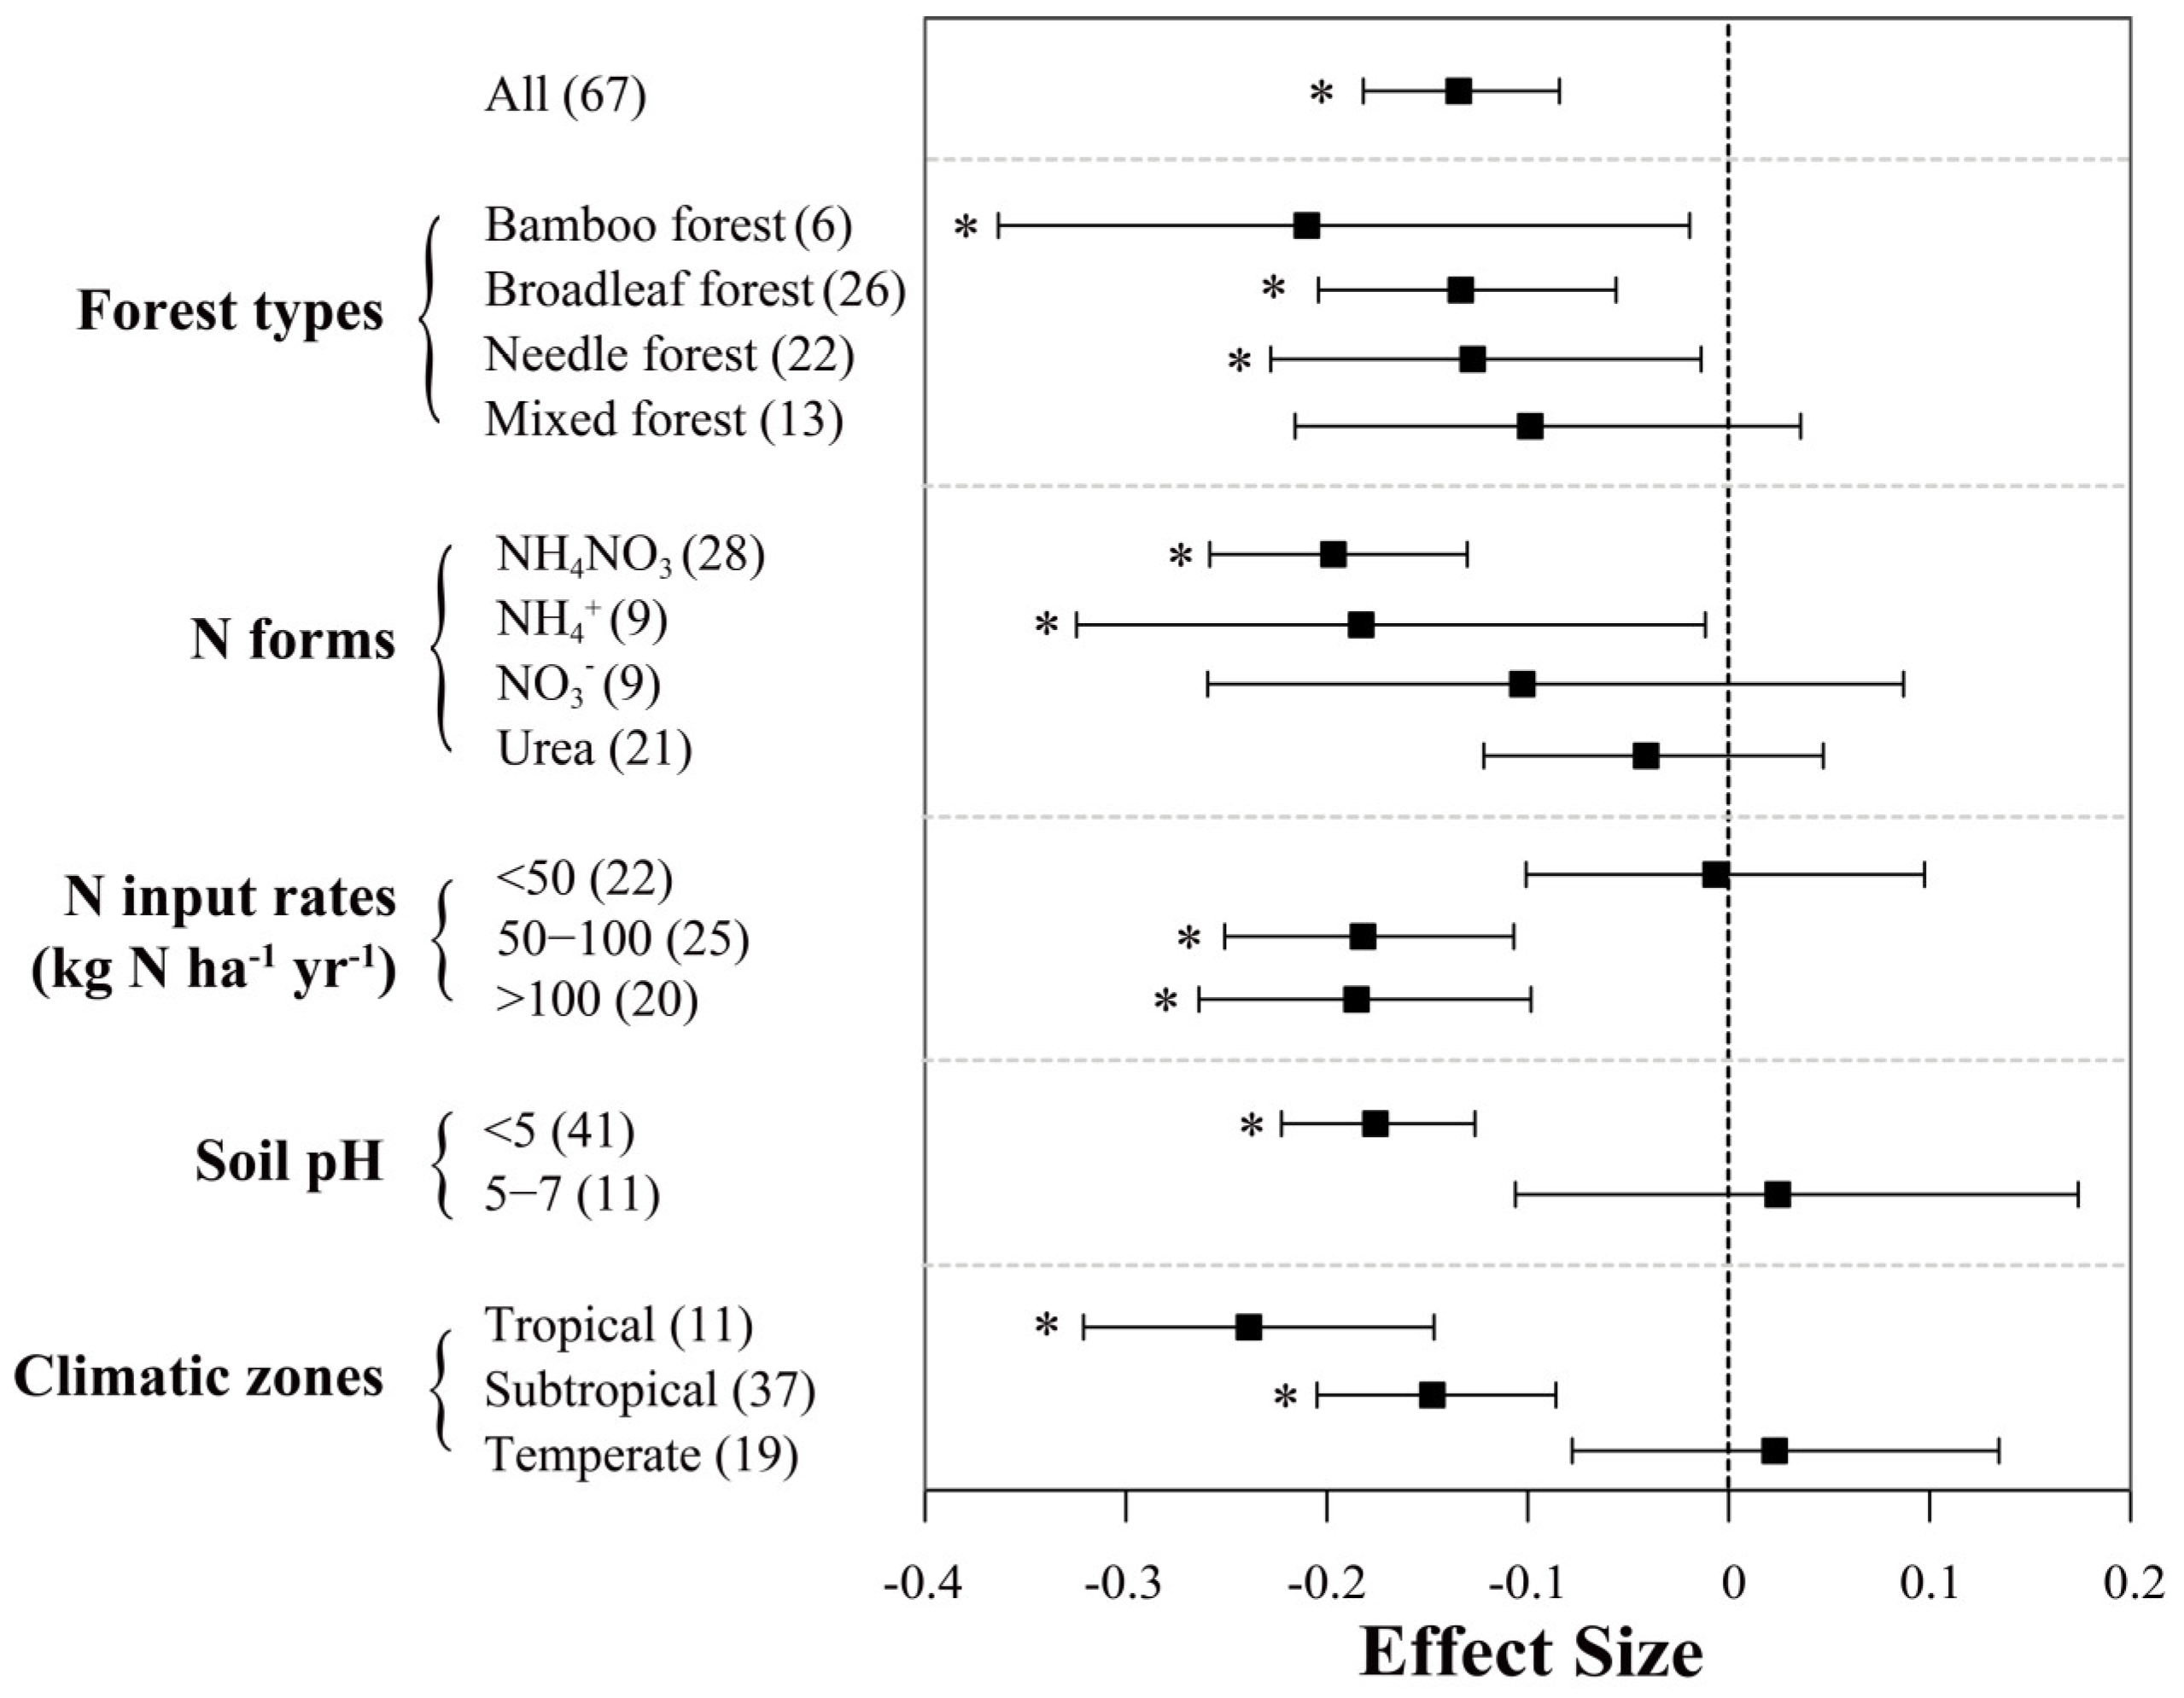
Among all studies evaluated in this work, soil CH4 fluxes (controls) were negative, indicating that these forest soils are acting as net CH4 sinks. In general, enhanced N inputs resulted in a significant decrease of soil CH4 uptake across Chinese forests, with a mean effect size of −13.4% (95% CI: −18.2% to −8.4%; n = 67; Figure 4). Between-group heterogeneity (QB) suggests the response of soil CH4 uptake to N addition is sensitive to most examined factors except for “forest type” (Table 1). Among different climatic zones, N input significantly decreased soil CH4 uptake by 23.9% and 14.8% in tropical and subtropical forests, respectively. However, in temperate forests, our meta-analysis showed that N inputs had a small positive effect on soil CH4 uptake (2.3%), albeit insignificant. N inputs had significant negative effects on soil CH4 uptake rates in bamboo, broadleaf and needle forests, with mean effect sizes of −21.0%, −13.3% and −12.7%, respectively, whereas this was not significant in mixed forest (mean value = −9.9%).

Figure 4.
Effects of N inputs on forest soil CH4 uptake in China. Error bars represent 95% confidence intervals (CI). The vertical dashed line indicates effect size = 0. If the 95% CI does not overlap with zero, the effect of N input is considered as statistically significant and denoted by * in the figure. From top to bottom are the results of subgroups, including “forest types, N forms, N input rates (kg N ha−1 yr−1), soil pH and climatic zones”. Numbers in parentheses represent the sample sizes. It should be noted that all the data in this figure were extracted from studies with a N input duration of less than 5 years.
Among different N forms, NH4NO3 (−19.7%) and NH4+ (−18.3%) had clearly stronger inhibition effects on soil CH4 uptake than NO3− (−10.3%) and urea (−4.1%), of which the latter two N forms showed insignificant effects. Soil CH4 fluxes also responded differently to N input rates: at annual N loads below 50 kg ha−1, the effect on CH4 uptake was slightly negative but not significant; at N input rates of 50–100 or higher than 100 kg N ha−1, the inhibition effects were similar and about 18% on average. Nevertheless, we did not detect significant relationship between N addition rates and response ratios of CH4 uptake in Figure 3b. N addition reduced CH4 uptake by 17.6% in soils with a pH below 5, while this effect appeared to be near 0 on average in soils with a pH of 5 to 7. Based on the regression analysis (Figure 3d), the negative relationship of CH4 uptake with pH was only shown to be significant in the subtropics.
3.3. Comparison with Global Datasets
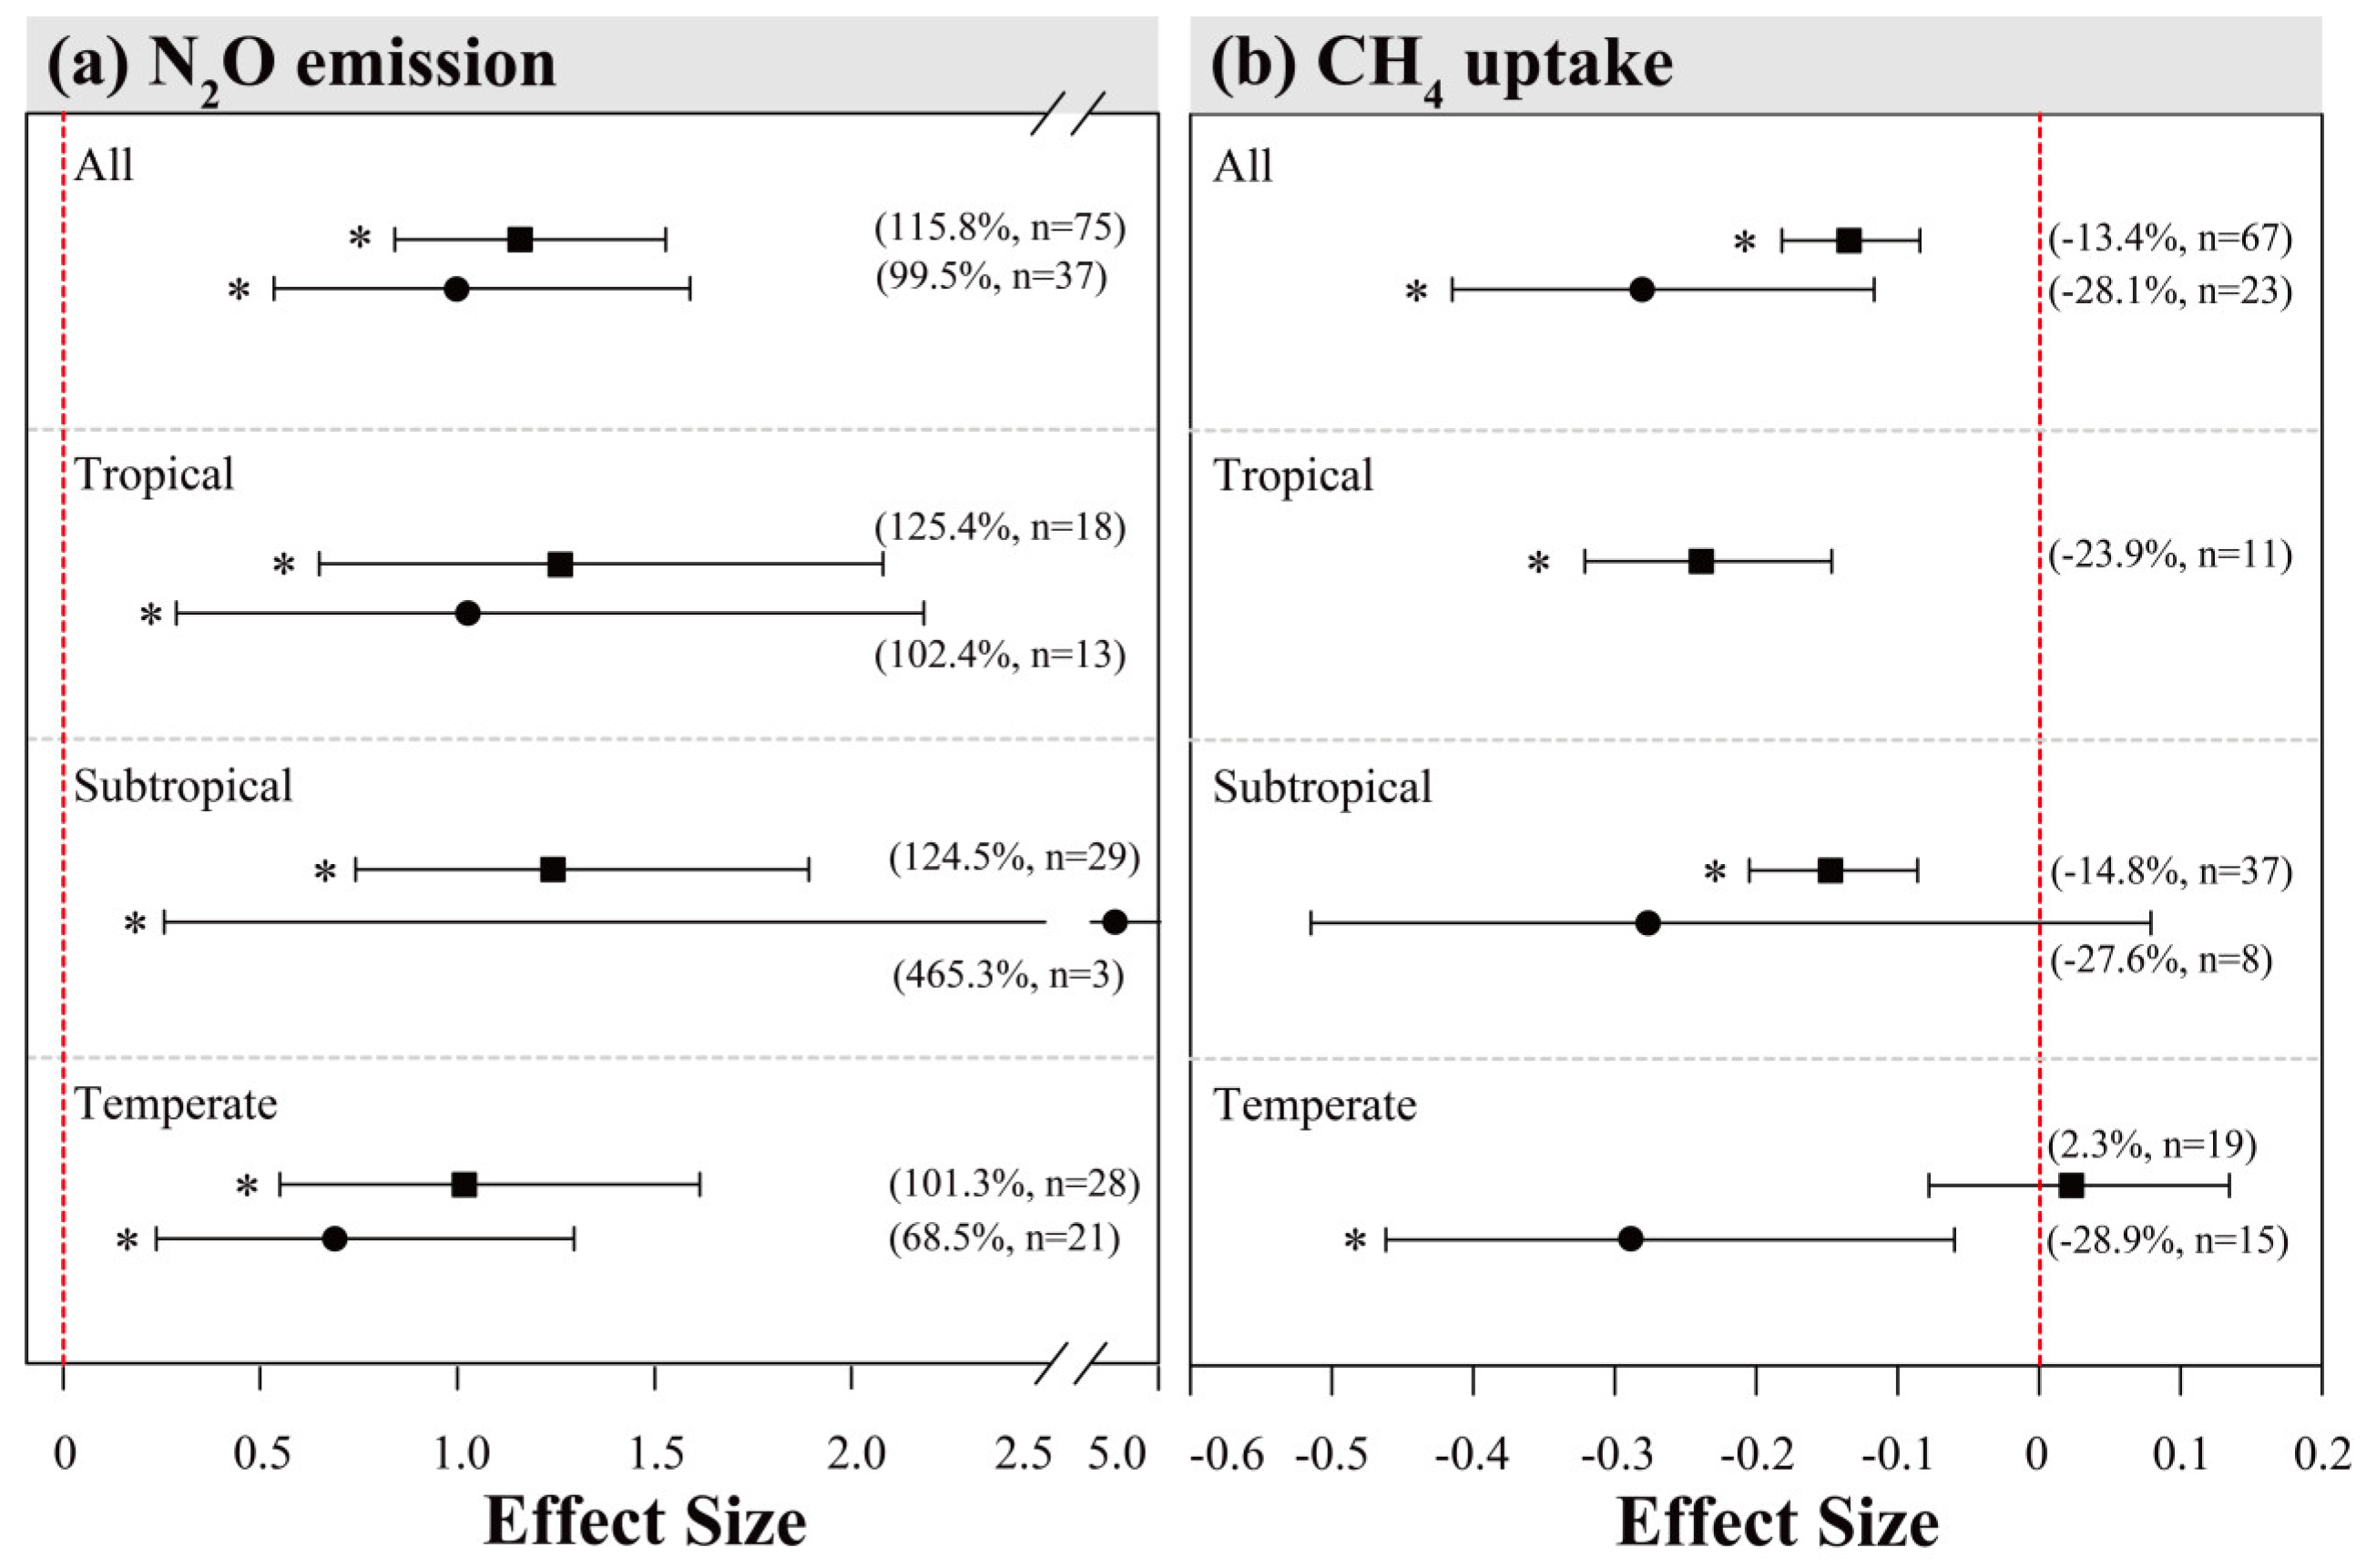
For comparison, we have also performed meta-analyses with other global datasets (sites outside China), including 37 and 23 observations for N2O and CH4, respectively (Figure 5, Appendix A Figure A1 and Figure A2). For N2O, the overall mean effects (Figure 5a; 99.5%) from global sites were lower than those from our Chinese sites. The mean effects of N inputs on N2O emission from the global sites were relatively weaker in tropical and temperate forests, but much stronger in subtropical forests, despite few observations (Figure 5a). In addition, global datasets showed much more positive responses of N2O emission to N addition in needle forests (Figure A1). Interestingly, the results of our subgroup analyses indicated that N inputs of under 50 kg N ha−1 yr−1 had an insignificantly negative (close to 0) impact on N2O flux in other global sites (Figure A1), but this was not seen in China. Within other subgroups, variations of N addition effect sizes from global datasets showed similar patterns as those for China.
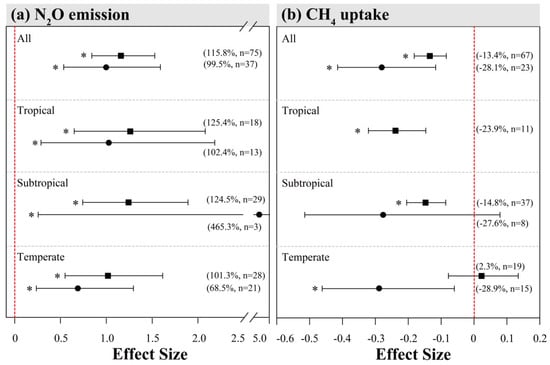
Figure 5.
Comparison of effects of N inputs on forest soil N2O emissions (a) and CH4 uptake (b) among different climatic zones in Chinese and global (outside China) sites. The squares and circles represented mean effect sizes of N inputs on forest soil N2O and CH4 fluxes in China and outside China, respectively. Error bars represent 95% confidence intervals (CI). The vertical red dashed line indicates effect size = 0. If the 95% CI does not overlap with zero, the effect of N input is considered as statistically significant and denoted by * in the figure. From top to bottom are the results of tropical, subtropical and temperate climatic zones. Percentages and numbers in parentheses represent the mean effect sizes and sample sizes, respectively.
From the global dataset, the overall inhibition effect of N addition on CH4 uptake was on average stronger (Figure 5b, overall mean effect size = −28.1%) than the mean effect in Chinese forests. Such pattern is consistent when comparing subgroup variations among climatic zones. In particular, the effect of N addition on CH4 uptake from temperate forests was negative in the global sites, while being close to zero in Chinese sites. The varying patterns of effect sizes within other subgroups were mostly similar between Chinese and global datasets, except that the mean values for the latter were generally larger (Figure A2).
3.4. Response Factors of Soil N2O and CH4 Fluxes Relative to N Input Loads
In order to quantify the responses of soil N2O emissions and CH4 uptake to N loads across Chinese forests and compare them with other studies or IPCC emission factors [1], we calculated the “N2O emission factor” and “CH4 uptake factor” (Table 2). Based on overall mean values, every 1 kg N ha−1 yr−1 will result in an increase of N2O emission by 0.017 kg N2O-N ha−1 yr−1, and a decrease of CH4 uptake by 0.004 kg CH4-C ha−1 yr−1. Nevertheless, these response factors varied widely among individual sites, particularly for the N2O emission factor (from 0.000 to 0.087). Across climatic zones, the soil N2O emission factor was highest in subtropical forests (0.025), followed by temperate (0.016) and tropical (0.010) forests. For soil CH4 uptake, the pattern was different, showing stronger inhibition by N addition in tropical (0.005) and subtropical (0.004) forests than in temperate forests (0.001).
Table 2.
N2O emission factor and CH4 uptake factor relative to N addition from Chinese forests across different climatic zones.
4. Discussion
Based on the overall result from meta-analysis, we found that enhanced N input significantly stimulated soil N2O emissions across all Chinese forests (Figure 2). As most N addition experiments increased total N inputs by several times, or even a magnitude higher, than atmospheric N deposition, our finding is in accordance with the “N saturation” theory, that excessive N substrate in forest soils would lead to enhanced N2O emissions [62]. The effect sizes of our study are generally in line with the other recent studies for natural soils [63,64]. In comparison with the other global forest dataset, as analyzed in this study (99.5%), our mean effect size is slightly larger (115.8%), but significantly smaller than an earlier study with fewer forest sites which reported much larger effects (200–600%) [30]. Interestingly, as shown in the comparison, low N addition rates (<50 kg N ha−1 yr−1) led to significant stimulation of N2O emission in the Chinese sites, but not in the global sites (Figure A1), pointing to the stronger response of Chinese forest N2O emissions to enhanced N input. Such difference may also be linked with the ranges and sizes of datasets, given that our work only covers reports from China. If we adopt the “N2O emission factor” for comparison, the mean N2O emission strength relative to N input is 1.7%, larger than 0.6% for global forests as reported by Liu and Greaver [30], and the IPCC emission factor value of 1% [1]. This suggests that forest soils in China respond significantly to enhanced N input, i.e., the continuing increase of atmospheric N deposition will further stimulate this important N2O source.
Across climatic zones, the effect sizes of N addition on N2O emission were not statistically different (Figure 2), although the mean effects were somewhat different. In the global dataset, the effect sizes were larger on average and highly variable, mainly due to one study from a pine forest in North Carolina where 168 kg N ha−1 fertilizer was used at one application [65]. When comparing N2O emission factors, we found that N2O emission from subtropical forest soils responded most strongly to N addition, with a larger emission factor (2.5%) than the 1% recommended by IPCC (Table 2). In South China, due to chronic N deposition over the last few decades, severe N saturation has been observed in many subtropical forest sites [12,66]. Under warm and humid climate, excessive inorganic N in soils has facilitated hotspots of denitrification [67] and N2O emissions in this region [27]. In addition, due to long-term N and sulfur deposition, enhanced soil acidification is widespread in South China [68]. This results in the inhibition of N2O reduction during denitrification, leading to high N2O emission [26]. Our hypothesis is supported by the stronger response in soils with lower pH (except for pH > 7), as shown in the meta-analysis (Figure 2). Interestingly, we also found that mean N2O emission factors in tropical forests were even lower than in temperate forests (Table 2). Zheng et al. [69] suggested that N2O emission potentials in tropical forests may be dampened due to stronger leaching and N2O reduction with more precipitation. Another explanation could be that, among the tropical sites in our study, there are considerable proportions of young forests (secondary forests) [46,70], which may favor N uptake and reduce the N substrate that is available for N2O production.
The types of N fertilization were shown to significantly affect within-group differences for the reposes of N2O emissions (Table 1). In our analysis, NH4+ resulted in the highest stimulation of N2O emissions, followed by NO3−, which is not significantly different from the results shown for the global dataset. However, other global syntheses have suggested NO3− as the most effective N input form for N2O emissions [30,69]. It is possible that NH4+ is better retained in soils, while NO3− is prone to leaching from the root zone [49]. In a N-saturated system, the majority of ecosystem N loss is via NO3− leaching [12]. Several other studies based on global datasets have investigated the influence of N input forms on N2O emission [30,63,64], but the relative importance between NH4+ and NO3− remains inconclusive. More field observations, especially including side-to-side comparisons, are necessary to elucidate the role of N forms in the future.
Due to limits in experiment design and sampling, most N fertilization experiments in Chinese forests were conducted for one or two years. However, the incorporation of external N inputs by the forest ecosystem would differ between low N dose in the long-term or high N dose in the short term [71]. In our data collection, there are five studies reporting long-term N fertilization effects [39,61,72,73]. In a temperate forest located near Beijing, continuous N fertilization (monthly during growing season) resulted in significant increases of soil N2O fluxes from the third year. However, the long-term experiments in subtropical and tropical sites [39,72] showed no clear difference from other short-term studies, and it showed even more variable effects on N2O emissions among the global sites (Figure A1). Climatic impacts on N2O emissions may overwrite the influence of addition N inputs, particularly in South China where background N deposition has already been high. On the other hand, Aronson and Allison [74] performed a meta-study for non-agricultural soils and suggested that ecosystem accumulation of long-term N deposition would suppress the response of soil N2O emissions. Nevertheless, more field evidence is needed to test such a mechanism.
As shown by Figure 4, our meta-analysis indicates a significant inhibition effect of enhanced N inputs on soil CH4 uptake across Chinese forests. Among different N forms, NH4+ (including NH4NO3) was most effective in suppressing CH4 uptake, which fits well with the common understanding that excessive NH4+ in soils would compete with CH4 for methanotrophic enzymes [31]. Our mean effect size (−13.4%) is smaller than that for the global dataset (−28.1%) and other global meta-analyses for natural non-wetland soils, varying from −80% to −40% [30,63,75,76,77]. The decrease of CH4 uptake relative to N addition, i.e., “uptake factors”, were 0.004 kg CH4-C ha−1 yr−1 on average in our study, which is significantly smaller than 0.017 kg CH4-C ha−1 yr−1 from a previous global study [30]. It is possible that, at the studied sites, especially in South China, chronic N deposition has already resulted in inhibition of soil CH4 uptake in the control plots, making the effects of additional N addition less apparent. On the other hand, in a review of CH4 uptake across Chinese upland soils, Wang et al. [5] suggested that Chinese forests are under significant disturbance such as logging and new plantation. Soils from the new plantations are likely to contribute to smaller CH4 uptake rates (e.g., rubber plantation [77]). Moreover, Wu et al. [78] suggested in a recent meta-study that soil CH4 uptake in undisturbed ecosystems is more sensitive to N addition.
The CH4 sink activity in Chinese forest soils responded distinctly depending on N input rates (Figure 4). With N loads below 50 kg ha−1 yr−1, the effect was insignificant; with N loads above 50 or even 100 kg ha−1 yr−1, CH4 uptake rates decreased by 18%. This is largely in line with the other studies based on meta-analyses [50,76] or field experiments [79]. Accordingly, the N effect on CH4 flux was not significant in Chinese temperate forests that are relatively N-limited, while the inhibition effect was more apparent in more N-saturated subtropical and tropical forests. Moderate N addition may be partly assimilated by forests for growth, while high N addition leads to N saturation and excessive inorganic N in soils, thus significantly inhibiting methanotrophic activity [31]. Alternatively, Aronson and Helliker [28] also proposed that under low N input loads (N limitation), methanotrophs tend to grow and replicate, rather than oxidize methane. Meanwhile, enhanced N inputs may also stimulate activities of methanogens and increase emission potentials of CH4 from forest soils [29]. In Northwest China, after a moderate N addition of 20 kg N ha−1 yr−1, Song et al. [55] reported a clear switch of CH4 sink to source in the temperate forest soils, although the sink strength was small (about 6 μg CH4 m−2 h−1). In a N-saturated subtropical forest located in Southwest China, Yu et al. [22] reported significant soil CH4 emissions during monsoonal summers that was comparable with wetland soils. Therefore, the potential contribution of methanogens should not be overlooked in future research in upland soils from Chinese forests.
We also found that climatic zones and soil pH play important roles in modulating the responses of soil CH4 uptake to N addition (Figure 4), showing significant negative effects in low pH and subtropical/tropical forest soils. However, for soil CH4 uptake rates from unmanaged forest sites (non-fertilization), there are no clear differences among climatic zones in China [5]. Alternatively, such a pattern may reflect the spatial distribution of background N deposition [80]. In addition, excessive N inputs would lead to aggravated phosphorus limitations in these forest soils from South China [81], which is another important factor governing soil methanotrophic activity [43,82].
5. Conclusions
In this study, we conducted a meta-analysis to examine the effects of enhanced N inputs on soil N2O and CH4 fluxes across Chinese forests. Our results indicate that increases of N deposition inputs significantly stimulate soil N2O emissions and inhibit soil CH4 uptake in Chinese forests. The effect sizes of our study are generally higher for stimulation of N2O emission and lower for inhibition of CH4 uptake than those determined with the global dataset, suggesting that the response of Chinese forest ecosystems to enhanced N inputs may not fully resemble the patterns shown for global datasets. We also quantified the response relative to N input amounts, with mean N2O emission factors of 0.017 kg N2O-N ha−1 yr−1 per 1 kg N ha−1 yr−1 and CH4 uptake factors of −0.004 kg CH4-C ha−1 yr−1 per 1 kg N ha−1 yr−1. Among climatic zones, warm humid subtropical forests are likely to contribute the strongest N2O source in response to enhanced N input, while subtropical and tropical forest soils in the south may show the largest reduction in CH4 uptake rates. In South China, with warm humid climate and high N deposition pressure, forest soils may facilitate active C and N cycling, and play an important role in the regional greenhouse gas budget.
Author Contributions
Conceptualization, B.Z. and L.Y.; methodology and software, B.Z.; validation, B.Z., L.Y. and T.Z.; formal analysis, B.Z. and Y.H.; resources, L.Y.; data curation, B.Z. and Y.H.; writing—original draft preparation, B.Z.; writing—review and editing, B.Z., L.Y. and Z.Q.; supervision, L.Y.; funding acquisition, L.Y. All authors have read and agreed to the published version of the manuscript.
Funding
This work was supported by GuangDong Basic and Applied Basic Research Foundation (Project No. 2020A1515110568) and Guangxi Key Science and Technology Innovation Base on Karst Dynamics (Project No. KDL&Guangxi202104).
Institutional Review Board Statement
Not applicable.
Data Availability Statement
The data source used for the meta-analysis can be downloaded at: https://figshare.com/s/3ae73372df487814c8c1, accessed on 13 July 2022.
Acknowledgments
We are grateful to the authors and organizations who contributed to the data used in this study.
Conflicts of Interest
The authors declare no conflict of interest. The funders had no role in the design of the study; in the collection, analyses, or interpretation of data; in the writing of the manuscript, or in the decision to publish the results.
Appendix A

Figure A1.
Effects of N inputs on forest soil N2O emissions outside China. Error bars represent 95% confidence intervals (CI). The vertical dashed line indicates effect size = 0. If the 95% CI does not overlap with zero, the effect of N input is considered as statistically significant and denoted by * in the figure. From top to bottom are the results of subgroups, including “forest types, N forms, N input rates (kg N ha−1 yr−1), N addition duration (yr), soil pH and climatic zones”. Numbers in parentheses represent the sample sizes.
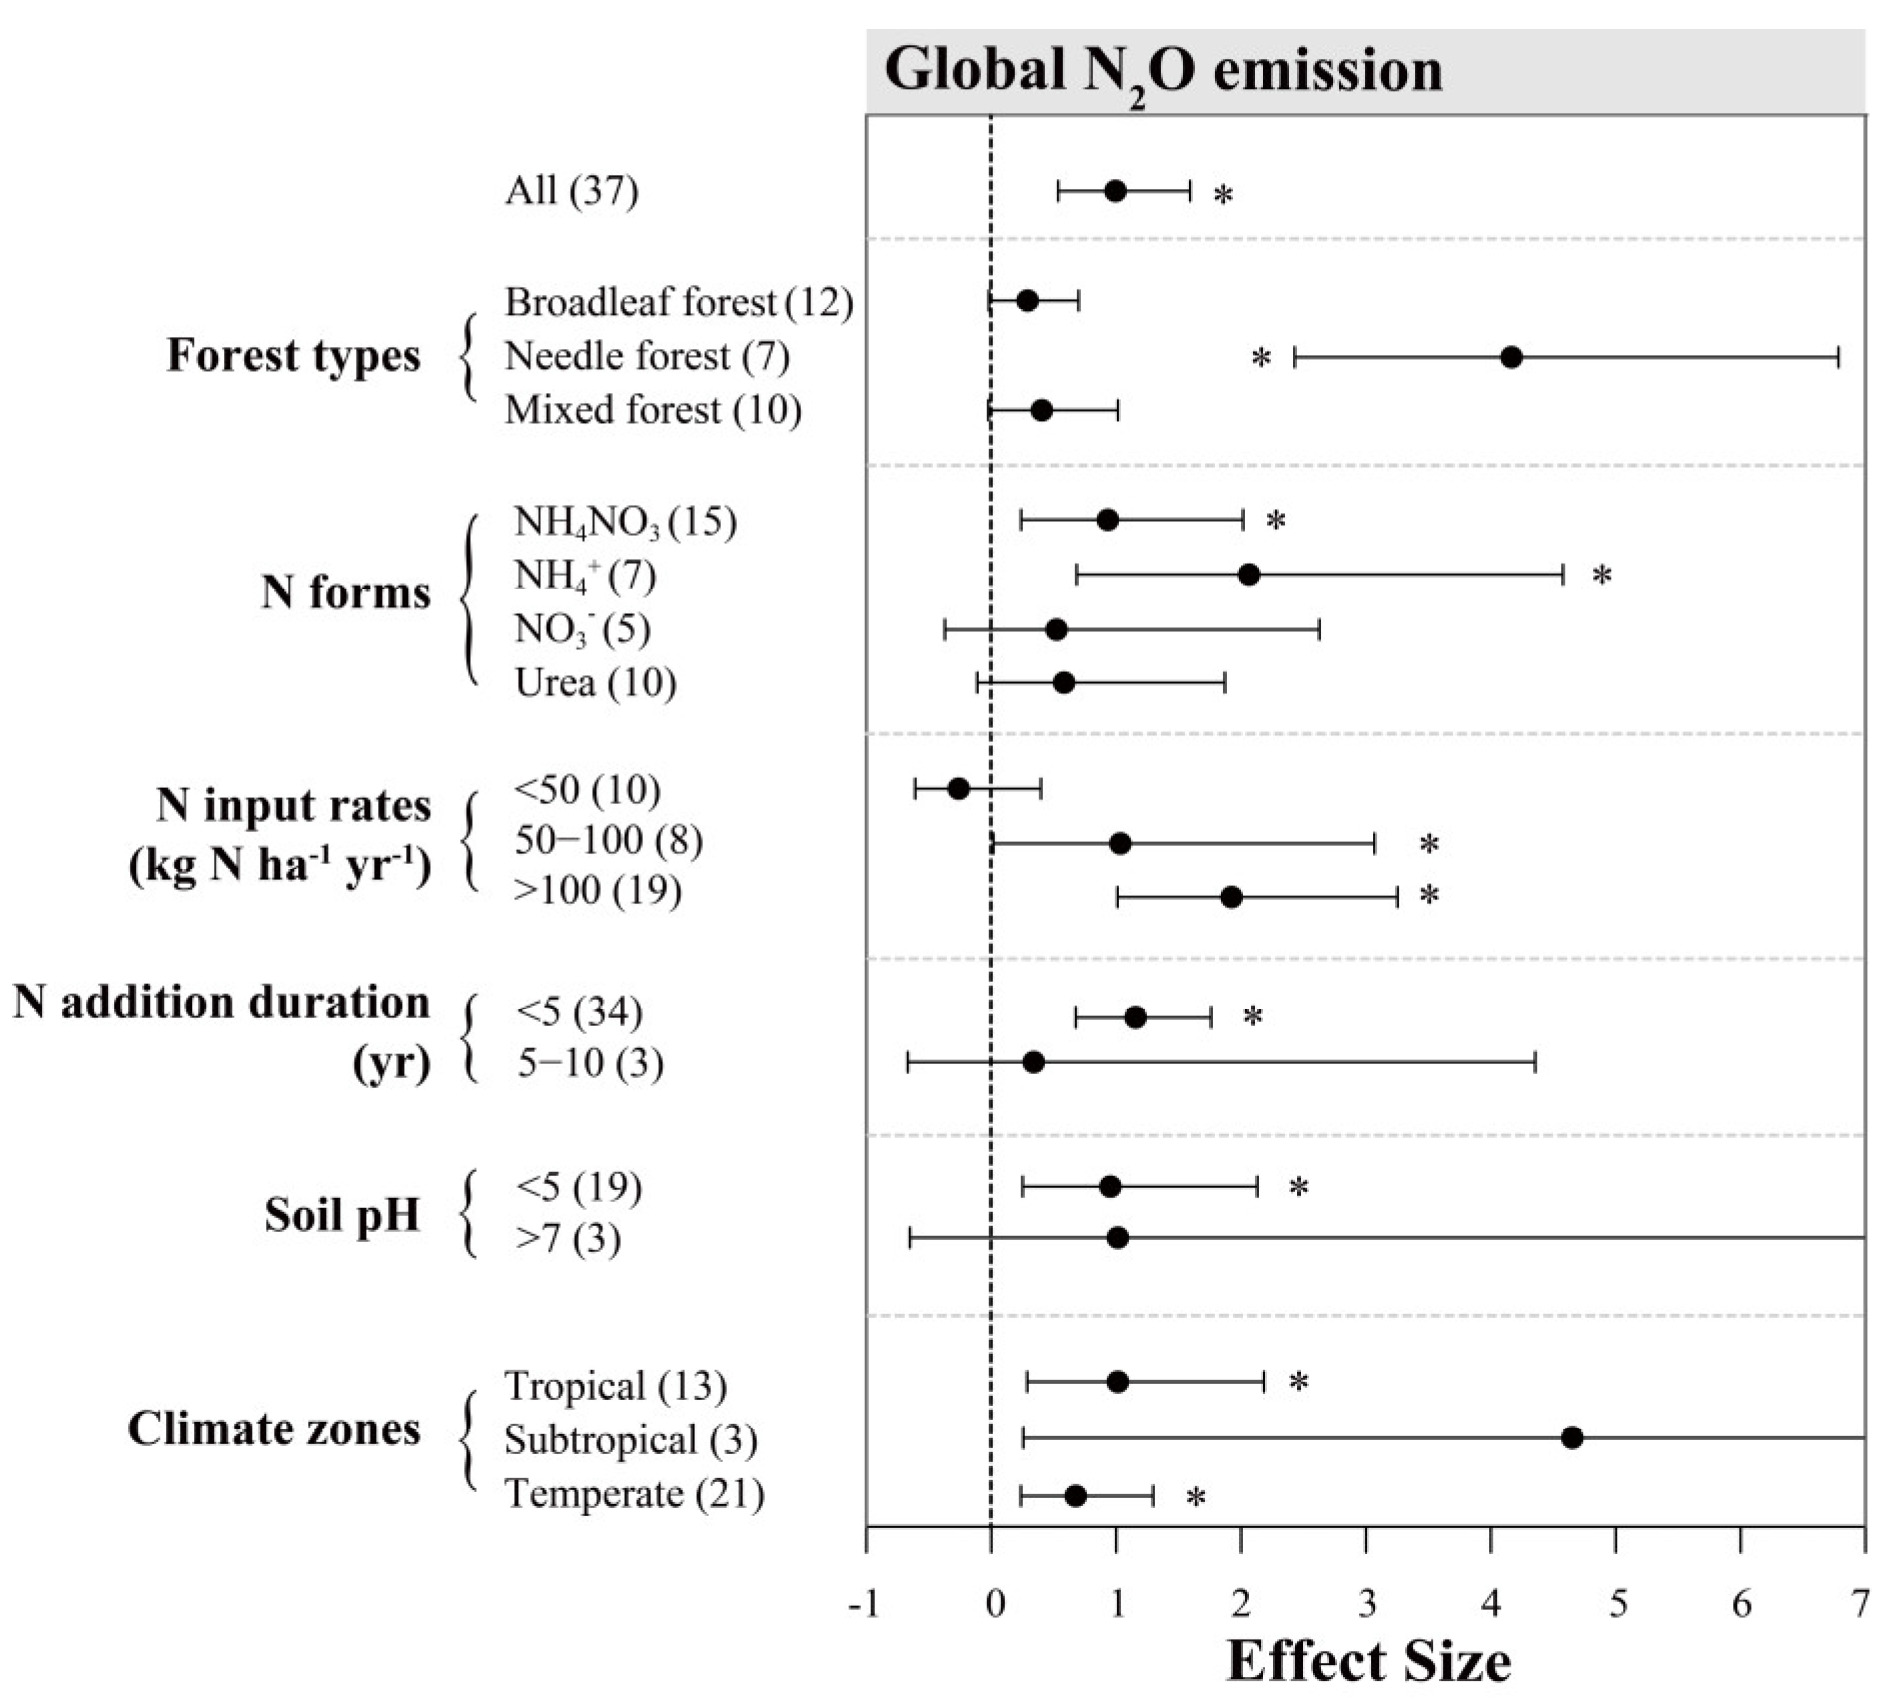
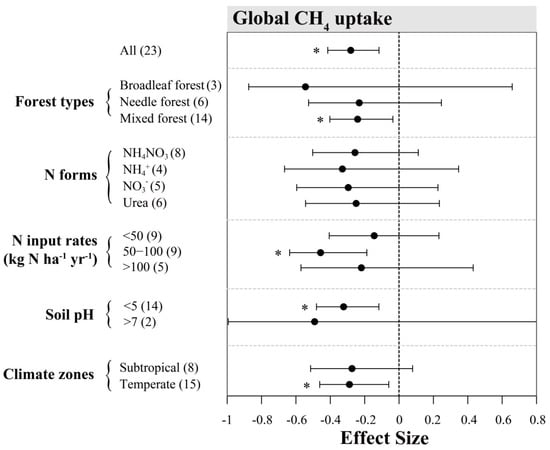
Figure A2.
Effects of N inputs on forest soil CH4 emissions outside China. Error bars represent 95% confidence intervals (CI). The vertical dashed line indicates effect size = 0. If the 95% CI does not overlap with zero, the effect of N input is considered as statistically significant and denoted by * in the figure. From top to bottom are the results of subgroups, including “forest types, N forms, N input rates (kg N ha−1 yr−1), soil pH and climatic zones”. Numbers in parentheses represent the sample sizes.

References
- Myhre, G.; Shindell, D.; Bréon, F.-M.; Collins, W.; Fuglestvedt, J.; Huang, J.; Koch, D.; Lamarque, J.-F.; Lee, D.; Mendoza, B.; et al. Anthropogenic and Natural Radiative Forcing. In Climate Change 2013 the Physical Science Basis: Working Group I Contribution to the Fifth Assessment Report of the Intergovernmental Panel on Climate Change; Stocker, T.F., Qin, D., Plattner, G.-K., Tignor, M., Allen, S.K., Boschung, J., Nauels, A., Xia, Y., Bex, V., Eds.; Cambridge University Press: Cambridge, UK; New York, NY, USA, 2013. [Google Scholar]
- Tian, H.; Xu, R.; Canadell, J.G.; Thompson, R.L.; Winiwarter, W.; Suntharalingam, P.; Davidson, E.A.; Ciais, P.; Jackson, R.B.; Janssens-Maenhout, G.; et al. A comprehensive quantification of global nitrous oxide sources and sinks. Nature 2020, 586, 248–256. [Google Scholar]
- Nisbet, E.G.; Fisher, R.E.; Lowry, D.; France, J.L.; Allen, G.; Bakkaloglu, S.; Broderick, T.J.; Cain, M.; Coleman, M.; Fernandez, J.; et al. Methane Mitigation: Methods to Reduce Emissions, on the Path to the Paris Agreement. Rev. Geophys. 2020, 58, e2019RG000675. [Google Scholar]
- Xu-Ri; Wang, Y.; Wang, Y.; Niu, H.; Liu, Y.; Zhuang, Q. Estimating N2O emissions from soils under natural vegetation in China. Plant Soil 2019, 434, 271–287. [Google Scholar]
- Wang, Y.; Chen, H.; Zhu, Q.; Peng, C.; Wu, N.; Yang, G.; Zhu, D.; Tian, J.; Tian, L.; Kang, X.; et al. Soil methane uptake by grasslands and forests in China. Soil Biol. Biochem. 2014, 74, 70–81. [Google Scholar]
- Zhou, F.; Shang, Z.; Ciais, P.; Tao, S.; Piao, S.; Raymond, P.; He, C.; Li, B.; Wang, R.; Wang, X.; et al. A new high-resolution N2O emission inventory for China in 2008. Environ. Sci. Technol. 2014, 48, 8538–8547. [Google Scholar]
- Wei, D.; Zhao, H.; Huang, L.; Qi, Y.; Wang, X. Feedbacks of Alpine Wetlands on the Tibetan Plateau to the Atmosphere. Wetlands 2019, 40, 787–797. [Google Scholar]
- Wang, X. China’s Forest Coverage Rate is 22.96%. Green China 2019, 12, 54–57. [Google Scholar]
- Liu, X.; Zhang, Y.; Han, W.; Tang, A.; Shen, J.; Cui, Z.; Vitousek, P.; Erisman, J.W.; Goulding, K.; Christie, P.; et al. Enhanced nitrogen deposition over China. Nature 2013, 494, 459–462. [Google Scholar]
- Chen, X.Y.; Mulder, J. Atmospheric deposition of nitrogen at five subtropical forested sites in South China. Sci. Total Environ. 2007, 378, 317–330. [Google Scholar]
- Hu, Y.; Han, S.; Li, X.; Zhao, Y.; Lli, D. Responses of soil available nitrogen of natural forest and secondary forest to simulated N deposition in Changbai Mountain. J. Northeast Forest. Univ. 2009, 37, 36–38+42. [Google Scholar]
- Huang, Y.; Kang, R.; Mulder, J.; Zhang, T.; Duan, L. Nitrogen saturation, soil acidification, and ecological effects in a subtropical pine forest on acid soil in southwest China. J. Geophys. Res. Biogeosci. 2015, 120, 2457–2472. [Google Scholar]
- Yang, Y.; Ji, C.; Ma, W.; Wang, S.; Wang, S.; Han, W.; Mohammat, A.; Robinson, D.; Smith, P. Significant soil acidification across northern China’s grasslands during 1980s–2000s. Glob. Chang. Biol. 2012, 18, 2292–2300. [Google Scholar]
- Lu, X.; Mo, J.; Gilliam, F.S.; Zhou, G.; Fang, Y. Effects of experimental nitrogen additions on plant diversity in an old-growth tropical forest. Glob. Chang. Biol. 2010, 16, 2688–2700. [Google Scholar]
- Lu, X.; Vitousek, P.M.; Mao, Q.; Gilliam, F.S.; Luo, Y.; Turner, B.L.; Zhou, G.; Mo, J. Nitrogen deposition accelerates soil carbon sequestration in tropical forests. Proc. Natl. Acad. Sci. USA 2021, 118, e2020790118. [Google Scholar]
- Lu, X.; Vitousek, P.M.; Mao, Q.; Gilliam, F.S.; Luo, Y.; Zhou, G.; Zou, X.; Bai, E.; Scanlon, T.M.; Hou, E.; et al. Plant acclimation to long-term high nitrogen deposition in an N-rich tropical forest. Proc. Natl. Acad. Sci. USA 2018, 115, 5187–5192. [Google Scholar]
- Wood, T.E.; Cavaleri, M.A.; Reed, S.C. Tropical forest carbon balance in a warmer world: A critical review spanning microbial- to ecosystem-scale processes. Biol. Rev. Camb. Philos. Soc. 2012, 87, 912–927. [Google Scholar]
- Firestone, M.; Davidson, E. Microbiological basis of NO and N2O production and consumption in soil. In Exchange of Trace Gases between Terrestrial Ecosystems and the Atmosphere; Wiley: New York, NY, USA, 1989; Volume 47, pp. 7–21. [Google Scholar]
- Harter, J.; Krause, H.M.; Schuettler, S.; Ruser, R.; Fromme, M.; Scholten, T.; Kappler, A.; Behrens, S. Linking N2O emissions from biochar-amended soil to the structure and function of the N-cycling microbial community. ISME J. 2014, 8, 660–674. [Google Scholar]
- Khalil, K.; Mary, B.; Renault, P. Nitrous oxide production by nitrification and denitrification in soil aggregates as affected by O2 concentration. Soil Biol. Biochem. 2004, 36, 687–699. [Google Scholar]
- Xu, R.I.; Prentice, I.C. Terrestrial nitrogen cycle simulation with a dynamic global vegetation model. Glob. Chang. Biol. 2008, 14, 1745–1764. [Google Scholar]
- Yu, L.; Zhu, J.; Zhang, X.; Wang, Z.; Dörsch, P.; Mulder, J. Humid Subtropical Forests Constitute a Net Methane Source: A Catchment-Scale Study. J. Geophys. Res. Biogeosci. 2019, 124, 2927–2942. [Google Scholar]
- Yu, L.; Zhu, J.; Ji, H.; Bai, X.; Lin, Y.; Zhang, Y.; Sha, L.; Liu, Y.; Song, Q.; Dörsch, P.; et al. Topography-related controls on N2O emission and CH4 uptake in a tropical rainforest catchment. Sci. Total Environ. 2021, 775, 145616. [Google Scholar]
- Bateman, E.J.; Baggs, E.M. Contributions of nitrification and denitrification to N2O emissions from soils at different water-filled pore space. Biol. Fertil. Soils 2005, 41, 379–388. [Google Scholar]
- Braker, G.; Conrad, R. Diversity, structure, and size of N2O-producing microbial communities in soils—What matters for their functioning? Adv. Appl. Microbiol. 2011, 75, 33–70. [Google Scholar]
- Liu, B.; Morkved, P.T.; Frostegard, A.; Bakken, L.R. Denitrification gene pools, transcription and kinetics of NO, N2O and N2 production as affected by soil pH. FEMS Microbiol. Ecol. 2010, 72, 407–417. [Google Scholar]
- Zhu, J.; Mulder, J.; Wu, L.P.; Meng, X.X.; Wang, Y.H.; Dörsch, P. Spatial and temporal variability of N2O emissions in a subtropical forest catchment in China. Biogeosciences 2013, 10, 1309–1321. [Google Scholar]
- Zhuang, Q.; Chen, M.; Xu, K.; Tang, J.; Saikawa, E.; Lu, Y.; Melillo, J.M.; Prinn, R.G.; McGuire, A.D. Response of global soil consumption of atmospheric methane to changes in atmospheric climate and nitrogen deposition. Glob. Biogeochem. Cycles 2013, 27, 650–663. [Google Scholar]
- Me, J.L.; Roger, P. Production, oxidation, emission and consumption of methane by soils: A review. Eur. J. Soil Biol. 2001, 37, 25–50. [Google Scholar]
- Liu, L.; Greaver, T.L. A review of nitrogen enrichment effects on three biogenic GHGs: The CO2 sink may be largely offset by stimulated N2O and CH4 emission. Ecol. Lett. 2009, 12, 1103–1117. [Google Scholar]
- Bodelier, P.L.E.; Laanbroek, H.J. Nitrogen as a regulatory factor of methane oxidation in soils and sediments. FEMS Microbiol. Ecol. 2004, 47, 265–277. [Google Scholar]
- Bédard, C.; Knowles, R. Physiology, biochemistry, and specific inhibitors of CH4, NH4+, and CO oxidation by methanotrophs and nitrifiers. Microbiol. Rev. 1989, 53, 68–84. [Google Scholar]
- Carlsen, H.N.; Joergensen, L.; Degn, H. Inhibition by ammonia of methane utilization in Methylococcus capsulatus (Bath). Appl. Microbiol. Biotechnol. 1991, 35, 124–127. [Google Scholar]
- Kightley, D.; Nedwell, D.B.; Cooper, M. Capacity for methane oxidation in landfill cover soils measured in laboratory-scale soil microcosms. Appl. Environ. Microbiol. 1995, 61, 592–601. [Google Scholar]
- Wang, Z.-P.; Ineson, P. Methane oxidation in a temperate coniferous forest soil: Effects of inorganic N. Soil Biol. Biochem. 2003, 35, 427–433. [Google Scholar]
- Geng, S.; Chen, Z.; Han, S.; Wang, F.; Zhang, J. Rainfall reduction amplifies the stimulatory effect of nitrogen addition on N2O emissions from a temperate forest soil. Sci. Rep. 2017, 7, 43329. [Google Scholar]
- Fan, J.; Luo, R.; McConkey, B.G.; Ziadi, N. Effects of nitrogen deposition and litter layer management on soil CO2, N2O, and CH4 emissions in a subtropical pine forestland. Sci. Rep. 2020, 10, 8959. [Google Scholar]
- Zhang, K.; Zheng, H.; Chen, F.; Li, R.; Yang, M.; Ouyang, Z.; Lan, J.; Xiang, X. Impact of nitrogen fertilization on soil-Atmosphere greenhouse gas exchanges in eucalypt plantations with different soil characteristics in southern China. PLoS ONE 2017, 12, e0172142. [Google Scholar]
- Chen, H.; Gurmesa, G.A.; Zhang, W.; Zhu, X.; Zheng, M.; Mao, Q.; Zhang, T.; Mo, J.; Kitajima, K. Nitrogen saturation in humid tropical forests after 6 years of nitrogen and phosphorus addition: Hypothesis testing. Funct. Ecol. 2015, 30, 305–313. [Google Scholar]
- Klemedtsson, L.; Klemedtsson, Å.; Moldan, F.; Weslien, P. Nitrous oxide emission from Swedish forest soils in relation to liming and simulated increased N-deposition. Biol. Fertil. Soils 1997, 25, 290–295. [Google Scholar]
- Zhou, W.J.; Ji, H.L.; Zhu, J.; Zhang, Y.P.; Sha, L.Q.; Liu, Y.T.; Zhang, X.; Zhao, W.; Dong, Y.X.; Bai, X.L.; et al. The effects of nitrogen fertilization on N2O emissions from a rubber plantation. Sci. Rep. 2016, 6, 28230. [Google Scholar]
- Zhang, W.; Zhu, X.; Luo, Y.; Rafique, R.; Chen, H.; Huang, J.; Mo, J. Responses of nitrous oxide emissions to nitrogen and phosphorus additions in two tropical plantations with N-fixing vs. non-N-fixing tree species. Biogeosciences 2014, 11, 4941–4951. [Google Scholar]
- Zheng, M.; Zhang, T.; Liu, L.; Zhu, W.; Zhang, W.; Mo, J. Effects of nitrogen and phosphorus additions on nitrous oxide emission in a nitrogen-rich and two nitrogen-limited tropical forests. Biogeosciences 2016, 13, 3503–3517. [Google Scholar]
- Cheng, S.; Wang, L.; Fang, H.; Yu, G.; Yang, X.; Li, X.; Si, G.; Geng, J.; He, S.; Yu, G. Nonlinear responses of soil nitrous oxide emission to multi-level nitrogen enrichment in a temperate needle-broadleaved mixed forest in Northeast China. Catena 2016, 147, 556–563. [Google Scholar]
- Shcherbak, I.; Millar, N.; Robertson, G.P. Global metaanalysis of the nonlinear response of soil nitrous oxide (N2O) emissions to fertilizer nitrogen. Proc. Natl. Acad. Sci. USA 2014, 111, 9199–9204. [Google Scholar]
- Zhang, W.; Mo, J.; Yu, G.; Fang, Y.; Li, D.; Lu, X.; Wang, H. Emissions of nitrous oxide from three tropical forests in Southern China in response to simulated nitrogen deposition. Plant Soil 2008, 306, 221–236. [Google Scholar]
- Zhang, W.; Zhu, X.; Liu, L.; Fu, S.; Chen, H.; Huang, J.; Lu, X.; Liu, Z.; Mo, J. Large difference of inhibitive effect of nitrogen deposition on soil methane oxidation between plantations with N-fixing tree species and non-N-fixing tree species. J. Geophys. Res. Biogeosci. 2012, 117. [Google Scholar] [CrossRef]
- Xu, M.; Cheng, S.; Fang, H.; Yu, G.; Gao, W.; Wang, Y.; Dang, X.; Li, L. Low-Level Nitrogen Addition Promotes Net Methane Uptake in a Boreal Forest across the Great Xing’an Mountain Region, China. Forest. Sci. 2014, 60, 973–981. [Google Scholar]
- Yu, L.; Wang, Y.; Zhang, X.; Dörsch, P.; Mulder, J. Phosphorus addition mitigates N2O and CH4 emissions in N-saturated subtropical forest, SW China. Biogeosciences 2017, 14, 3097–3109. [Google Scholar]
- Aronson, E.L.; Helliker, B.R. Methane flux in non-wetland soils in response to nitrogen addition: A meta-analysis. Ecology 2010, 91, 3242–3251. [Google Scholar]
- Li, Z.; Tian, D.; Wang, B.; Wang, J.; Wang, S.; Chen, H.Y.H.; Xu, X.; Wang, C.; He, N.; Niu, S. Microbes drive global soil nitrogen mineralization and availability. Glob. Chang. Biol. 2019, 25, 1078–1088. [Google Scholar]
- Cai, Z. Greenhouse gas budget for terrestrial ecosystems in China. Sci. China Earth Sci. 2012, 55, 173–182. [Google Scholar]
- Treseder, K.K. A meta-analysis of mycorrhizal responses to nitrogen, phosphorus, and atmospheric CO2 in field studies. New Phytol. 2004, 164, 347–355. [Google Scholar]
- Luo, Y.; Hui, D.; Zhang, D. Elevated CO2 Stimulates Net Accumulations of Carbon and Nitrogen in Land Ecosystems: A Meta-Analysis. Ecology 2006, 87, 53–63. [Google Scholar]
- Song, L.; Tian, P.; Zhang, J.; Jin, G. Effects of three years of simulated nitrogen deposition on soil nitrogen dynamics and greenhouse gas emissions in a Korean pine plantation of northeast China. Sci. Total Environ. 2017, 609, 1303–1311. [Google Scholar]
- Hedges, L.V.; Gurevitch, J.; Curtis, P.S. The meta-analysis of response ratios in experimental ecology. Ecology 1999, 80, 1150–1156. [Google Scholar]
- Han, M.; Zhu, B. Changes in soil greenhouse gas fluxes by land use change from primary forest. Glob. Chang. Biol. 2020, 26, 2656–2667. [Google Scholar]
- Hedges, L.V.; Olkin, I. Statistical Methods for Meta-Analysis; Academic Press: New York, NY, USA, 1985. [Google Scholar]
- Valkama, E.; Koricheva, J.; Oksanen, E. Effects of elevated O3, alone and in combination with elevated CO2, on tree leaf chemistry and insect herbivore performance: A meta-analysis. Glob. Chang. Biol. 2007, 13, 184–201. [Google Scholar]
- Borenstein, M.; Hedges, L.V.; Higgins, J.P.; Rothstein, H.R. A basic introduction to fixed-effect and random-effects models for meta-analysis. Res. Synth. Methods. 2010, 1, 97–111. [Google Scholar]
- Xu, K.; Wang, C.; Yang, X. Five-year study of the effects of simulated nitrogen deposition levels and forms on soil nitrous oxide emissions from a temperate forest in northern China. PLoS ONE 2017, 12, e0189831. [Google Scholar]
- Aber, J.; McDowell, W.; Nadelhoffer, K.; Magill, A.; Berntson, G.; Kamakea, M.; McNulty, S.; Currie, W.; Rustad, L.; Fernandez, I. Nitrogen Saturation in Temperate Forest Ecosystems: Hypotheses revisited. BioScience 1998, 48, 921–934. [Google Scholar]
- Deng, L.; Huang, C.; Kim, D.-G.; Shangguan, Z.; Wang, K.; Song, X.; Peng, C. Soil GHG fluxes are altered by N deposition: New data indicate lower N stimulation of the N2O flux and greater stimulation of the calculated C pools. Glob. Chang. Biol. 2020, 26, 2613–2629. [Google Scholar]
- Shen, Y.; Zhu, B. Effects of nitrogen and phosphorus enrichment on soil N2O emission from natural ecosystems: A global meta-analysis. Environ. Pollut. 2022, 301, 118993. [Google Scholar]
- Shrestha, R.K.; Strahm, B.D.; Sucre, E.B. Nitrous Oxide Fluxes in Fertilized L. Plantations across a Gradient of Soil Drainage Classes. J. Environ. Qual. 2014, 43, 1823–1832. [Google Scholar]
- Yu, Q.; Duan, L.; Yu, L.; Chen, X.; Si, G.; Ke, P.; Ye, Z.; Mulder, J. Threshold and multiple indicators for nitrogen saturation in subtropical forests. Environ. Pollut. 2018, 241, 664–673. [Google Scholar]
- Yu, L.; Mulder, J.; Zhu, J.; Zhang, X.; Wang, Z.; Dorsch, P. Denitrification as a major regional nitrogen sink in subtropical forest catchments: Evidence from multi-site dual nitrate isotopes. Glob. Chang. Biol. 2019, 25, 1765–1778. [Google Scholar]
- Zhao, Y.; Duan, L.; Xing, J.; Larssen, T.; Nielsen, C.P.; Hao, J. Soil Acidification in China: Is Controlling SO2 Emissions Enough? Environ. Sci. Technol. 2009, 43, 8021–8026. [Google Scholar]
- Zheng, X.; Liu, Q.; Ji, X.; Cao, M.; Zhang, Y.; Jiang, J. How do natural soil NH4+, NO3− and N2O interact in response to nitrogen input in different climatic zones? A global meta-analysis. Eur. J. Soil Sci. 2021, 72, 2231–2245. [Google Scholar]
- Wang, F.; Li, J.; Wang, X.; Zhang, W.; Zou, B.; Neher, D.A.; Li, Z. Nitrogen and phosphorus addition impact soil N2O emission in a secondary tropical forest of South China. Sci. Rep. 2014, 4, 5615. [Google Scholar]
- HÖGberg, P.; Fan, H.; Quist, M.; Binkley, D.A.N.; Tamm, C.O. Tree growth and soil acidification in response to 30 years of experimental nitrogen loading on boreal forest. Glob. Chang. Biol. 2006, 12, 489–499. [Google Scholar]
- Xie, D.; Si, G.; Zhang, T.; Mulder, J.; Duan, L. Nitrogen deposition increases N2O emission from an N-saturated subtropical forest in southwest China. Environ. Pollut. 2018, 243, 1818–1824. [Google Scholar]
- Tian, P.; Zhang, J.; Cai, Z.; Jin, G. Different response of CO2 and N2O fluxes to N deposition with seasons in a temperate forest in northeastern China. J. Soils Sediments 2018, 18, 1821–1831. [Google Scholar]
- Aronson, E.L.; Allison, S.D. Meta-analysis of environmental impacts on nitrous oxide release in response to N amendment. Front. Microbiol. 2012, 3, 272. [Google Scholar]
- Wu, Y.; Chen, D.; Delgado-Baquerizo, M.; Liu, S.; Wang, B.; Wu, J.; Hu, S.; Bai, Y. Long-term regional evidence of the effects of livestock grazing on soil microbial community structure and functions in surface and deep soil layers. Soil Biol. Biochem. 2022, 168, 108629. [Google Scholar]
- Xia, N.; Du, E.; Wu, X.; Tang, Y.; Wang, Y.; de Vriesc, W. Effects of nitrogen addition on soil methane uptake in global forest biomes. Environ. Pollut. 2020, 264, 114751. [Google Scholar]
- Werner, C.; Zheng, X.; Tang, J.; Xie, B.; Liu, C.; Kiese, R.; Butterbach-Bahl, K. N2O, CH4 and CO2 emissions from seasonal tropical rainforests and a rubber plantation in Southwest China. Plant Soil 2006, 289, 335–353. [Google Scholar]
- Wu, J.; Cheng, X.; Xing, W.; Liu, G. Soil-atmosphere exchange of CH4 in response to nitrogen addition in diverse upland and wetland ecosystems: A meta-analysis. Soil Biol. Biochem. 2022, 164, 108467. [Google Scholar]
- Peng, Y.; Wang, G.; Li, F.; Yang, G.; Fang, K.; Liu, L.; Qin, S.; Zhang, D.; Zhou, G.; Fang, H.; et al. Unimodal Response of Soil Methane Consumption to Increasing Nitrogen Additions. Environ. Sci. Technol. 2019, 53, 4150–4160. [Google Scholar]
- Shi, Y.; Cui, S.; Ju, X.; Cai, Z.; Zhu, Y.-G. Impacts of reactive nitrogen on climate change in China. Sci. Rep. 2015, 5, 8118. [Google Scholar]
- Du, E.; de Vries, W.; Han, W.; Liu, X.; Yan, Z.; Jiang, Y. Imbalanced phosphorus and nitrogen deposition in China’s forests. Atmos. Chem. Phys. 2016, 16, 8571–8579. [Google Scholar]
- Zhang, W.; Mo, J.; Zhou, G.; Gundersen, P.; Fang, Y.; Lu, X.; Zhang, T.; Dong, S. Methane uptake responses to nitrogen deposition in three tropical forests in southern China. J. Geophys. Res. 2008, 113, D11116. [Google Scholar]
Publisher’s Note: MDPI stays neutral with regard to jurisdictional claims in published maps and institutional affiliations. |
© 2022 by the authors. Licensee MDPI, Basel, Switzerland. This article is an open access article distributed under the terms and conditions of the Creative Commons Attribution (CC BY) license (https://creativecommons.org/licenses/by/4.0/).