
Urban Particulate Matter Hazard Mapping and Monitoring Site Selection in Nablus, Palestine


Abstract
:1. Introduction
2. Methodology
3. Results and Discussion
4. Conclusions
Author Contributions
Funding
Institutional Review Board Statement
Informed Consent Statement
Data Availability Statement
Acknowledgments
Conflicts of Interest
References
- Manisalidis, I.; Stavropoulou, E.; Stavropoulos, A.; Bezirtzoglou, E. Environmental and Health Impacts of Air Pollution: A Review. Front. Public Health 2020, 8, 14. [Google Scholar] [CrossRef] [PubMed] [Green Version]
- Khader, A.; Martin, R.S. Use of low-cost ambient particulate sensors in Nablus, Palestine with application to the assessment of regional dust storms. Atmosphere 2019, 10, 539. [Google Scholar] [CrossRef] [Green Version]
- Mayer, H. Mayer: Cities. Atmos. Environ. 1999, 33, 4029–4037. [Google Scholar] [CrossRef]
- Criteria Air Pollutants. Available online: https://www.epa.gov/criteria-air-pollutants#self (accessed on 10 December 2021).
- Cascio, W.E.; Gilmour, M.I.; Peden, D.B. Ambient air pollution and increases in blood pressure: Role for Biological Constituents of Particulate Matter. Hypertension 2015, 66, 469–472. [Google Scholar] [CrossRef] [PubMed]
- Davidson, C.I.; Phalen, R.F.; Solomon, P.A. Airborne particulate matter and human health: A review. Aerosol Sci. Technol. 2005, 39, 737–749. [Google Scholar] [CrossRef]
- Brook, R.D. You are what you breathe: Evidence linking air pollution and blood pressure. Curr. Hypertens. Rep. 2005, 7, 427–434. [Google Scholar] [CrossRef]
- Nowak, D.J.; Hirabayashi, S.; Doyle, M.; McGovern, M.; Pasher, J. Air pollution removal by urban forests in Canada and its effect on air quality and human health. Urban For. Urban Green. 2018, 29, 40–48. [Google Scholar] [CrossRef]
- Rajak, R.; Chattopadhyay, A. Short and Long Term Exposure to Ambient Air Pollution and Impact on Health in India: A Systematic Review. Int. J. Environ. Health Res. 2020, 30, 593–617. [Google Scholar] [CrossRef]
- Sacks, J.D.; Fann, N.; Gumy, S.; Kim, I.; Ruggeri, G.; Mudu, P. Quantifying the public health benefits of reducing air pollution: Critically assessing the features and capabilities of WHO’s AirQ+ and U.S. EPA’s environmental benefits mapping and analysis program-community edition (BenMAP-CE). Atmosphere 2020, 11, 516. [Google Scholar] [CrossRef]
- World Health Organization. Quantification of the Health Effects of Exposure to Air Pollution Report of a WHO Working Group; WHO: Bilthoven, The Netherlands, 2000; p. 34.
- Zhang, X.; Chen, X.; Zhang, X. The impact of exposure to air pollution on cognitive performance. Proc. Natl. Acad. Sci. USA 2018, 115, 9193–9197. [Google Scholar] [CrossRef] [Green Version]
- Copat, C.; Cristaldi, A.; Fiore, M.; Grasso, A.; Zuccarello, P.; Signorelli, S.S.; Conti, G.O.; Ferrante, M. The role of air pollution (PM and NO2) in COVID-19 spread and lethality: A systematic review. Environ. Res. 2020, 191, 110129. [Google Scholar] [CrossRef] [PubMed]
- Yao, Y.; Pan, J.; Liu, Z.; Meng, X.; Wang, W.; Kan, H.; Wang, W. Temporal association between particulate matter pollution and case fatality rate of COVID-19 in Wuhan. Environ. Res. 2020, 189, 109941. [Google Scholar] [CrossRef] [PubMed]
- Castell, N.; Dauge, F.R.; Schneider, P.; Vogt, M.; Lerner, U.; Fishbain, B.; Broday, D.; Bartonova, A. Can commercial low-cost sensor platforms contribute to air quality monitoring and exposure estimates? Environ. Int. 2017, 99, 293–302. [Google Scholar] [CrossRef] [PubMed]
- Miskell, G.; Salmond, J.; Williams, D.E. Low-cost sensors and crowd-sourced data: Observations of siting impacts on a network of air-quality instruments. Sci. Total Environ. 2017, 575, 1119–1129. [Google Scholar] [CrossRef] [PubMed]
- Thompson, J.E. Crowd-sourced air quality studies: A review of the literature & portable sensors. Trends Environ. Anal. Chem. 2016, 11, 23–34. [Google Scholar] [CrossRef]
- Abdeen, Z.; Qasrawi, R.; Heo, J.; Wu, B.; Shpund, J.; Vanger, A.; Sharf, G.; Moise, T.; Brenner, S.; Nassar, K.; et al. Spatial and temporal variation in fine particulate matter mass and chemical composition: The middle east consortium for aerosol research study. Sci. World J. 2014, 2014, 878704. [Google Scholar] [CrossRef] [Green Version]
- Jodeh, S.; Hasan, A.R.; Amarah, J.; Judeh, F.; Salghi, R.; Lgaz, H.; Jodeh, W. Indoor and outdoor air quality analysis for the city of Nablus of residential homes. Air Qual. Atmos. Health 2018, 11, 229–237. [Google Scholar] [CrossRef]
- Ott, W.R. Development of criteria for siting air monitoring stations. J. Air Pollut. Control Assoc. 1977, 27, 543–547. [Google Scholar] [CrossRef]
- Van Donkelaar, A.; Martin, R.V.; Brauer, M.; Kahn, R.; Levy, R.; Verduzco, C. Global Estimates of Ambient Fine Particulate Matter Concentrations from Satellite-Based Aerosol Optical Depth: Development and Application. Environ. Health Perspect. 2010, 118, 847–855. [Google Scholar] [CrossRef] [Green Version]
- Hu, Z. Spatial analysis of MODIS aerosol optical depth, PM2.5, and chronic coronary heart disease. Int. J. Health Geogr. 2009, 8, 27. [Google Scholar] [CrossRef] [Green Version]
- Chu, Y.; Liu, Y.; Li, X.; Liu, Z.; Lu, H.; Lu, Y.; Mao, Z.; Chen, X.; Li, N.; Ren, M.; et al. A review on predicting ground PM2.5 concentration using satellite aerosol optical depth. Atmosphere 2016, 7, 129. [Google Scholar] [CrossRef] [Green Version]
- Paciorek, C.J.; Liu, Y.; Moreno-Macias, H.; Kondragunta, S. Spatiotemporal associations between GOES aerosol optical depth retrievals and ground-level PM2.5. Environ. Sci. Technol. 2008, 42, 5800–5806. [Google Scholar] [CrossRef] [PubMed] [Green Version]
- van Donkelaar, A.; Martin, R.V.; Park, R.J. Estimating ground-level PM2.5 using aerosol optical depth determined from satellite remote sensing. J. Geophys. Res. Atmos. 2006, 111, 1–10. [Google Scholar] [CrossRef]
- Huang, W.; Li, T.; Liu, J.; Xie, P.; Du, S.; Teng, F. An overview of air quality analysis by big data techniques: Monitoring, forecasting, and traceability. Inf. Fusion 2021, 75, 28–40. [Google Scholar] [CrossRef]
- Nadal, M.; Cadiach, O.; Kuma, V.; Poblet, P.; Mari, M.; Schuhmacher, M.; Domingo, J.L. Health risk map of a petrochemical complex through gis-fuzzy integration of air pollution monitoring data. Hum. Ecol. Risk Assess. 2011, 17, 873–891. [Google Scholar] [CrossRef]
- Lahr, J.; Kooistra, L. Environmental risk mapping of pollutants: State of the art and communication aspects. Sci. Total Environ. 2010, 408, 3899–3907. [Google Scholar] [CrossRef] [PubMed]
- Anh, N.K.; Phonekeo, V.; My, V.C.; Duong, N.D.; Dat, P.T. Environmental hazard mapping using GIS and AHP-A case study of Dong Trieu District in Quang Ninh Province, Vietnam. IOP Conf. Ser. Earth Environ. Sci. 2014, 18, 012045. [Google Scholar] [CrossRef] [Green Version]
- Chung, C.J.; Hsieh, Y.Y.; Lin, H.C. Fuzzy inference system for modeling the environmental risk map of air pollutants in Taiwan. J. Environ. Manag. 2019, 246, 808–820. [Google Scholar] [CrossRef]
- Alsahli, M.M.; Al-Harbi, M. Allocating optimum sites for air quality monitoring stations using GIS suitability analysis. Urban Clim. 2018, 24, 875–886. [Google Scholar] [CrossRef]
- PCBS. Preliminary Results of the Population, Housing and Establishments Census 2017; Palestinian Central Bureau of Statistics: Ramallah, Palestine, 2018; p. 82. [Google Scholar]
- GeoMOLG Palestinian Ministry of Local Government. Available online: geomolg.ps (accessed on 25 December 2021).
- Vanguard, T.; Resettlement, J. KEDUMIM Zionism Is Still Alive in Kedumim; Kedumim: Kedumim, Israel, 2020. [Google Scholar]
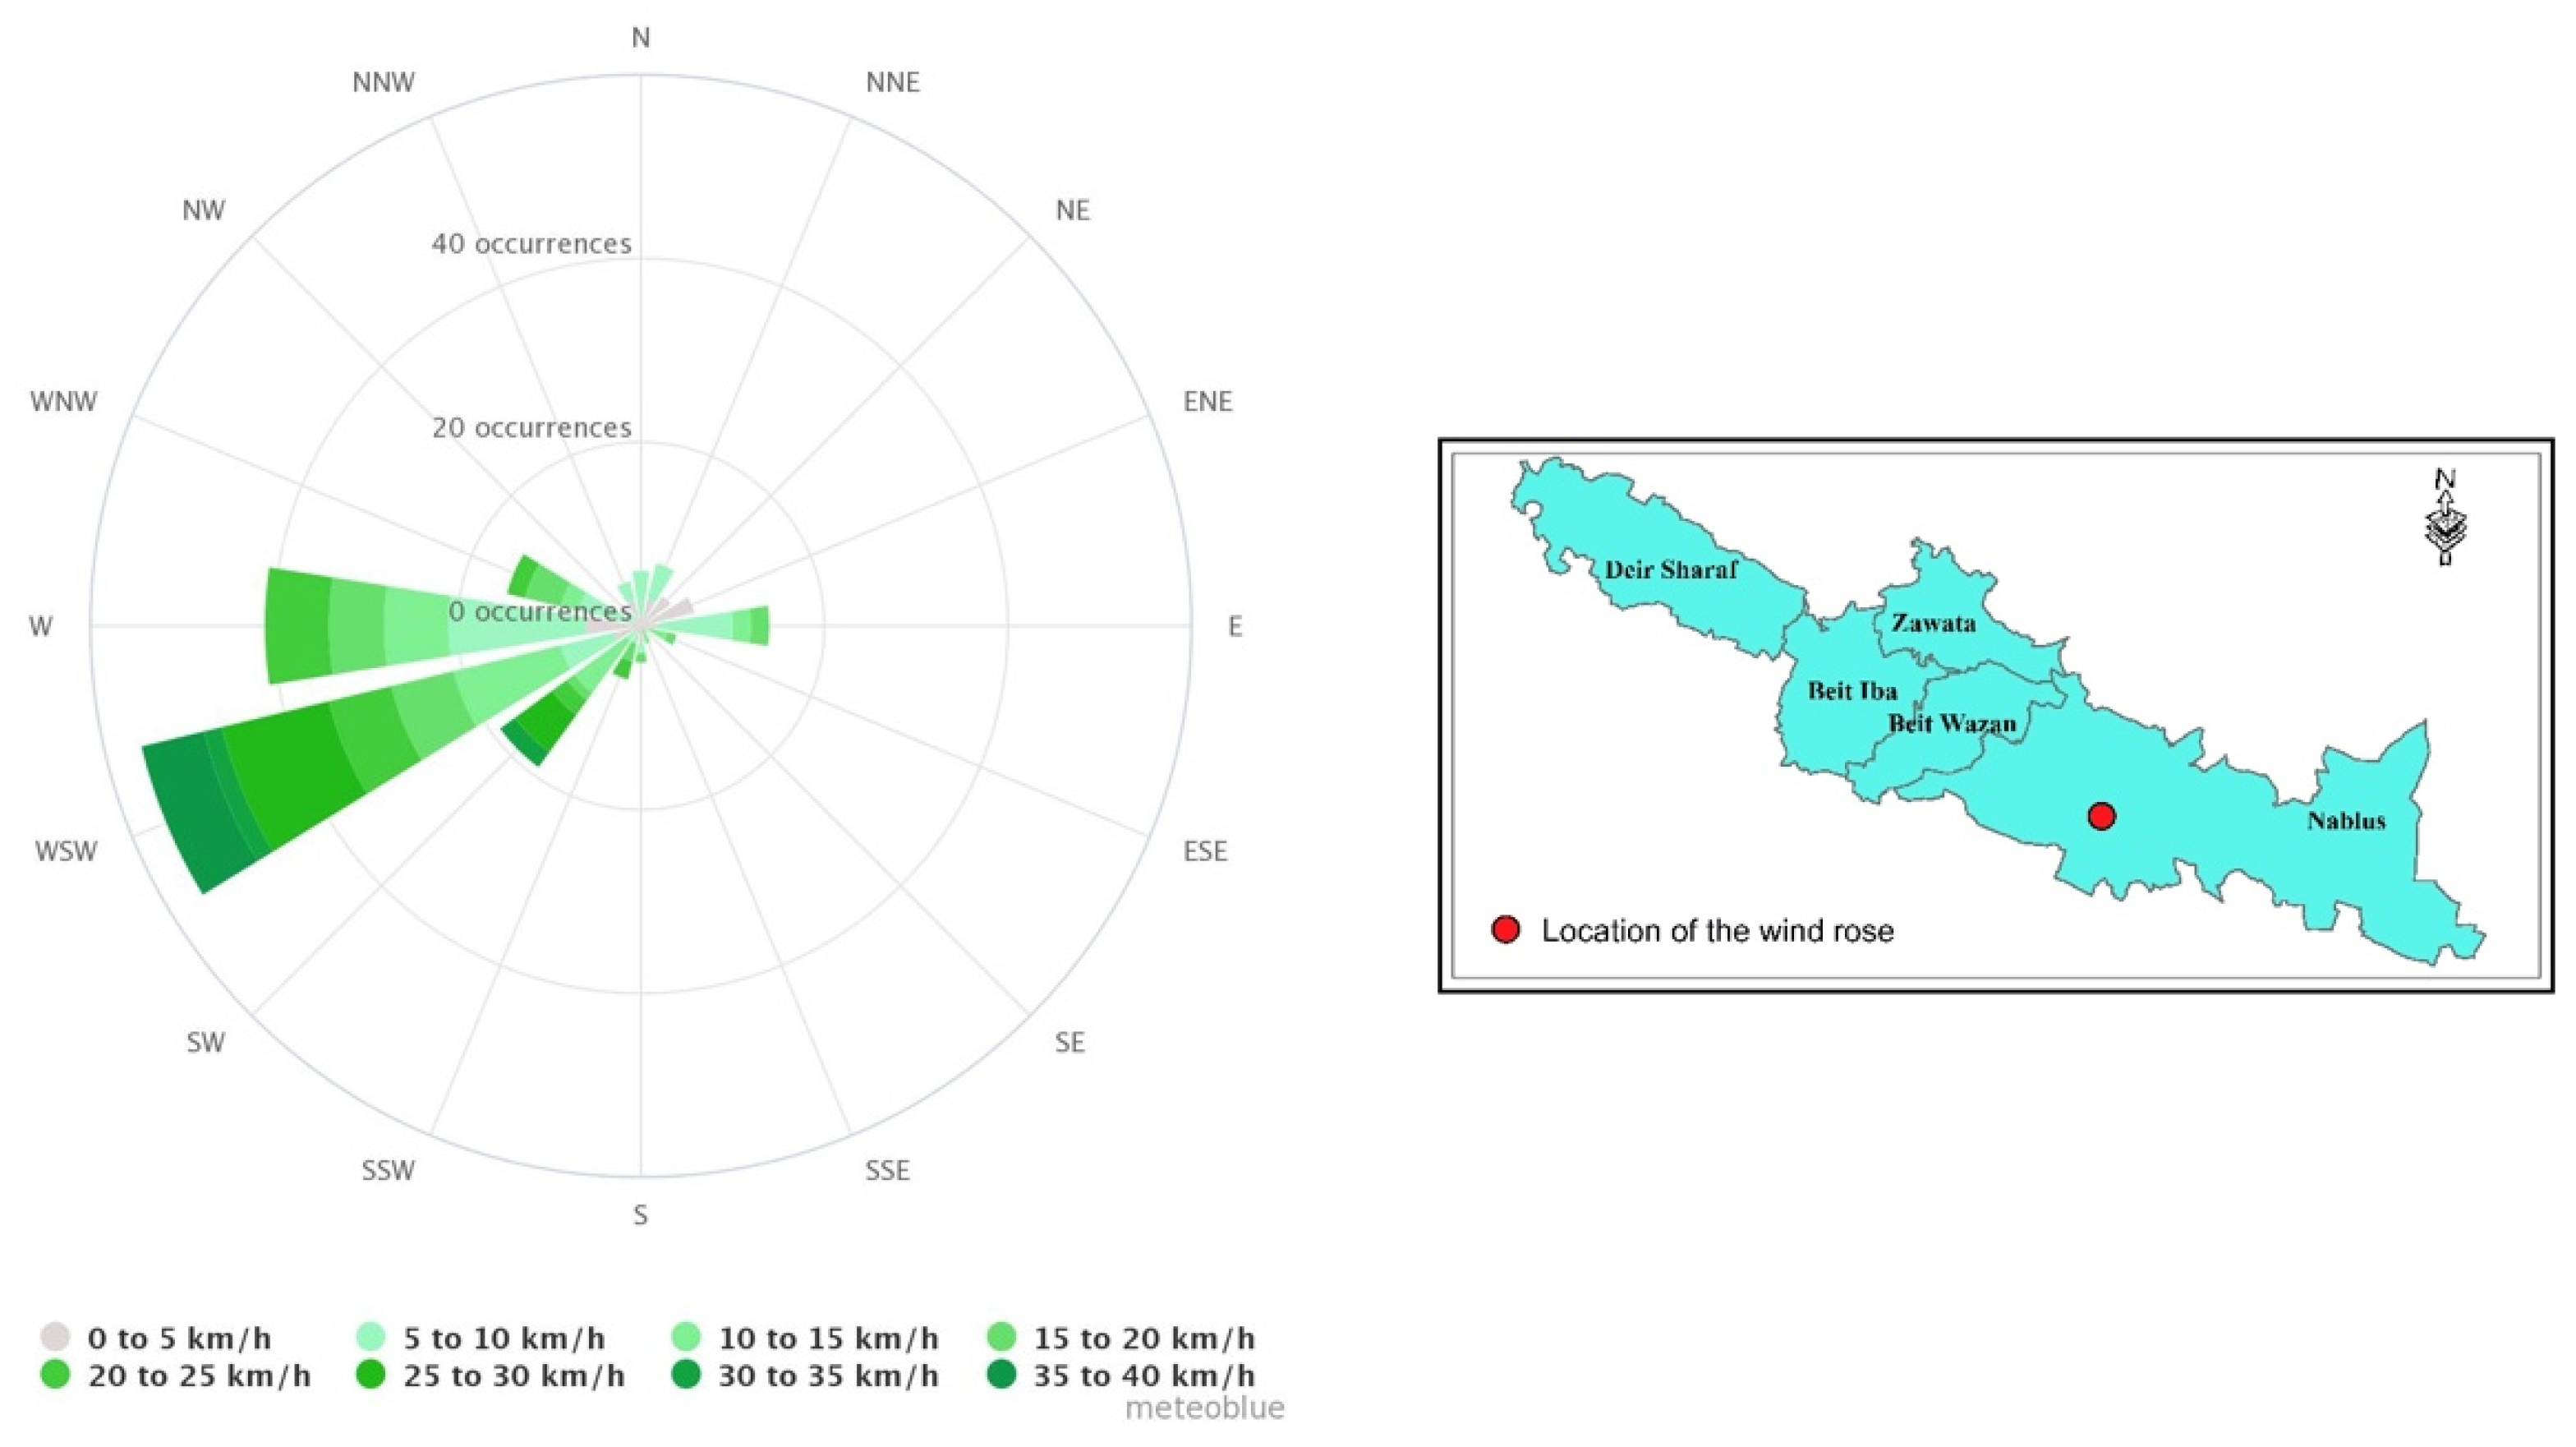
- Meteoblue Weather Nablus—Meteoblue. Available online: https://www.meteoblue.com/en/weather/week/nablus_palestine_282615 (accessed on 16 March 2021).


| Criteria | Weight % | Sub-Criteria * | Influence % # |
|---|---|---|---|
| Industry | 30% | I1 | 17 |
| I2 | 33 | ||
| I3 | 50 | ||
| Roads | 20% | R1 | 17 |
| R2 | 33 | ||
| R3 | 50 | ||
| Queries | 30% | Q | 100 |
| Altitude | 20% | A | 100 |
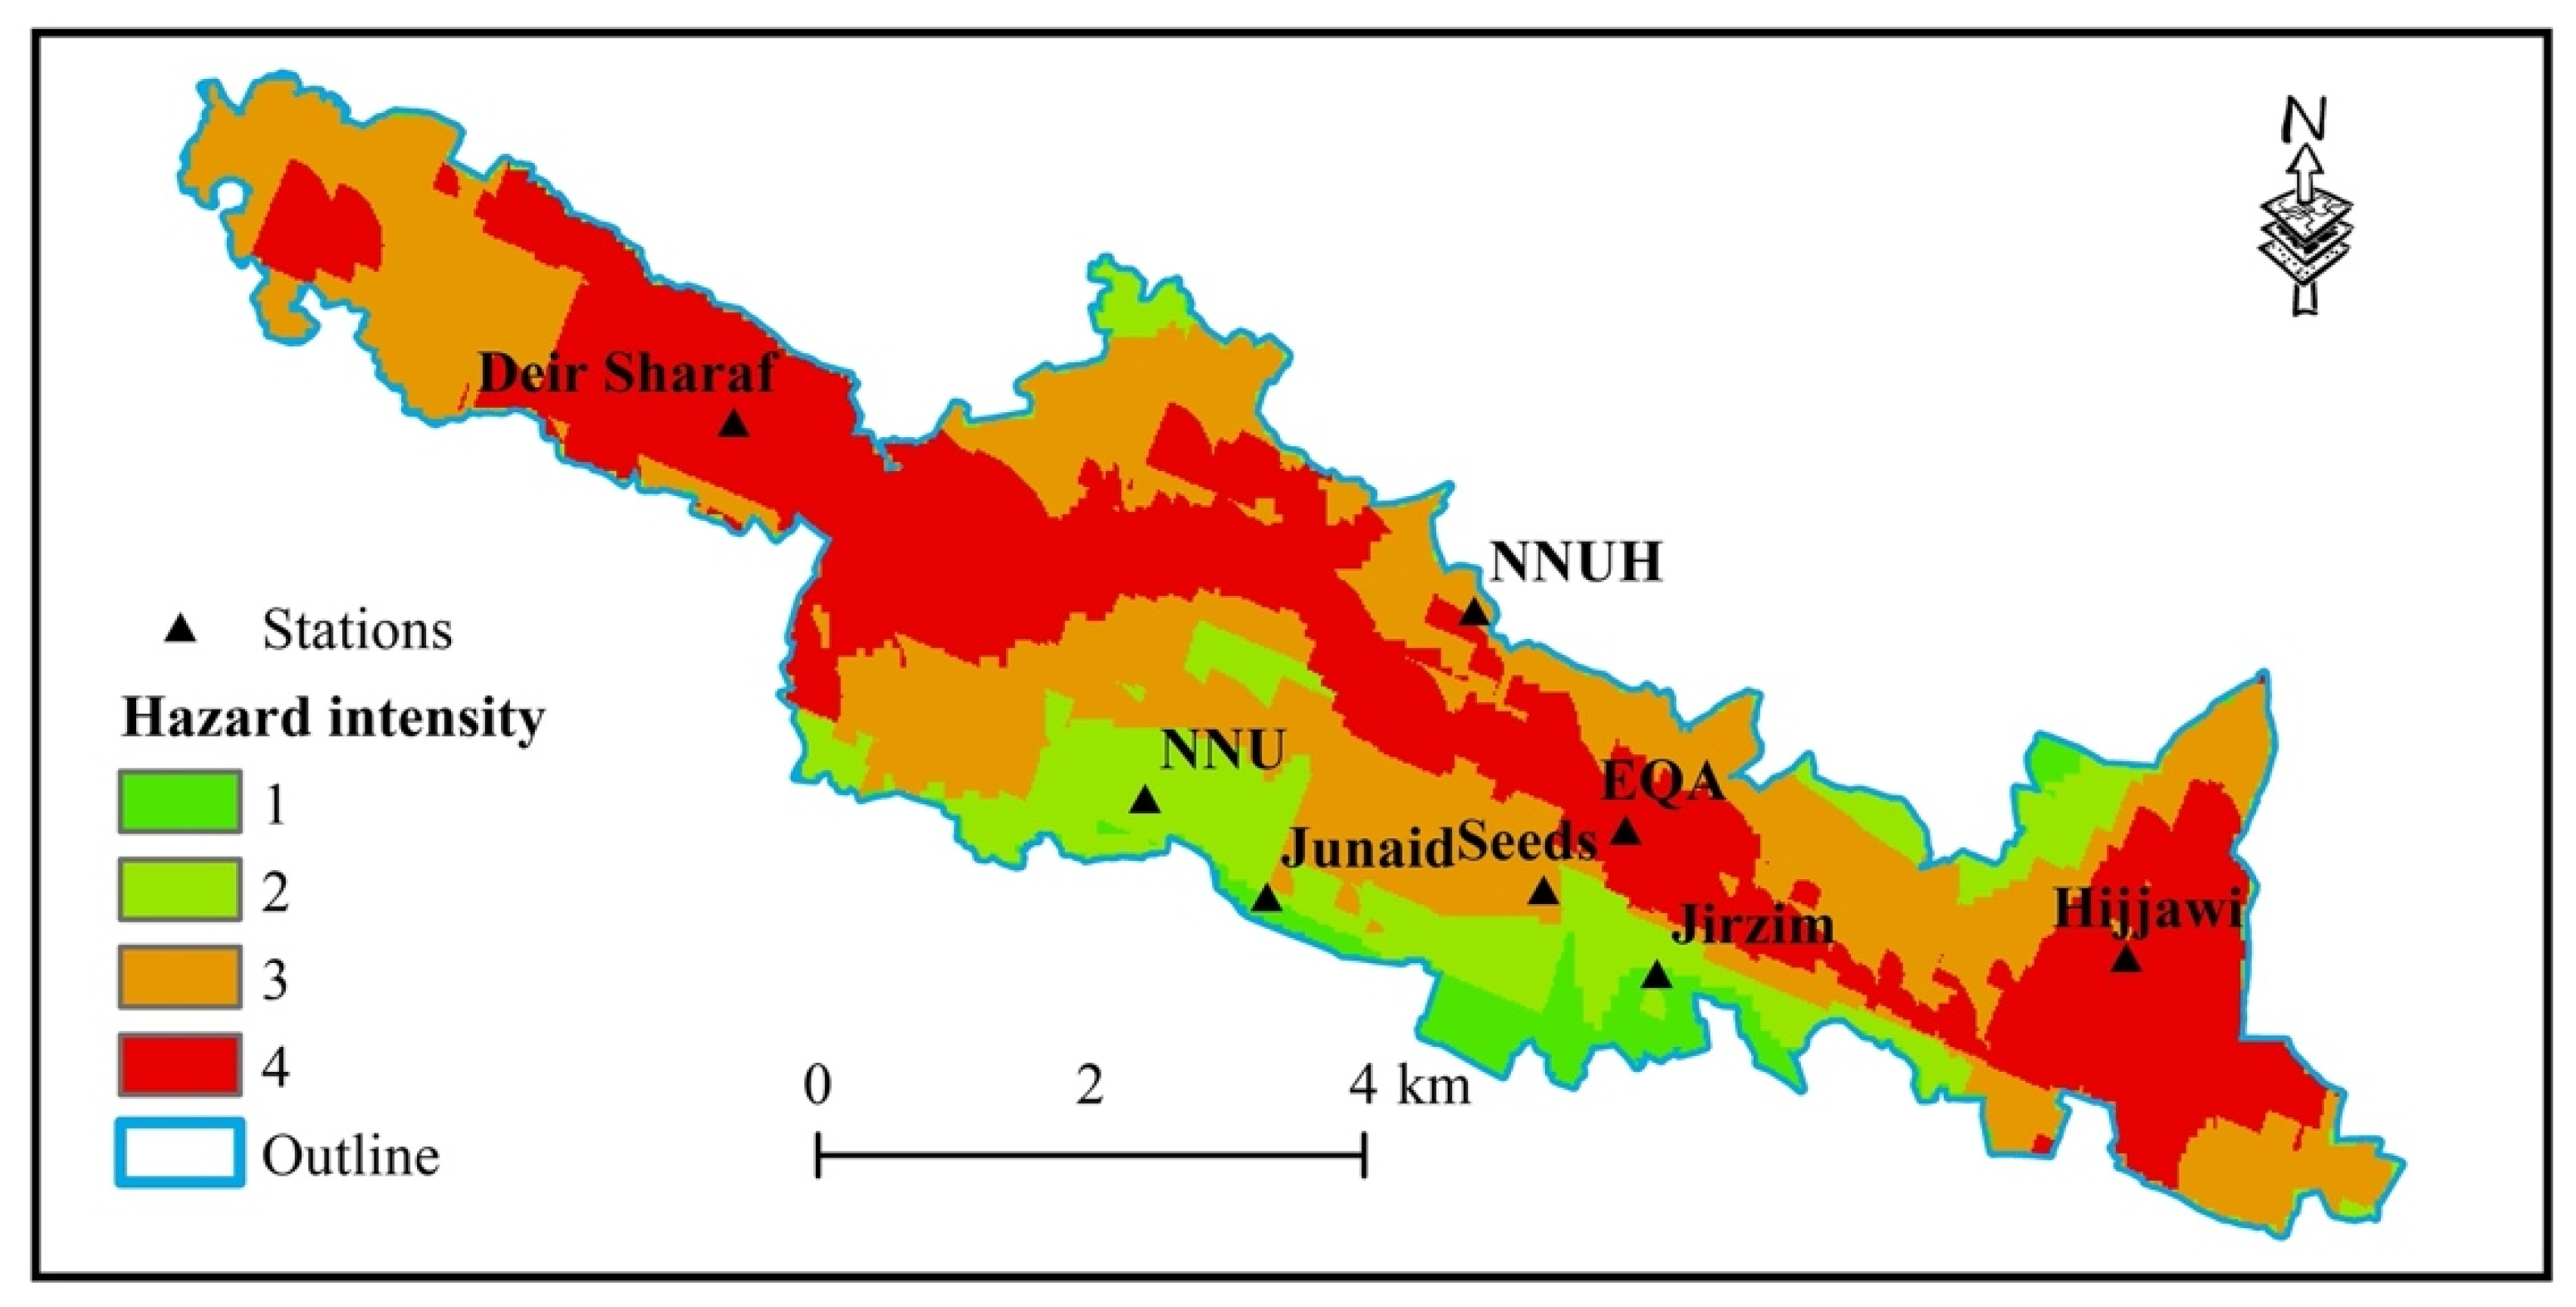
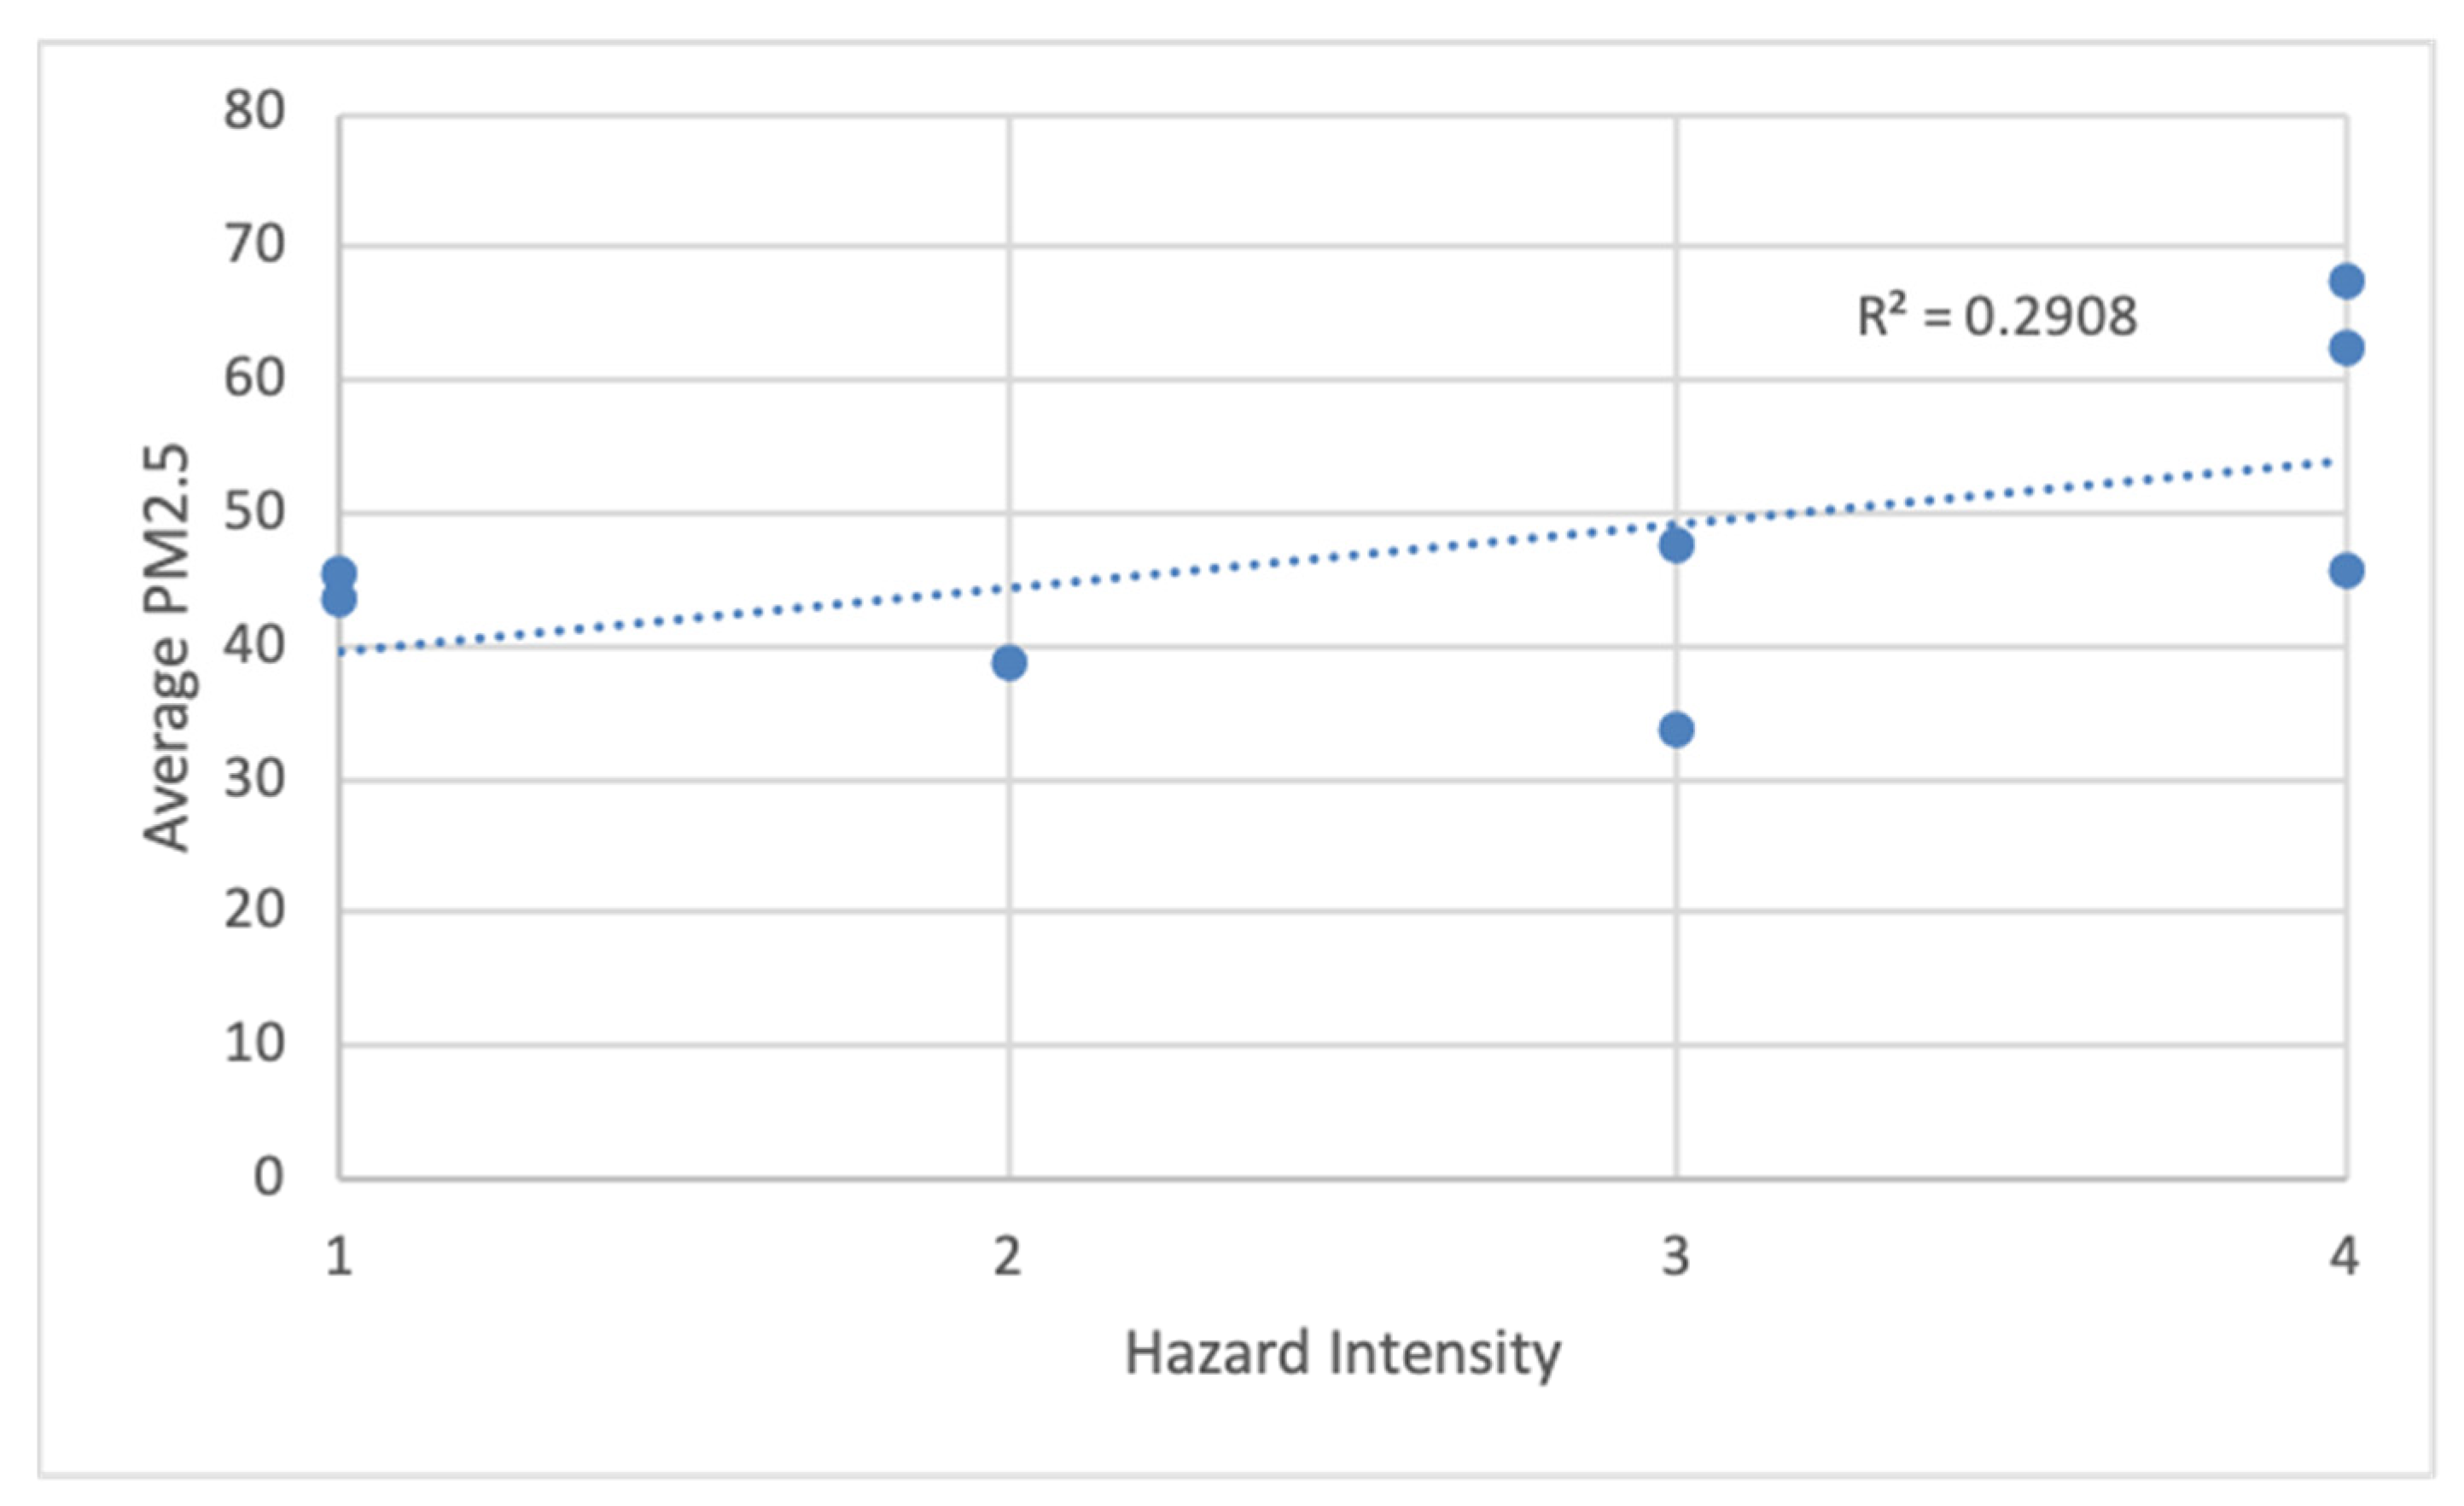
| Location | Hazard Intensity | Average ± 95% CL | n/N * | Max. Value | Date | Min. Value | Date |
|---|---|---|---|---|---|---|---|
| Jerzim | 1 | 45.36 ± 4.13 | 52/55 | 86.37 | 21 February | 18.18 | 12 January |
| Junaid | 1 | 43.60 ± 3.13 | 54/55 | 82.53 | 21 February | 22.36 | 2 March |
| NNU | 2 | 38.76 ± 2.93 | 50/55 | 62.32 | 21 February | 18.26 | 12 January |
| Seeds | 3 | 47.58 ± 3.98 | 51/55 | 84.61 | 22 February | 23.78 | 2 March |
| NNUH | 3 | 33.78 ± 4.30 | 19/26 | 57.94 | 25 January | 14.52 | 20 January |
| Hijjawi | 4 | 67.43 ± 6.46 | 55/55 | 112.48 | 22 February | 27.35 | 14 January |
| EQA | 4 | 62.37 ± 4.25 | 55/55 | 96.41 | 17 February | 37.47 | 28 January |
| Deir Sharaf | 4 | 45.70 ± 2.85 | 55/55 | 68.25 | 22 February | 27.22 | 27 January |
Publisher’s Note: MDPI stays neutral with regard to jurisdictional claims in published maps and institutional affiliations. |
© 2022 by the authors. Licensee MDPI, Basel, Switzerland. This article is an open access article distributed under the terms and conditions of the Creative Commons Attribution (CC BY) license (https://creativecommons.org/licenses/by/4.0/).
Share and Cite
Saleh, T.; Khader, A. Urban Particulate Matter Hazard Mapping and Monitoring Site Selection in Nablus, Palestine. Atmosphere 2022, 13, 1134. https://doi.org/10.3390/atmos13071134
Saleh T, Khader A. Urban Particulate Matter Hazard Mapping and Monitoring Site Selection in Nablus, Palestine. Atmosphere. 2022; 13(7):1134. https://doi.org/10.3390/atmos13071134
Chicago/Turabian StyleSaleh, Tawfiq, and Abdelhaleem Khader. 2022. "Urban Particulate Matter Hazard Mapping and Monitoring Site Selection in Nablus, Palestine" Atmosphere 13, no. 7: 1134. https://doi.org/10.3390/atmos13071134
APA StyleSaleh, T., & Khader, A. (2022). Urban Particulate Matter Hazard Mapping and Monitoring Site Selection in Nablus, Palestine. Atmosphere, 13(7), 1134. https://doi.org/10.3390/atmos13071134