Article

Moist Static Energy and Secondary Circulation Evolution Characteristics during the Rapid Intensification of Super Typhoon Yutu (2007)

1
Key Laboratory of Meteorological Disaster, Ministry of Education (KLME)/Joint International Research Laboratory of Climate and Environmental Change (ILCEC)/Collaborative Innovation Center on Forecast and Evaluation of Meteorological Disasters (CIC-FEMD), Nanjing University of Information Science and Technology, Nanjing 210044, China
2
International Pacific Research Center and Department of Atmospheric Sciences, School of Ocean and Earth Science and Technology, University of Hawaii at Manoa, Honolulu, HI 96822, USA
3
Jiangsu Meteorological Observatory, Jiangsu Meteorological Bureau, Nanjing 210019, China
*
Author to whom correspondence should be addressed.
Atmosphere 2022, 13(7), 1105; https://doi.org/10.3390/atmos13071105
Submission received: 2 June 2022 / Revised: 8 July 2022 / Accepted: 12 July 2022 / Published: 13 July 2022
(This article belongs to the Section Meteorology)

Abstract

:
A high-resolution Weather Research and Forecasting (WRF) model is used to simulate inner-core thermodynamic (such as moist static energy) and dynamic secondary circulation structure evolutions associated with the rapid intensification (RI) of Super Typhoon Yutu (2007). The results show that the column-integrated moist static energy (MSE) and the secondary circulation strength are significantly correlated to the typhoon intensity change. A rapid increase of the MSE during the RI period is primarily attributed to inner core temperature increase, due to enhanced subsidence within the eye and strengthened convective heating along the eyewall. The column-integrated MSE budget analysis shows that its rapid increase during the RI is mainly caused by surface latent heat flux. A further diagnosis of the Sawyer–Eliassen equation shows that the rapid strengthening of the secondary circulation during RI results from both the radially expanding positive diabatic heating over the eyewall and the occurrence of a second heating center outside the eyewall. While the radially expanding eyewall heating contributes about 70% of the secondary circulation change, the outer heating contributes about 30%.

1. Introduction

Tropical cyclones (TCs) often cause great casualties and economic losses through direct or indirect impacts, such as heavy rainfall and strong winds, as well as meteorological and geological hazards associated with TCs [1,2,3]. Although the forecast of TC track has been improved steadily in the past few decades, there are still great challenge in predicting TC intensity change, especially TC rapid intensification (RI) [4,5,6].
TC rapid intensification is known as a marked increase in TC intensity in a very short time, for example, an increase of TC maximum wind speed of 30 kt within 24 h. Among the global TC basins, the proportion of TCs with RI in the total TCs in the western North Pacific (WNP) is the highest [7]. In the WNP, 90% of Category 4 and 5 TCs experienced one RI episode at least during their life cycles.
Previous studies suggested that large-scale environmental conditions played an important role in regulating the RI processes [8,9]. For example, Kaplan and Demaria [9] found several environmental factors that favor RI in the North Atlantic, including high sea surface temperature, high low-level humidity, weak vertical wind shear, and high upper-level divergence. In some occasions, TCs could intensify rapidly in strong or moderate vertical wind shear [10,11]. An interaction between an upper-tropospheric trough and a TC could trigger TC intensifying [12,13].
TC inner structural characteristics may also affect the RI processes [14,15,16]. Kossin and Eastin [14] demonstrated that the most RI events occurred when a ringlike structure appeared in the inner core. Similar results were documented for Hurricane Elena (1985) by Corbosiero et al. [17,18], Hurricane Olivia (1994) by Reasor et al. [19], and Hurricane Guillermo (1997) by Reasor et al. [20]. Although these studies were mostly confined in the Atlantic basin due to a lack of aircraft observations in other basins, these studies shed lights on the possible relationship between TC inner-core structure and RI in other ocean basins.
High-resolution numerical weather prediction models have been used to study the relationship between TC inner core structure and RI [21,22,23]. For example, Nguyen et al. [21] examined the inner core structure evolution in the simulation of a high-impact hurricane Katrina (2005). They revealed that Katrina’s inner core showed fluctuation between states of symmetric and asymmetric, and the maximum wind speed increased rapidly during the symmetric phase. Zhang et al. [23] showed that typhoon Haikui (2012) was structurally symmetric during RI and the range of the eyewall was small in the low troposphere but extended outward in the upper troposphere.
Many previous studies examined the temperature and circulation characteristics (including the warm core and entropy fields) during TC intensification, but paid less attention to the evolution of vertically integrated moist static energy (MSE) and the cause of the MSE change. Furthermore, what causes the secondary circulation evolution and to what extent the secondary circulation change is related to the eyewall and outer heating during the RI period are still unresolved. In this work, we intend to address the aforementioned science questions. Because TC internal structure data are unavailable in the WNP due to a lack of aircraft observations, we rely on a high-resolution numerical model simulation. The rest of this paper is organized as follows. In Section 2, the data, model, and methods are briefly introduced. The simulated TC inner core thermodynamic and dynamic structure changes during the RI are presented in Section 3. Finally, a summary and discussion are given in the last section.

2. Data, Model Configuration, and Methods

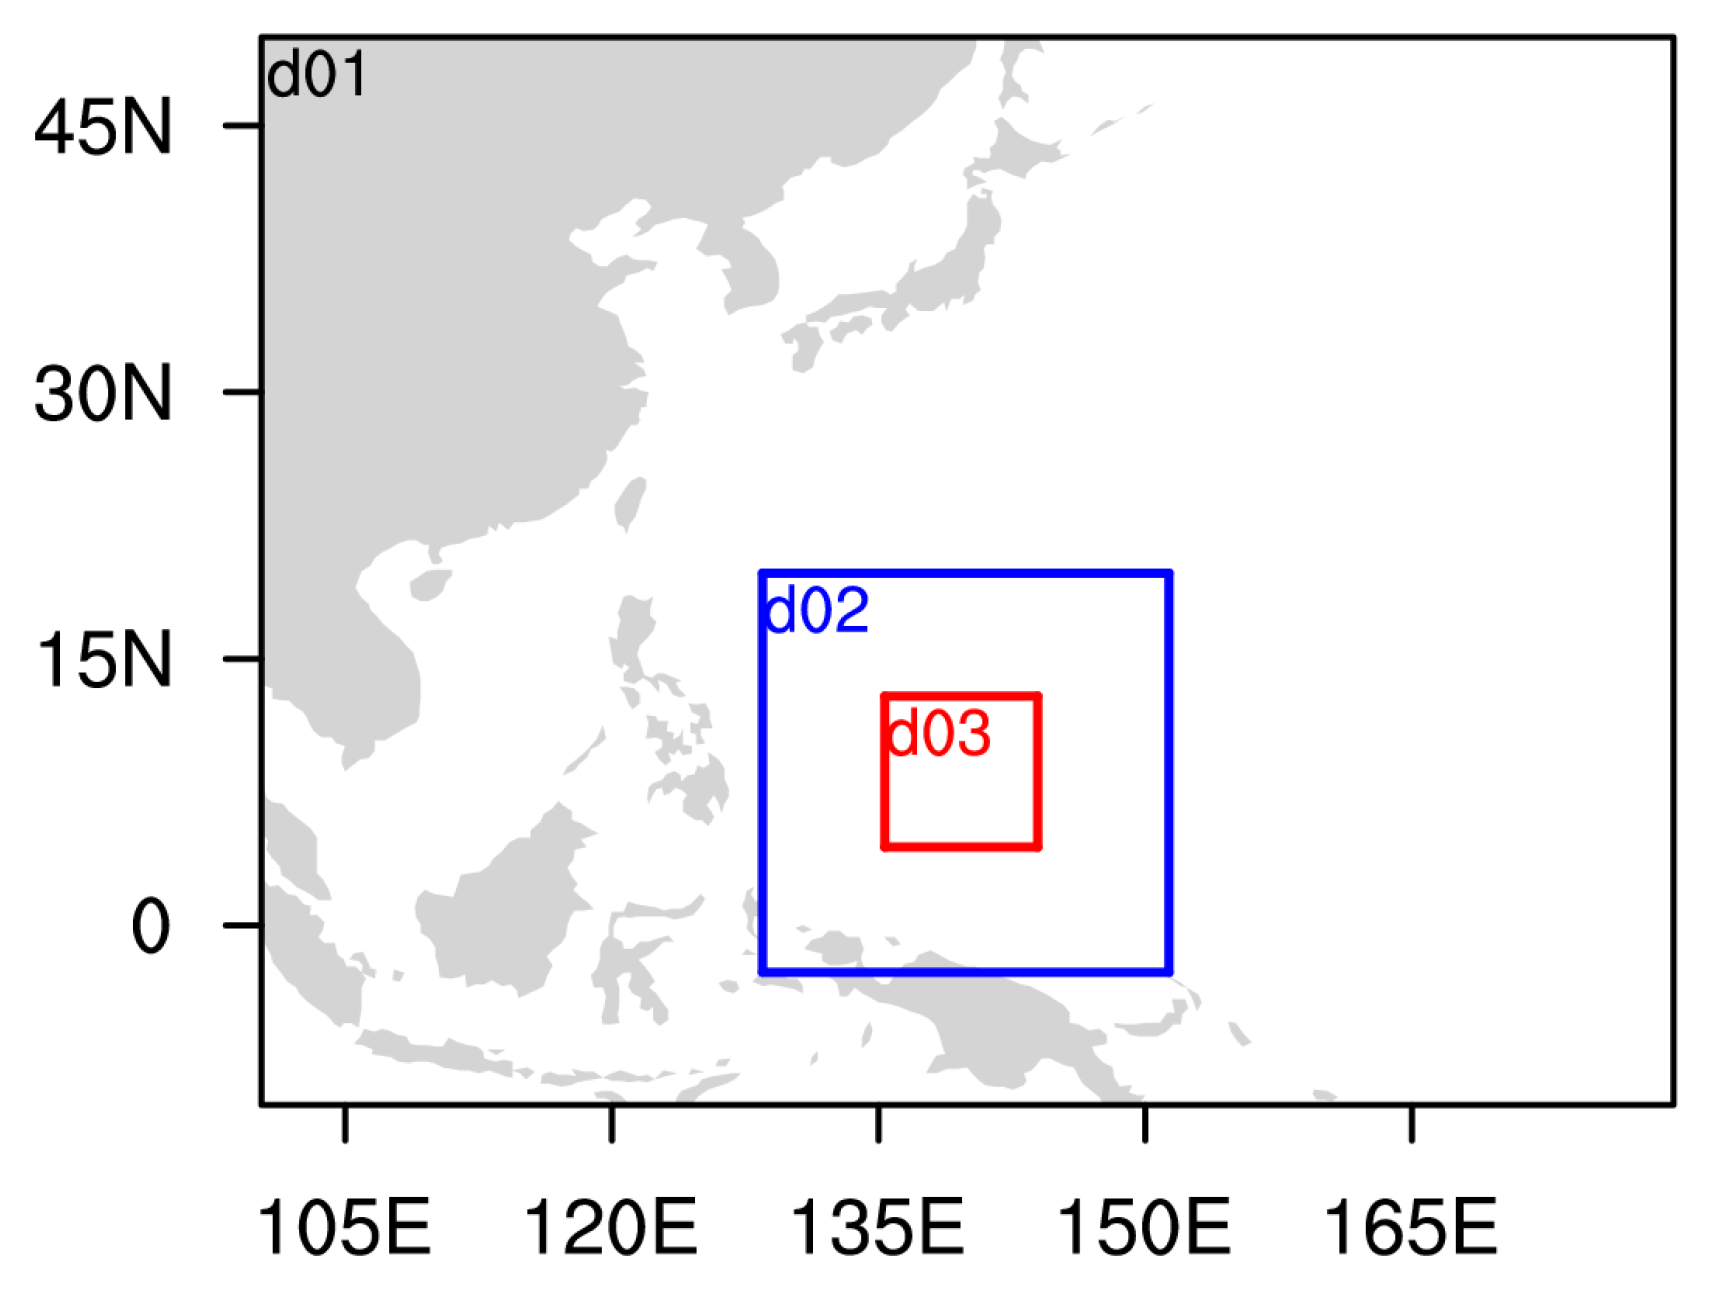
2.1. Data and Model Configuration

The observational TC data are from the Joint Typhoon Warning Center (JTWC) best-track dataset. The Weather Research and Forecasting (WRF-ARW) model (version 3.7.1) is used to simulate the intensity and structure changes of Super Typhoon Yutu (2007) that formed in the WNP on 17 May 2007. There are two reasons why we selected this typhoon. Firstly, about 400 Typhoon WRF simulations in the WNP during 2000–2019 were carried out, and Typhoon Yutu simulation is one of the best in terms of its intensity and track forecast. Secondly, according to a statistical analysis of Wang and Zhou [7], most of the TC RI (84%) occurs from July to November, with a peak in September. There are relatively few TCs that experienced RI in May. This is why we chose this particular TC in the current study. The initial and lateral boundary conditions are interpolated from NCEP FNL (Final Operational Global Analysis data), with a horizontal resolution of 1.0° × 1.0° at 6 h intervals. The model is integrated for five days and twelve hours, from 0600 UTC 17 May 2007 to 1800 UTC 22 May 2007.
The model is configured with three domains of horizontal resolutions of 18, 6, and 2 km, with 36 vertical levels. The first domain (d01) has 462 × 396 grids, the second domain (d02) has 399 × 399 grids, and the third domain (d03) has 450 × 450 grids. The second and third domains automatically move, following the movement of the storm center via an automatic vortex-following algorithm. Figure 1 shows the geographic locations of the three domains.
The model physics packages include a single-moment 6-class (WSM6) microphysics scheme [24], the Kain–Fritch convective scheme [25], the Dudhia scheme for shortwave radiation processes [26], and the rapid radiative transfer model (RRTM) for longwave radiation processes [27] in the first (outermost) domain. The same physics packages except an explicit convective scheme are used for the second and third domains.

2.2. Moist Static Energy Analysis

The moist static energy (MSE) is an important quantity to measure the strength and propagation of tropical weather and climate systems such as the Madden–Julian Oscillation and El Niño–Southern Oscillation [28,29,30,31]. In this study, we intend to use this quantity to measure the TC total thermodynamic energy and link its change to RI.
MSE is defined as m = C p T + g z + L v q , where C p is the specific heat capacity at constant pressure (1004 J K−1 kg−1), T is the air temperature, g is the gravitational acceleration (9.8 m s−2), z is the geopotential height, L v is the latent heat of vaporization (2.5 × 10⁶ J kg−1), and q is the specific humidity. MSE represents the summation of internal energy, potential energy, and latent heat.
Following TC movement, the column-integrated MSE tendency equation can be written as
d m d t = L W + S W + L H + S H
where 〈LW〉 and 〈SW〉 represent column-integrated net longwave and shortwave heating rates, and LH and SH represent latent and sensible heat fluxes at the surface. The angle brackets denote a column-integration from the surface to the top of the troposphere.

2.3. Analysis of the Secondary Circulation Using the Sawyer–Eliassen (SE) Equation

With the Boussinesq approximation, the SE equation in the radius-height (rZ) coordinates [32,33] can be written as
r ( A r ψ ¯ r + B r ψ ¯ Z ) + Z ( C r ψ ¯ Z + B r ψ ¯ r ) = ( ξ F ¯ ) Z + Q ¯ r
The interpretation of the equation and the meaning of each symbol are the same as Fudeyasu and Wang [34]. ψ ¯ is the azimuthal-mean transverse stream function, and it has the following relationship with azimuthal-mean radial wind v r ¯ and azimuthal-mean vertical velocity w ¯ : v r ¯ = 1 r ψ ¯ Z , w ¯ = 1 r ψ ¯ r , where the overbar denotes the azimuthal mean at a constant height about the circulation center. The left-hand side of the SE equation includes three parameters defined as
A = N 2 ¯ = g θ 0 θ ¯ Z B = ξ ¯ v t ¯ Z C = ξ ¯ η ¯
where v t ¯ is the azimuthal-mean tangential wind, θ ¯ is the azimuthal-mean potential temperature, η ¯ = f 0 + ζ ¯ is the azimuthal-mean absolute vertical vorticity, ζ ¯ is the azimuthal-mean relative vertical vorticity, f 0 is the planetary vorticity at the cyclone center, and ξ ¯ = f 0 + 2 v t ¯ / r is the vortex inertial parameter. The three parameters ( A ,   B ,   C ) represent the static stability, baroclinicity, and inertial stability of a symmetric TC state.
Forcing terms on the right-hand side of the SE equation include diabatic heating and the eddy-induced damping term. During TC RI, the major contributing forcing is the azimuthal-mean diabatic heating. We will focus on the analysis of this forcing in deriving the azimuthal-mean transverse stream function.

3. Results

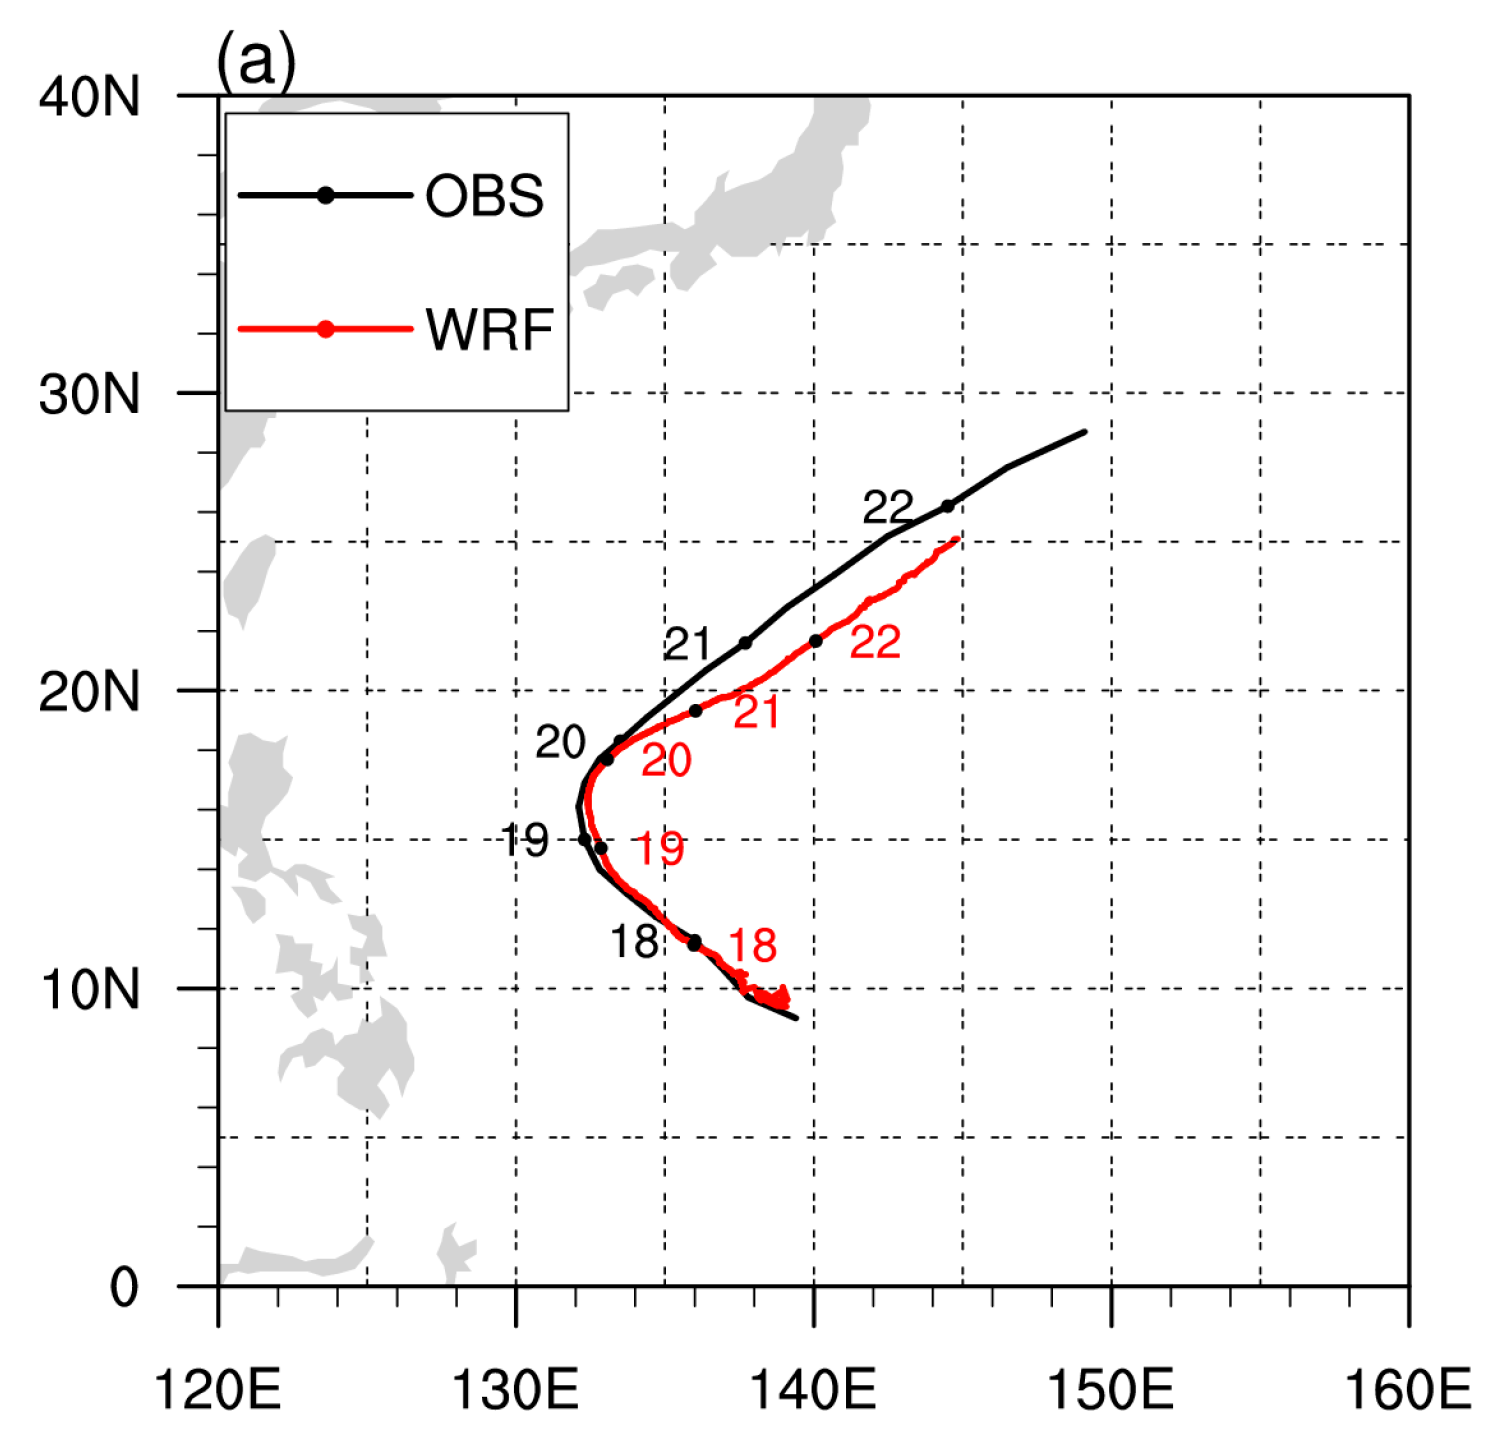
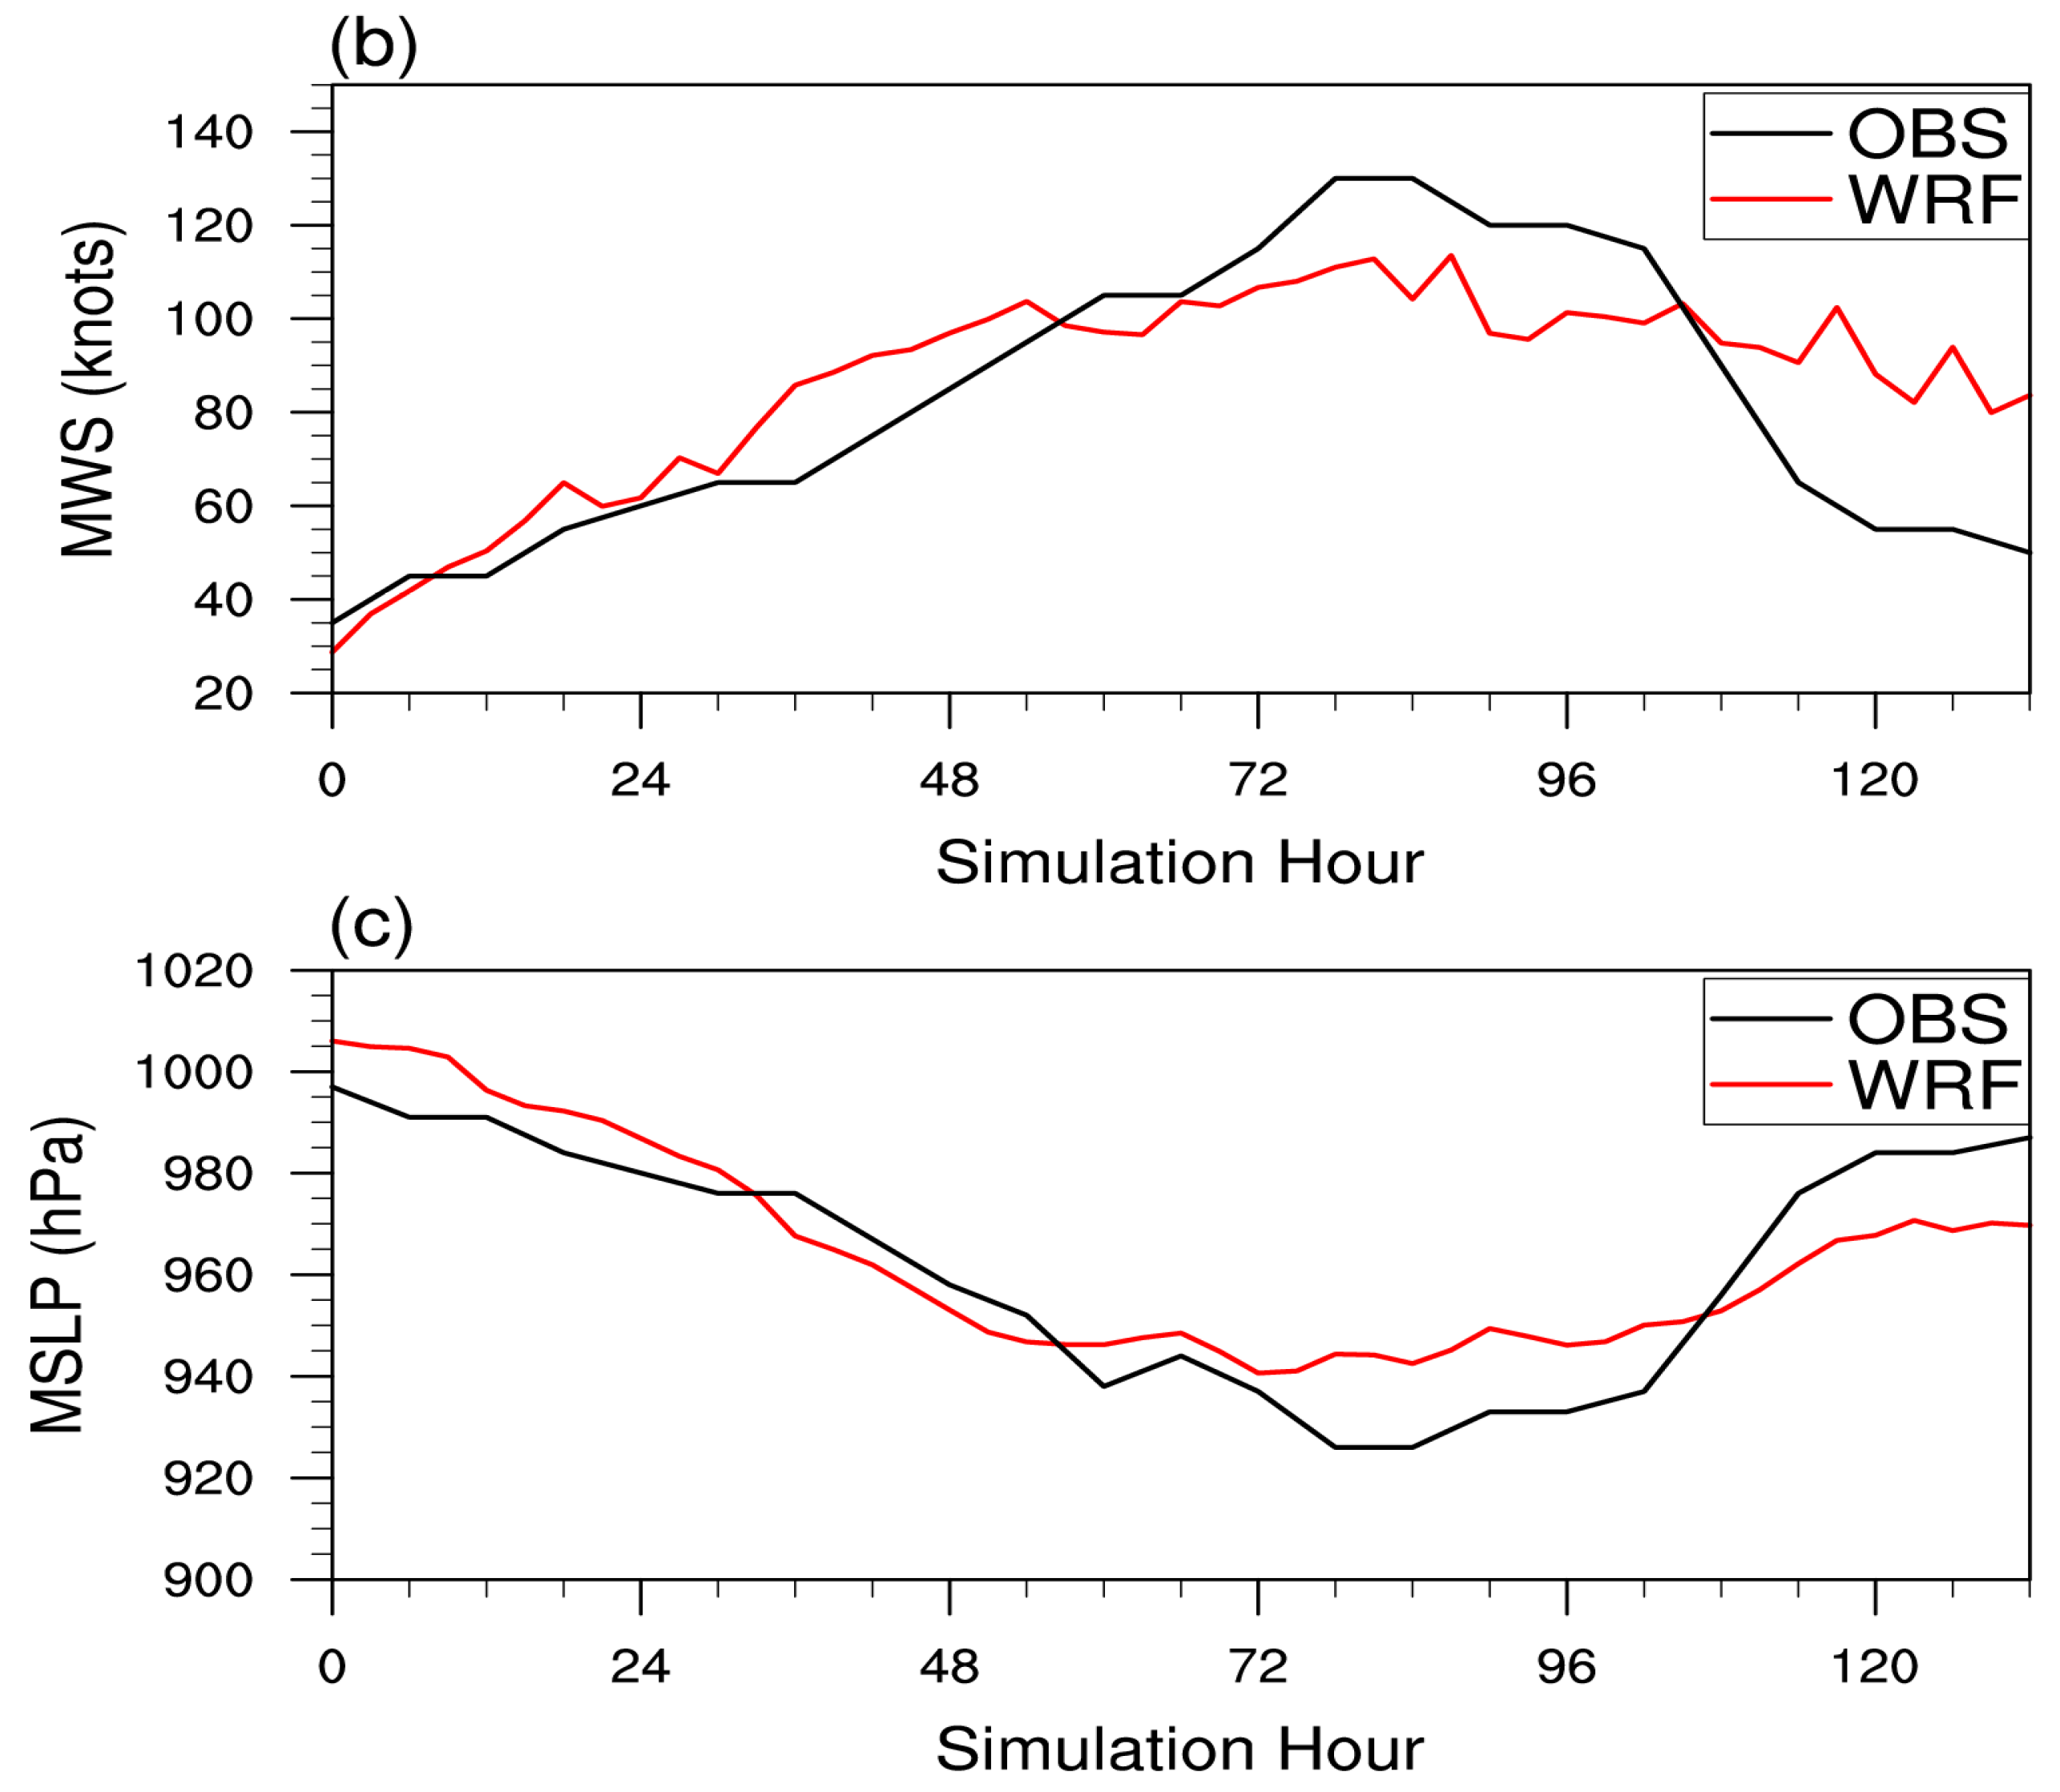
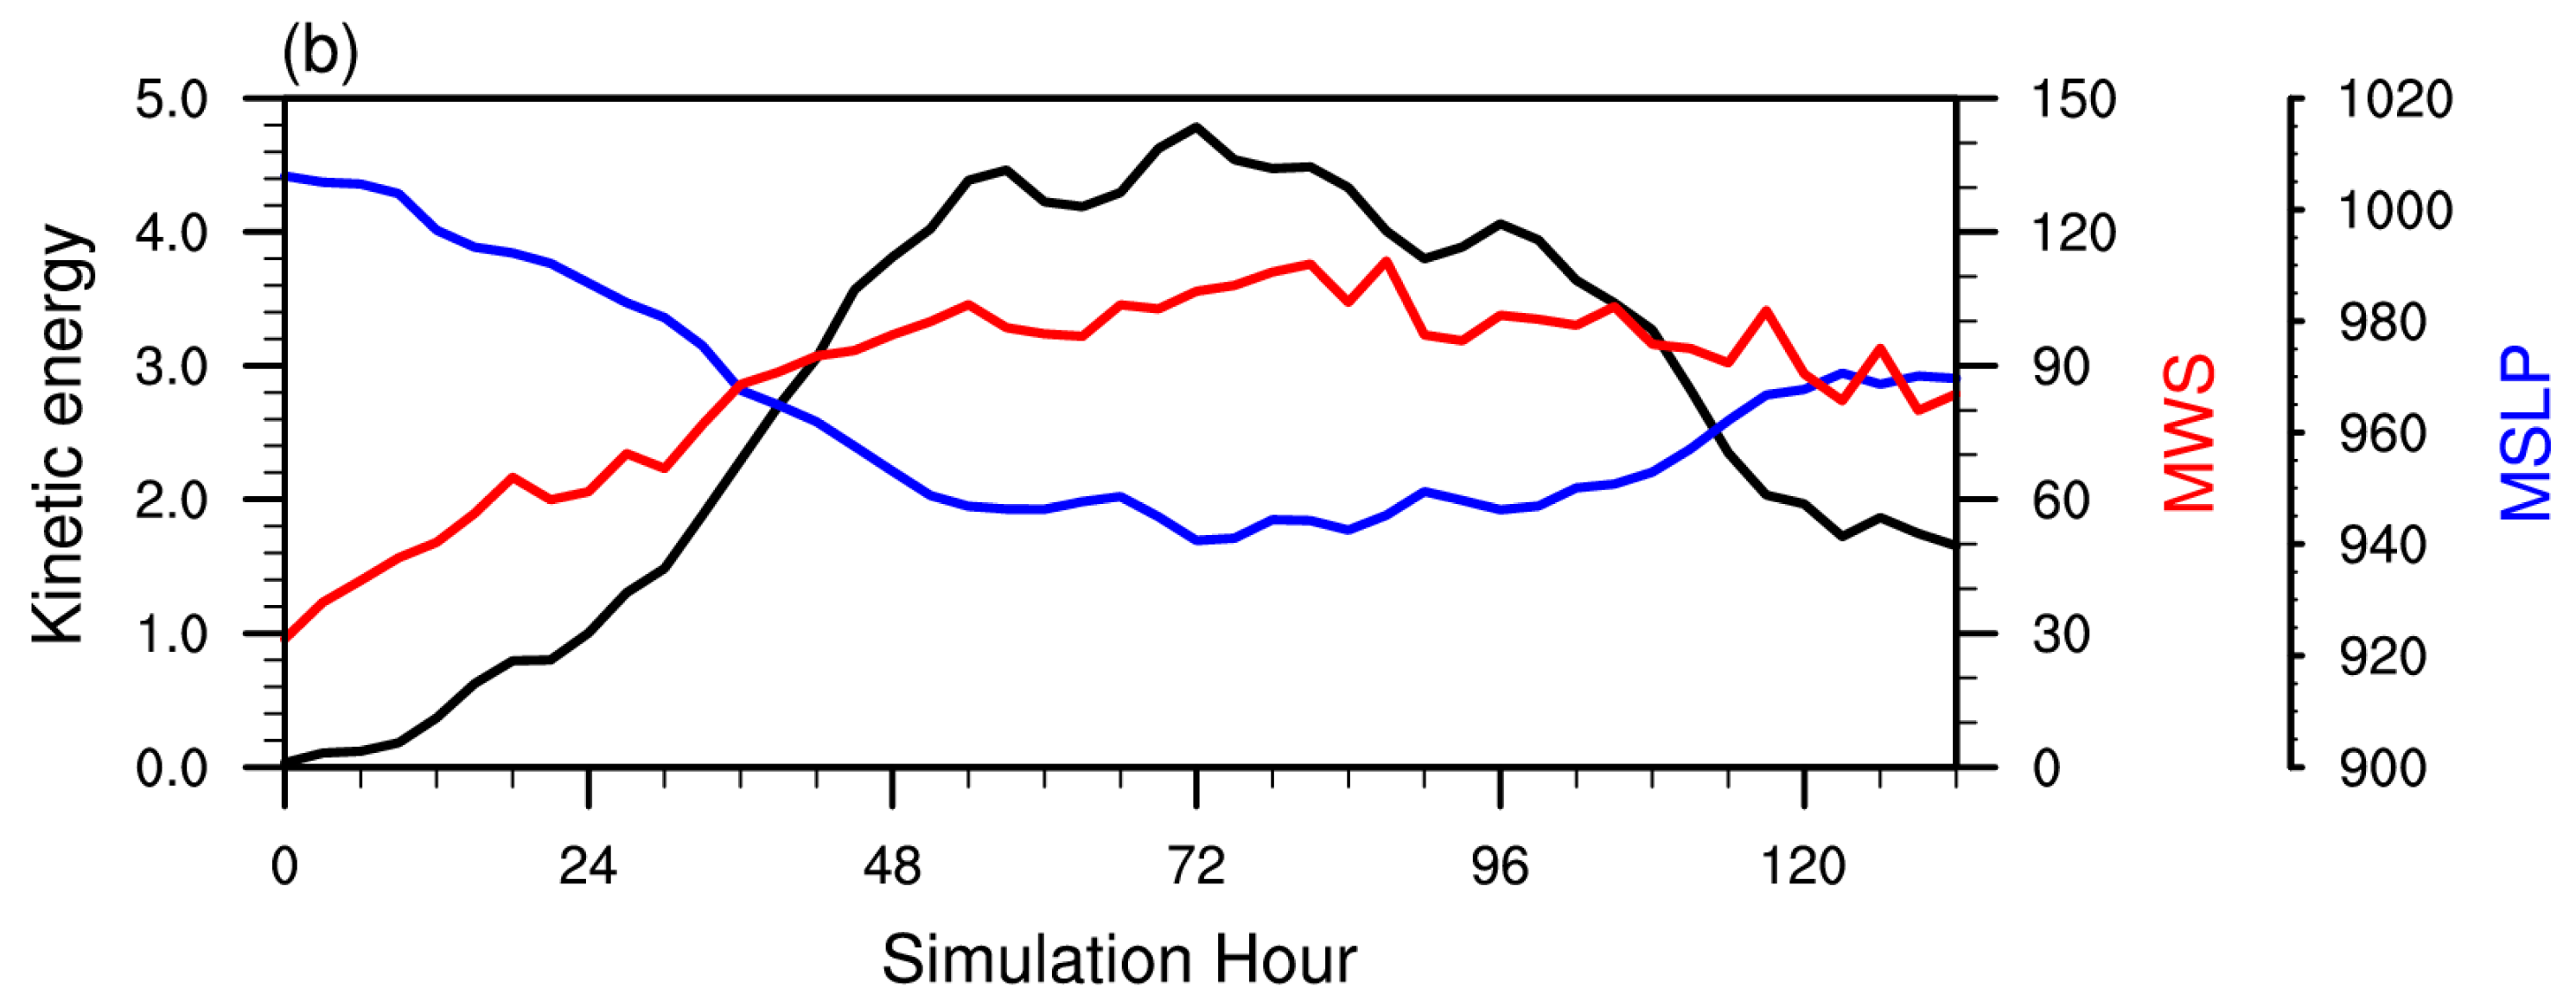
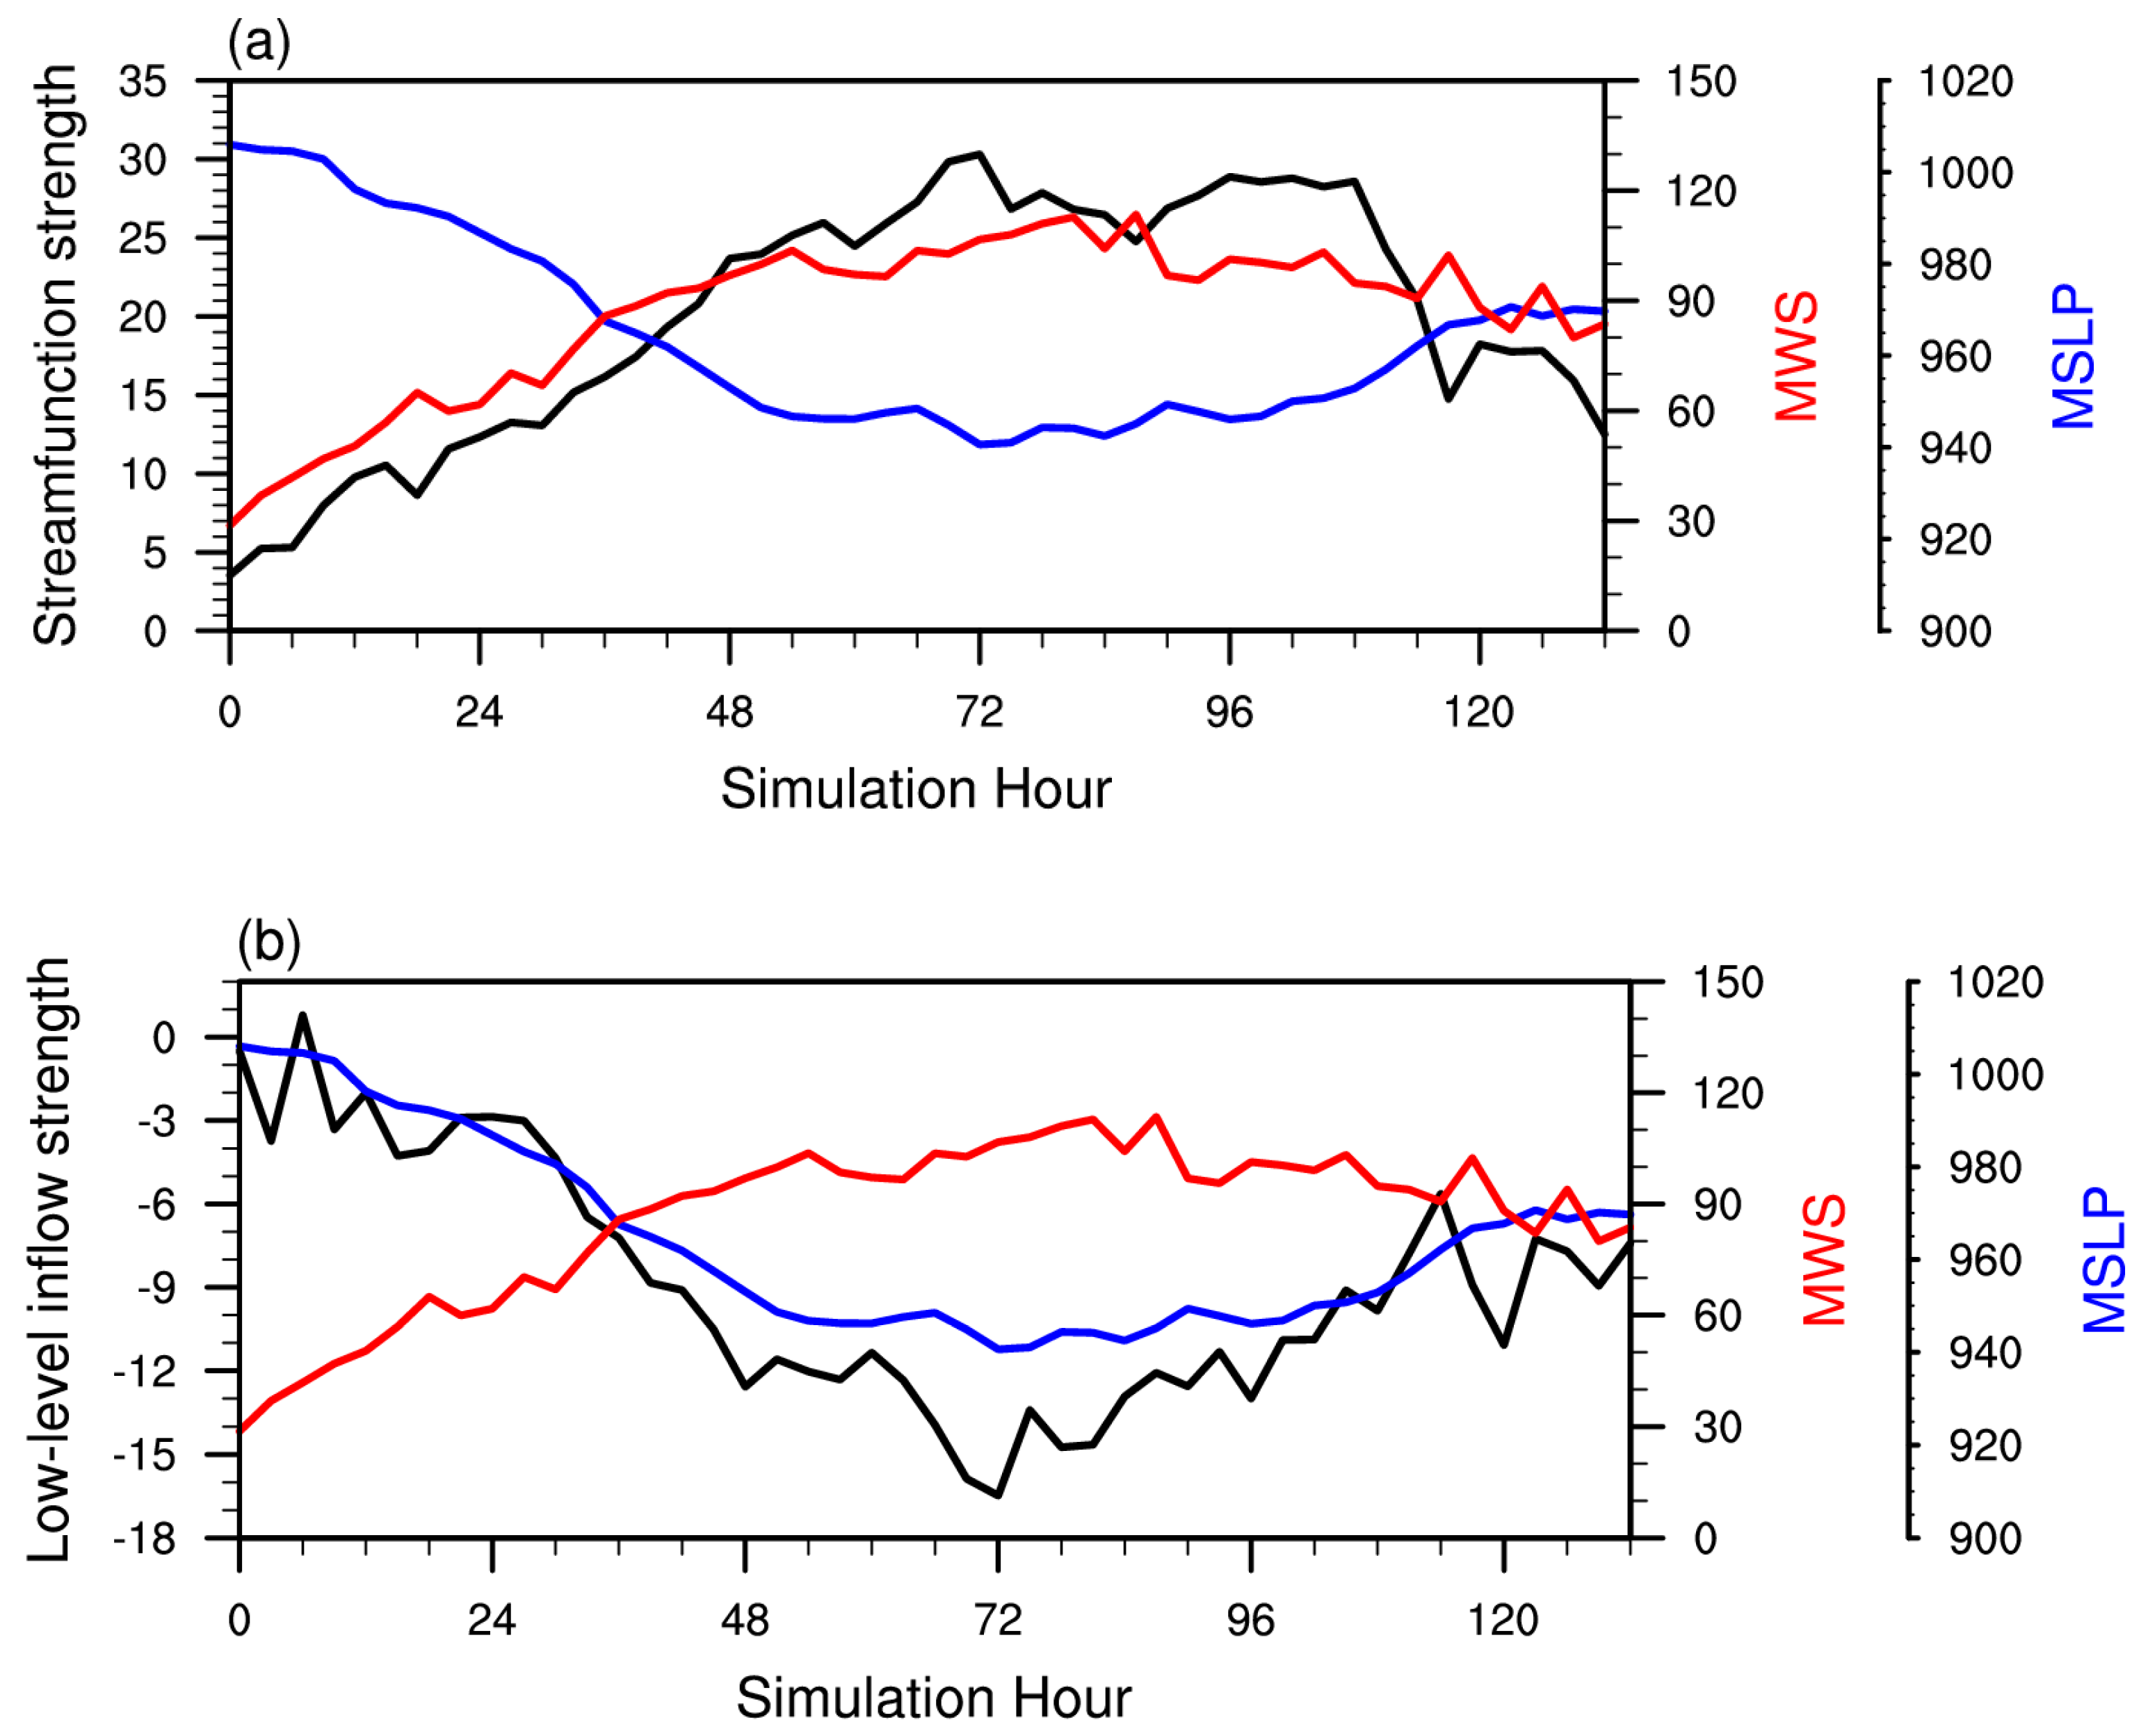
3.1. Simulated TC Track and Intensity Changes

The simulated TC track (red) is shown in Figure 2a. As one can see, the model successfully simulates the movement of TC Yutu. Initially, Yutu moves northwestward, and then turn northeastward in a later stage.
Figure 2b,c illustrate the evolution of TC intensity in terms of the maximum 10 m wind speed (MWS) and the minimum sea level pressure (MSLP) from 17 to 22 May 2007. While the TC track and intensity are in general reasonably simulated, there is a notable bias in the TC intensity simulation, which might be caused by the model convective parameterization scheme. Observed RI occurred from hour 24 to hour 72, but simulated RI happened from hour 24 to hour 48, while the intensification rate in the model was weaker from hour 48 to hour 72. In the following analysis, we will focus on examining the inner-core structure changes during the two periods, from hour 24 to hour 48 and from hour 48 to hour 72.

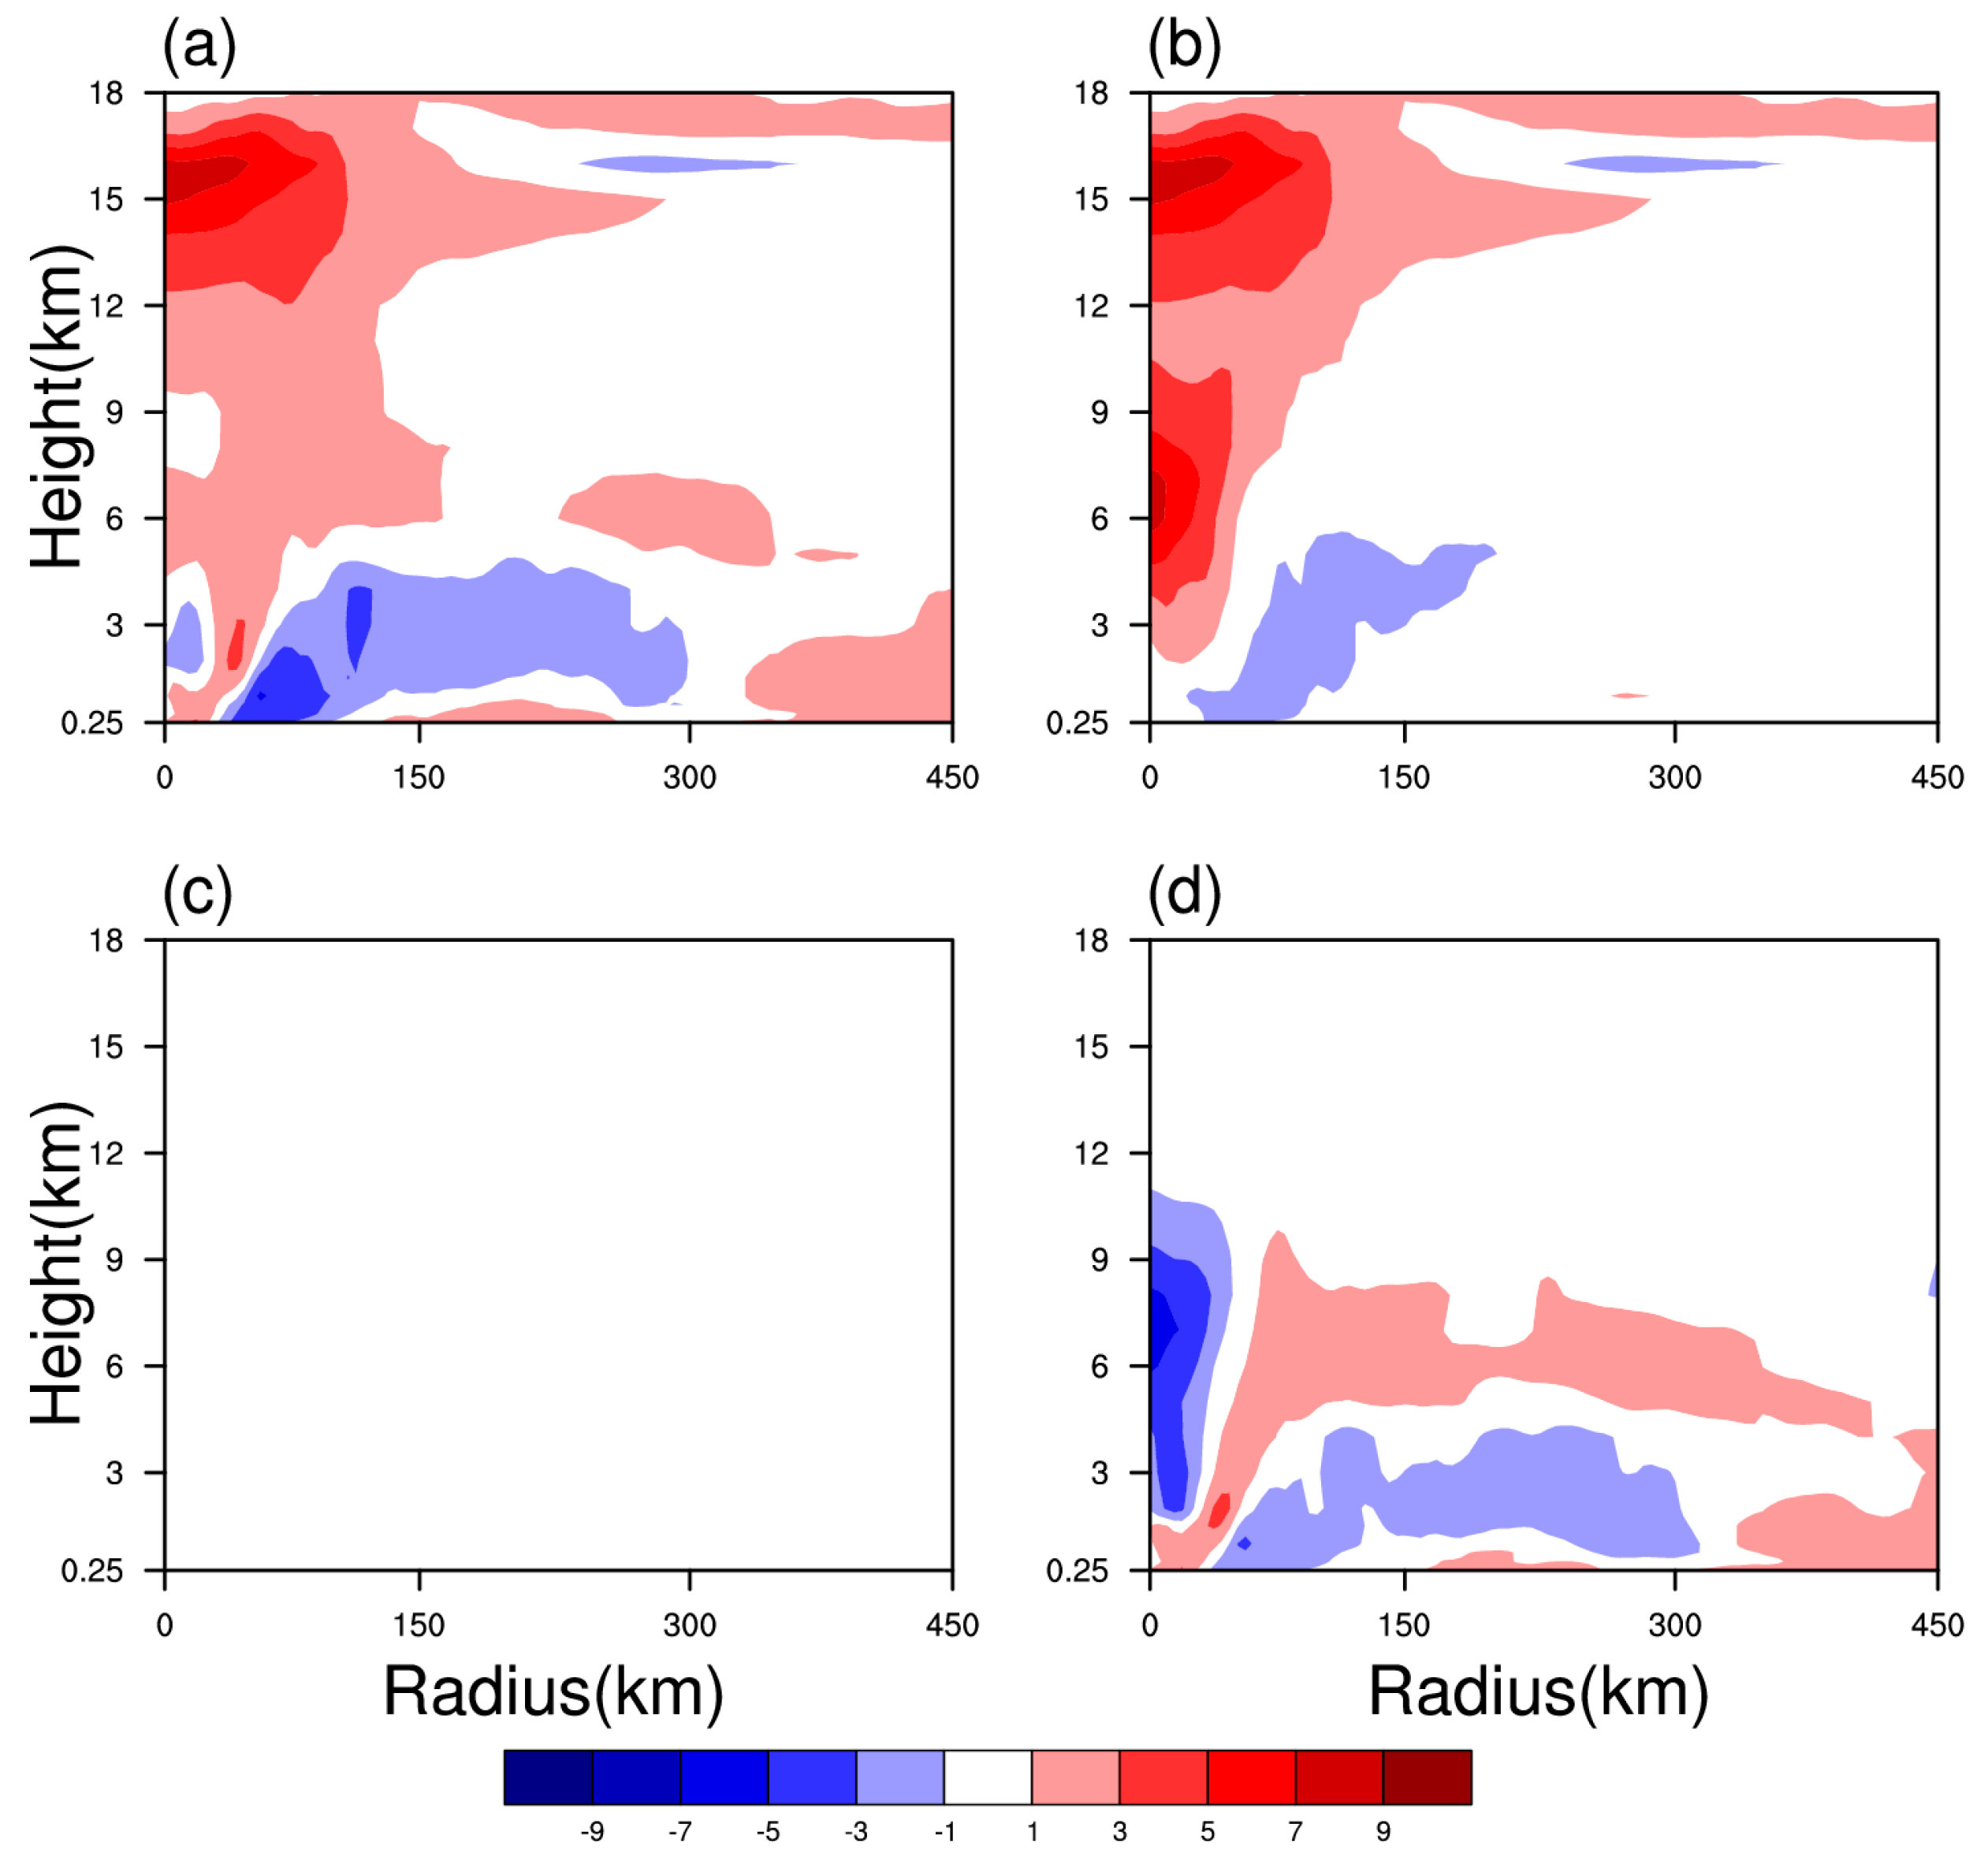
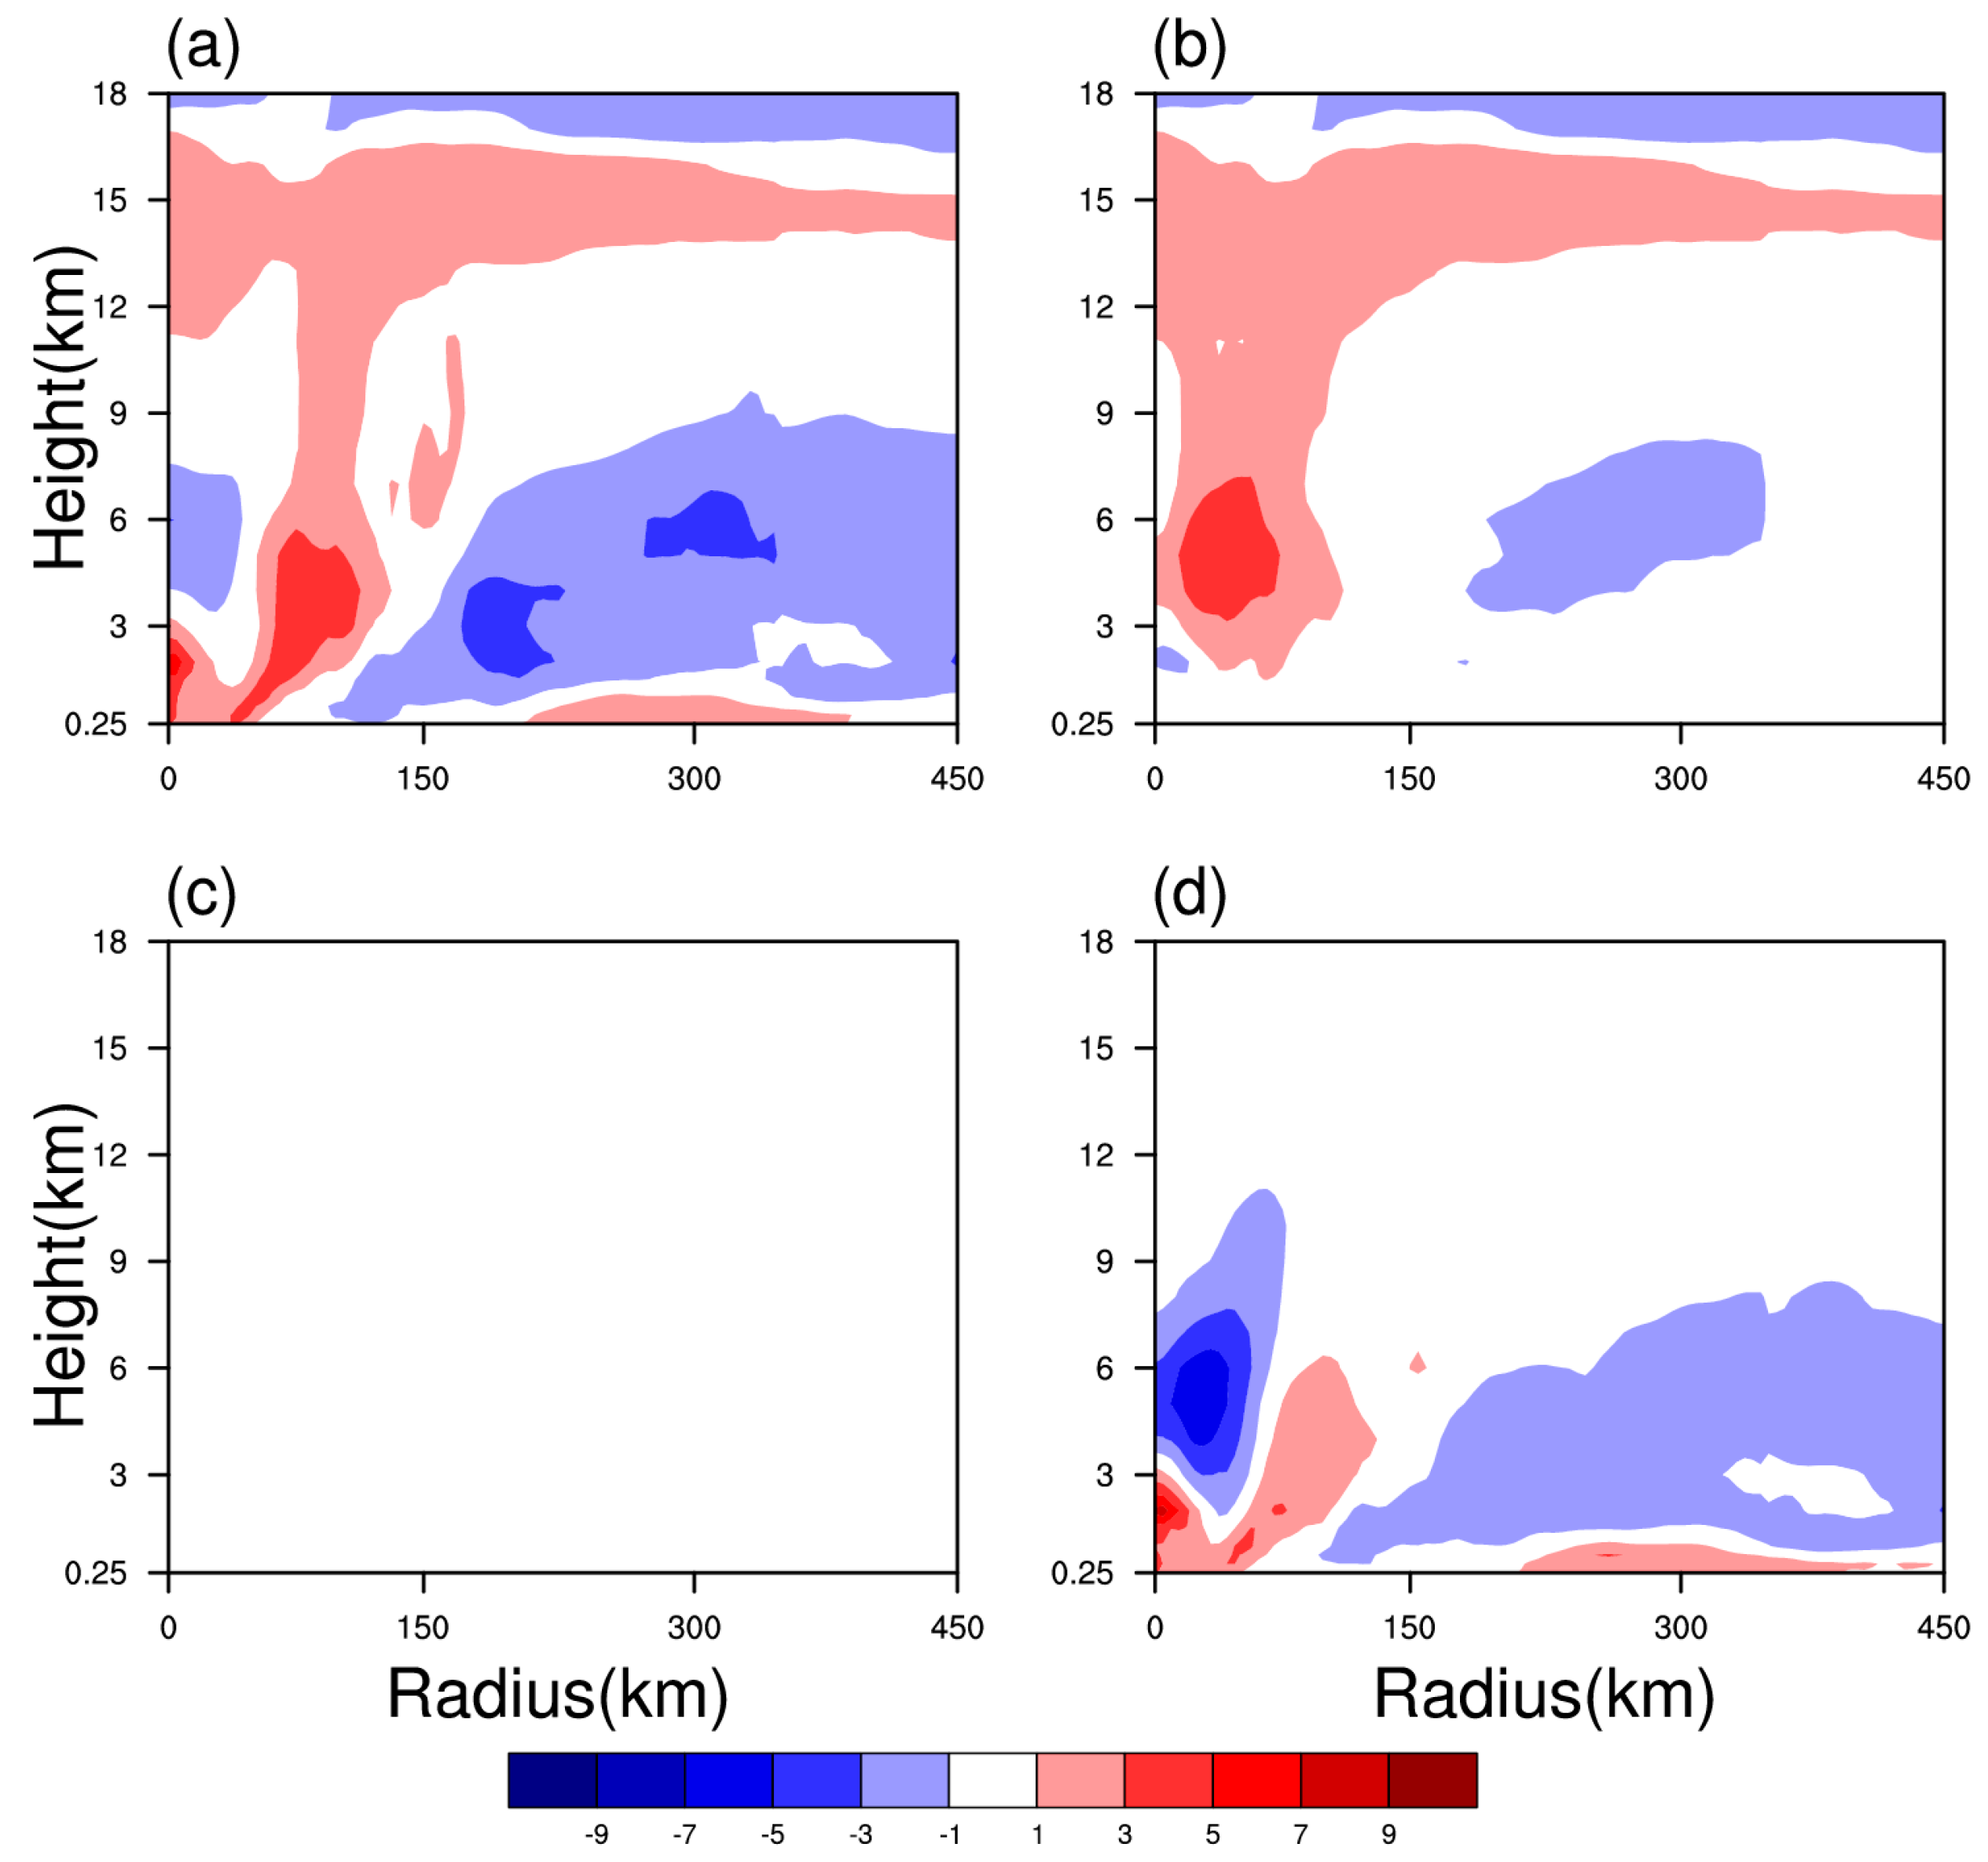
3.2. MSE Structure and Evolution Characteristics

Figure 3 shows the time evolution of the column-integrated MSE and column-integrated kinetic energy averaged in the 150 km radius around the TC center. It is interesting to note that the column-integrated MSE increases steadily as the TC intensifies, and decreases as the TC weakens (Figure 3a). In fact, the correlation coefficient between the column-integrated MSE and the TC MWS is 0.72, and the correlation coefficient between the MSE and TC MSLP is −0.80. The column-integrated kinetic energy increases rapidly as TC intensifies, and the temporal correlation coefficient between the column-integrated kinetic energy and the TC MWS (MSLP) is 0.92 (−0.98). Given the sampling numbers 45, both the correlations pass the 95% confidence level.
The MSE analysis above indicates that the evolution of TC total thermodynamic energy is closely linked to the evolution of TC maximum tangential wind or kinetic energy. Both the forms of TC energy increase as the TC develops. To further examine how the MSE radial-vertical structure evolves during the RI period and what are the major contributors of the MSE increase, we plotted the radial-vertical cross sections of the MSE difference field and its three components (i.e., C p T , g z , L v q ) between hour 48 and hour 24 and between hour 72 and hour 48, respectively (Figure 4b–d and Figure 5b–d). Note that the change of potential energy term g z is negligible (Figure 4c and Figure 5c), and the increase in MSE is largely attributed to the increase of the term C p T (Figure 4b and Figure 5b). During the period of hour 24 to hour 48, two maximum centers appear in the C p T term, with one in the upper level at 15 km and the other at 6 km. Both the centers are located within the radius of 100 km, implying a rapid warm core formation during the RI period (Figure 4b). During the period of hour 48 to hour 72, the largest contribution occurs in a low level between 3 and 7 km (Figure 5b). The term L v q also contributes to the MSE increase, primarily over the eyewall region (where strong ascent transports moisture upward) and near the surface (due to evaporation from the ocean surface). Its contribution becomes negative outside of the eyewall where compensating subsidence occurs and within the eye where the sinking motion dominates (Figure 4d and Figure 5d).
An interesting question is what causes the rapid MSE increase during the RI period. As the MSE change is primarily affected by column-integrated radiative fluxes and surface fluxes (Equation (1)), one may diagnose the relative contribution of the column-integrated long-wave and short-wave radiation and surface sensible and latent heat flux averaged during the two periods (i.e., from hour 24 to hour 48 and from hour 48 to hour 72). Table 1 and Table 2 show the diagnoses results of column-integrated longwave radiation and shortwave radiation fields and surface latent and sensible heat flux fields averaged within a 150 km radius. It was found that in both the periods the maximum contribution arises from the surface latent heat flux, followed by the surface sensible heat flux and the shortwave radiation. The strongest contribution of the latent heat flux is consistent with the fact that the condensational heating is the main energy source for TC development. The wind-induced surface heat exchange (WISHE) theory proposed by Emanuel [35] and Rotunno and Emanuel [36] stresses the importance of a positive feedback among wind-induced surface heat flux, moisture, and convection. The atmosphere also gains energy from shortwave radiative heating and the surface sensible heat flux. The column-integrated longwave radiation tends to cool the troposphere, but its impact is overwhelmed by contributions from the other three terms.

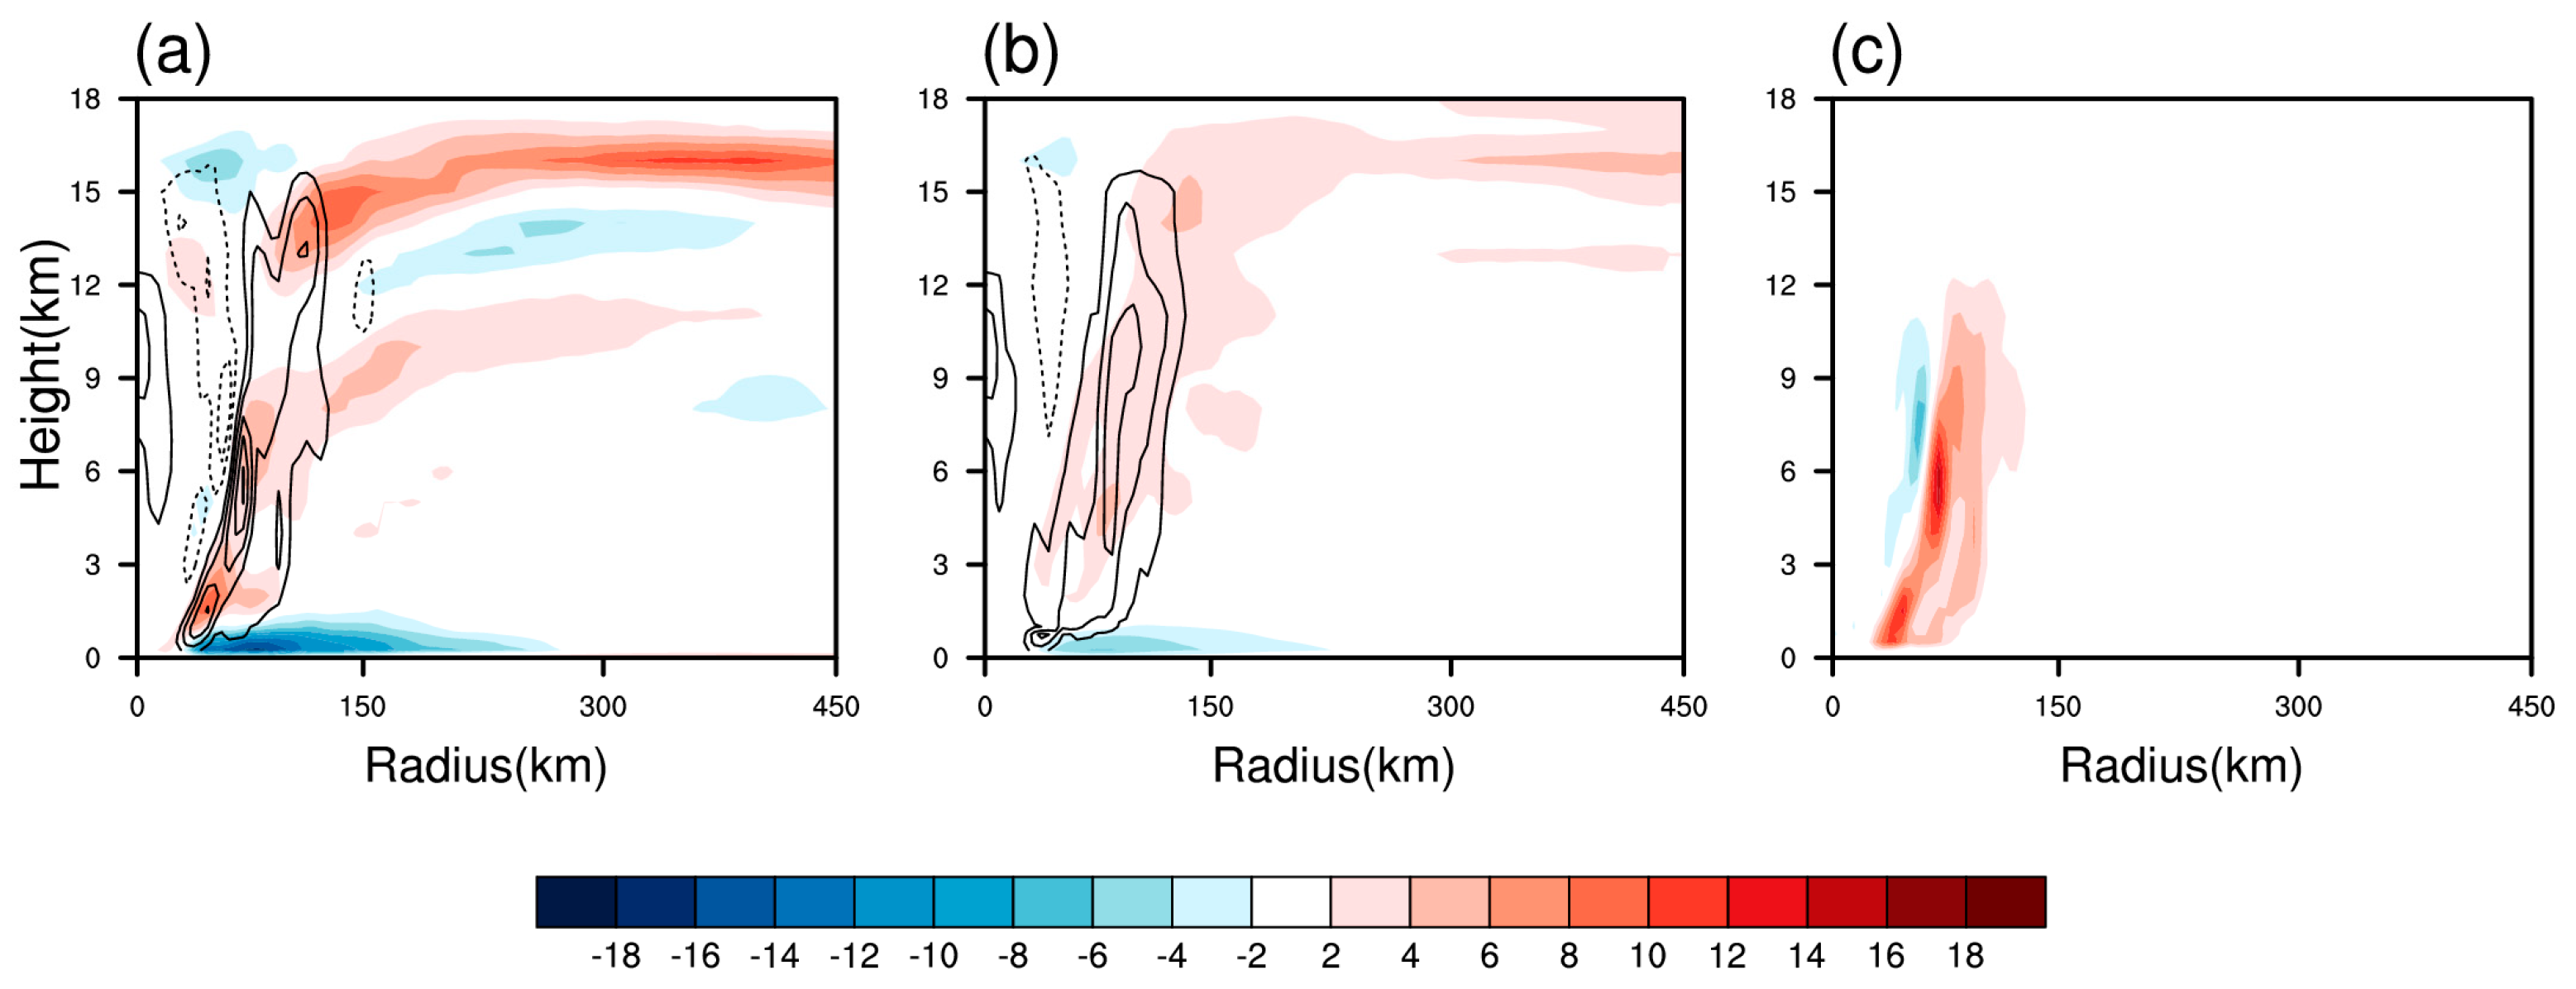
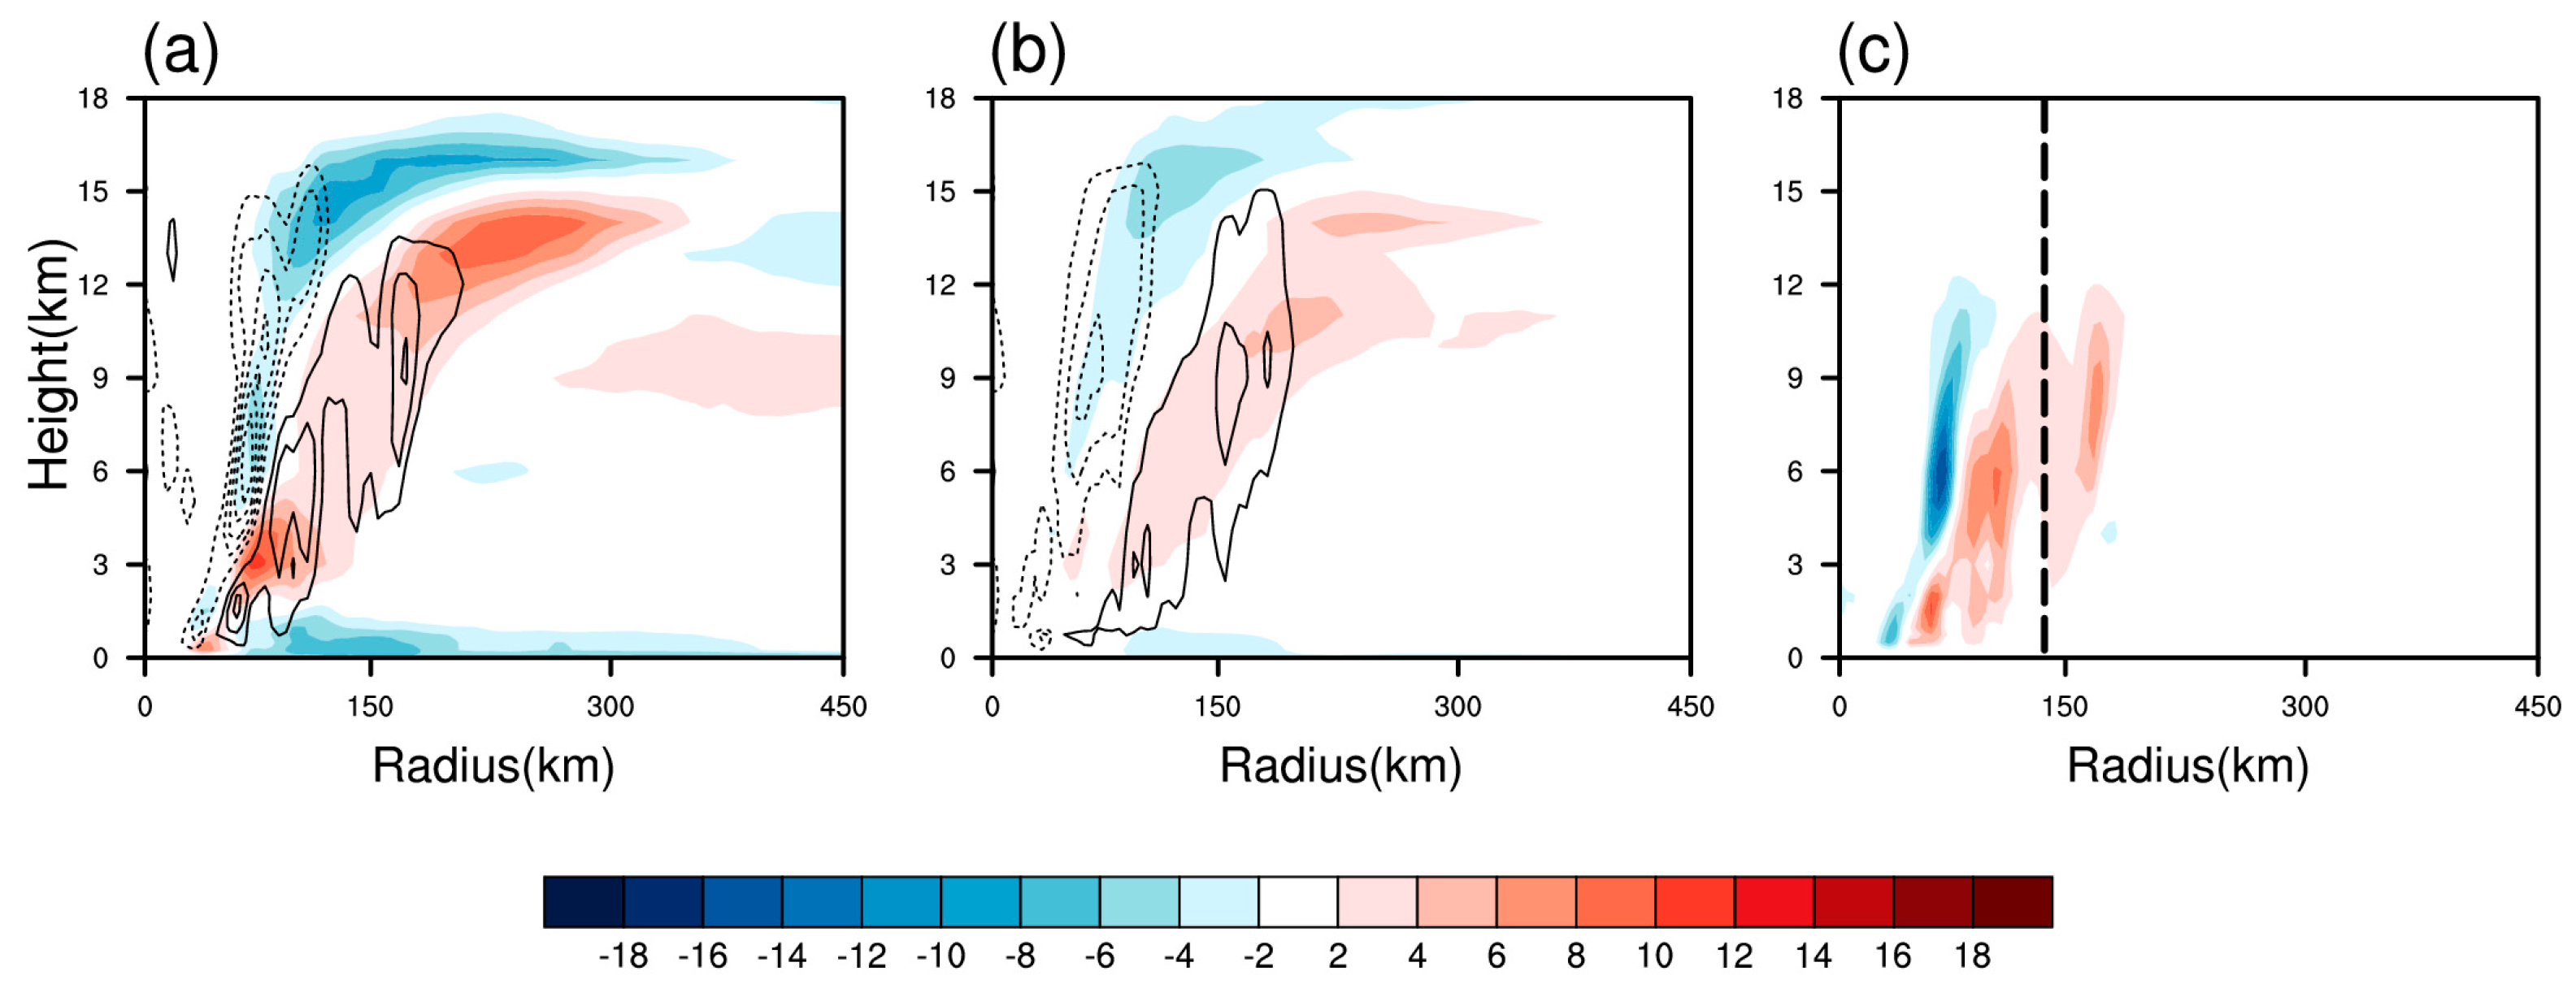
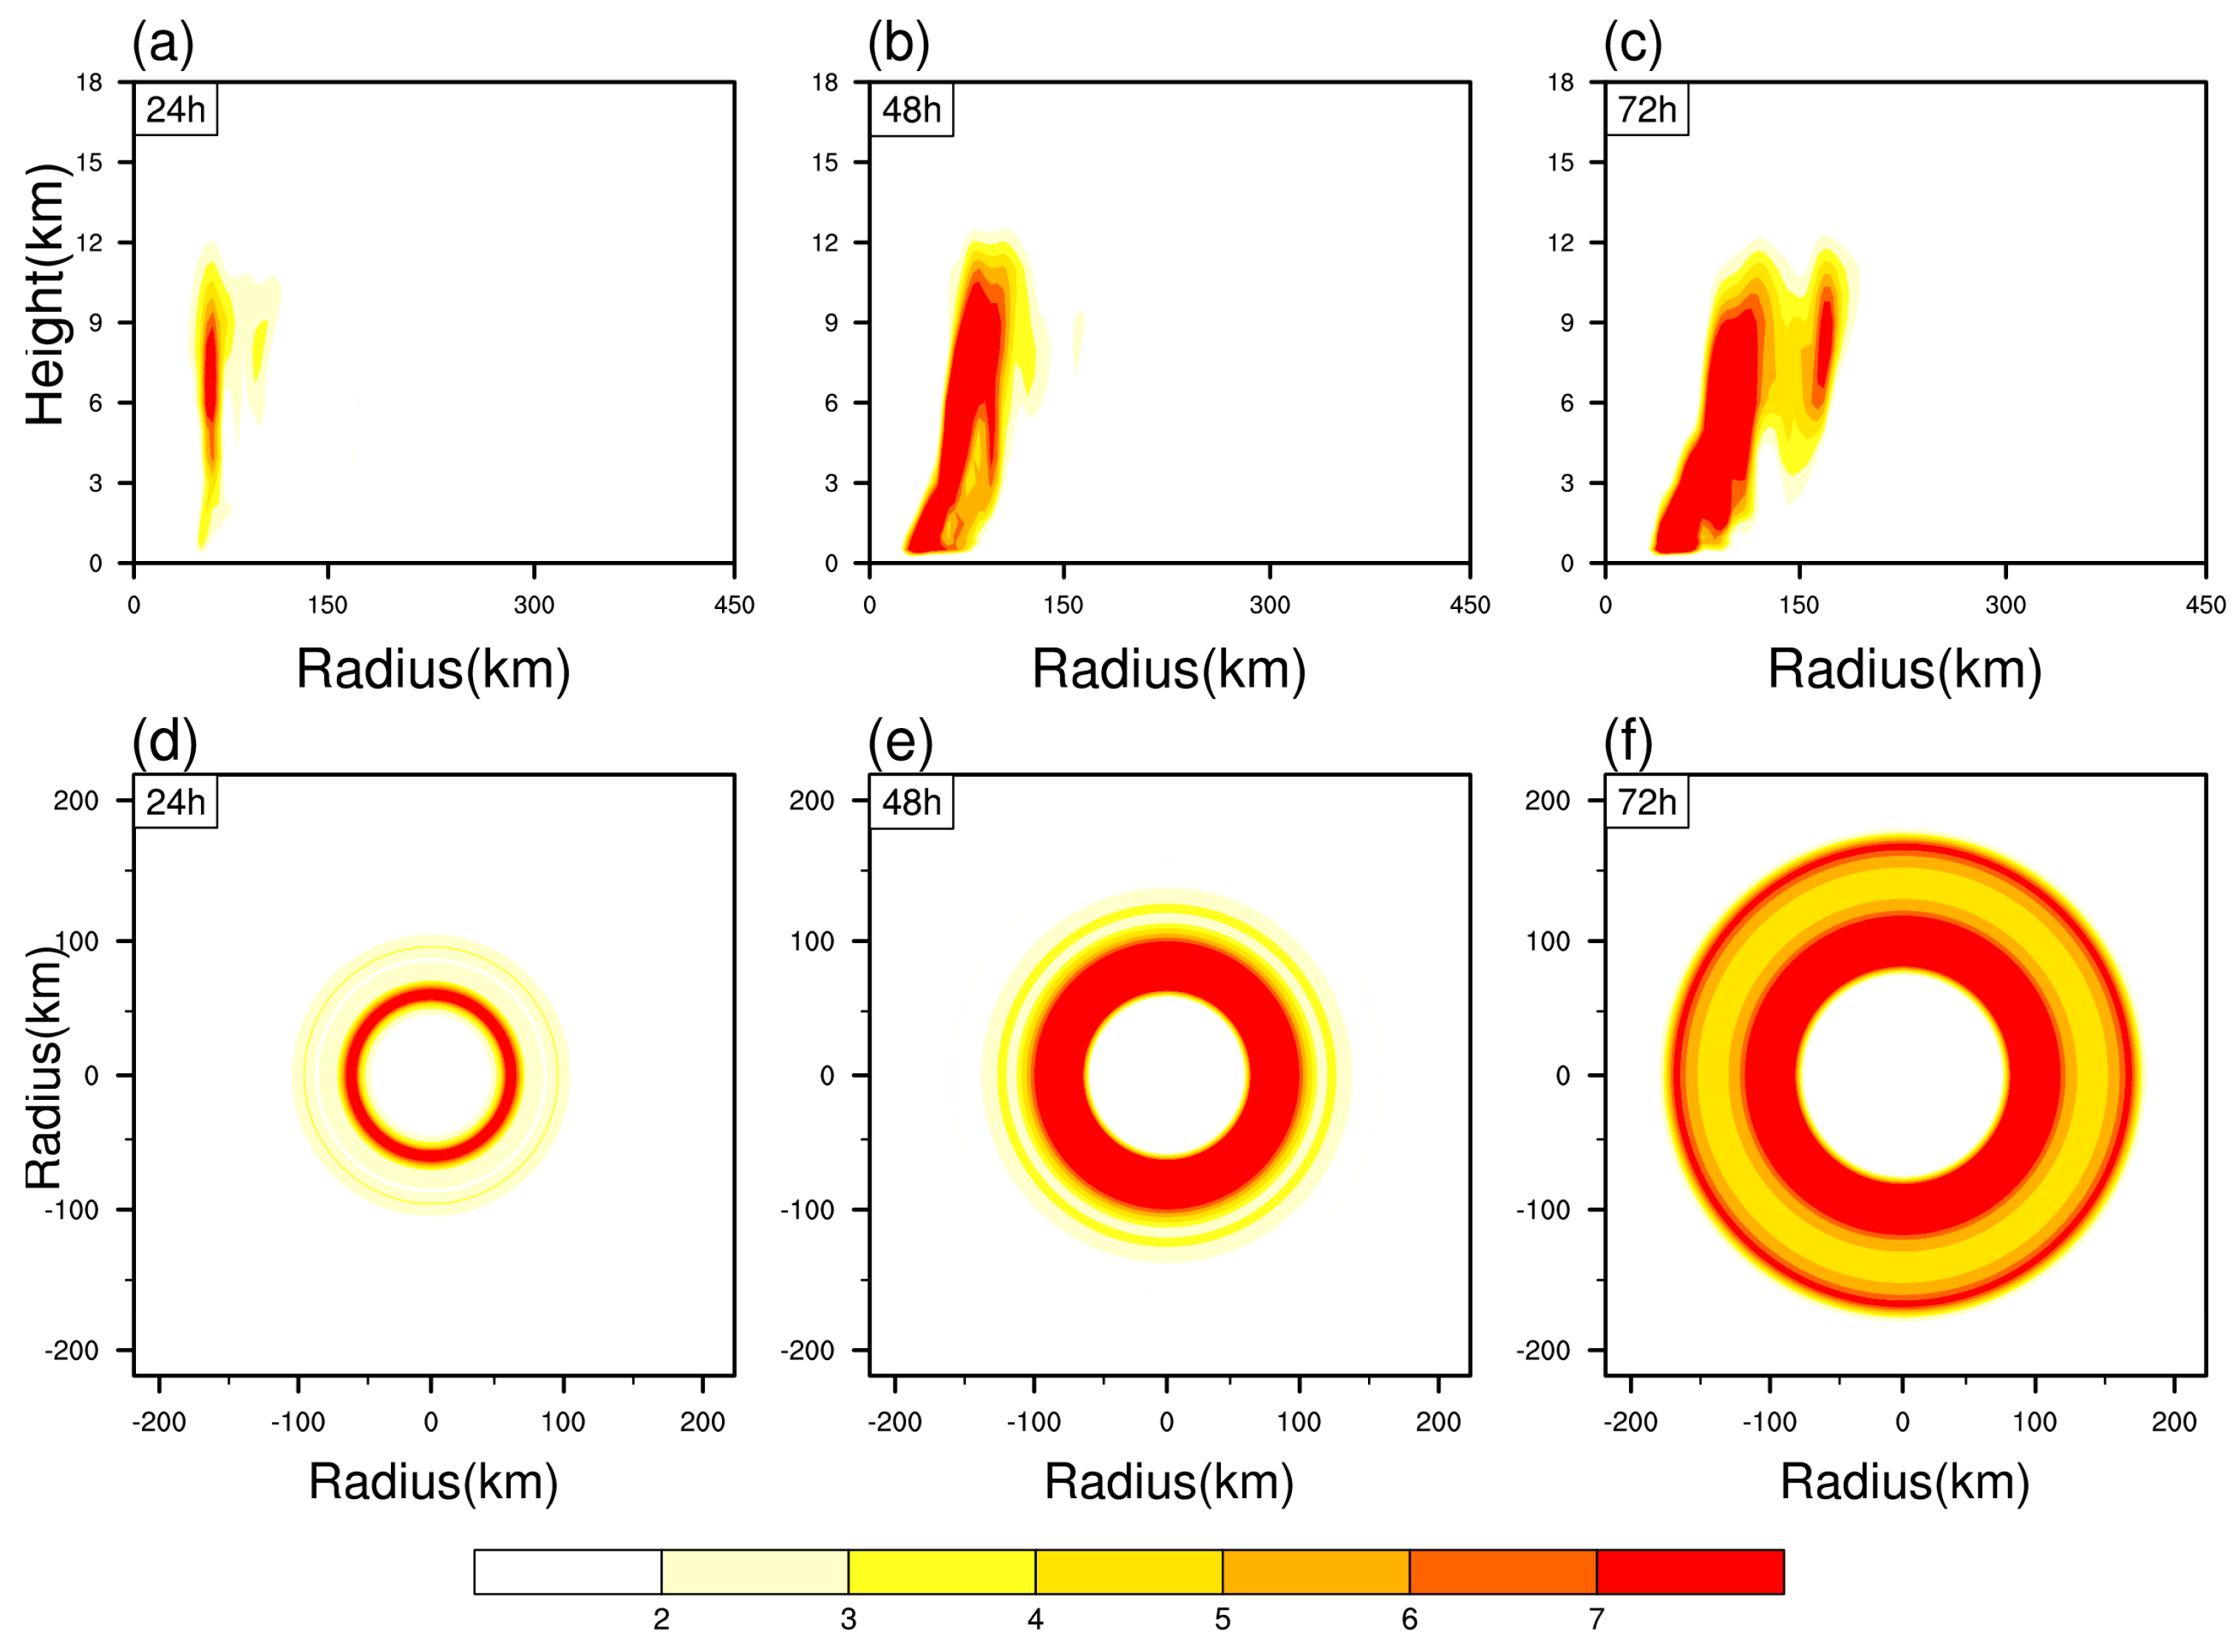
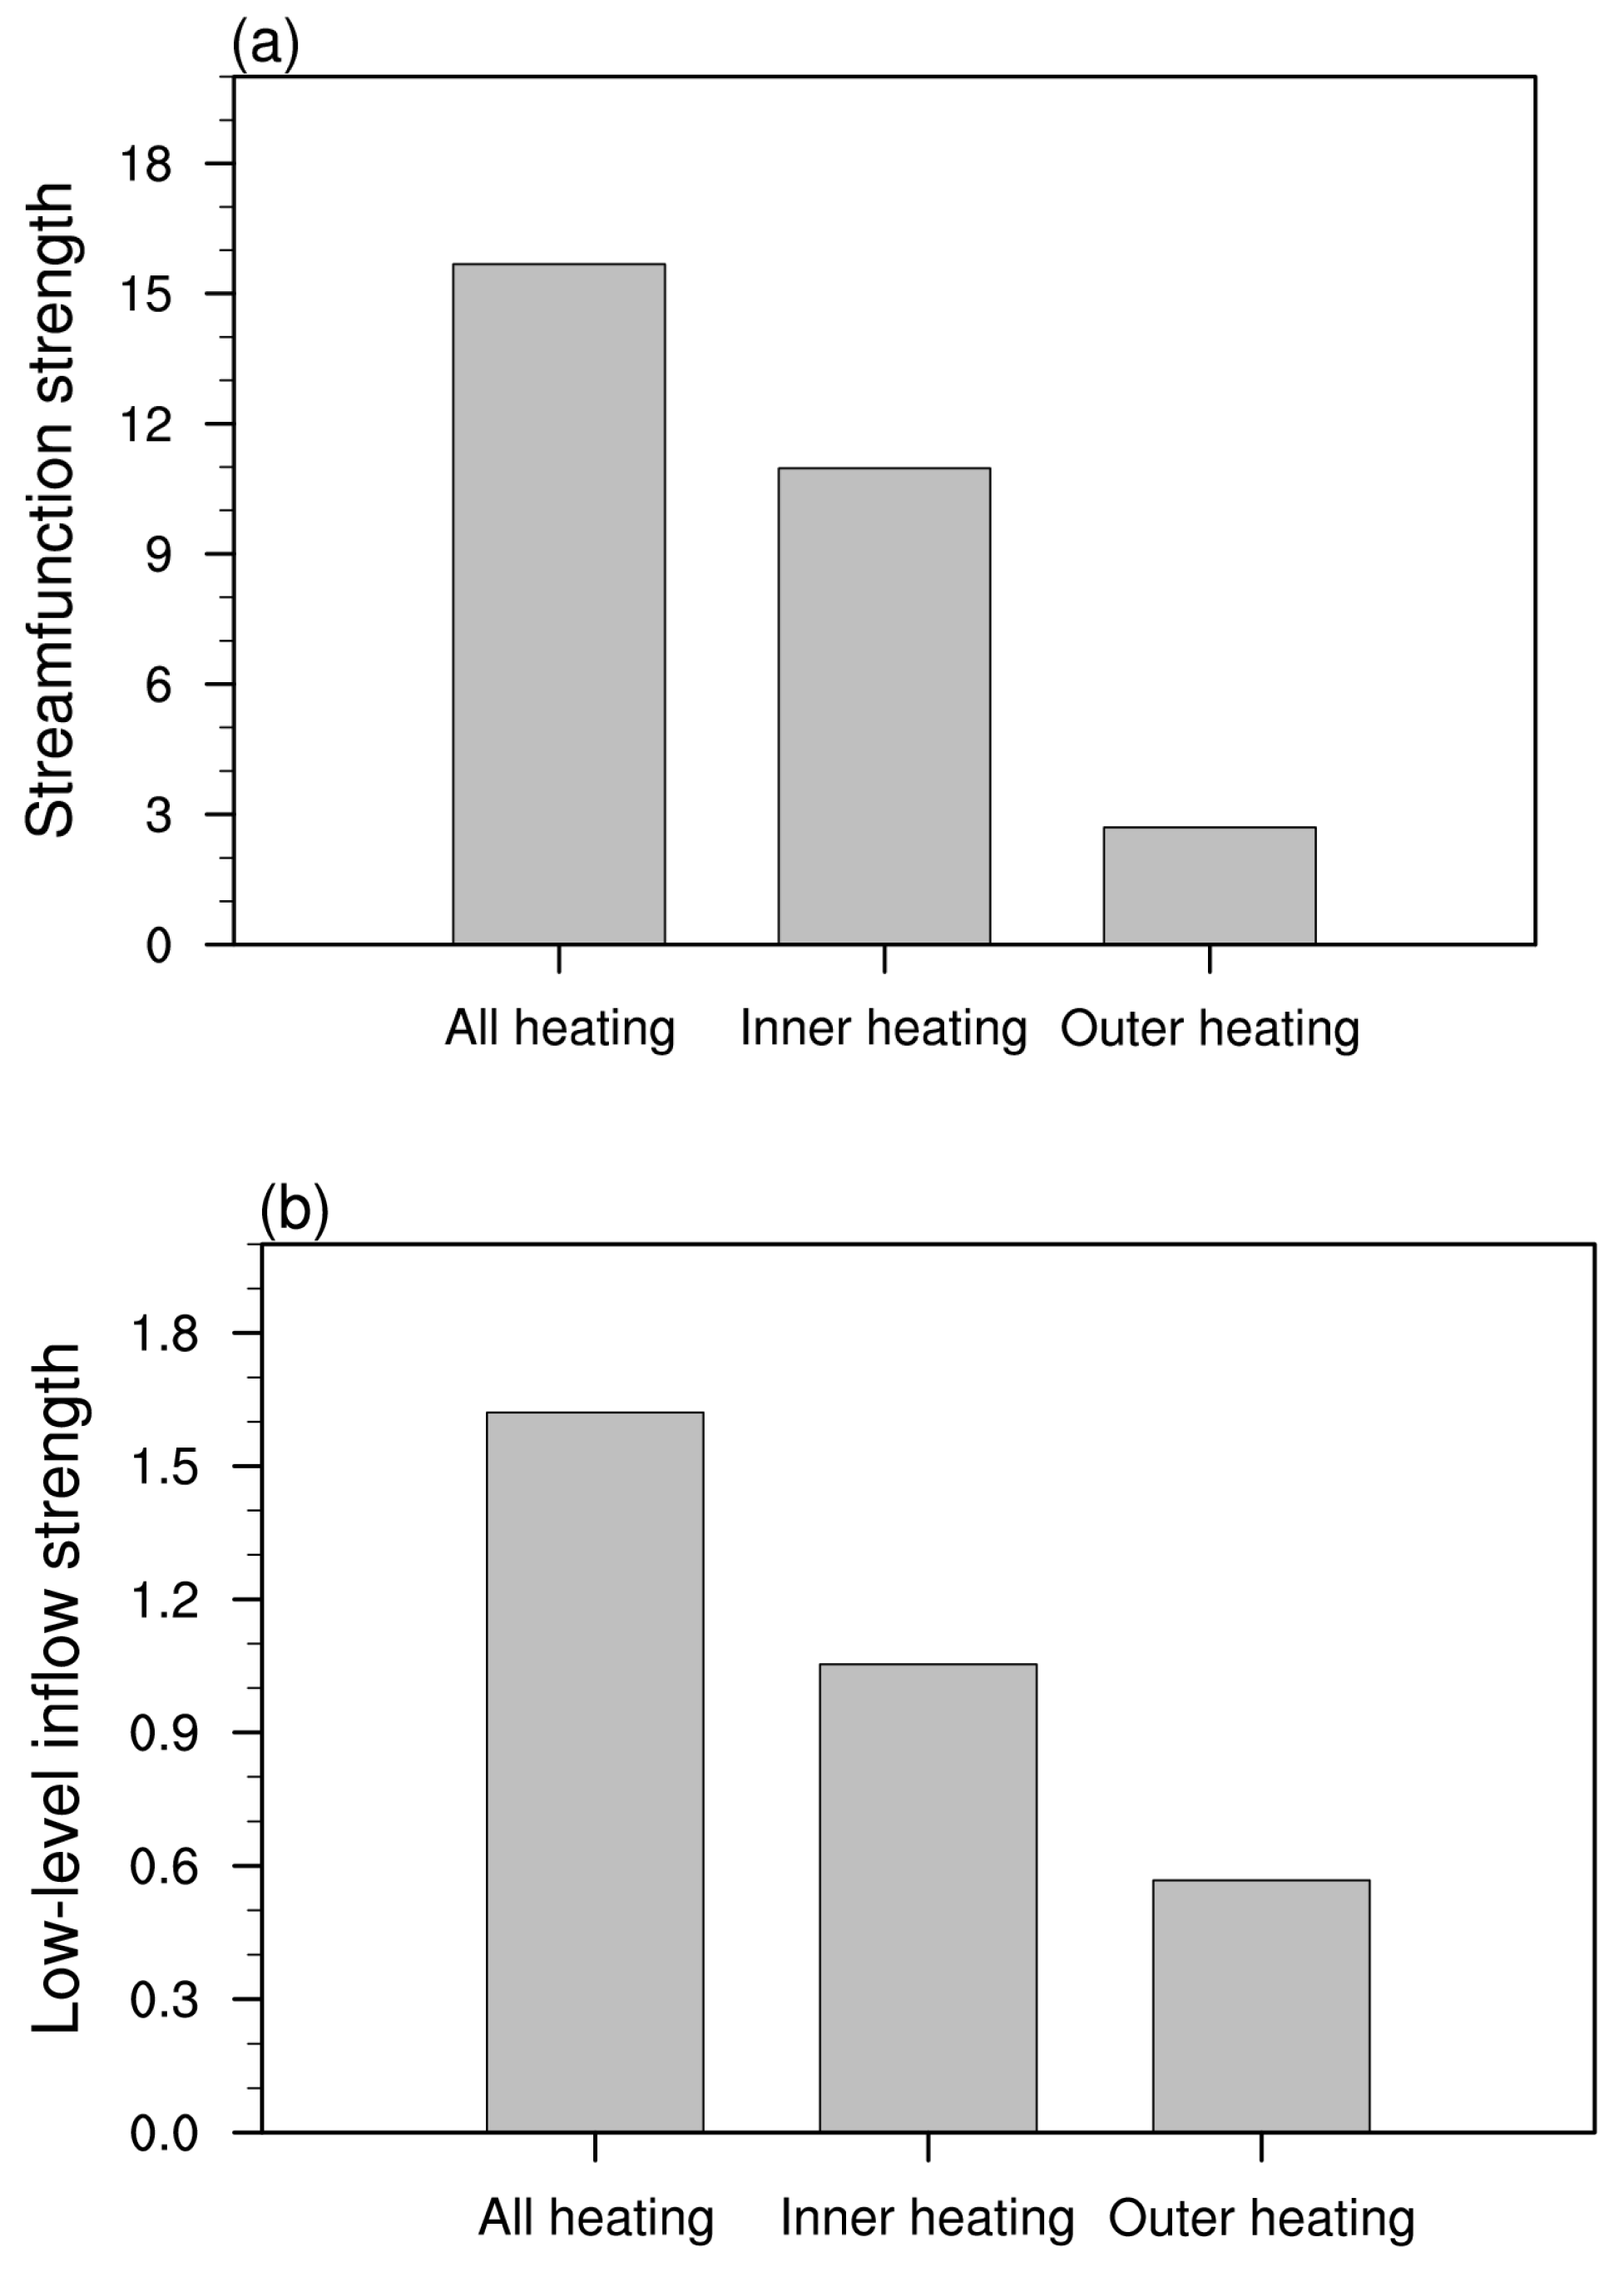
3.3. Secondary Circulation Structure and Evolution Characteristics

TC secondary circulation is critical in enhancing the primary circulation (i.e., rotation flow) through induced low-level inflow and diabatic heating [37,38]. In order to measure the intensity of the secondary circulation, we calculated the column-integrated transverse stream function from the surface to 18 km within the radius of 450 km, representing the overall strength of the TC secondary circulation.
It has been shown that the strength of the low-level inflow near the radius of the maximum wind can be directly linked to the growth of the storm’s MWS through the inward transport of the absolute angular momentum associated with the low-level inflow [37,38]. Therefore, another secondary circulation index is defined as the azimuthal-mean radial wind averaged from the surface to the height of 1 km between the radius of 50 and 150 km.
Figure 6 shows the time evolution of the two secondary circulation strength indices (i.e., the stream function index and the low-level inflow index). Note that the stream function index increases rapidly during the RI period (Figure 6a). The correlation coefficient between the time series of the stream function index and the MWS (MSLP) is 0.91 (−0.97). The low-level inflow strength also increases as the TC intensifies and decreases as the TC weakens (Figure 6b). The correlation coefficient between the time series of the low-level inflow index and the MWS (MSLP) is −0.9 (0.94). Again, the correlations pass the 95% confidence level. This indicates that the secondary circulation changes reflect well the TC primary circulation (i.e., intensity) change.
Figure 7a shows the structure change of the azimuthal-mean radial wind and vertical velocity fields between hour 48 and hour 24. The most noted features are the strengthening of low-level inflow and upper-level outflow and the increase of the ascending velocity along the eyewall. Accompanying the secondary circulation strengthening is the enhanced diabatic heating pattern shown in Figure 7c. For comparison, Figure 7b shows the radial wind and vertical velocity fields diagnosed based on the Sawyer–Eliassen (SE) equation forced by the heating pattern shown in Figure 7c. As one can see, the SE equation reproduces the upper-level outflow, low-level inflow, and updrafts difference fields reasonably well during the RI period, even though the outflow intensity is weaker.
The inside negative and outside positive diabatic heating difference field in Figure 7c implies a radially expanded eyewall during the RI period. Such a radial expansion continues during hour 48 to hour 72, as can be seen from Figure 8c. The radial expansion of the eyewall can be better viewed from the vertical-radial cross-sections and horizontal maps of the azimuthal-mean diabatic heating field. Figure 9 illustrates the temporal evolutions of the azimuthal-mean diabatic heating field at hour 24, 48, and 72 from the view of the height-radial cross-sections and horizontal distribution. Note that as the eyewall heating intensifies, it is expanded radially from hour 24 to hour 48 and from hour 48 to hour 72. The result suggests that the RI is accompanied by slightly radially expanded eyewall heating.
An interesting feature during the period of hour 48 to hour 72 is the emergence of two split positive heating centers separated by a black dashed line near the radius of 140 km (Figure 8c). An outer heating center emerges outside the eyewall between 140 km and 200 km, while the inner heating center is located between the 70 km and 140 km radius. The intensity of the outer heating is weaker and confined above 5 km of height, suggesting that it might result from stratiform clouds.
To reveal the relative importance of the inner and outer heating anomalies in contributing to the growth of the secondary circulation during hour 48 to hour 72, we diagnosed the SE equation with separately specified inner and outer heating forcing. The diagnosed radial wind and vertical velocity patterns (Figure 8b) when both the inner and outer heating fields are considered resemble well those directly obtained from the WRF simulation (Figure 8a), with a weaker intensity.
Given that the SE equation diagnosis is capable of reproducing the heating induced secondary circulation change during hour 48 to hour 72, we further examined the relative contributions of the inner and outer heating. Figure 10 shows the calculation result. The response to the inner heating accounts for about 70% while the outer heating contributes 30%.
The results above indicate that the radially expanded eyewall heating during the two periods (both from hour 24 to hour 48 and from hour 48 to hour 72) is critical for the strengthening of the secondary circulation and thus for TC RI.

4. Summary and Discussion

Due to a lack of TC inner structure observations in the WNP, the link of TC RI in the region to TC inner core structure is a long-outstanding issue. In this study, through a high-resolution simulation, we intended to reveal such a linkage. The WRF model was used to simulate the inner-core dynamic and thermodynamic structure of Super Typhoon Yutu (2007). It was found that column-integrated moist static energy (MSE) represents well the TC intensity change. A rapid increase of the MSE was found during the RI period. The increase of the column-integrated MSE is primarily attributed to the increase of temperature in the core region. The rapid increase of the warm core is caused by both subsidence-induced adiabatic warming within the eye and strengthened diabatic heating along the eyewall. Moisture also contributes to the MSE increase, primarily near the surface and along the eyewall. By analyzing the column-integrated MSE budget equation, we found that the surface latent heat flux is the major contributor to the increase of the column-integrated MSE during the RI period, followed by the surface sensible heat flux and column-integrated shortwave radiation.
The column-integrated transverse stream function was calculated as a secondary circulation index to quantitatively measure the overall strength of the TC secondary circulation. It was found that the time evolution of the secondary circulation index is significantly correlated to the TC intensity (i.e., the TC primary circulation) change. A rapid increase of the secondary circulation appears during the RI period, and the increase is characterized by strengthened low-level inflow and upper-level outflow and enhanced ascending motion along the eyewall. It was further found that enhanced diabatic heating during the RI expands radially. The enhanced and radially expanded eyewall is critical to strengthen the secondary circulation and thus for the RI of the primary circulation.
From hour 48 to 72, in addition to the eyewall expansion, there is another well separated heating center outside the eyewall. The outer heating is primarily confined above 5 km of height, and is possibly associated with stratiform clouds. A diagnosis of the SE equation revealed the relative role of the inner and outer heating anomalies in strengthening the secondary circulation during the period. The result shows that the strengthening of the secondary circulation during the period is primarily attributed to the inner eyewall heating (70%), while the outer heating also plays a role (30%).
Although the current work is only a case study, it points out the important linkage between column-integrated MSE evolution and the TC intensity change, the cause of the MSE change during RI, and the role of the radially expanding diabatic heating in causing the TC rapid intensification. Therefore, the current study sheds some new light on the long outstanding issue related to TC RI. Further studies examining MSE and secondary circulation evolution characteristics with more TC cases and considering not only TC inner core structure but also TC environmental conditions [39,40] are needed, in order to reveal robust and statistically significant features associated with RI.

Author Contributions

Data curation, C.M.; funding acquisition, T.L.; conceptualization, T.L.; methodology, X.L. and T.L.; formal analysis and investigation, X.L., T.L. and C.M.; writing—original draft, X.L. and T.L. All authors have read and agreed to the published version of the manuscript.

Funding

This work was jointly supported by NSFC grant 42088101 and NOAA NA18OAR4310298. This is SOEST contribution number 12345 and IPRC contribution number 1234.

Institutional Review Board Statement

Not applicable.

Informed Consent Statement

Not applicable.

Data Availability Statement

The JTWC TC best-track data are available at http://www.metoc.navy.mil/jtwc/jtwc.html?best-tracks (accessed on 2 June 2022). The NCEP FNL analysis is provided by the National Center for Atmospheric Research at http://rda.ucar.edu/datasets/ds083.2 (accessed on 2 June 2022).

Acknowledgments

We acknowledge the High Performance Computing Center of Nanjing University of Information Science & Technology for their support of this work.

Conflicts of Interest

The authors declare no conflict of interest.

References

  1. Zhang, Q.; Zhang, W.; Chen, Y.D.; Jiang, T. Flood, drought and typhoon disasters during the last half-century in the Guangdong province, China. Nat. Hazards 2011, 57, 267–278. [Google Scholar] [CrossRef]
  2. Peduzzi, P.; Chatenoux, B.; Dao, H.; De Bono, A.; Herold, C.; Kossin, J.; Mouton, F.; Nordbeck, O. Global trends in tropical cyclone risk. Nat. Clim. Chang. 2012, 2, 289–294. [Google Scholar] [CrossRef]
  3. England, M.H.; McGregor, S.; Spence, P.; Meehl, G.A.; Timmermamm, A.; Cai, W.; Gupta, A.S.; McPhaden, M.J.; Purich, A.; Santoso, A. Recent intensification of wind-driven circulation in the Pacific and the ongoing warming hiatus. Nat. Clim. Chang. 2014, 4, 222–227. [Google Scholar] [CrossRef]
  4. DeMaria, M. A simplified dynamical system for tropical cyclone intensity prediction. Mon. Weather Rev. 2009, 137, 68–82. [Google Scholar] [CrossRef] [Green Version]
  5. Rappaport, E.N.; Frankon, J.L.; Avila, L.A.; Baig, S.R.; Beven, J.L.; Blake, E.S.; Burr, C.A.; Jiing, J.G.; Juckins, C.A.; Knabb, R.D.; et al. Advances and challenges at the National Hurricane Center. Weather Forecast. 2009, 24, 395–419. [Google Scholar] [CrossRef] [Green Version]
  6. Knaff, J.A.; Sampson, C.R.; Musgrave, K.D. An operational rapid intensification prediction aid for the western North Pacific. Weather Forecast. 2018, 33, 799–811. [Google Scholar] [CrossRef]
  7. Wang, B.; Zhou, X. Climate variation and prediction of rapid intensification in tropical cyclones in the western North Pacific. Meteorol. Atmos. Phys. 2008, 99, 1–16. [Google Scholar] [CrossRef]
  8. Bosart, L.F.; Bracken, W.E.; Molonari, J.; Velden, C.S.; Black, P.G. Environmental influences on the rapid intensification of Hurricane Opal (1995) over the Gulf of Mexico. Mon. Weather Rev. 2000, 128, 322–352. [Google Scholar] [CrossRef]
  9. Kaplan, J.; DeMaria, M. Large-scale characteristics of rapidly intensifying tropical cyclones in the north Atlantic basin. Weather Forecast. 2003, 18, 1093–1108. [Google Scholar] [CrossRef] [Green Version]
  10. Molinari, J.; Vollaro, D. Rapid intensification of a sheared tropical storm. Mon. Weather Rev. 2010, 138, 3869–3885. [Google Scholar] [CrossRef]
  11. Ryglicki, D.R.; Cossuth, J.H.; Hodyss, D.; Doyle, J.D. The unexpected rapid intensification of tropical cyclones in moderate vertical wind shear. Part I: Overview and observations. Mon. Weather Rev. 2018, 146, 3773–3800. [Google Scholar] [CrossRef]
  12. DeMaria, M.; Kaplan, J.; Baik, J.J. Upper-Level eddy angular momentum fluxes and tropical cyclone intensity change. J. Atmos. Sci. 1993, 50, 1133–1147. [Google Scholar] [CrossRef] [Green Version]
  13. Fischer, M.S.; Tang, B.H.; Corbosiero, K.L. Assessing the influence of upper-tropospheric troughs on tropical cyclone intensification rates after genesis. Mon. Weather Rev. 2017, 145, 1295–1313. [Google Scholar] [CrossRef] [Green Version]
  14. Kossin, J.P.; Eastin, M.D. Two distinct regimes in the kinematic and thermodynamic structure of the hurricane eye and eyewall. J. Atmos. Sci. 2001, 58, 1079–1090. [Google Scholar] [CrossRef]
  15. Miyamoto, Y.; Takemi, T. A triggering mechanism for rapid intensification of tropical cyclones. J. Atmos. Sci. 2015, 72, 2666–2681. [Google Scholar] [CrossRef]
  16. Chen, X.; Xue, M.; Fang, J. Rapid intensification of Typhoon Mujigae (2015) under different sea surface temperatures: Structural changes leading to rapid intensification. J. Atmos. Sci. 2018, 75, 4313–4335. [Google Scholar] [CrossRef]
  17. Corbosiero, K.L.; Molinari, J.; Black, M.L. The structure and evolution of Hurricane Elena (1985). Part I: Symmetric intensification. Mon. Weather Rev. 2005, 133, 2905–2921. [Google Scholar] [CrossRef]
  18. Corbosiero, K.L.; Molinari, J.; Aiyyer, A.R. The structure and evolution of Hurricane Elena (1985). Part II: Convective asymmetries and evidence for vortex Rossby waves. Mon. Weather Rev. 2006, 134, 3073–3091. [Google Scholar] [CrossRef]
  19. Reasor, P.D.; Montgomery, M.T.; Marks, F.D.; Gamache, J.F. Low-wavenumber structure and evolution of the hurricane inner core observed by airborne dual-Doppler radar. Mon. Weather Rev. 2000, 128, 1653–1680. [Google Scholar] [CrossRef] [Green Version]
  20. Reasor, P.D.; Eastin, M.D.; Gamache, J.F. Rapidly intensifying Hurricane Guillermo (1997). Part I: Low-wavenumber structure and evolution. Mon. Weather Rev. 2009, 137, 603–631. [Google Scholar] [CrossRef]
  21. Nguyen, M.C.; Reeder, M.J.; Davidson, N.E.; Smith, R.K.; Montgomery, M.T. Inner-core vacillation cycles during the intensification of Hurricane Katrina. Q. J. R. Meteorol. Soc. 2011, 137, 829–844. [Google Scholar] [CrossRef] [Green Version]
  22. Reif, M.; Reeder, M.J.; Hankinson, M.C.N. Vacillation cycles in WRF simulations of Hurricane Katrina. Aust. Meteor. Oceanogr. J. 2014, 64, 123–131. [Google Scholar] [CrossRef]
  23. Zhang, S.; Qian, Y.; Huang, Y.; Guo, J. Numerical simulation study on the rapid intensification of typhoon Haikui (1211) off the shore of China. J. Trop. Meteorol. 2017, 23, 269–280. [Google Scholar] [CrossRef]
  24. Hong, S.Y.; Dudhia, J.; Chen, S.H. A revised approach to ice microphysical processes for the bulk parameterization of clouds and precipitation. Mon. Weather Rev. 2004, 132, 103–120. [Google Scholar] [CrossRef]
  25. Kain, J.S.; Fritsch, J.M. Convective parameterization for mesoscale models: The Kain-Fritsch scheme. In The Representation of Cumulus Convection in Numerical Models; Emamuel, K.A., Raymond, D.J., Eds.; American Meteorological Society: Boston, MA, USA, 1993; pp. 165–170. [Google Scholar] [CrossRef]
  26. Dudhia, J. Numerical study of convection observed during the Winter Monsoon Experiment using a mesoscale two-dimensional model. J. Atmos. Sci. 1989, 46, 3077–3107. [Google Scholar] [CrossRef]
  27. Mlawer, E.J.; Taubman, S.J.; Brown, P.D.; Lacono, M.J.; Clough, S.A. Radiative transfer for inhomogeneous atmospheres: RRTM, a validated correlated-k model for the longwave. J. Geophys. Res. 1997, 102, 16663–16682. [Google Scholar] [CrossRef] [Green Version]
  28. Neelin, J.D.; Held, I.M. Modeling tropical convergence based on the moist static energy budget. Mon. Weather Rev. 1987, 115, 3–12. [Google Scholar] [CrossRef]
  29. Li, T.; Hsu, P.C. Fundamentals of Tropical Climate Dynamics; Springer: Cham, Switzerland, 2017. [Google Scholar] [CrossRef]
  30. Wang, L.; Li, T.; Maloney, E.; Wang, B. Fundamental Causes of Propagating and Non-propagating MJOs in MJOTF/GASS models. J. Clim. 2017, 30, 3743–3769. [Google Scholar] [CrossRef]
  31. Wu, B.; Zhou, T.J.; Li, T. Atmospheric dynamic and thermodynamic processes driving the western North Pacific anomalous anticyclone during El Niño. Part I: Maintenance mechanisms. J. Clim. 2017, 30, 9621–9635. [Google Scholar] [CrossRef]
  32. Hendricks, E.A.; Montgomery, M.T.; Davis, C.A. The role of ‘‘vortical’’ hot towers in the formation of Tropical Cyclone Diana (1984). J. Atmos. Sci. 2004, 61, 1209–1232. [Google Scholar] [CrossRef] [Green Version]
  33. Montgomery, M.T.; Nicholls, M.E.; Cram, T.A.; Saunders, A.B. A vortical hot tower route to tropical cyclogenesis. J. Atmos. Sci. 2006, 63, 355–386. [Google Scholar] [CrossRef] [Green Version]
  34. Fudeyasu, H.; Wang, Y. Balanced contribution to the intensification of a tropical cyclone simulated in TCM4: Outer-core spinup process. J. Atmos. Sci. 2011, 68, 430–449. [Google Scholar] [CrossRef]
  35. Emanuel, K.A. An air-sea interaction theory for tropical cyclones. Part I: Steady-state maintenance. J. Atmos. Sci. 1986, 43, 585–605. [Google Scholar] [CrossRef]
  36. Rotunno, R.; Emanue, K.A. An air-sea interaction theory for tropical cyclones, Part II: Evolutionary study using a nonhydrostatic axisymmetric numerical model. J. Atmos. Sci. 1987, 44, 542–561. [Google Scholar] [CrossRef] [Green Version]
  37. Pendergrass, A.G.; Willoughby, H.E. Diabatically induced secondary flows in tropical cyclones. Part I: Quasi-steady forcing. Mon. Weather Rev. 2009, 137, 805–821. [Google Scholar] [CrossRef] [Green Version]
  38. Deng, L.-Y.; Li, T. Impact of Background Dynamic and Thermodynamic States on Distinctive Annual Cycle of Near Equatorial Tropical Cyclogenesis over the Western North Pacific. J. Meteorol. Res. 2020, 34, 822–835. [Google Scholar] [CrossRef]
  39. Shou, H.-R.; Li, T.; Sun, Y.; Wang, L.; Liu, J. Decreasing Trend of Western North Pacific Tropical Cyclone Inner-Core Size over the Past Decades. J. Meteorol. Res. 2021, 35, 635–645. [Google Scholar] [CrossRef]
  40. Ma, C.; Li, T. An Empirical Model of Tropical Cyclone Intensity Forecast in the Western North Pacific. J. Meteorol. Res. 2022; 36, in press. [Google Scholar]
Figure 1. WRF nested domain configuration for Typhoon Yutu (2007) simulation. The first domain (d01, black) has 462 × 396 grids, the second domain (d02, blue) has 399 × 399 grids, and the third domain (d03, red) has 450 × 450 grids.
Atmosphere 13 01105 g001
Figure 2. (a) Observed and simulated storm tracks. The numbers in (a) represent the location of TC at 0000 UTC. Temporal evolutions of (b) the TC maximum wind speed (MWS) and (c) minimum sea level pressure (MSLP) in the observation and simulation.
Atmosphere 13 01105 g002aAtmosphere 13 01105 g002b
Figure 3. Temporal evolution of (a) column-integrated MSE (black; 1011 J m−2) and (b) column-integrated kinetic energy (black; 105 J m−2) integrated from surface to 18 km within a radius of 150 km. For comparison, the TC MWS (red; knots) and MSLP (blue; hPa) are also shown.
Atmosphere 13 01105 g003aAtmosphere 13 01105 g003b
Figure 4. Height-radial cross-sections of the change of (a) MSE, (b) C p T , (c) g z , and (d) L v q from hour 24 to hour 48 (units: 103 J).
Atmosphere 13 01105 g004
Figure 5. Height-radial cross-sections of the change of (a) MSE, (b) C p T , (c) g z , and (d) L v q from hour 48 to hour 72 (units: 103 J).
Atmosphere 13 01105 g005
Figure 6. Temporal evolutions of (a) the secondary-circulation stream function index (black; 109 s−1), (b) the secondary-circulation low-level inflow index (black; m s−1, negative represents inflow), the MWS (red; knots), and the MSLP (blue; hPa).
Atmosphere 13 01105 g006
Figure 7. Height-radial cross-sections of the change of azimuthal-mean radial wind (shaded; m s−1) and vertical velocity (contour; m s−1) from hour 24 to hour 48 (i.e., hour 48 minus hour 24) derived from (a) the WRF simulation and (b) the SE equation diagnoses and (c) the change of the diabatic heating field (10−3 K s−1) derived from the WRF model from hour 24 to hour 48.
Atmosphere 13 01105 g007
Figure 8. Height-radial cross-sections of the change of azimuthal-mean radial wind (shaded; m s−1) and vertical velocity (contour; m s−1) from hour 24 to hour 48 (i.e., hour 48 minus hour 24) derived from (a) the WRF simulation and (b) the SE equation diagnoses and (c) the change of the diabatic heating field (10−3 K s−1) derived from the WRF model from hour 48 to hour 72.
Atmosphere 13 01105 g008
Figure 9. Height-radial cross-sections of azimuthal-mean diabatic heating (10−3 K s−1) at (a) hour 24, (b) hour 48, and (c) hour 72. Horizontal distributions of the azimuthal-mean diabatic heating field averaged between 6 km to 8 km at (d) hour 24, (e) hour 48, and (f) hour 72, respectively.
Atmosphere 13 01105 g009
Figure 10. The change of (a) the stream function index (109 s−1) and (b) the low-level inflow index (m s−1, absolute value) derived based on the SE equation in response to the total diabatic heating, the inner heating, and the outer heating shown in Figure 8c.
Atmosphere 13 01105 g010
Table 1. Contributions to the total derivative of the column-integrated MSE d m / d t from hour 24 to hour 48 by different terms, long wave radiation L W , short wave radiation S W , latent heat flux L H , and sensible heat flux S H averaged between hour 24 and hour 48 (unit: 103 W m−2).
d m / d t L W S W L H S H
4.33−1.050.324.220.85
Table 2. Contributions to the total derivative of the column-integrated MSE d m / d t from hour 24 to hour 48 by different terms, long wave radiation L W , short wave radiation S W , latent heat flux L H , and sensible heat flux S H averaged between hour 48 and hour 72 (unit: 103 W m−2).
d m / d t L W S W L H S H
3.22−1.570.333.580.89
Publisher’s Note: MDPI stays neutral with regard to jurisdictional claims in published maps and institutional affiliations.

