Article

Microphysical Analysis of Precipitation in the Central and Eastern Margins of the Tibetan Plateau

1
Plateau Atmosphere and Environment Key Laboratory, Chengdu Plain Urban Meteorology and Environment Observation and Research Station, School of Atmospheric Sciences Chengdu, University of Information Technology, Chengdu 610225, China
2
Zhuzhou Meteorological Bureau, Zhuzhou 412000, China
3
State Key Laboratory of Tibetan Plateau Earth System, Resources and Environment (TPESRE), Land-Atmosphere Interaction and Its Climatic Effects Group, Institute of Tibetan Plateau Research, Chinese Academy of Sciences, Beijing 100101, China
4
College of Earth and Planetary Sciences, University of Chinese Academy of Sciences, Beijing 100049, China
5
College of Atmospheric Science, Lanzhou University, Lanzhou 730000, China
6
National Observation and Research Station for Qomolongma Special Atmospheric Processes and Environmental Changes, Dingri 858200, China
7
Kathmandu Center of Research and Education, Chinese Academy of Sciences, Beijing 100101, China
8
China-Pakistan Joint Research Center on Earth Sciences, Chinese Academy of Sciences, Islamabad 45320, Pakistan
9
Key Laboratory of Land Surface Process and Climate Change in Cold and Arid Regions, Chinese Academy of Sciences, Lanzhou 730000, China
*
Author to whom correspondence should be addressed.
Atmosphere 2022, 13(7), 1082; https://doi.org/10.3390/atmos13071082
Submission received: 28 April 2022 / Revised: 24 June 2022 / Accepted: 27 June 2022 / Published: 8 July 2022
(This article belongs to the Special Issue Land-Atmosphere Interaction on the Tibetan Plateau)

Abstract

:
Through the observation and study of the raindrop spectrum, we can not only explore the evolution law of precipitation but also understand the microphysical characteristics of different types of precipitation clouds. This paper uses the raindrop spectrum data observed at Naqu Station, Yushu Station, Linzhi Station, and Emei Mount Station, as well as cloud radar data in the Yushu region in the Tibetan Plateau. Raindrop spectral characteristics are studied, and the raindrop size distribution (DSD) characteristics of the four stations are analyzed. The results are as follows: (1) The overall raindrop spectral concentration of the four stations decreases with the increase in particle size after the peak value. The downtrend is most gentle at the peak. (2) All rain intensity levels show the characteristics of multiple vertices. At Linzhi Station, Naqu Station and Yushu Station, the particles with a diameter of <1 mm contributed the most to the precipitation rate, while the particles with a diameter of <1 mm at Emei Mount Station contributed the least to the precipitation rate. (3) The precipitation in the central and eastern margins of the Tibetan Plateau is dominated by small and medium-sized particles, accounting for 95–99% of the precipitation particle number concentration. (4) The raindrop spectra of the three types of precipitation clouds at the four sites are all cumulonimbus precipitation Cumulonimbus in the uppermost layer, stratiform cloud precipitation stratiform cloud in the lowermost layer, and mixed cloud precipitation stratiform cloud in between. (5) Cloud radar analysis of precipitation structure shows that cumulonimbus and mixed clouds develop vigorously, and the highest cloud height can reach 13 km, but the average precipitation duration of mixed clouds is shorter than that of cumulonimbus; stratiform clouds develop relatively smoothly, with cloud heights of 6–7 km, the average precipitation duration is the shortest.

1. Introduction

As the plateau with the highest altitude and the most complex terrain in the world, the Tibetan Plateau occupies a quarter of China’s land area [1,2,3,4]. Due to many factors, the microphysical processes of clouds and precipitation on the Tibetan Plateau are quite different from other regions [5,6,7,8]. Although great progress has been made in numerical weather models on the Tibetan Plateau in recent years, the reliability of numerical simulations is limited to a certain extent due to the complex terrain of the plateau and the lack or limited availability of meteorological observation data. By observing the microscopic process of cloud precipitation on the plateau, we can deeply understand the microphysical mechanism of the formation of plateau precipitation and the relationship between precipitation and environmental elements, which can improve the parameterization of the model cloud physical process, thereby further improving the utility and level of numerical forecasting [9,10,11,12].
In the process of falling from the cloud to the surface, raindrops will go through complex microphysical processes such as Collision, Coalescence, Breakup (CCB process), as well as complex external factors such as Evaporation, Turbulence and drop sorting, which often have certain impacts on the size distribution of raindrops [13]. The raindrop spectrum is usually used to describe the relationship between the number of raindrops of different sizes in a unit volume and the diameter of the raindrops, which is a basic precipitation microphysical quantity. By studying the spectral characteristics of raindrops, the precipitation process, evolution law and characteristics can be analyzed, which has a certain reference value for in-depth research on the microphysical process of precipitation and precipitation forecasting. Physical characteristics study the spectral distribution characteristics of precipitation and raindrops in different regions and then provide important parameters in cloud microphysics parameterization scheme, radar quantitative precipitation prediction and artificial weather modification. [14].
In recent years, many scholars throughout the world have studied the raindrop spectrum. As early as 1948, Marshall et al. [15] found that the raindrop spectrum presents a negative exponential distribution, that is, the Marshall-Palmer(M-P) distribution model. Gong et al. [16] used the summer precipitation data obtained by the GBPP-100 laser ground-based raindrop spectrometer in Shenyang, China, to analyze the characteristics of the raindrop spectrum, and obtained the difference between the average raindrop spectral widths of the three types of precipitation clouds; Mario et al. [17] used the Gamma fitting method and two maximum approximation methods to fit and analyze the precipitation data in the Chilbolton area of the UK; Bringi et al. [18] studied the microphysical characteristics of different precipitation types in different climatic regions around the world, and found that the characteristics of layered precipitation in different climatic regions are not very different, and convective cloud precipitation can be divided into the continental convective type and oceanic convective type according to different raindrop spectral characteristics. Liu [19] found that small raindrops give a great contribution to the rain intensity of stratiform precipitation in Chengdu, China, through the study of the spectral characteristics of raindrops in Chengdu, and the rain intensity of cumulus precipitation is mainly caused by large raindrops.
Regarding the research on the fitting distribution of the raindrop spectrum, Zhang et al. [13] studied the parameter characteristics of the precipitation raindrop spectrum fitting model in Nanjing, China, using the improved Gamma distribution based on the observation data of the raindrop spectrum in Nanjing and found that there is a good dichotomy between μ and λ; Yu et al. [12] using the precipitation data of the ground-based laser raindrop spectrometer in Nagqu, Tibet Autonomous Region, China, and using the M-P fitting and Gamma fitting methods, it is obtained that the rain intensity contribution of the three types of cloud precipitation comes from the large raindrop spectrum (that is, raindrops with a diameter greater than 1 mm) contribute. Mehta Shyam [20] used medium-range micro-rain radar (MRR–2) observations to obtain measurements of raindrop size distribution (DSD) with height and rain velocity, and a new Gamma raindrop size distribution (DSD) model is proposed. Different DSD models such as exponential distribution, lognormal distribution and Gamma distribution were used to fit the observed data. It is found that the fitting results have the characteristics of Gamma DSD whether it is a low-order moment or a high–order moment.
Due to the diverse types of rainfall clouds and the uncertain factors in their generation and distribution, the research work is more complicated and vast. Generally, the precipitation type is divided into convective cloud or stratiform precipitation cloud system, which can improve the accuracy of remote sensing measurement of precipitation. Pan et al. [21] found that the summer precipitation in the plateau is dominated by deep convection (67.8%), followed by shallow precipitation (26.4%), and the smallest is deep and strong convective precipitation (5.8%); in Yang et al. [22] the second precipitation in the Fenyang area of Shanxi, China, was analyzed. According to the Doppler radar echo intensity of Taiyuan Station, Z (the radar echo intensity) < 25 dBZ was judged as stratiform precipitation, and Z > 35 dBZ was judged as convective cloud precipitation.
According to current international research, the physical process of cloud precipitation in the plateau area is mainly studied from two aspects: weather analysis and statistics and numerical simulation experiments. For typical weather cases, conventional observation data, reanalysis data and satellite data are used. Due to the high altitude and harsh natural conditions in the plateau area, there is a lack of observational data on the physical process of plateau cloud precipitation and a lack of effective high-resolution data. There are few studies on the micro–parameter characteristics and the refined structure of plateau cloud precipitation, and the classification of plateau cloud precipitation. The research is limited, far from meeting the requirements of scientific research and practical applications, and the research and analysis on the characteristics of the raindrop spectrum in the Tibetan Plateau are mainly concentrated in the central and southern parts of the Tibetan Plateau. In this paper, according to the structural characteristics of clouds in the actual precipitation process and the raindrop spectrum data obtained from the actual measurement, the data are divided into five rain intensity levels and three types of cloud precipitation: stratiform, cumulonimbus and mixed cloud precipitation to analyze the ground raindrop spectrum data. This paper expects to obtain the spectral characteristics of raindrops and the microphysical process of precipitation in the central and eastern margins of the plateau.

2. Materials and Methods

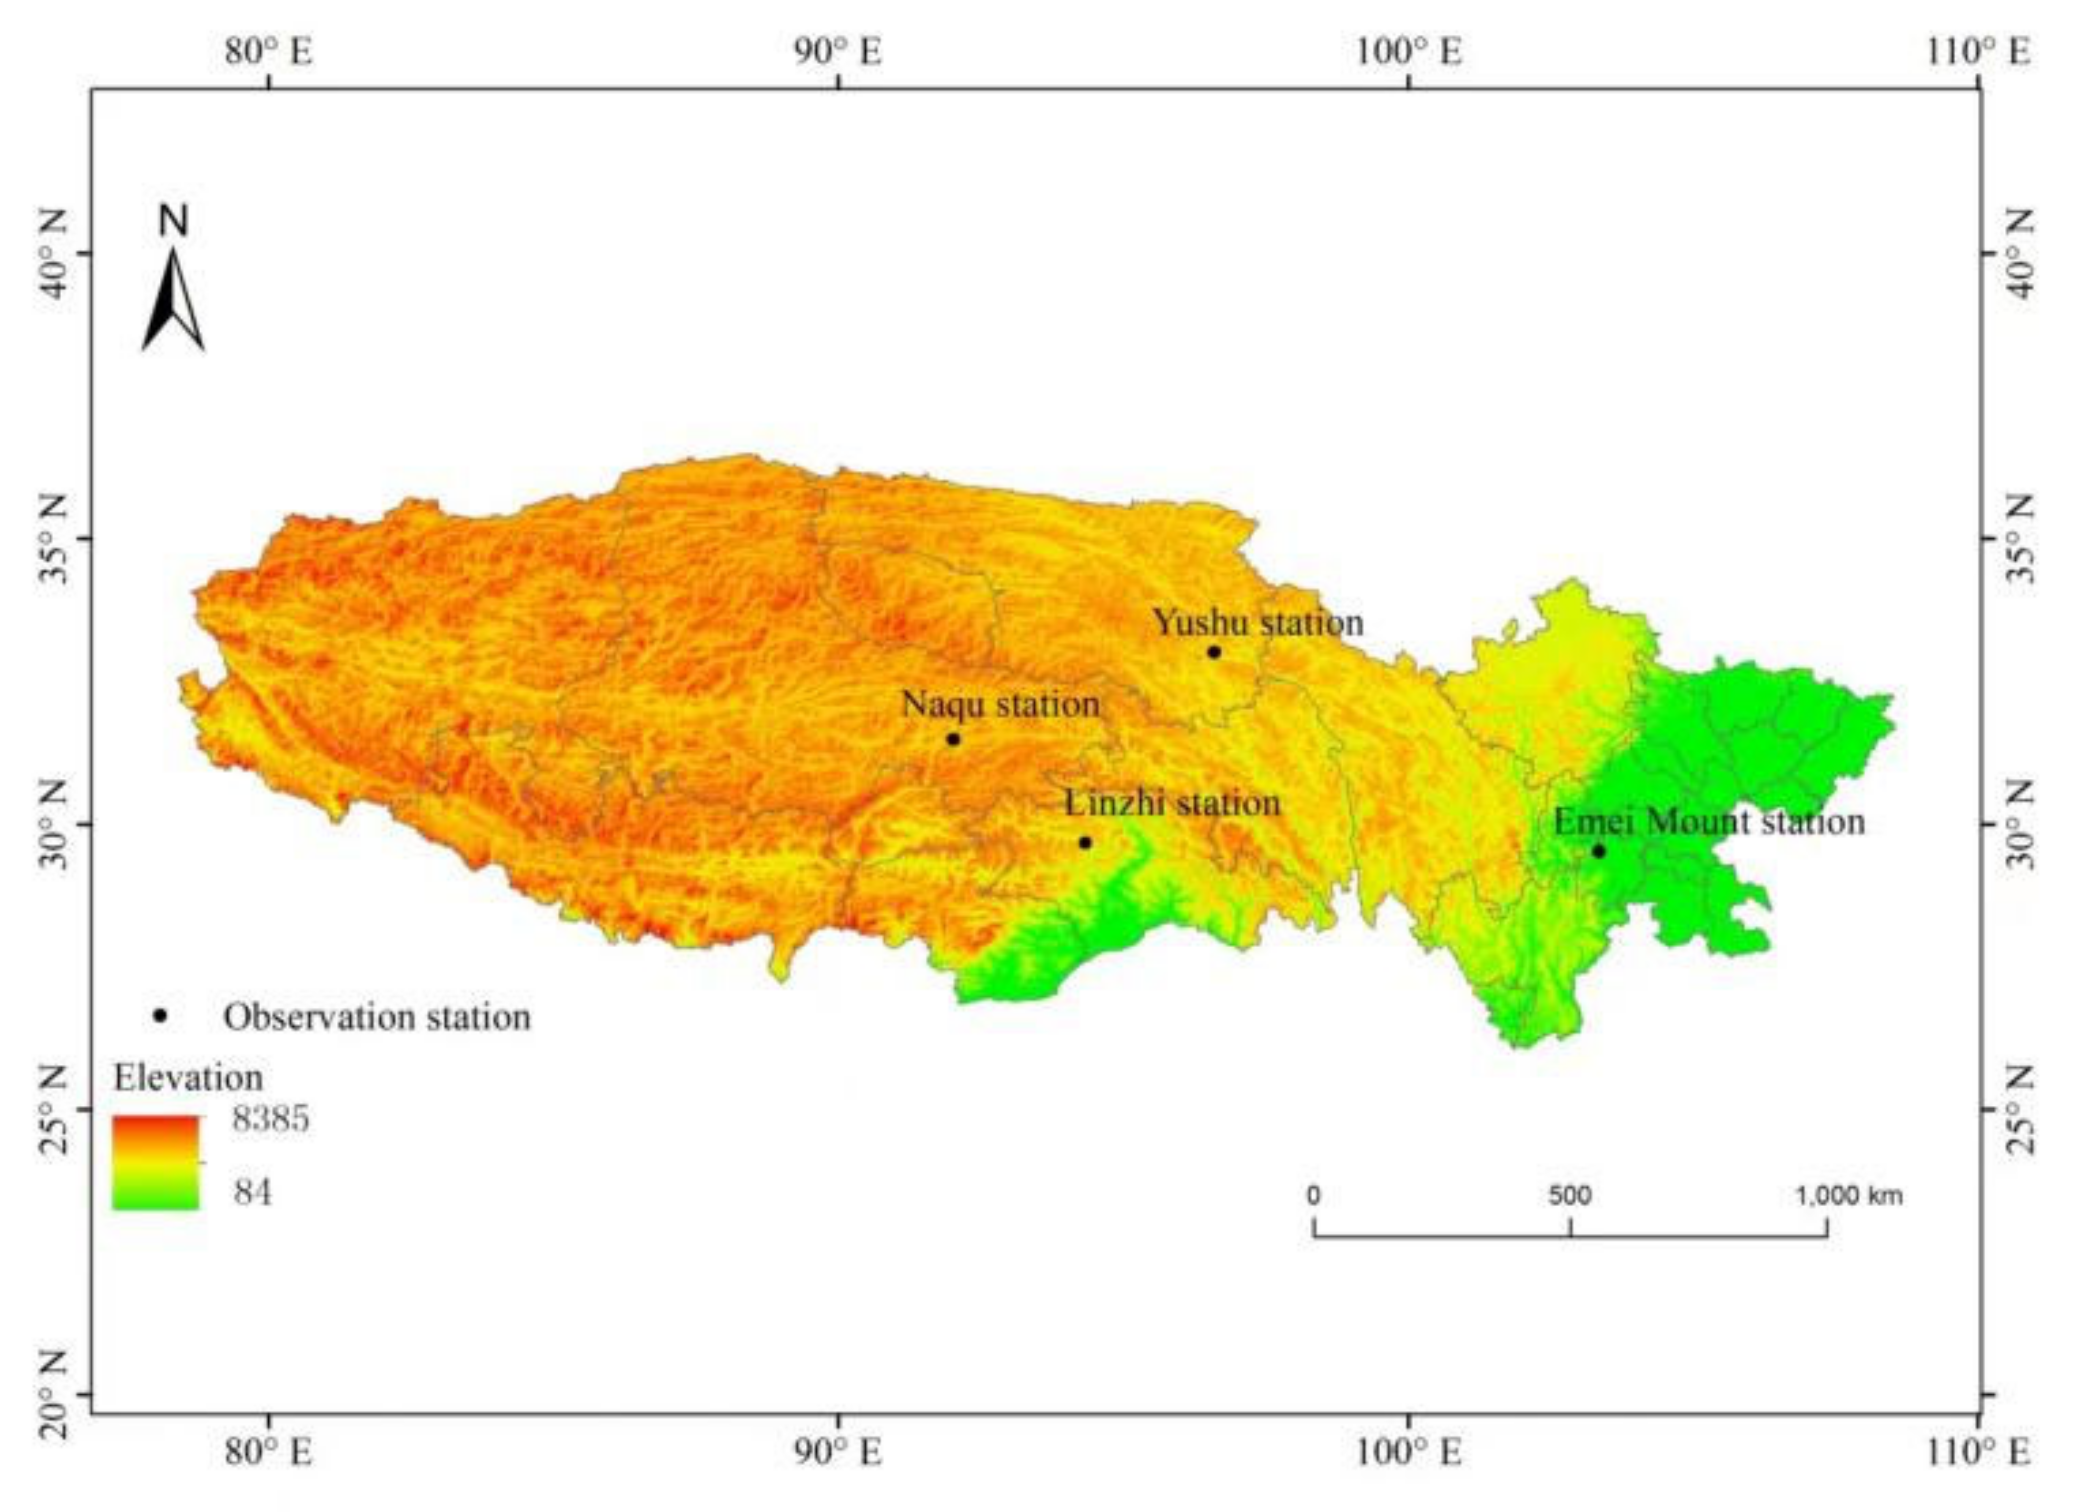
2.1. Site Introduction

Raindrop spectrum data from 9 July to 31 August 2019 at Yushu City Meteorological Bureau, Qinghai (33.00° N, 96.58° E, altitude: 3744 m), 12 July to 31 August 2019 at Naqu Meteorological Bureau (31.48° N, 92.01° E, altitude: 4507 m), 1 July to 1 September 2021 at Linzhi Observatory (29.4° N, 94.2° E, altitude: 2992 m), 1 July to 15 August 2021 at the Emei Mount Atmospheric and Environmental Comprehensive Observation and Experiment Station of Chengdu University of Information Technology(29.52° N, 103.34° E, altitude: 937 m). The observation sites are shown in Figure 1.
The radar data is the Ka–band millimeter–wave cloud radar data observed at the Yushu City Meteorological Bureau (33.00° N, 96.58° E, altitude: 3744 m) from 2 July to 31 August 2019. During the observation period from mid to late July to August in the Yushu area of Qinghai, the cumulative rainfall of 70 precipitations measured by the raindrop spectrum was 4488 mm. By averaging the raindrop spectra of 70 sample precipitations, the average data of 1 min of each precipitation process is obtained (Figure 2). The average value of a single precipitation measured by the raindrop spectrometer is 1.80 mm, and the average value of the maximum value of a single rainfall is 2.89 mmh−1, of which the average rainfall intensity value in July was 2.32 mmh−1, and the average rainfall intensity value in August was 2.72 mmh−1. It shows that the rainfall in the Yushu area is small, the duration is short, and the rainfall frequency is high.

2.2. Data Sources and Instrument Introduction

The raindrop spectrum data comes from the PS–32 laser raindrop spectrometer developed by Huachuang Fengyun, which can not only measure the size and flow rate of rainfall particles but also classify the rain particles in solid and liquid phases with an accuracy of 95%. The data has a total of 32 diameter channels and 32 velocity channels, the particle diameter measurement value is 0.2–25 mm, and the particle velocity measurement value is 0.2–20 m·s−1.
The radar data comes from the Ka-band millimeter–wave cloud radar, which has a detection height of 30 m to 15 km, a detection time resolution of 5 s, and a vertical resolution of 30 m. The radar adopts all–solid–state, all–coherent Doppler, and pulse compression, which can stably obtain detection data during long–term observations.

2.2.1. Classification of Precipitation Types

The distribution of the raindrop spectrum is affected by many factors, including collision, fragmentation, evaporation, spontaneous growth, updraft, downdraft, horizontal shear, etc. The classification of cloud types is mainly based on satellite cloud maps, radar echoes and information obtained from ground-based meteorological stations. In the classification, the cloud types are firstly classified into stratiform clouds and cumulus clouds by the difference in cloud shape, and then the cumulus clouds are distinguished from cumulonimbus clouds by using the characteristics of satellite cloud maps and radar echo maps, and the cumulonimbus clouds are screened manually. Since radar echoes with intensity less than 10 dBZ contribute almost nothing or very little to precipitation, radar echoes with intensity less than 10 dBZ are considered as non-precipitation type radar echoes and are ignored [12]. For information larger than 60 dBZ, it is treated as 60 dBZ because the contribution of a few large raindrops to Z (radar reflectivity) is much larger than the contribution to I (rain intensity). Cumuliform mixed clouds refer to convective clouds (or convective bubbles) embedded in the middle of large deep stratus clouds, while cumulonimbus clouds are mainly produced by low-level air convective activity. The radar reflectivity factor Z > 35 dBZ is cumulonimbus precipitation, Z < 30 dBZ is stratiform cloud precipitation, and between 30 and 35 dBZ is mixed cloud precipitation.

2.2.2. Classification of Rain Intensity Grades

Previous studies have found that the raindrop spectrum changes not only with time and space but also with rain intensity [23,24,25]. In order to understand the characteristics of the raindrop spectrum in the central and eastern regions of the Tibetan Plateau, the raindrop spectrum data of Yushu Station, Naqu Station, Linzhi Station and Emei Mount Station were divided into five rain intensity levels: (a) <1 mmh−1, (b) 1–3 mmh−1, (c) 3–10 mmh−1, (d) 10–20 mmh−1, (e) >20 mmh−1.

2.2.3. Research Methods

Since there are few precipitation particles with a diameter greater than 8 mm in nature, the data with a diameter greater than 8 mm are excluded in this paper. The data actually measured by the raindrop spectrometer is expressed as the number of precipitation particles Aij corresponding to the average diameter Di (1 ≤ I ≤ 32) and the final falling velocity Vj (1 ≤ j ≤ 32). The total number of precipitation particles corresponding to unit volume N(Di) can be expressed as:
N D i = j = 1 32 A ij V j × T × S
In the formula, N(Di) refers to the number concentration of raindrop particles per unit volume per unit size interval. T is the sampling period of the raindrop spectrum, T = 60 s. S is the sampling area of the raindrop spectrum, S = 54 cm2. Therefore, some precipitation parameters, such as total particle density N0, radar reflectivity factor Z (mm6m−3) and rainfall intensity R (mmh−1) can be derived in turn, and the calculation formula is as follows:
N 0 = D i = 0 D max N D i
Z = i = 1 32 N D i D i 6 Δ D i
R = 6 π 10 4 i = 1 32 j = 1 32 N D i D i 3 V j Δ D i
The parameterization of the raindrop spectrum can describe the change of the natural precipitation particle concentration with the diameter through a mathematical model, and the raindrop spectrum model can well describe the shape of the raindrop spectrum distribution. The exponential model is the M–P distribution and the Gamma distribution, and the expression of the Gamma distribution model is as follows:
N D = N 0 D μ exp λ D
In the formula, N(D)(m−3mm−1) refers to the raindrop number concentration of the raindrop diameter D(mm), N0 is the intercept parameter, λ(mm−1) is the slope parameter, which reflects the size of the particles in the precipitation process. Distribution changes; μ (dimensionless) is a shape parameter that reflects the shape of the fitting curve. When μ > 0, the fitting curve curves upward with the diameter, and when μ < 0, the fitting curve curves downward with the diameter, and when μ = 0, which is a negative exponential distribution function M–P distribution function.

3. Results

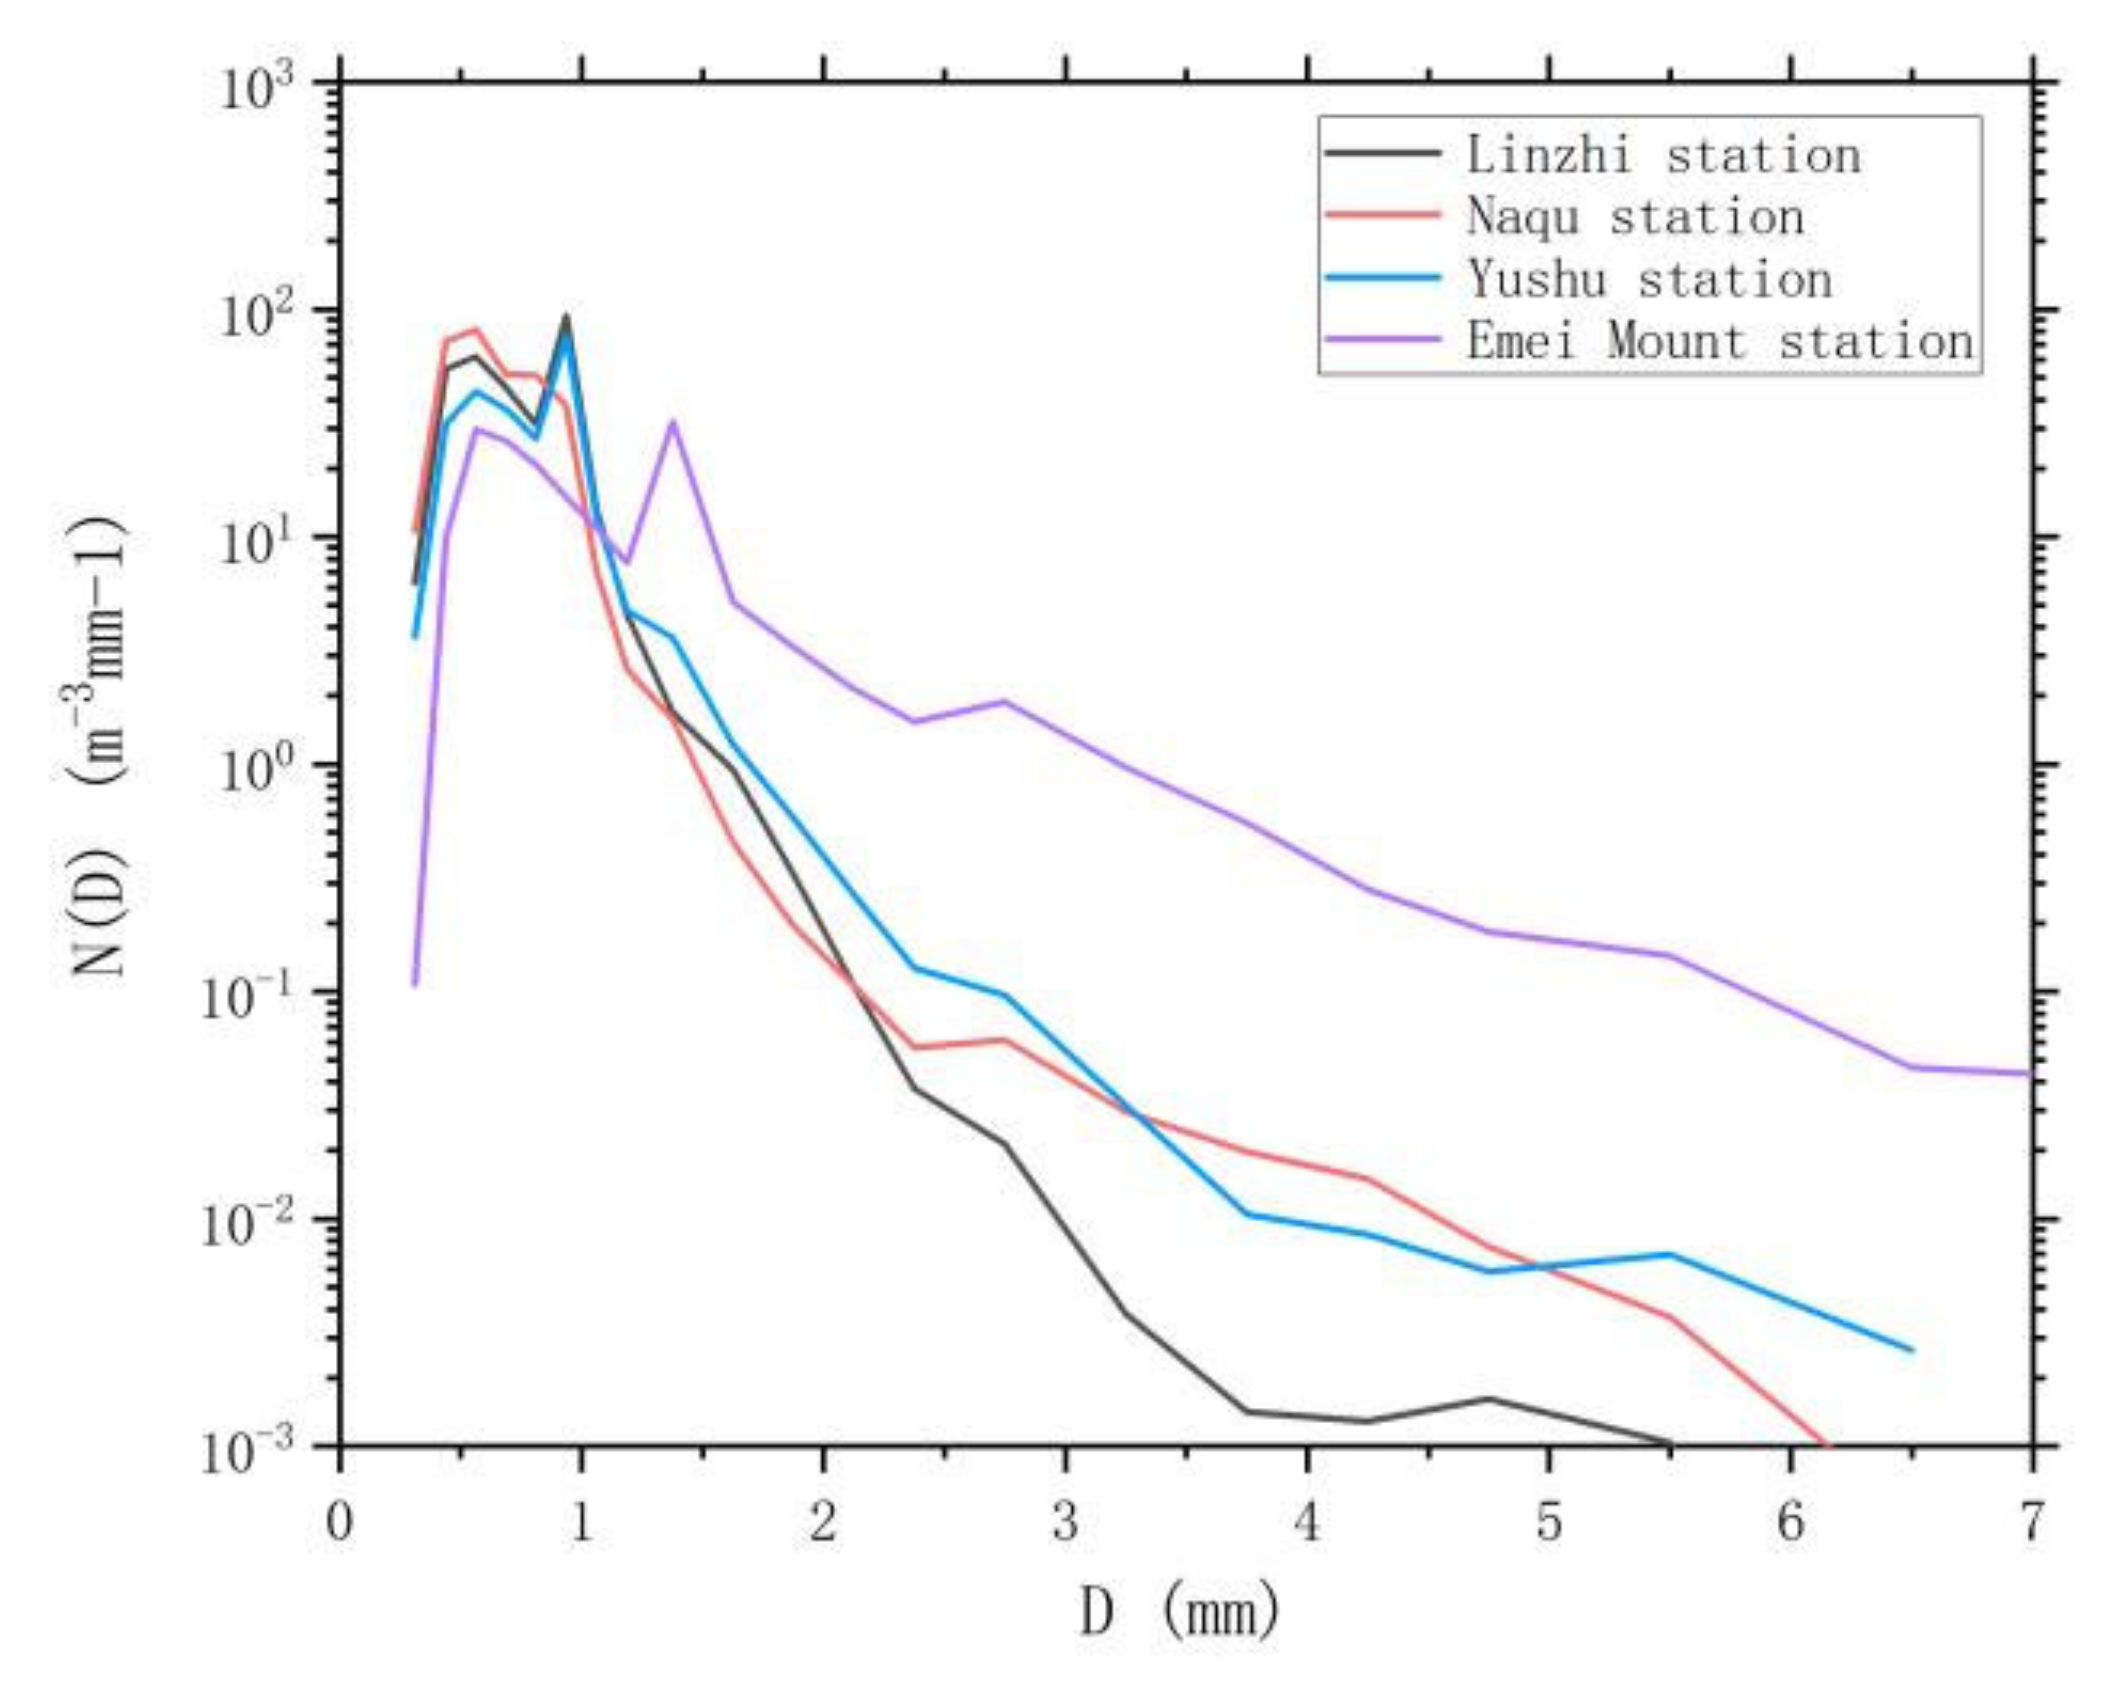
3.1. Raindrop Spectral Distribution

Figure 3 shows the spectral concentration distribution of raindrops at each site. When the particle size is less than 1.3 mm, the raindrop spectral concentration of Naqu Station is the largest among the four stations with the same particle size, the raindrop spectral concentration of Emei Mount Station is the smallest, and the concentration of Linzhi station is the second, and the concentration of Yushu station is the third. When the particle size is in the range of 1.3 mm–2.2 mm, the Emei Mount station has the largest raindrop spectral concentration among the four stations with the same particle size, Nagqu station has the smallest raindrop spectral concentration, Yushu Station is second, and Linzhi Station is third. When the particle size is in the range of 2.2 mm–5.5 mm, the concentration of Linzhi station is the smallest at the same particle size. The spectra of the four stations all showed a multi-peak structure, the peak of Linzhi station was the largest, and the peak of Emei Mount station was the smallest. The peak defined in this article actually refers to the maximum value, which is larger than the adjacent front and rear values, which is called the peak value. The overall raindrop spectral concentration decreased with the increase in particle size after the peak. The raindrop spectral concentration of Linzhi Station had the most obvious downward trend with the increase in particle size after the peak and the higher the concentration, the wider the spectrum. When the particle size of the raindrops at Linzhi Station is 6.23 mm, the distribution of the raindrop spectral concentration is very small. The raindrop spectral concentrations at Naqu Station and Yushu Station have no distribution after the particle size is 6.5 mm. Therefore, the concentration of macroparticles at lower altitudes is greater than that at high altitudes, and the number of small particles at high altitudes is higher than that at lower altitudes.

3.2. Spectral Distribution of Raindrops with Different Rain Intensities

Raindrop Spectral Concentration Distribution with Different Rain Intensity Levels

Figure 4 shows that the precipitation intensity at Linzhi Station is relatively small, with no precipitation exceeding 20 mmh1. There is only one precipitation with a rating of 10 mmh1–20 mmh1. When the particle size is greater than 1.5 mm, the spectral concentration of raindrops at Linzhi Station is at the same particle size, and the concentration of raindrops with a rain intensity level of 10 mmh1–20 mmh1 is the largest; after the raindrop spectral concentration of the station is larger than 2.523 mm, the raindrop spectral concentration of the same particle size with a rain intensity level of >20 mmh1 is the largest, and the greater the rain intensity, the greater the concentration; the raindrop spectral concentration of the Emei Mount Station is under the same particle diameter, rain intensity grade >20 mmh1 raindrop spectral concentration is the largest, <1 mmh1 raindrop spectral concentration is the smallest. Raindrop spectral concentration at Linzhi Station, Naqu Station and Yushu Station reached the maximum peak at the particle size of 0.937 mm, and the corresponding rain intensity levels were 1 mmh−1–3 mmh−1 and 3 mmh1–10 mmh1, respectively. The maximum peak value of Emei Mount Station is when the particle size is 1.375 mm, and the rain intensity level is >20 mmh1. All rain intensity levels exhibit the characteristics of multiple vertices, which may be because higher melt layers result in longer raindrops falling, resulting in more raindrop collisions, and fragmentation, increasing the number of vertices in the spectrum [26]. After the apex, with the increase in raindrop size, the raindrop spectral concentration values of the four stations decreased. Among the four stations, the spectral concentration of raindrops with a rain intensity level >20 mmh1 has the most gentle trend with particle size, which is due to the fact that at higher altitudes, the raindrops have larger particle size and lower air density during heavy precipitation.

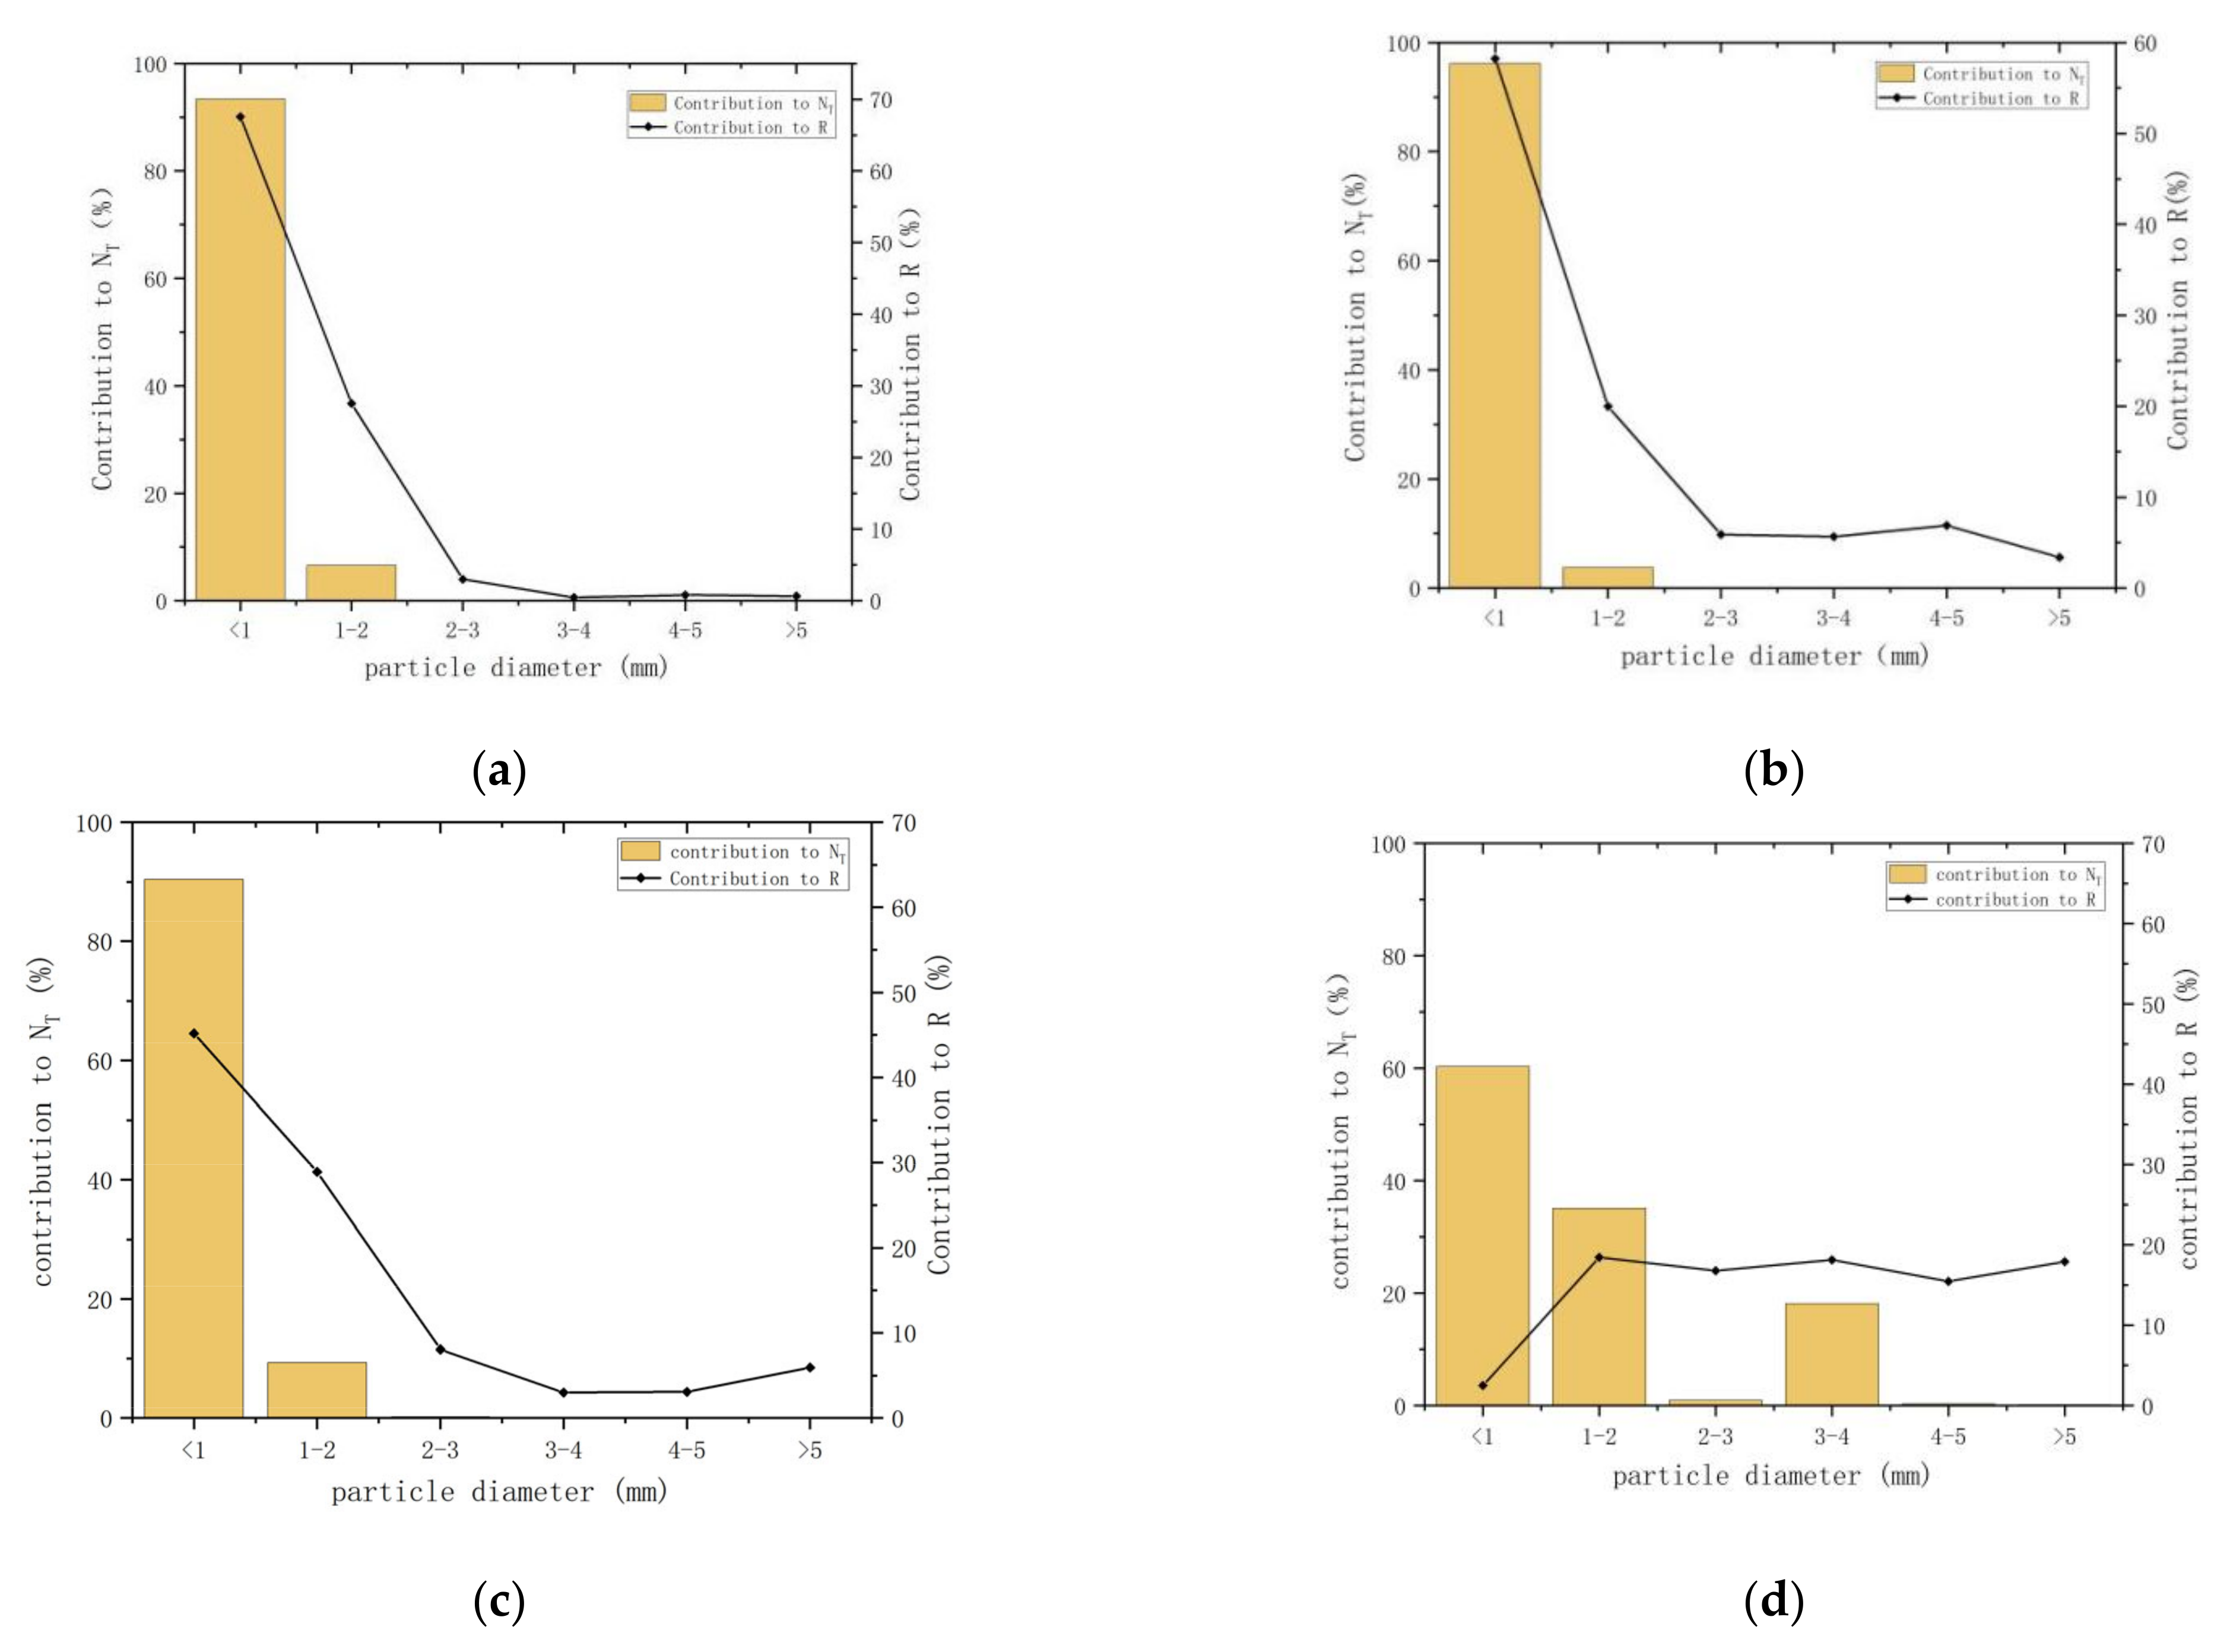
3.3. Distribution and Contribution of Raindrop Size at Four Stations

The distribution of raindrop diameters and their relative contributions to the precipitation rate and concentration in the eastern slope and eastern margin of the Tibetan Plateau are shown in Figure 5. The raindrop spectral data observed at the four stations are divided into six grades according to the diameter of the raindrops, which are <1 mm, 1–2 mm, 2–3 mm, 3–4 mm, 4–5 mm and >5 mm. It can be seen from the figure that among the particle diameter grades of the four stations, the particles with a diameter of <1 mm contributed the most to the total concentration, accounting for up to 96% of the maximum particle number concentration. Particles with a diameter of 1–2 mm in Linzhi Station and Yushu Station did not contribute more than 10%, but contributed 27%, 20%, and 29% to the precipitation rate, respectively. The four stations are dominated by the contribution of small particles, Linzhi Station, Naqu Station and Yushu Station have the largest contribution to the precipitation rate by the particles with a diameter of <1 mm, while the particles with a diameter of <1 mm at Emei Mount Station contribute to the precipitation rate. The contribution to the precipitation rate is mainly the particles of the other five diameter grades. This is because the number of large particles at Emei Mount Station is larger, and the contribution of particles with a diameter of <1 mm to the precipitation rate is not obvious. In general, the precipitation in the eastern slope and eastern margin of the Tibetan Plateau is mainly composed of small and medium particles, accounting for 95–99% of the precipitation particle number concentration 73–94%.

3.4. Microphysical Characteristics of Different Types of Cloud Precipitation

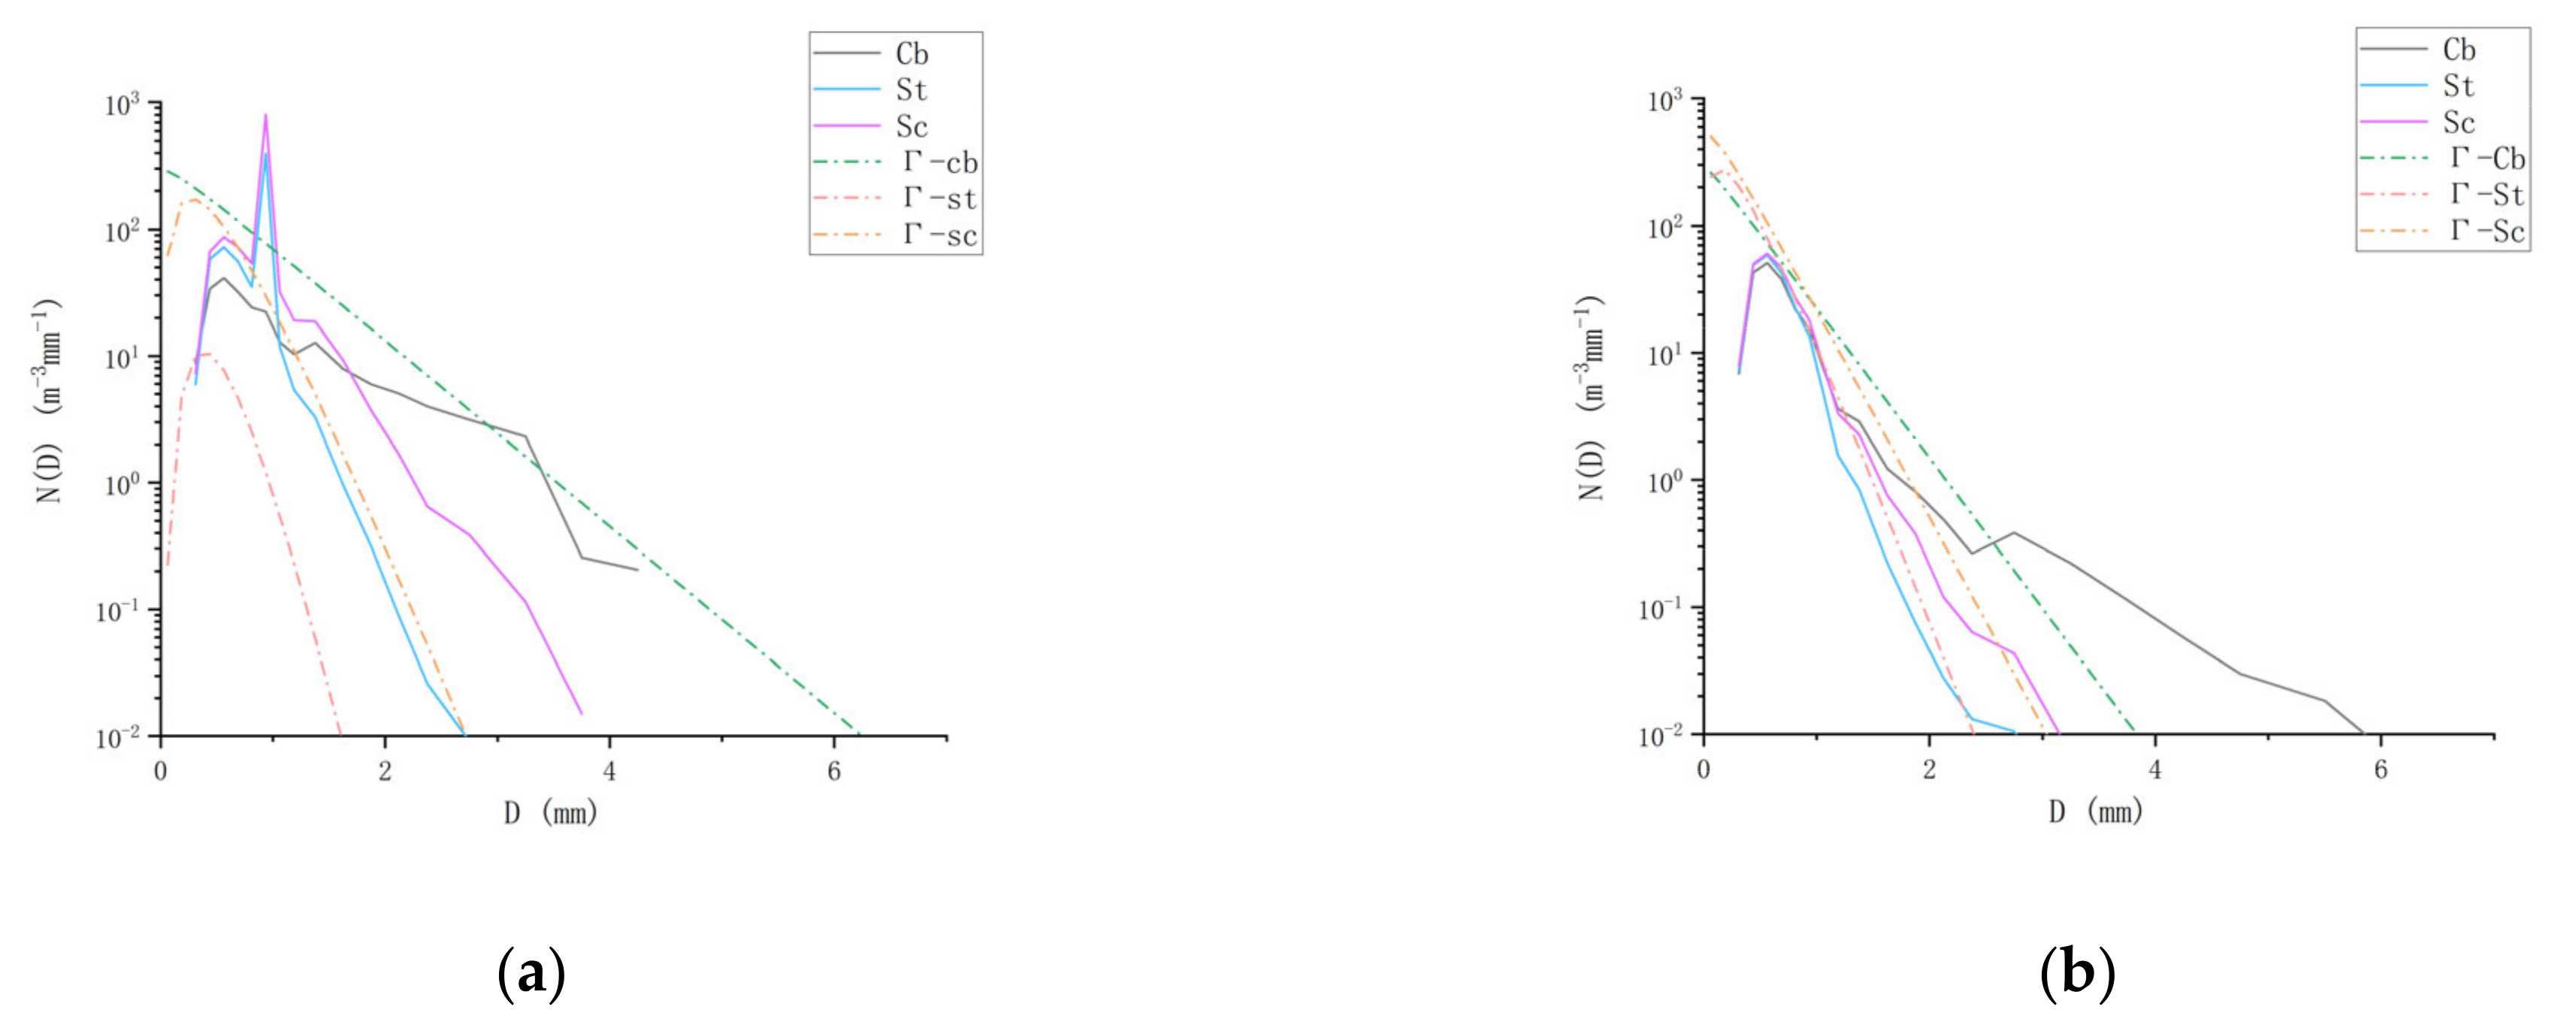
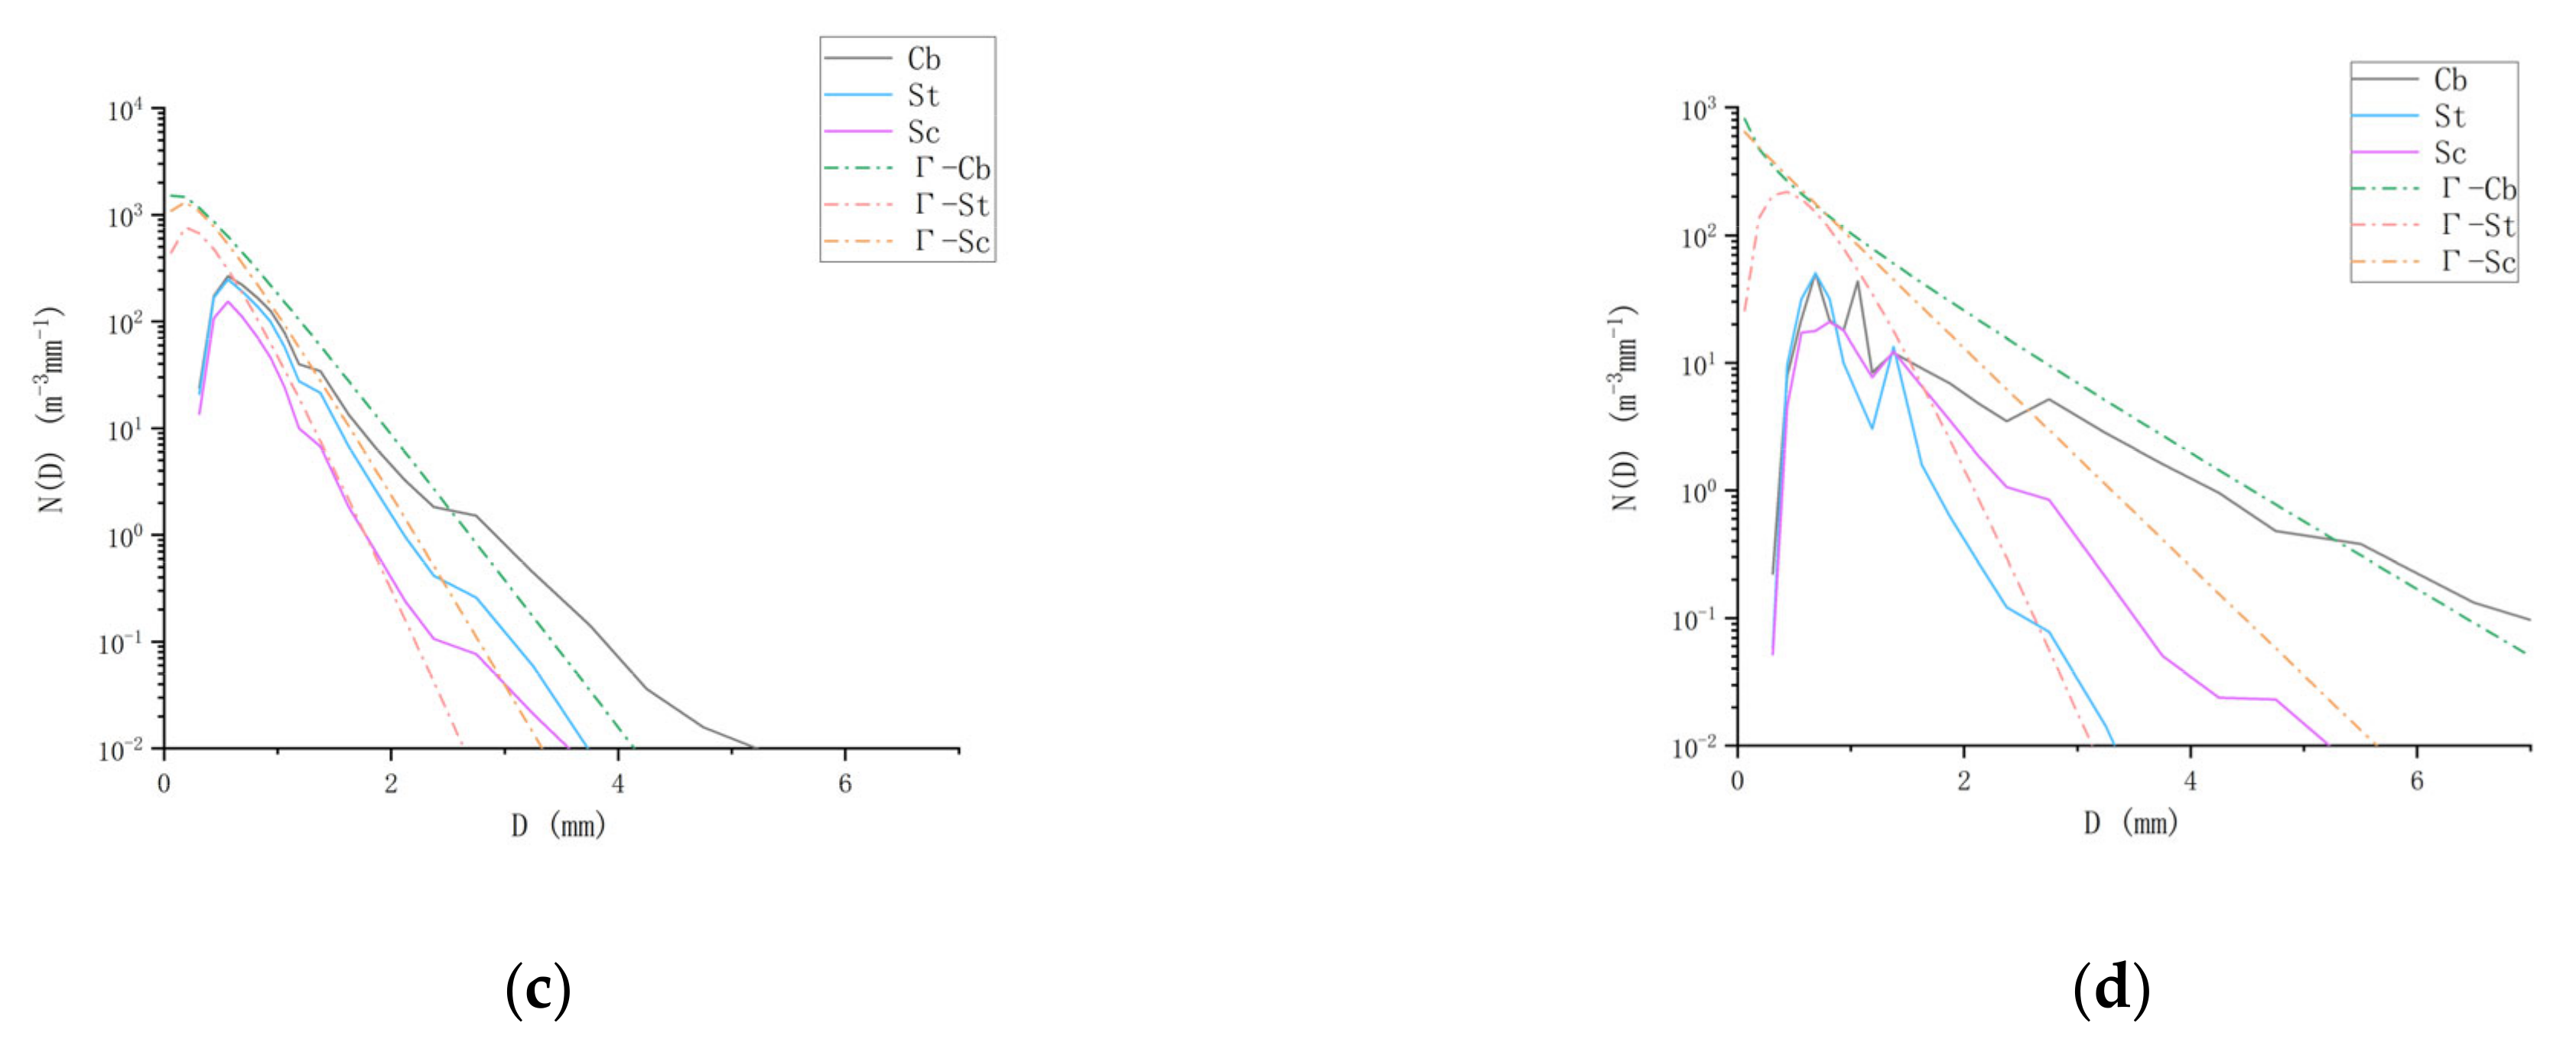
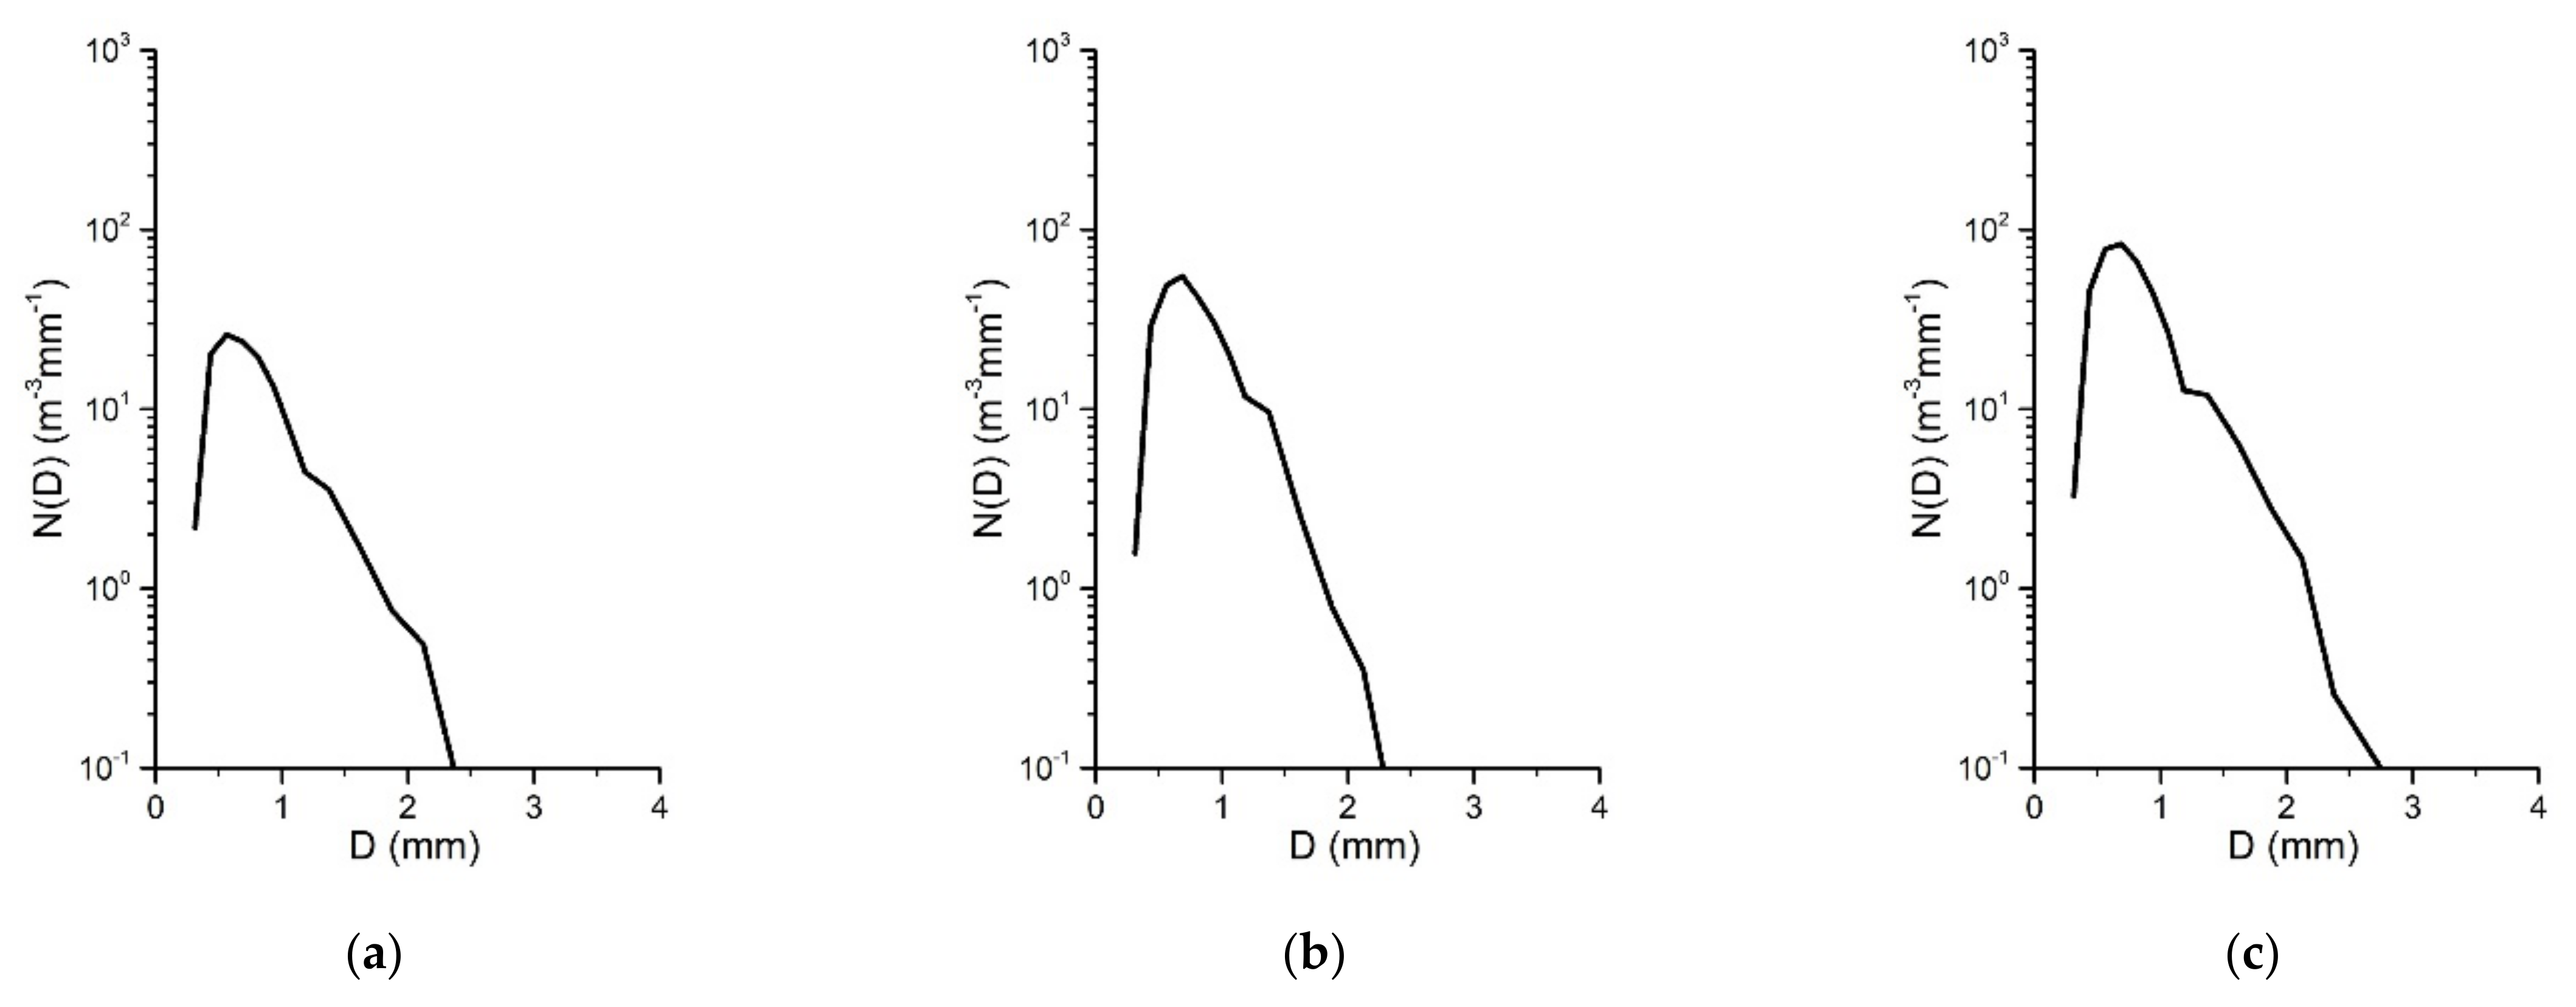
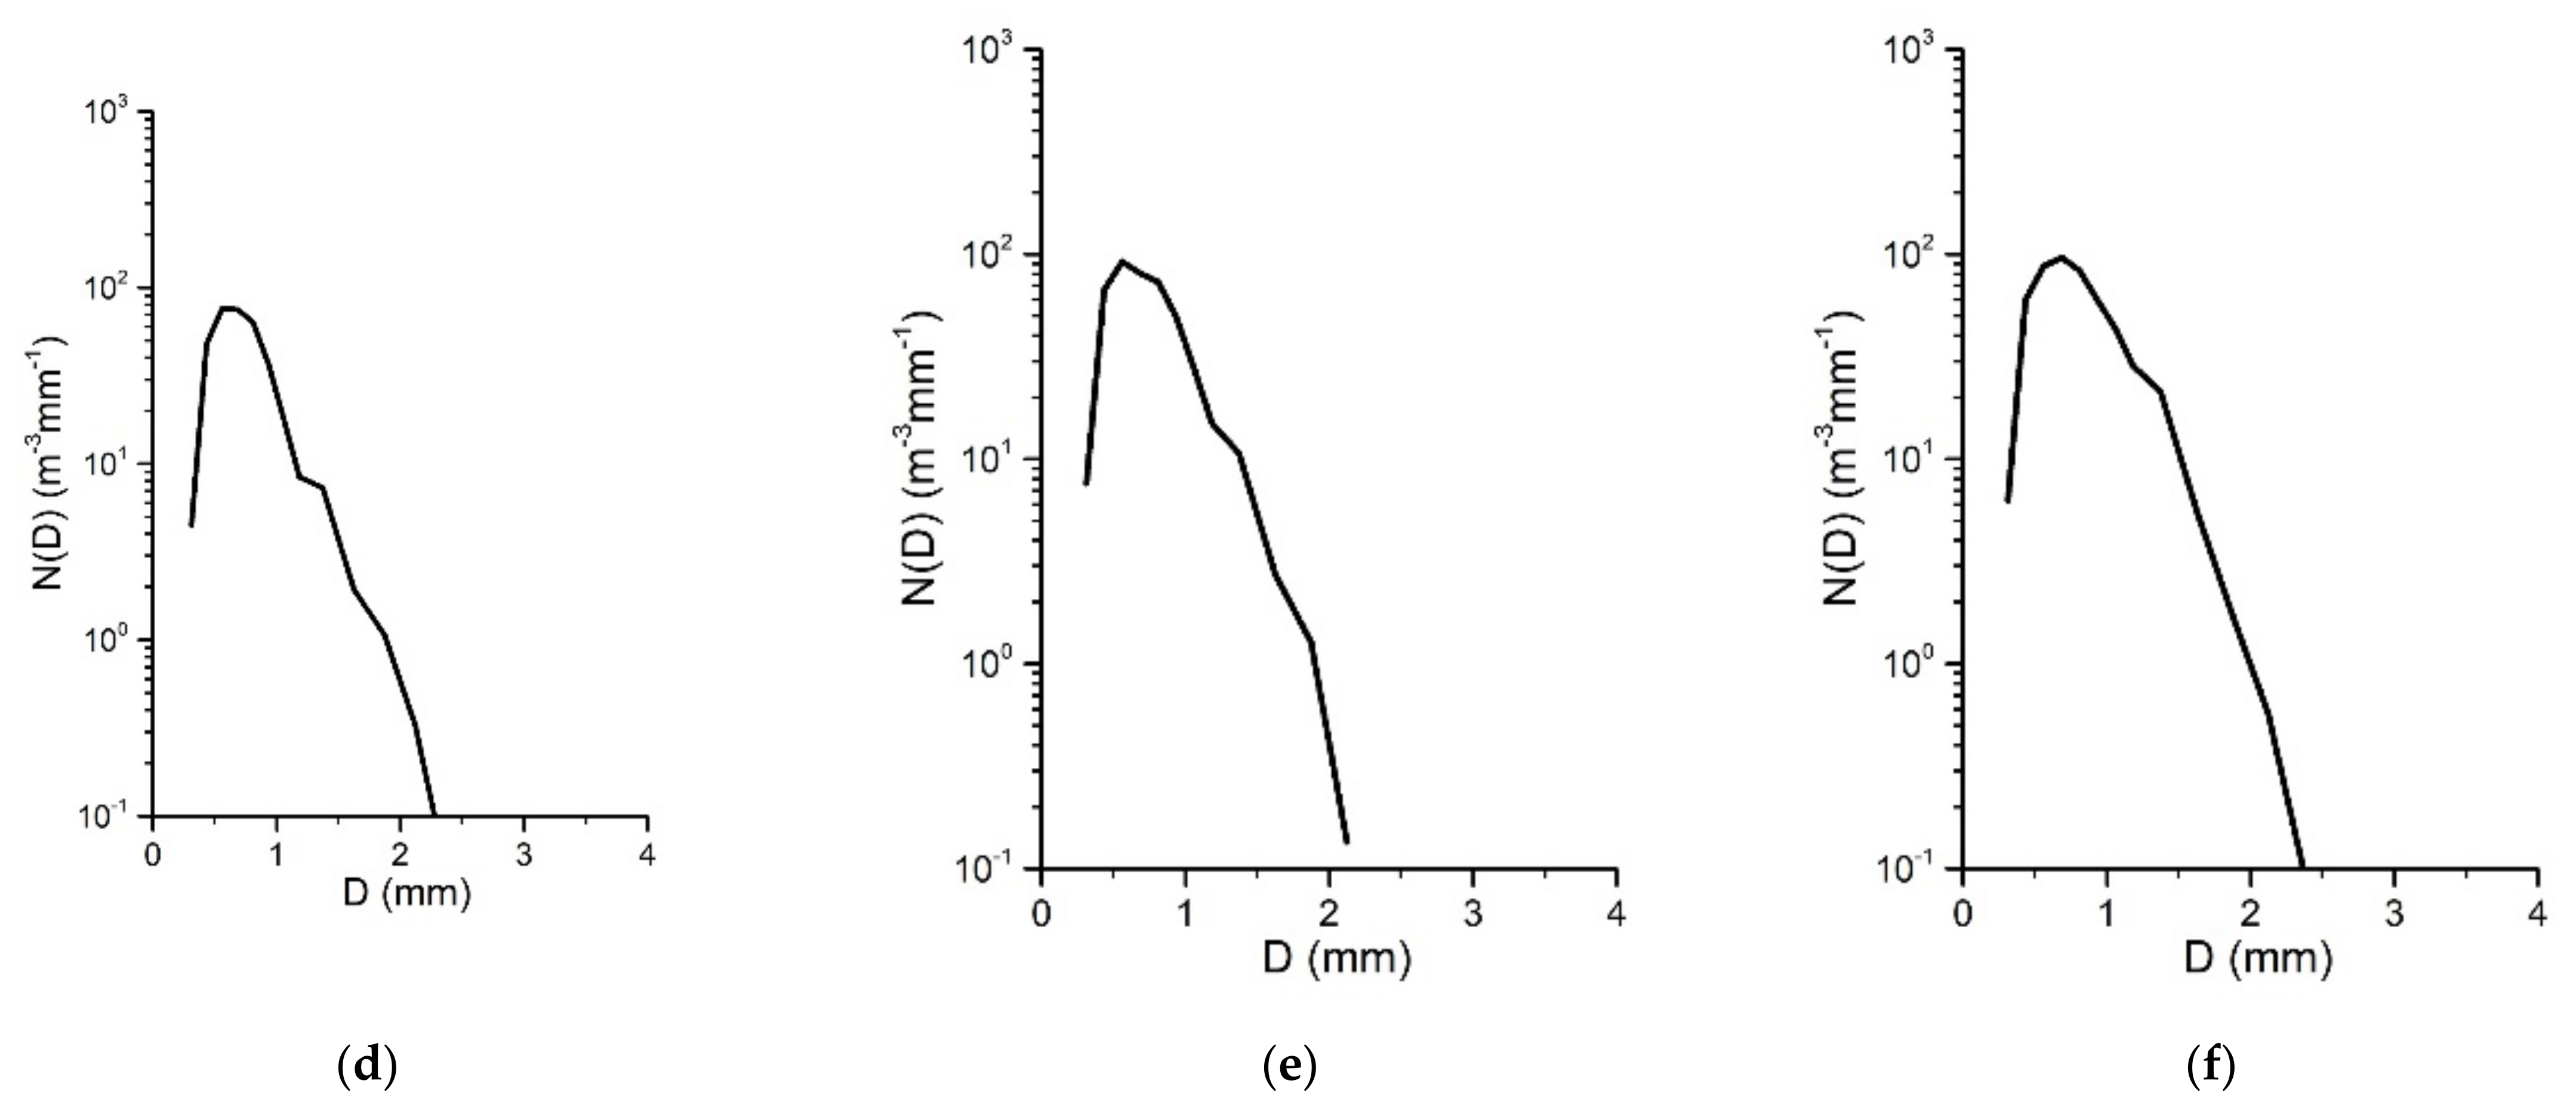
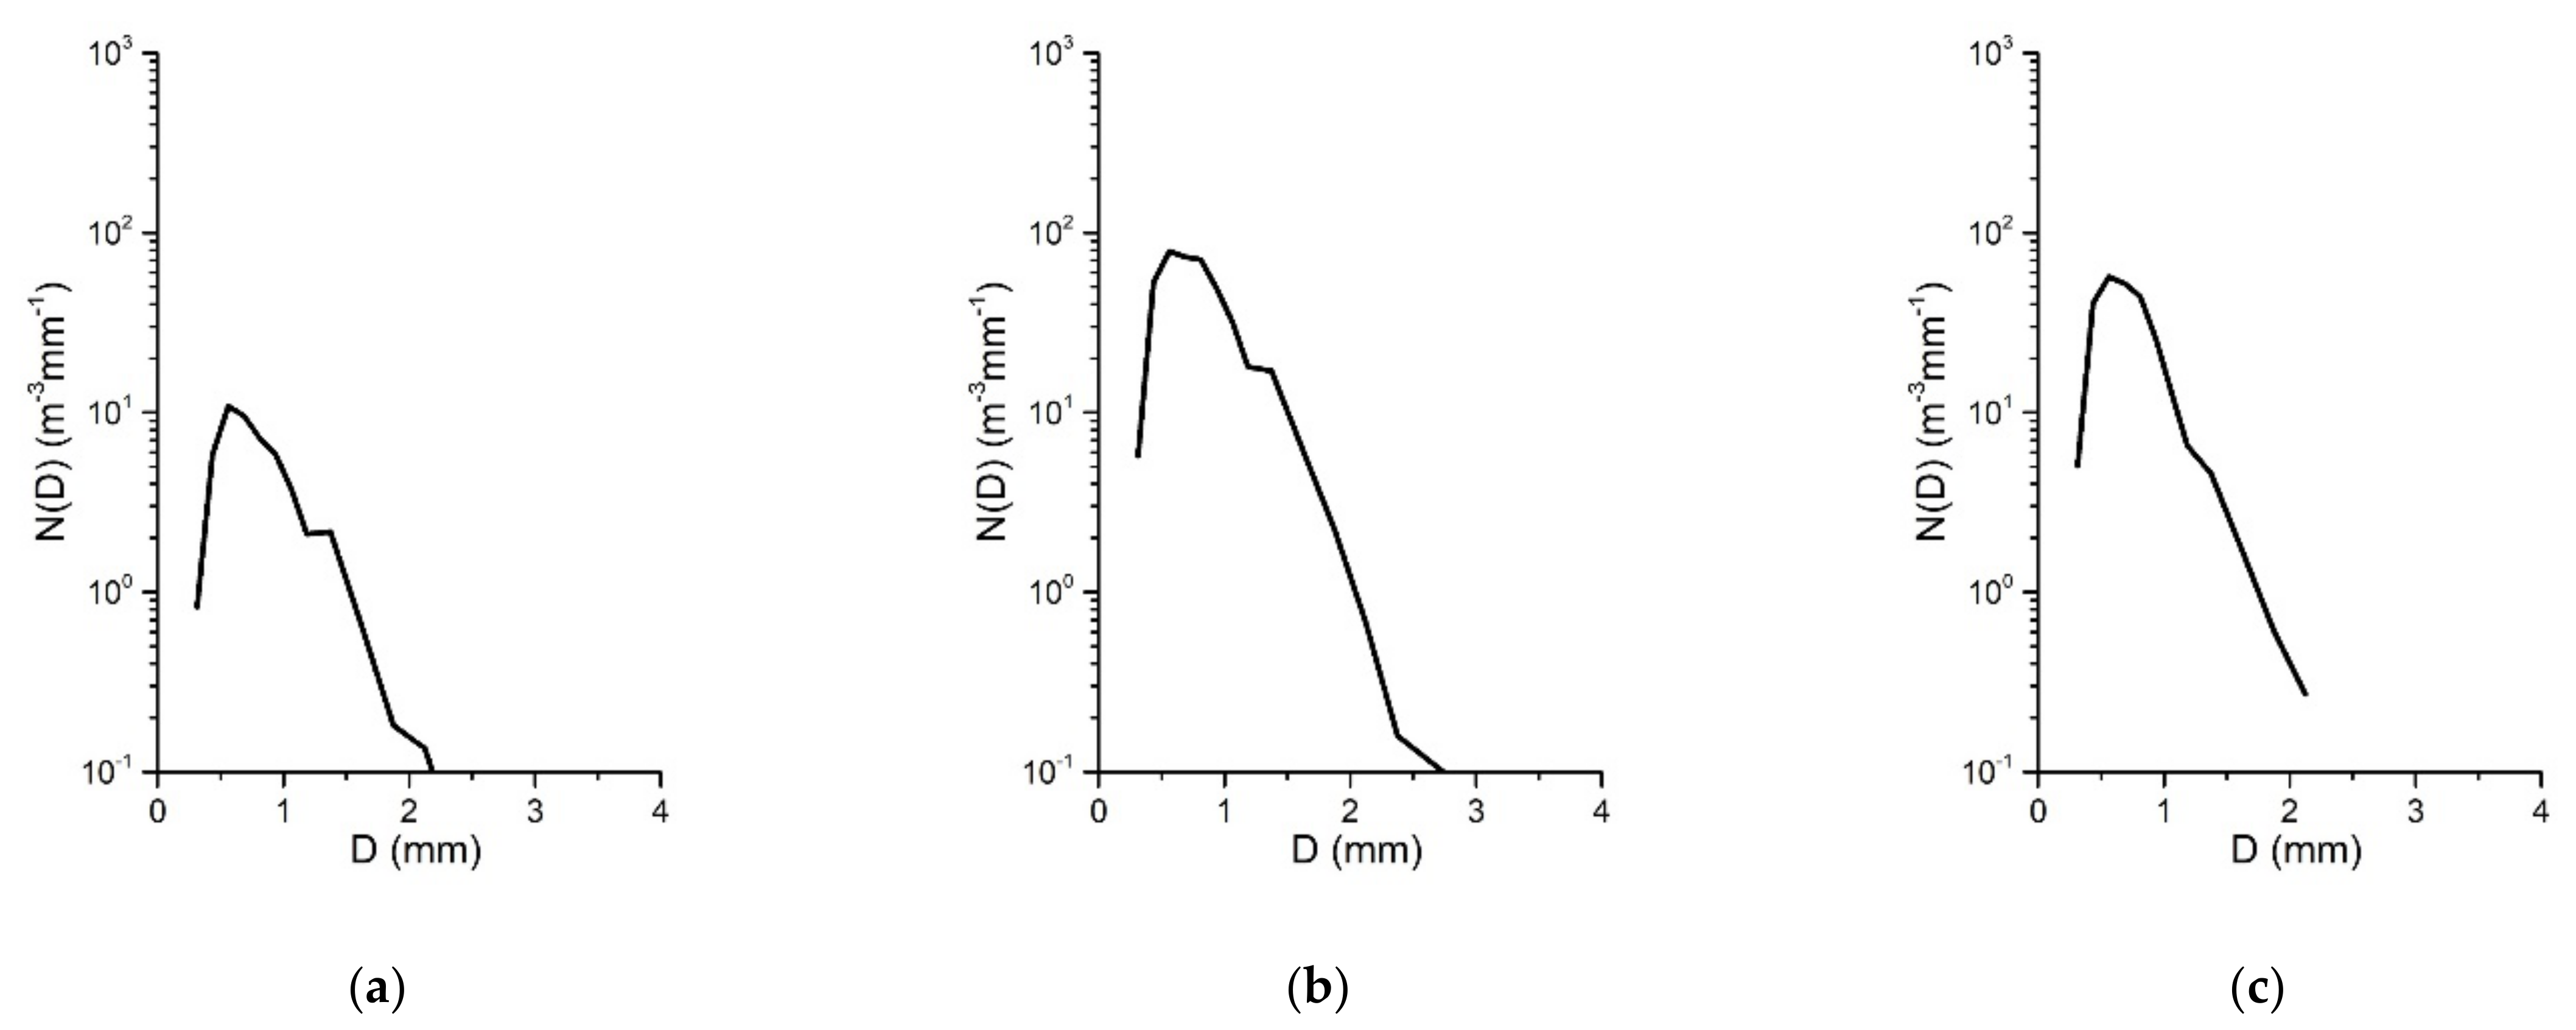
3.4.1. Spectral Distribution of Raindrops in Different Types of Cloud Precipitation

Table 1 shows the proportions of the three types of cloud precipitation samples at the four stations. Linzhi Station, Naqu Station and Emei Mount Station have the largest proportion of stratiform cloud precipitation samples, and Yushu Station has the largest proportion of cumulonimbus precipitation samples. The station has the largest number of cumulonimbus precipitation samples, followed by Mount Emei station. Figure 6 shows the distribution changes of three types of precipitation cloud and raindrop spectra at four sites. When the particle size is greater than 1.875 mm, the raindrop spectra of the four stations are that the cumulonimbus precipitation Cb is in the uppermost layer, the stratiform cloud precipitation St is in the lowermost layer, and the mixed cloud precipitation Sc is in between. It shows that when the particle size is greater than 1.875mm, the raindrop spectral concentrations of the four sites are in the same particle size order: Cb > Sc > St, and the larger the concentration, the wider the spectral width. The spectral concentrations of raindrops at Linzhi Station, Yushu Station and Nagqu Station are significantly larger than those at Emei Mount Station, indicating that the summer precipitation cloud activity in the plateau region is stronger than that in the eastern edge of the plateau. The spectra of the three types of cloud precipitation in the Yushu area all show a single peak shape, the peak is located at about 0.562 mm, and the maximum raindrop sizes of the three types of cloud precipitation in the Yushu area are 5.2 mm, 3.7 mm and 3.5 mm, respectively. The raindrop spectra of the three types of cloud precipitation at Linzhi Station, Emei Mount Station and the cumulonimbus precipitation at Naqu Station are multi-peak structures. The peak of the raindrop spectrum can reflect the instability of precipitation, and the multi–peak structure of the spectrum reflects most of the precipitation process. All have instability [27]. When the particle size of the three types of precipitation clouds at Emei Mount Station is about 1.375 mm, the falling velocity of the particle size decreases suddenly, resulting in the peak concentration here. The decreasing trend of raindrop spectral concentration in the large droplet section at the four stations becomes smaller with the increase in particle size, which may be related to the collision and merging of small raindrops or the fragmentation of large raindrops when falling.

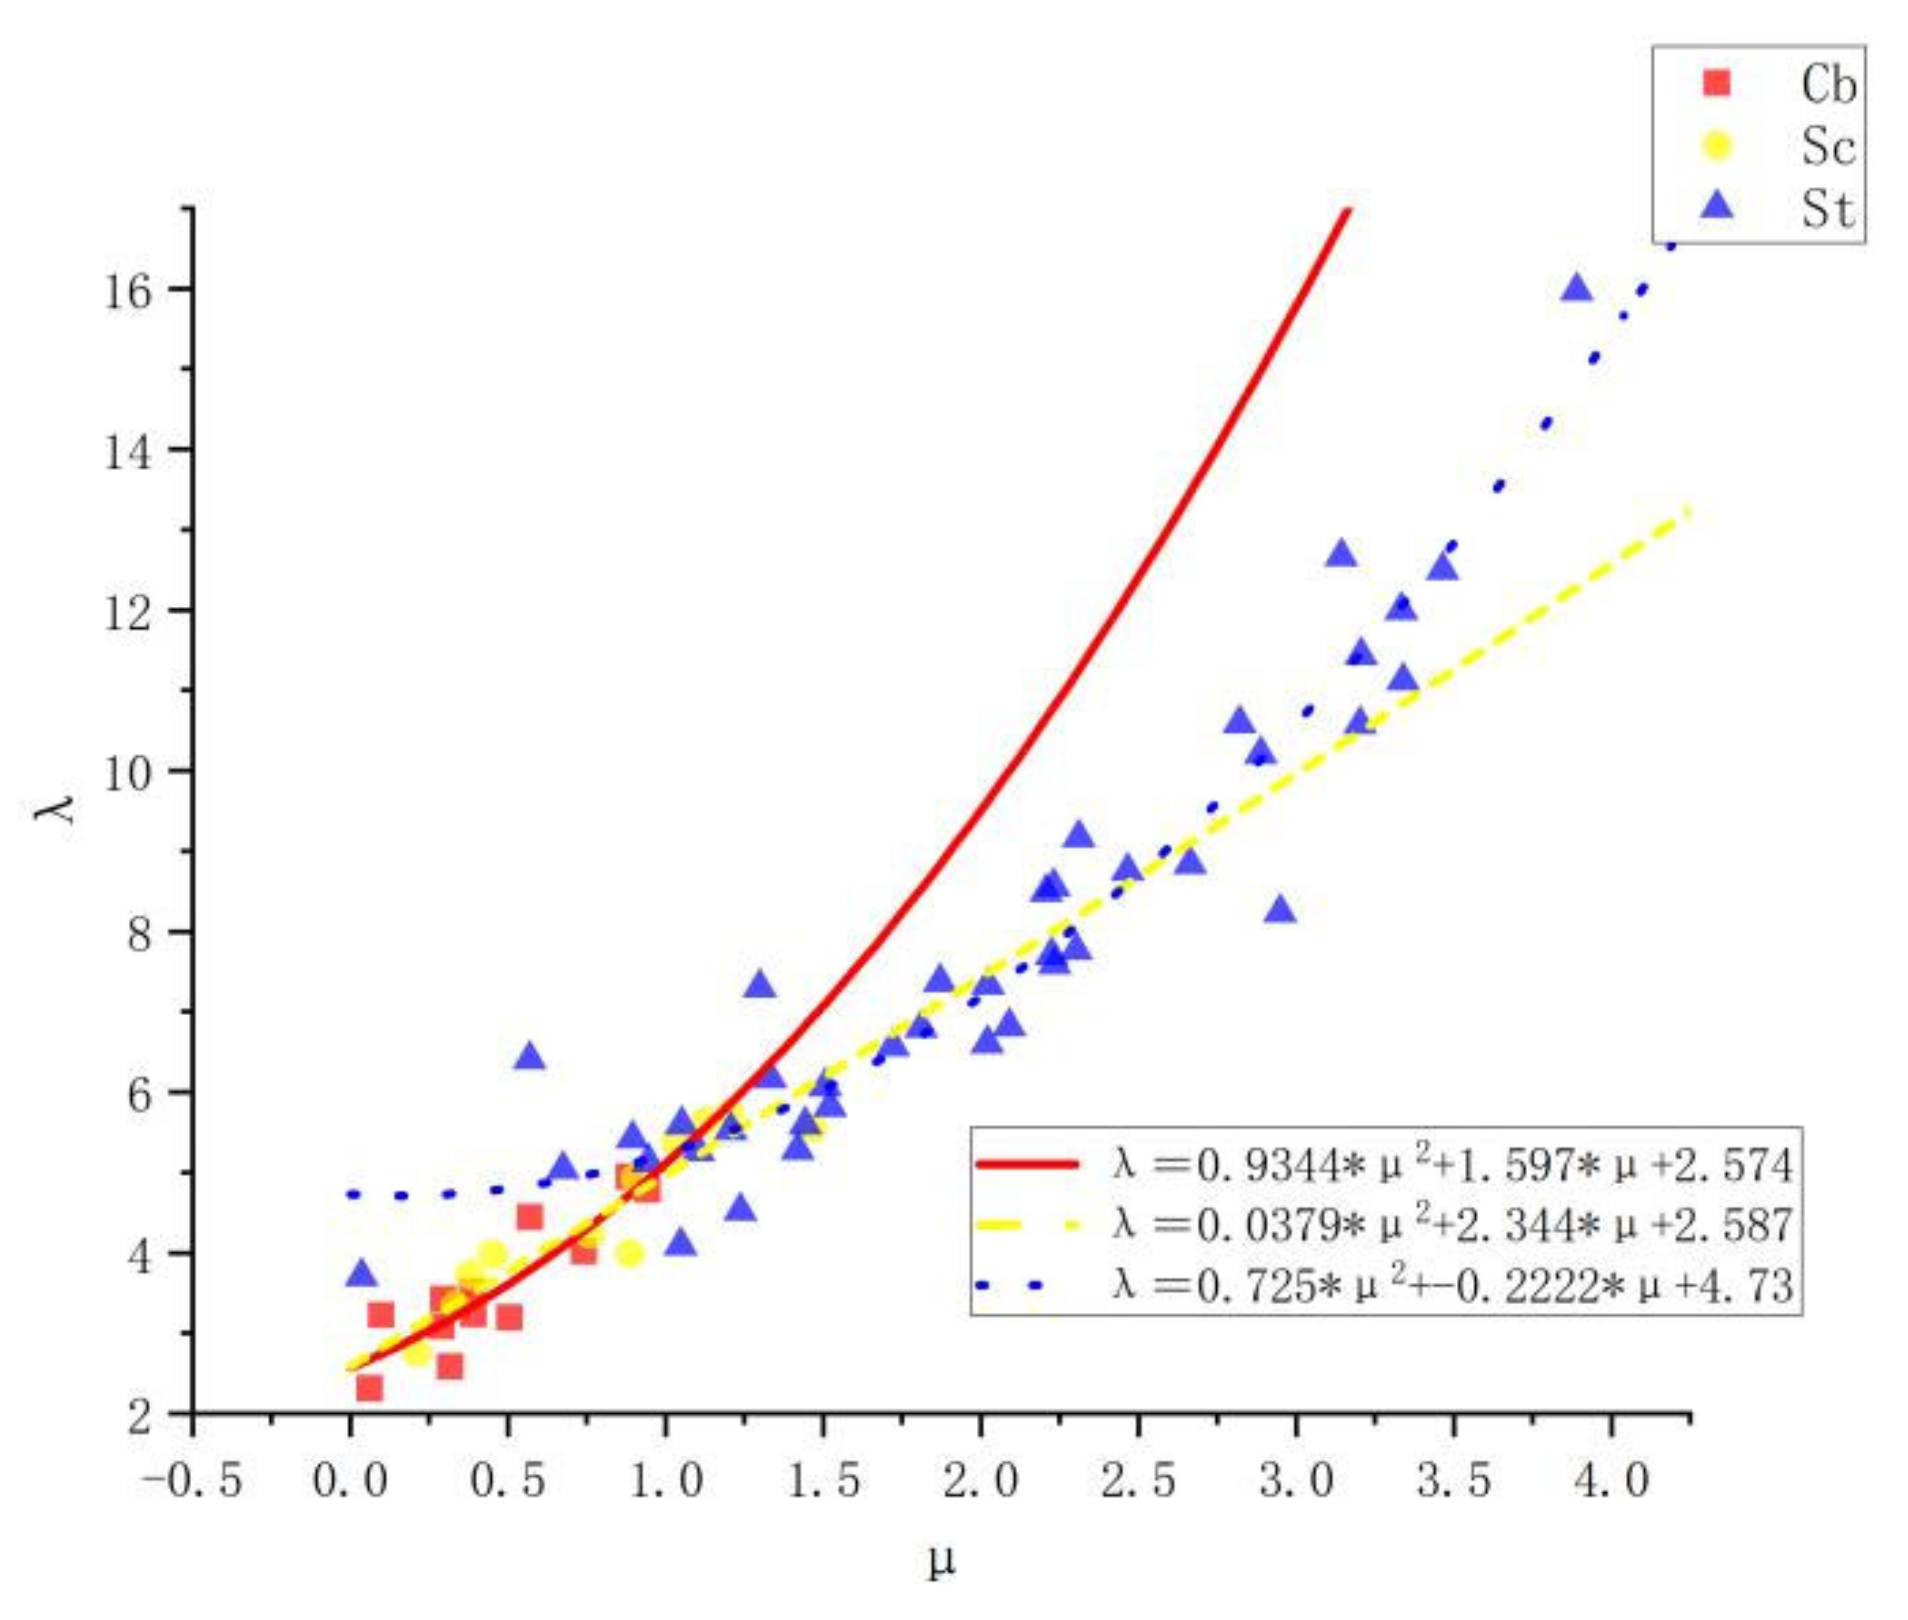
3.4.2. Gamma Parameter Distribution of Different Types of Cloud Precipitation

In this paper, the order–of–moment method is used to estimate the parameters of the raindrop spectrum, referring to the algorithm of Xiong et al. [28]. For the raindrop spectrum of the Gamma distribution, the nth order distance is defined as
M n = 0 N D D n dD
obtain after points:
M n = N 0 λ μ + N + 1 Γ μ + n + 1
In the Gamma distribution, each moment is determined by the three distribution parameters N0, λ, and μ. These three moments are needed to find the three parameters of the Gamma distribution. Usually, we call the orders 0 and 1 as low order, and 2, 3 and 4 are called intermediate, and 5 and 6 are called high. In this paper, the 0, 3 and 6 order distances are used to estimate the three parameters in the Gamma distribution model.
M 0 = 0 N D D 0 dD ; M 3 = 0 N D D 3 dD ; M 6 = 0 N D D 6 dD
F = M 0 M 6 M 3 2
F 1   μ 3 + 6 F 15   μ 2   + 11 F 74   μ + 6 F 120 = 0
a = 1 ,   b = 6 F 15 F 1 , c = 11 F 74 F 1 , d = 6 f 120 F 1
α = b 3 + 3 bc d , β = b 2 2 c , Δ = α 2 β 3
R 1 = α + Δ 3 ,   R 2 = α Δ 3
μ = b + R 1 + R 2
λ = M 0 M 3 μ + 3 μ + 2 μ + 1 3
N 0 = λ μ + 1 Γ μ + 1 M 0
Table 2 shows the Gamma fitting parameters of stratiform, cumulonimbus and mixed clouds at the four sites. It can be concluded from the table that the three parameters of stratiform precipitation at Linzhi station have the largest values at the four stations. The μ values of cumulonimbus and mixed clouds at Emei Mount Station are less than 0, −0.35 and −0.03. The smaller the μ, the wider the spectrum width of the raindrop spectrum and the N0 value of cumulonimbus and mixed cloud precipitation at Emei Mount station is the smallest, the N0 value of stratiform cloud precipitation at Naqu station is the smallest, and the N0 value of Yushu station is much larger than the other three stations. Among the three types of cloud precipitation at the four sites, the slope factor λ of stratiform cloud is the largest, cumulonimbus is the smallest, and mixed cloud is between the two. The reason is that the spectral concentration distribution of stratiform cloud raindrops mainly contributes to the small particles, and the spectral width is the narrowest so that the change value of the slope is the smallest. The main contribution of the raindrop spectral concentration distribution of mixed cloud and cumulonimbus is not only smaller particles, but also larger particles, the spectral width is wider, and the slope change rate is larger.
The figure (Figure 7) below is the Gamma fitting diagram of the three types of precipitation clouds at the four sites. All four sites have the largest spectral width of cumulonimbus and the smallest spectral width of stratiform clouds. By comparing the data differences between the fitted curves and the measured curves of the four stations, the fitness of the simulation can be compared more objectively. The comparison found that the concentration value of the fitting curve of the mixed cloud at the Linzhi station is smaller than the measured curve and the fitting curve of the precipitation cloud at other stations. When the particle size is less than 2.75 mm, it is obviously higher than the measured curve. The precipitation clouds at Yushu Station and Naqu Station have a better fitting effect when the particle size range is 0.562–5.5 mm. The cumulonimbus and mixed clouds at Linzhi Station have a particle size of 1.625 mm. The fitting effect is better when 1.625–6.5 mm, and the fitting curve of cumulonimbus at Emei Mount Station is obviously concave, and the fitting effect is better when the particle size range is 2.125–8.5 mm. The average difference in cumulonimbus precipitation at the four stations was 28.47%, the difference in mixed cloud was 11.18%, and the difference in stratiform cloud was 9.9%. Therefore, the raindrop spectra of the four stations can be simulated by Gamma within an appropriate range.
The empirical relationship of μ–λ (Table 3) has been widely proven to be able to better describe the spectral changes of raindrops in precipitation clouds, and a large number of studies have shown [29,30,31] that the relationship between different types of precipitation, different climatic conditions, and different geographical environments is different. Therefore, the three types of cloud precipitation data in the Yushu area were fitted by quadratic polynomials. The simulation of any precipitation cloud in the table has a good binomial relationship. With the increase in the shape factor μ, λ also increases accordingly (Figure 8); when μ is less than 1, the slope factor λ of the stratiform cloud is the largest, the cumulonimbus cloud is the smallest, and the hybrid cloud is somewhere in between. When μ is greater than 1, the slope factor λ of the cumulonimbus cloud is the largest, followed by the stratiform cloud and the smallest mixed cloud. The reason is that the spectral concentration distribution of stratiform cloud raindrops mainly contributes to the small particles, and the spectral width is the narrowest so that the change value of the slope is the smallest. The main contribution of the raindrop spectral concentration distribution of mixed cloud and cumulonimbus is not only smaller particles but also larger particles, the spectral width is wider, and the slope change rate is larger. The coefficients a and c in the low–altitude area are smaller than the three coefficients of the three types of precipitation clouds in the Yushu area, the coefficient b of the stratiform cloud in the Yushu area is negative, and the coefficient b of the cumulonimbus and mixed clouds is larger than that of the low–altitude area.

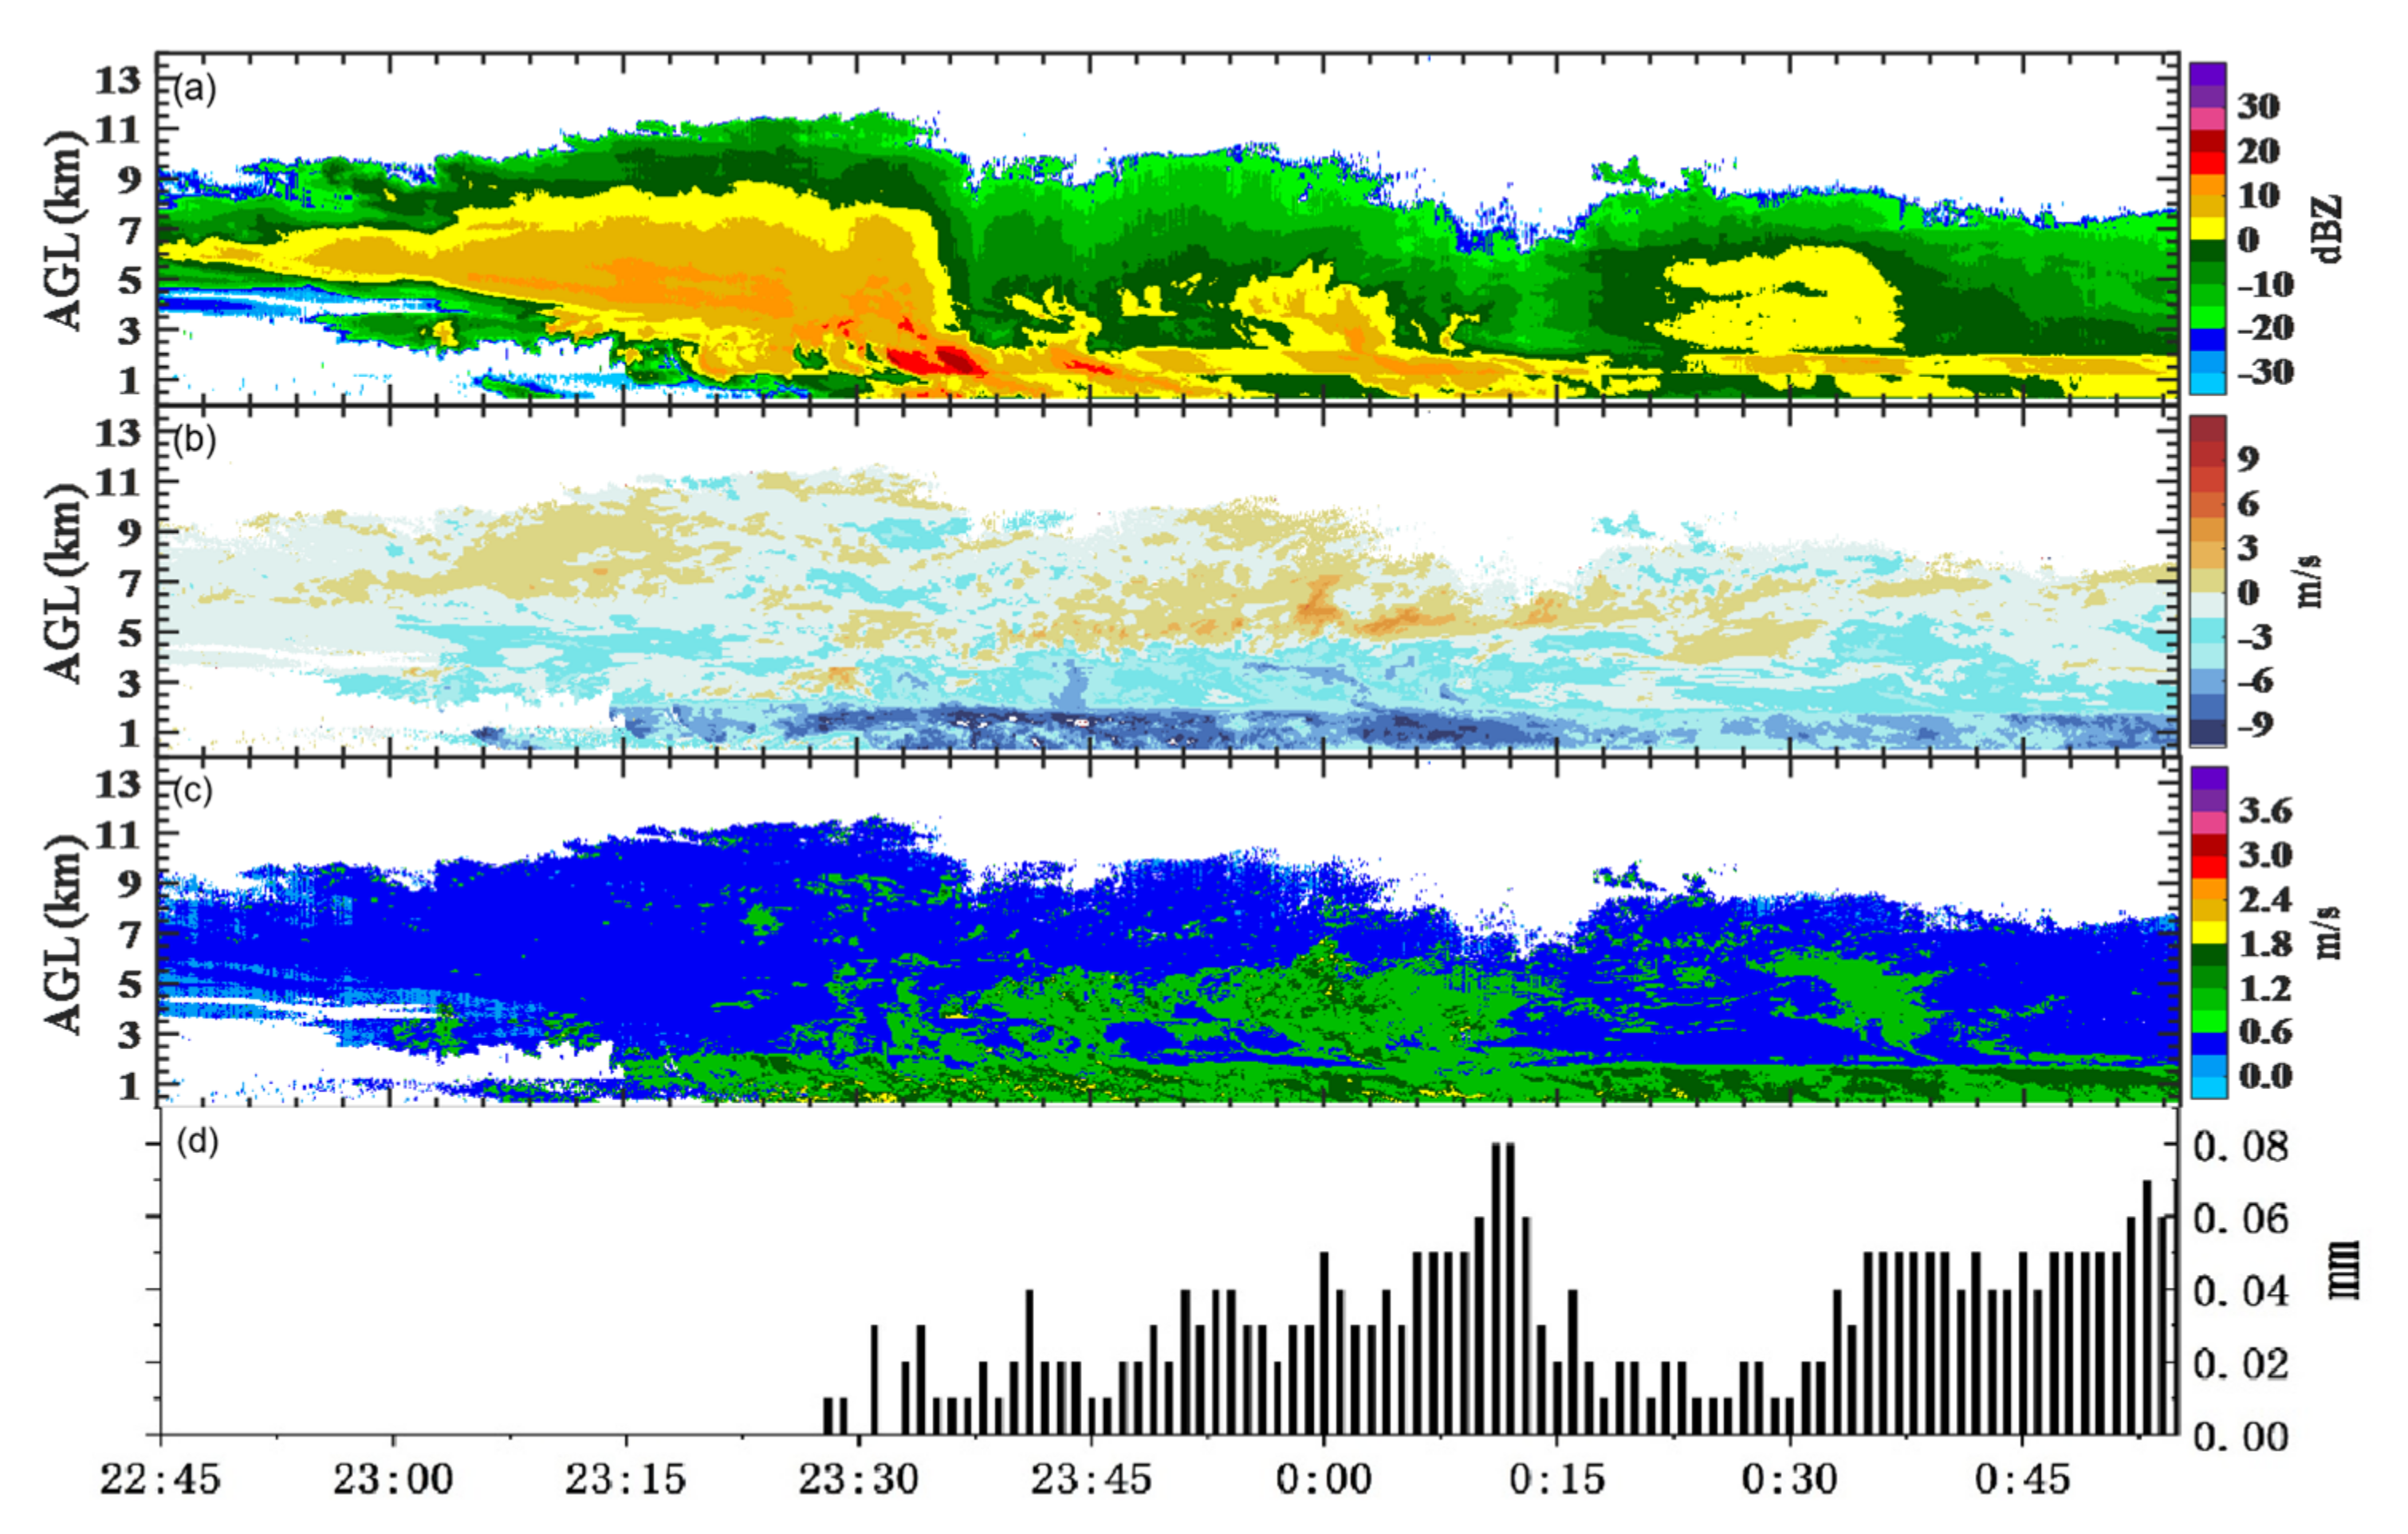
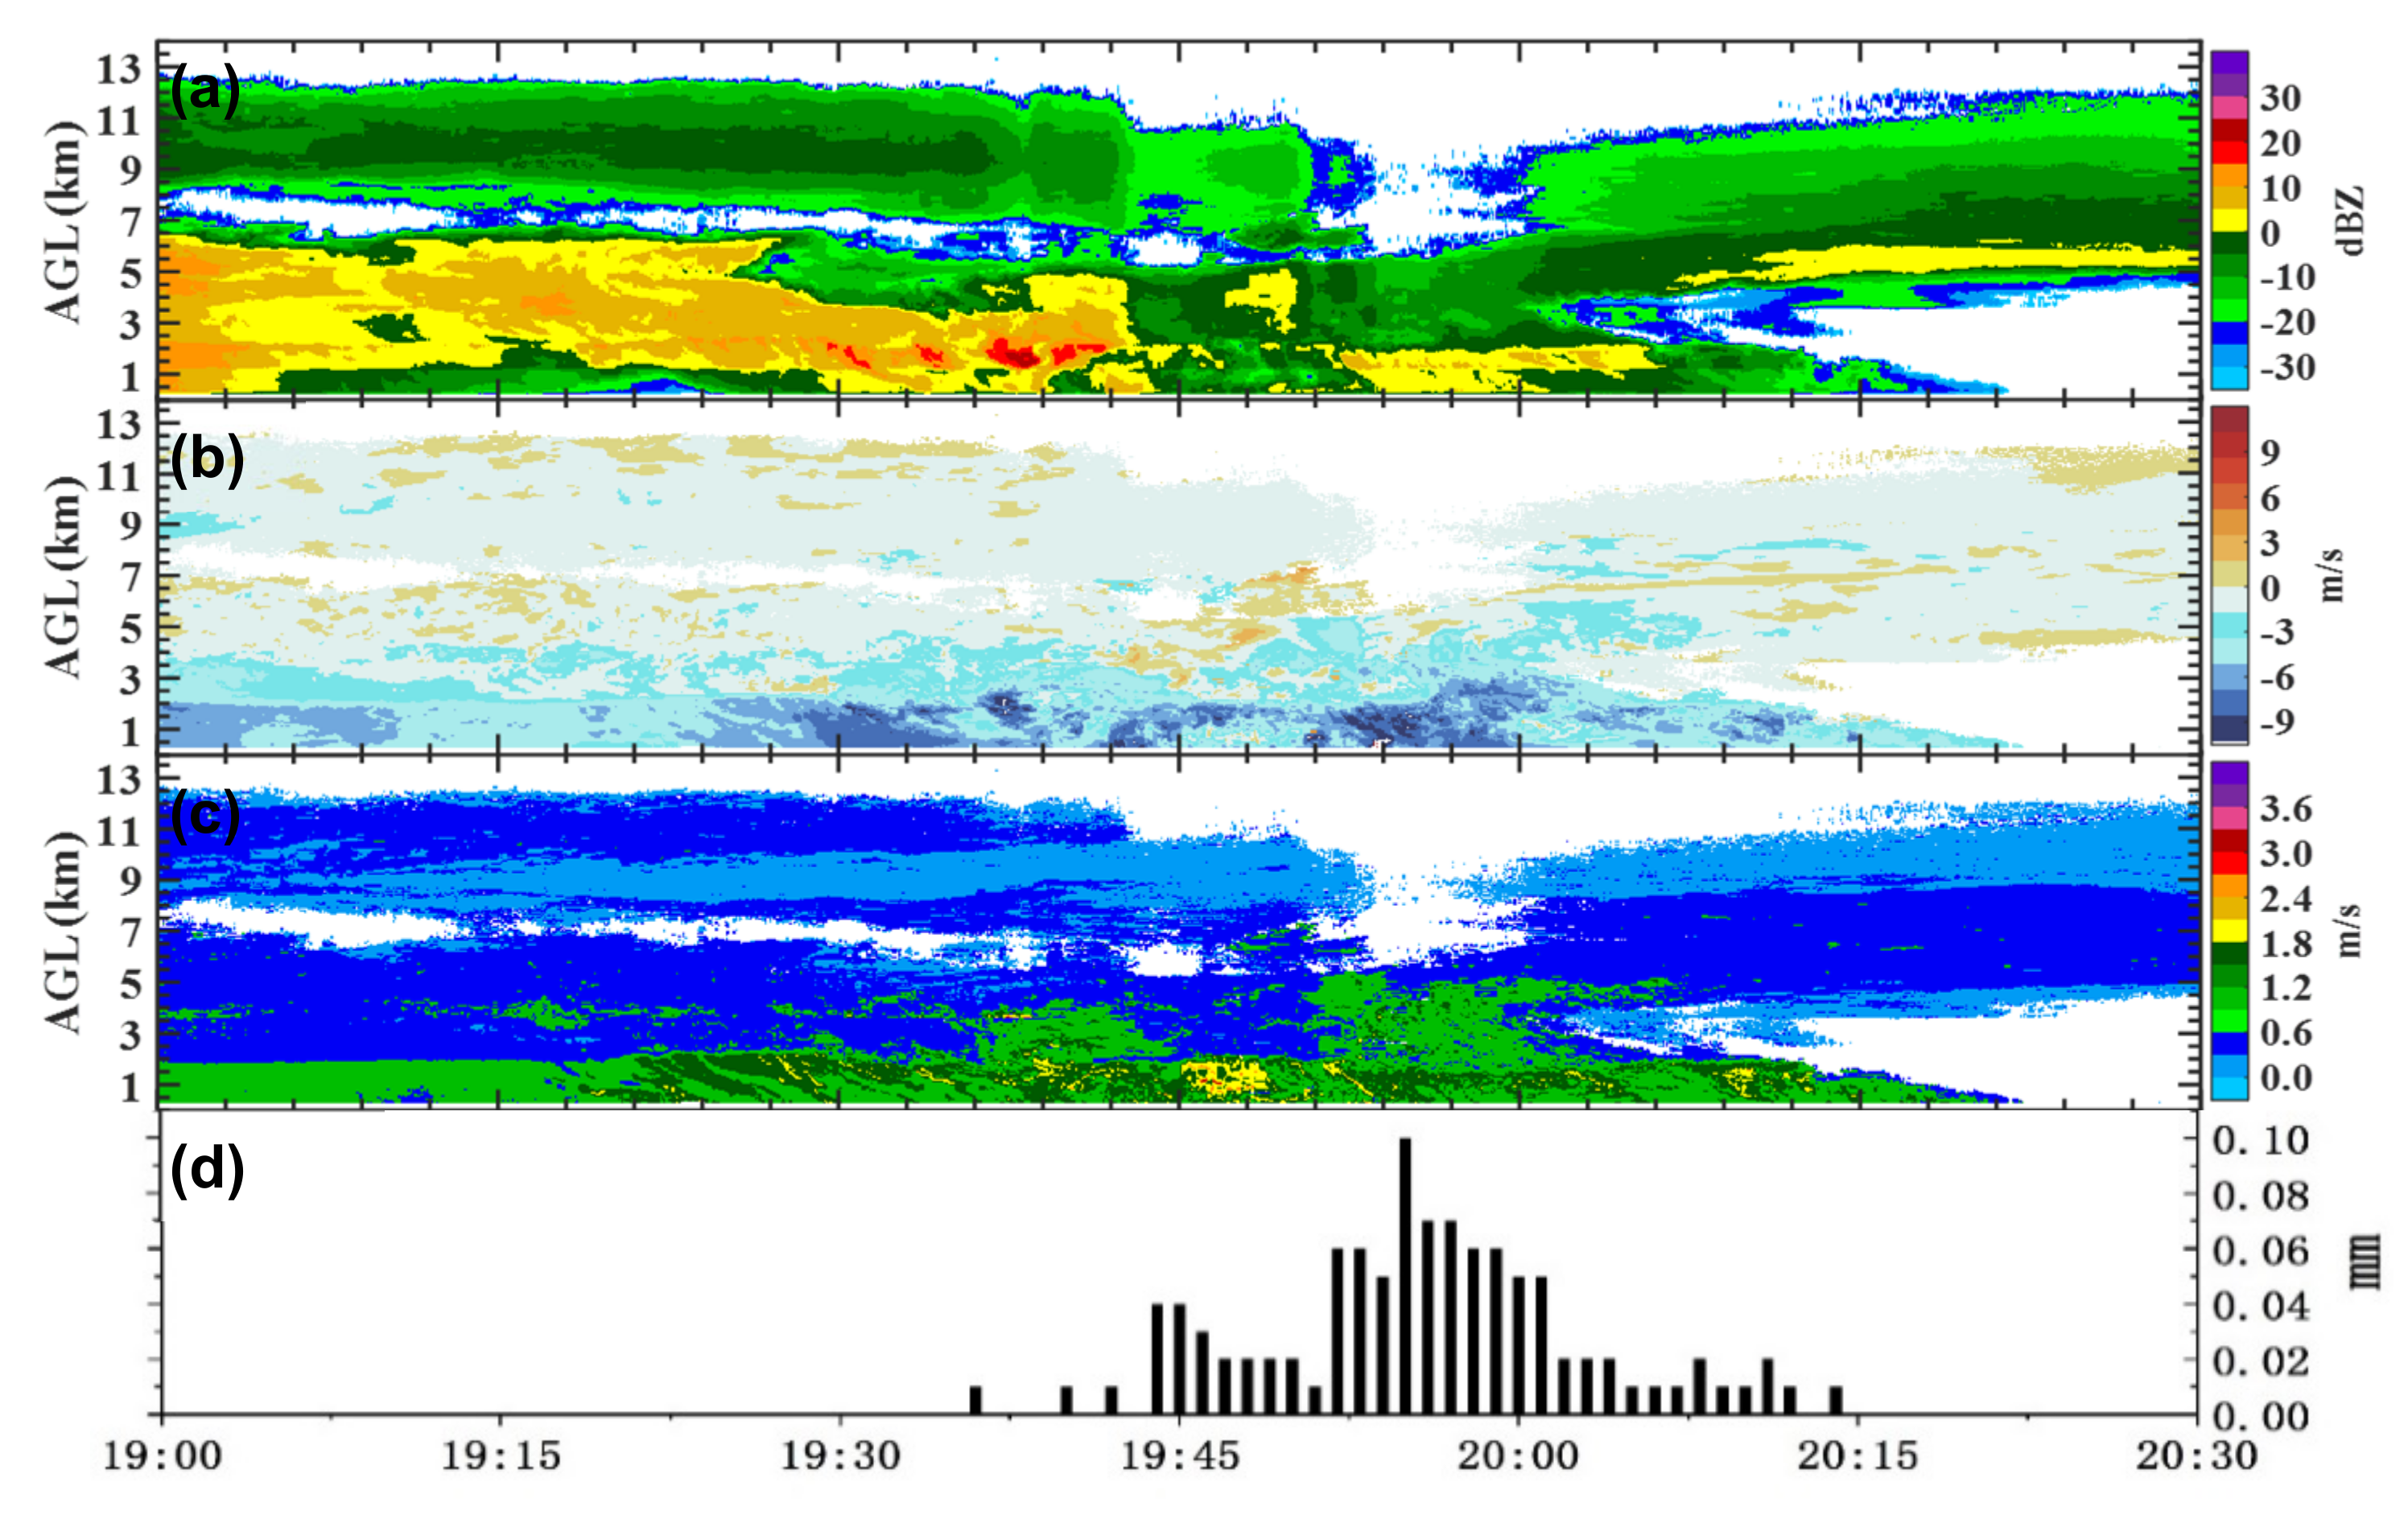
3.5. Microphysical Structure of Precipitation Clouds

In this paper, the Ka–band radar data in the Yushu area is used to analyze the microphysical structure of precipitation clouds by selecting the typical three precipitation processes from the three types of precipitation data after classification (Figure 9). They are cumulonimbus clouds on August 23, mixed clouds on August 19, and stratiform clouds on August 12. From mid to late July to August, the maximum radar echo measured by the Ka–band millimeter cloud radar data in the Yushu area is 27 dBZ.
From 23:00 Beijing time on 23 August, cumulonimbus clouds appeared over the cloud radar. At this time, the echo reflection factor did not exceed 10 dBZ, the reflectivity factor was less than 20 dBZ, the radial velocity was less than 3 m/s, and the speed spectrum width was about 0.6 m·s1, at about 23:20 BT, raindrops were observed on the ground, and the bottom of the cloud was about 1km away from the ground or precipitation had formed. At around 23:30 BT, the height of the cloud top rose to about 11km, and a strong echo area appeared. The strong echo area was about 2–3 km above the ground. In Figure 10a, it is shown in red and dark red, and the echo intensity reached 23 dBZ. The radial velocity is greater than 9 m·s1, indicating the presence of larger particles. The spectral width value is larger than 1.8 m/s, indicating that there are ice particles along with the falling raindrops. Combined with Figure 10a, the raindrop spectral distribution is a single peak–shaped particle number concentration of 124 m−3mm−1, particle diameters ranging from 0.4 to 2 mm, the rainfall intensity is 1.63 mmh1, and the maximum particle size is located at 2.37 mm. Subsequently, the area where the echo intensity weakened but the velocity spectrum width was greater than 1.2 m/s continued to increase, and the particle number concentration of cumulonimbus continued to increase. At around 23:45, the reflectivity factor appeared again in a large value area, the radial velocity −6 m·s1 area increased to 4km position, and the ground precipitation increased. As shown in Figure 10b, the particle number concentration was 252 m−3mm−1, and the rainfall intensity was 252 m−3mm−1. It reaches 2.88 mmh−1, and the accumulated precipitation on the ground is 0.68 mm. At 00:00 and 00:30 BT, another cloud cluster developed, but the radar echo gradually weakened, the cloud layer gradually dissipated, and a bright band appeared, located at a height of 2.2 km, and the cumulonimbus precipitation process basically ended. Here, the accumulated precipitation is 8.86 mm, and the average rain intensity is 3.7 mm/h. Combining with the evolution of Figure 10, it can be seen that the cumulonimbus precipitation increases slowly with the increase in precipitation intensity, and the raindrop spectral concentration increases slowly, and the main body gradually moves towards the direction of heavy raindrops, the large particle size keeps appearing, and the number concentration of the small particle size keeps increasing.
At 19:00 BT on August 19, there were two layers of clouds over the radar (Figure 11). The echoes of the upper cloud were weak, both less than 0 dBZ, and disappeared after the bottom convective cloud disappeared. The bottom layer is the developing convective cloud echo. At this time, the echo reflection factor is about 15 dBZ, the radial velocity is less than 0 m·s1, and the velocity spectrum width is less than 0.6 m·s1. At about 19:40, the cloud top height was about 7 km, and there was a strong echo area about 2 km above the ground. The echo intensity reached 23.5 dBZ, the radial velocity was greater than 9 m·s−1, and the spectral width value was greater than 1.5 m·s1. Raindrops were also observed on the ground. In Figure 12a, the particle number concentration was 49.06 m−3mm−1, the particle diameter was 0.4–2 mm, and the maximum particle size was 2.12 mm. At this time, the rainfall intensity was 0.32 mmh1. After 19:45 BT, the development was the most vigorous, the maximum rain intensity was 5.99 mmh1, and the maximum particle size was 2.75 mm, and then the radar echo gradually weakened, and the precipitation process ended. The accumulated precipitation in this process is 0.94 mm, and the average rain intensity is 1.37 mmh1. Combined with Figure 12, the distribution of the raindrop spectrum distribution of mixed cloud precipitation changes obviously. The raindrop spectral concentrations of the three times are 49.06 m−3mm−1 and 406.85 m−3mm1, respectively, 250.67 m−3mm−1, and the particles grow faster.
At 23:00 BT on 12 August (Figure 13), a weak convective cloud appeared over the radar, the maximum radar echo did not exceed 15 dBZ, the radial velocity value was small, and the sporadic value reached 6 m/s; the spectral width value was around 0.6 m·s−1, the cloud top height is 6–7 km and there is an obvious zero–degree bright band located at a height of about 2 km above the ground, and the radar reflectivity decreases with the height in the upper part and decreases with the height in the lower part. It shows that during the falling process of ice–phase particles, the ice–phase particles in the upper layer fall to the zero–degree layer and then have a melting process. The ice–phase particles melt into water droplets, and the water droplets collide and grow into large water droplets, resulting in stronger radar reflectivity. Below the zero–degree layer, due to the fast falling speed of raindrops, the concentration of precipitation particles becomes smaller, and the intensity of radar reflectivity becomes lower. The distribution of raindrop spectral concentration is a single peak with little change overall (Figure 14). The average rain intensity is 2.6 mmh1, the accumulated precipitation is 4.28 mm, and the average number concentration is 409.56 m−3mm−1.
To sum up, there are obvious differences in the evolution law of radar echo and raindrop spectral distribution corresponding to different cloud precipitation in the Yushu area. The cumulonimbus echo intensity is relatively strong, and the maximum value is over 20 dBZ. The development height of the cloud top is high, and the bright band in the zero–degree layer is difficult to observe; the strong echo area is about 2–3 km above the ground. The occurrence and development height of mixed precipitation is similar to the echo intensity of cumulonimbus clouds, but the maximum value is around 20 dBZ; the development height of cloud top is higher, close to 13 km, there is no bright band in the zero–degree layer, and the strong echo area is around 2–3 km above the ground; the duration is shorter and the vertical scale is larger than the horizontal scale. In stratiform cloud precipitation, the echo intensity is relatively weak, and the maximum value is lower than 15 dBZ. The development height of the cloud top is relatively flat at about 6–7 km; the bright band of the zero-degree layer can be directly seen, located at about 2 km, and the strong echo area is at the same height as the bright–band of the zero–degree layer. The spectral concentration of raindrops in cumulonimbus increased slowly, the main body gradually moved towards the direction of large raindrops, the large particle size continued to appear, and the number concentration of small particle size continued to increase for a long time. The increasing and decreasing time of raindrop spectral concentration in the mixed cloud is shorter than that in the cumulonimbus cloud. The stratiform cloud has a long precipitation time, and various raindrop spectral parameters are relatively stable and have little overall change. The spectra of the three types of cloud precipitation all show a single peak shape, and the peak is located at about 0.562 mm particle size. With the increase in raindrop particle size, the droplet spectrum concentration number decreases, and the change trend is roughly the same. The continuous precipitation makes the collision between the increasing small raindrops merge at the position of 1.375 mm particle size. The first time the concentration decreases with the increase in particle size, the trend becomes smaller; the second time this happens in the vicinity of the particle size of 2.5 mm, the reason is that as the duration of the precipitation process becomes longer or the rainfall intensity increases, the larger raindrops are broken into large raindrops, so that the trend of decreasing concentration becomes smaller.

4. Discussion

In this paper, some research studies were carried out on the distribution of raindrop spectra and the distribution of microphysical characteristics at Linzhi Station, Nagqu Station, Yushu Station and Emei Mount Station. Among the three types of precipitation clouds, the estimation of stratiform cloud in this paper is more accurate, but the underestimation of cumulonimbus in the statistics makes the overall data of cumulonimbus precipitation relatively small, which will be further studied in future research. The research in this paper is limited by the geographical environment, and the research time in this paper is concentrated from July to September, which cannot fully represent the microphysical characteristics of rainfall in the central and eastern margins of the Tibetan Plateau. Although many interesting findings have been obtained, whether these conclusions are generalizable requires further research. The plateau topography is complex and changeable, which has a certain influence on the particle size and density of precipitation particles. In the future, we can further analyze the microphysical characteristics of precipitation in this area in combination with more specific weather cases [32,33,34,35,36,37,38,39,40,41,42,43,44,45].

5. Conclusions

In this paper, the raindrop spectrum data of the PS–32 laser raindrop spectrometer was used to analyze the raindrop spectrum characteristics of the four stations of Linzhi Station, Naqu Station, Yushu Station and Emei Mount Station, and the data of each station was divided into five grades according to the rain intensity. After analysis, the data was divided into cumulonimbus, stratiform and mixed clouds for Gamma fitting analysis. The main conclusions are as follows:
(1) The spectra of the four stations all showed a multi–peak structure, the peak at Linzhi station was the largest, and the peak at Emei Mount station was the smallest. The overall raindrop spectral concentration decreased with the increase in particle size after 0.562 mm. The raindrop spectral concentration of Linzhi Station had the most obvious downward trend with the increase of particle size after the peak.
(2) All rain intensity grades at the four stations show the characteristics of multiple vertices. After the vertices, with the increase in raindrop particle size, the number of raindrop spectral concentrations decreases. Among the four stations, the spectral concentration of raindrops with a rain intensity level >20 mmh−1 has the smoothest variation trend with particle size. At Linzhi Station, Naqu Station and Yushu Station, the particles with a diameter of <1 mm contributed the most to the precipitation rate, while the particles with a diameter of <1 mm at Emei Mount Station contributed the least to the precipitation rate. The precipitation in the eastern slope and eastern margin of the Tibetan Plateau is mainly composed of medium and small particles, accounting for 95–99% of the precipitation particle number concentration. Among them, the contribution of medium and small particles to the precipitation rate at Linzhi Station, Naqu Station, and Yushu Station, exceeds 73–94%.
(3) Among the four stations, Linzhi Station, Nagqu Station and Emei Mount Station have the largest proportion of stratiform precipitation samples, while Yushu Station has the largest proportion of cumulonimbus precipitation samples. When the particle size is greater than 1.875 mm, the raindrop spectral concentrations of the four sites are ranked as follows: Cb > Sc > St under the same particle size, and the larger the concentration, the wider the spectral width. Among the three types of cloud precipitation at the four sites, the slope factor λ of stratiform cloud is the largest, cumulonimbus is the smallest, and mixed cloud is between the two. The average fitting difference of cumulonimbus precipitation at the four stations was 28.47%, the difference in the mixed cloud was 11.18%, and the difference in the stratiform cloud was 9.9%.
(4) In the selected case, the structural similarity of the three types of precipitation clouds in the Yushu area is that the zero–degree layer is about 2 km, and the height of the cloud base is very low or grounded when it rains. The occurrence and development of cumulonimbus and mixed clouds are vigorous, and the highest cloud height can reach 13 km, but the duration of mixed clouds is short; stratiform clouds develop relatively smoothly, with cloud heights of 6–7 km. The continuous precipitation makes the collision between the increasing small raindrops merge at the position of 1.375 mm particle size. The first time the concentration decreases with the increase in particle size, the trend becomes smaller; the second time this happens in the vicinity of the particle size of 2.5 mm, the reason is that as the duration of the precipitation process becomes longer or the rainfall intensity increases, the larger raindrops are broken into large raindrops so that the trend of decreasing concentration becomes smaller.

Author Contributions

M.L., M.G., N.C. and Y.Y. mainly wrote the manuscript and were responsible for the research design, data preparation and analysis. Y.M. and M.L. supervised the research, including methodology development, as well as manuscript structure, writing and revision. M.L. drafted the manuscript. F.S., M.G., L.S. and P.X. prepared the data and wrote this paper. All authors have read and agreed to the published version of the manuscript.

Funding

This work was financially supported by the Second Tibetan Plateau Scientific Expedition and Research (STEP) program (Grant No. 2019QZKK0103), the National Natural Science Foundation of China (Grant No. 41675106, 41805009), National key research and development program of China (2017YFC1505702) and Scientific Research Project of Chengdu University of Information Technology (KYTZ201721).

Institutional Review Board Statement

Not applicable.

Informed Consent Statement

Not applicable.

Data Availability Statement

Not applicable.

Conflicts of Interest

The authors declare no conflict of interest.

References

  1. Chen, L.; Song, Y.; Liu, J.; Wang, W. Diurnal variation of summer convective cloud systems over the Tibetan Plateau revealed from meteorological satellite data. Chin. J. Meteorol. 1999, 57, 549–560. [Google Scholar]
  2. Pan, X.; Fu, Y. Analysis of climate characteristics of deep and shallow precipitation clouds over the Tibetan Plateau in summer. Plateau Meteorol. 2015, 34, 1191–1203. [Google Scholar]
  3. Liu, L.; Zheng, J.; Ruan, Z.; Cui, Z.; Hu, Z.; Wu, S.; Dai, G.; Wu, Y. Tibetan Plateau cloud and precipitation multi-radar comprehensive observation experiment and preliminary analysis results of cloud characteristics. Chin. J. Meteorol. 2015, 73, 635–647. [Google Scholar]
  4. Ruan, Y.; Ruan, Z.; Wei, M.; Gem, R. Analysis of vertical structure of plateau summer convective clouds based on C-FMCW radar. Plateau Meteorol. 2018, 37, 83–105. [Google Scholar]
  5. Sato, T.; Yoshikane, T.; Satoh, M.; Miura, H.; Fujinami, H. Resolution dependency of the diurnal cycle of convective clouds over the tibetan plateau in a mesoscale model. J. Meteorol. Soc. Japan. Ser. II 2008, 86, 17–31. [Google Scholar] [CrossRef] [Green Version]
  6. Collier, E.; Immerzeel, W.W. High-resolution modelling of atmospheric dynamics in the Nepalese Himalaya. J. Geophys. Res. Atmos. 2015, 120, 9882–9896. [Google Scholar] [CrossRef]
  7. Maussion, F.; Scherer, D.; Finkelnburg, R.; Richters, J.; Yang, W.; Yao, T. WRF simulation of a precipitation event over the Tibetan Plateau, China—An assessment using remote sensing and ground observations. Hydrol. Earth Syst. Sci. 2011, 15, 1795–1817. [Google Scholar] [CrossRef] [Green Version]
  8. Yin, S.; Li, M.; Liu, X.; Song, X.; Lv, Z.; Shu, L.; Wang, L.; Fu, W. Numerical simulation of convective cloud precipitation and its cloud microphysical process in Nagqu region on 7 August 2014. Plateau Meteorol. 2020, 39, 48–57. [Google Scholar]
  9. Shu, L.; Li, M.; Watson Solang, J.; Lu, Z.; Fu, W.; Wang, L.; Yin, S. Raindrop spectral characteristics and cloud microphysical structure analysis in Yushu area of eastern Tibetan Plateau. Adv. Meteorol. Sci. Technol. 2021, 11, 113–121. [Google Scholar]
  10. Wang, G.; Zhou, R.; Zhaxi, S.; Liu, S. Raindrop Size Distribution Measurements in Southeast Tibetan Plateau During the STEP Project. Atmos. Res. 2021, 249, 105311. [Google Scholar] [CrossRef]
  11. He, J.; Zheng, J.; Zeng, Z.; Che, Y. A Comparative Study on the Vertical Structures and Microphysical Properties of Stratiform Precipitation over South China and the Tibetan Plateau. Remote Sens. 2021, 13, 2897. [Google Scholar] [CrossRef]
  12. Yu, J.; Li, M.; Yin, S.; Lu, Z.; Song, X. Raindrop spectrum analysis of microscopic characteristics of cloud precipitation in Naqu region of Tibetan Plateau. J. Chengdu Univ. Inf. Technol. 2020, 35, 188–194. [Google Scholar]
  13. Zhang, H.; He, H.; Zhang, Y.; Zeng, Q.; Bai, S. Parameter characteristic analysis of precipitation and raindrop spectral fitting model in Nanjing area. Meteorol. Environ. Sci. 2017, 40, 71–78. [Google Scholar]
  14. Liu, Z.; Wu, X.; Yu, Y.; Ren, Z. Analysis of raindrop spectral characteristics of typical stations in China during rainfall period. Hubei. Agric. Sci. 2021, 60, 53–59. [Google Scholar] [CrossRef]
  15. Marshall, J.S.; Palmer, W.M.K. The Distribution of Raindrops with Size. J. Meteorol. 1948, 5, 165–166. [Google Scholar] [CrossRef]
  16. Gong, F.; Liu, J.; Li, Z. Study on the spectral characteristics of three types of precipitation clouds and raindrops. Atmos. Sci. 1997, 1, 96–103. [Google Scholar]
  17. Mario, M.; Frank, S.M.; Gianfranco, V. Analysis and Synthesis of Raindrop Size Distribution Time Series From Disdrometer Data. IEEE Trans. Geosci. Remote Sens. 2008, 46, 466–478. [Google Scholar]
  18. Bringi, V.N.; Chandrasekar, V.; Hubbert, J.; Gorgucci, E.; Randeu, W.L.; Schoenhuber, M. Raindrop sizedistribution in different climatic regimes from disdrometer anddual-polarized radar analysis. J. Atmos Sci. 2003, 60, 354–365. [Google Scholar] [CrossRef]
  19. Liu, C.; Zhou, J.; Gu, J.; Huang, L.; Xiang, G. Spectral characteristics of raindrops in Chengdu area. Chin. J. Appl. Meteorol. 2015, 26, 112–121. [Google Scholar]
  20. Mehta, S.; Singh, S.; Mitra, A.; Ghosh, S.K.; Raha, S.; Mehta, S.K. Modeling of Raindrop Size Distribution Observed Using Micro Rain Radar Over Darjeeling (27.05oN, 88.26oE): An Eastern Himalayan Region. Pure Appl. Geophys. 2019, 177, 2959–2976. [Google Scholar] [CrossRef]
  21. Fu, Y.; Pan, X.; Liu, G.; Li, R.; Zhong, L. Research on summer precipitation on Tibetan Plateau based on cloud brightness temperature and precipitation echo top height classification. Atmos. Sci. 2016, 40, 102–120. [Google Scholar]
  22. Yang, J.; Chen, B.; Han, Y.; Li, P. Statistical characteristics of raindrop spectrum in different regions of Shanxi Province. Meteorol. Sci. 2016, 36, 88–95. [Google Scholar]
  23. Tokay, A.; Short, D.A. Evidence from tropical raindrop spectra of the origin of rain from stratiform versus convective clouds. J. Appl. Meteorol. 1996, 35, 355–371. [Google Scholar] [CrossRef] [Green Version]
  24. Chen, B.J.; Hu, Z.Q.; Liu, L.P. Raindrop size distribution measurements at 4500 m on the Tibetan Plateau during TIPEX-III. J. Geophys. Res. Atmos. 2017, 122, 11092–11106. [Google Scholar] [CrossRef]
  25. Dolan, B.; Fuchs, B.; Rutledge, S.A.; Barnes, E.A.; Thompson, E.J. Primary modes of global drop size distributions. J. Atmos. Sci. 2018, 75, 1453–1476. [Google Scholar] [CrossRef]
  26. Steiner, M.; Waldvogel, A. Peaks in rainsrop size distributions. J. Atmos. Sci. 1987, 44, 3127–3133. [Google Scholar] [CrossRef] [Green Version]
  27. Liu, H.; Lei, H. Analysis of the characteristics of stratiform and convective cloud precipitation based on ground raindrop spectral data. Atmos. Sci. 2006, 30, 693–702. [Google Scholar]
  28. Xiong, F. Research on Fitting Raindrop Spectrum of GAMMA Distribution; Nanjing University of Information Technology: Nanjing, China, 2016. [Google Scholar]
  29. Wu, Z.; Zhang, Y.; Zhang, L.; Xie, Y.; Wen, L.; Yang, J. Characteristics of Summer Season Raindrop Size Distribution in Three Typical Regions of Western Pacific. J. Geophys. Res. Atmos. 2019, 124, 4054–4073. [Google Scholar] [CrossRef] [Green Version]
  30. Seela, B.K.; Janapati, J.; Pay-Liam, L.; Krishna Reddy, K.; Shirooka, R.; Wang, P.K. A Comparison Study of Summer Season Raindrop Size Distribution Between Palau and Taiwan, Two Islands in Western Pacific. J. Geophys. Res. 2017, 122, 11787–11805. [Google Scholar] [CrossRef]
  31. Wen, L.; Zhao, L.; Wang, M.; Zhang, G. Seasonal Variations of Observed Raindrop Size Distribution in East China. Adv. Atmos. Sci. 2019, 36, 346–362. [Google Scholar] [CrossRef]
  32. Takeuchi, D.M. Characterizatin on of raindrop size distributions. In Proceedings of the Conference on Cloud Physics and Atmospheric Electricity of the American Meteorological Society, Issaquah, WA, USA, 31 July–4 August 1978; pp. 154–161. [Google Scholar]
  33. Fletcher, N.H. The Physics of Rain Clouds; Cambridge University Press: Cambridge, UK, 1962; p. 386. [Google Scholar]
  34. Willis Paul, T. Functional fits to some observ ed drop size distribu tions and paramet erization of rain. J. Atmos. Sci. 1984, 41, 1648–1661. [Google Scholar] [CrossRef] [Green Version]
  35. Porcù, F.; D’Adderio, L.P.; Prodi, F.; Caracciolo, C. Rain drop size distribution over the Tibetan Plateau. Atmos. Res. 2014, 150, 21–30. [Google Scholar] [CrossRef]
  36. Atlas, D. Advances in Radar Meteorology. Adv. Geophys. 1964, 10, 317–478. [Google Scholar]
  37. Zwiebel, J.; Baelen, J.V.; Anquetin, S.; Pointin, Y.; Boudevillain, B. Impacts of orography and rain intensity on rainfall structure: The case of the HyMeX IOP7a event. Q. J. R. Meteorol. Soc. 2016, 142, 310–319. [Google Scholar] [CrossRef]
  38. Nzeukou, A.; Sauvageot, H.; Ochou, A.D.; Kebe, C.M.F. Raindrop Size Distribution and Radar Parameters at Cape Verde. Appl. Meteorol. 2004, 43, 90–105. [Google Scholar] [CrossRef]
  39. Zheng, J.; Chen, B. Selection of Raindrop Spectral Distribution Function: A Comparative Study of M-P and Gamma Distributions. Meteorol. Sci. 2007, 1, 17–25. [Google Scholar]
  40. Wang, H.; Lei, H.; Yang, J.; Zhang, D. Characteristics of microphysical parameters of precipitation in different cloud systems in Shandong. Atmos. Sci. 2020, 44, 315–326. [Google Scholar]
  41. Li, D.; Bai, A.; Huang, S. Analysis of strong convective weather characteristics in Tibetan Plateau using TRMM satellite data. Plateau Meteorol. 2012, 31, 304–311. [Google Scholar]
  42. Wu, Y.; Liu, L.; Zhou, J.; Yang, J.; Zheng, J. Research on the influence of the change of raindrop spectrum on precipitation estimation. Plateau Meteorol. 2016, 35, 220–230. [Google Scholar]
  43. Chang, Y. Airplane Observational Study on Cloud Microphysical Characteristics and Precipitation Formation Mechanism in Nagqu Region of Qinghai-Tibet Plateau in Summer; Chinese Academy of Meteorological Sciences: Beijing, China, 2019. [Google Scholar]
  44. Liu, H.; Chen, H.; Lei, H.; Wu, Y. Analysis of the relationship between precipitation intensity and radar reflectivity factor using the 2004 Beijing raindrop spectrum data. Chin. J. Meteorol. 2008, 1, 125–129. [Google Scholar]
  45. Li, S.; Wang, X.; Wan, R.; Li, G. Spectral characteristics of raindrops at different altitudes on the eastern slope of the Tibetan Plateau. Plateau Meteorol. 2020, 39, 899–911. [Google Scholar]
Figure 1. Topographic map of the central and eastern margins of the Tibetan Plateau, with observation stations being marked.
Atmosphere 13 01082 g001
Figure 2. Average rainfall intensity and cumulative rainfall of 70 precipitations in the Yushu area.
Atmosphere 13 01082 g002
Figure 3. The total concentration distribution of raindrop spectra at the four stations, D (mm) is the particle size, and the ordinate is the raindrop spectral concentration.
Atmosphere 13 01082 g003
Figure 4. Raindrop spectral concentration distribution of each grade at four stations: (a) Linzhi station; (b) Naqu station; (c) Yushu station; (d) Emei Mount station.
Atmosphere 13 01082 g004
Figure 5. Relative contribution of each particle diameter class to rainfall rate R (solid black line) and total concentration (histogram) at four stations: (a) Linzhi station; (b) Nagqu station; (c) Yushu station; (d) Emei Mount station stand.
Atmosphere 13 01082 g005
Figure 6. Raindrop spectral concentration distribution of three types of cloud precipitation at four stations: (a) Linzhi station; (b) Nagqu Station; (c) Yushu Station; (d) Emei Mount Station.
Atmosphere 13 01082 g006
Figure 7. Spectral concentration distribution and Gamma fitting curve of three types of cloud precipitation at four stations: (a) Linzhi station; (b) Nagqu station; (c) Yushu station; (d) Emei Mount Station.
Atmosphere 13 01082 g007aAtmosphere 13 01082 g007b
Figure 8. Scatter plots μ–λ relations and fitting curves for three types of rainfall.
Atmosphere 13 01082 g008
Figure 9. Cumulonimbus precipitation in Yushu area from 22:45 on 23 August 2019 to 00:45 on 24 August Beijing time observed by Ka-band millimeter cloud radar, (a) reflectivity factor, (b) radial velocity, (c) Velocity spectrum width, (d) Precipitation.
Atmosphere 13 01082 g009
Figure 10. Raindrop size distributions of cumulonimbus rainfall in 15 min: (a) 23:30; (b) 23:45; (c) 00:00; (d) 00:15; (e) 00:30; (f) 00:45 BT.
Atmosphere 13 01082 g010aAtmosphere 13 01082 g010b
Figure 11. Same as Figure 9 during 19:00–22:00 BT 19 August 2019. (a) reflectivity factor, (b) radial velocity, (c) velocity spectrum width, (d) rainfall.
Atmosphere 13 01082 g011
Figure 12. Raindrop size distributions of stratocumulus rainfall in 15 min: (a) 19:30; (b) 19:45; (c) 20:00 BT.
Atmosphere 13 01082 g012
Figure 13. Same as Figure 9 during 23:00–next day 01:00 BT 12 August 2019. (a) reflectivity factor, (b) radial velocity, (c) velocity spectrum width, (d) rainfall.
Atmosphere 13 01082 g013
Figure 14. Raindrop size distributions of stratiform rainfall in 15 min: (a) 23:00; (b) 23:15; (c) 23:30; (d) 23:45; (e) 00:00; (f) 00:15 BT.
Atmosphere 13 01082 g014
Table 1. Statistics of three types of precipitation samples at four sites.
SiteThe Proportion of Cumulonimbus PrecipitationThe Proportion of Stratiform Cloud PrecipitationMixed Cloud Precipitation Percentage
Linzhi station11.1%72.9%16%
Nagqu Station16.72%68.21%15.06%
Yushu Station40.67%37.00%22.31%
Emei Mount Station25.01%51.27%13.52%
Table 2. Gamma fitting parameters distribution of three types of precipitation clouds at four sites.
SiteParameterStratiform CloudCumulonimbusHybrid Cloud
N0(m−3mm−1)25,163.583385.0844916.767
Linzhi Stationμ3.950.0681.45
λ(mm−1)10.341.715.35
N0(m−3mm−1)2657.795346.9621003.564
Nagqu Stationμ0.740.040.16
λ(mm−1)5.492.743.85
N0(m−3mm−1)15,933.1704843.7749077.487
Yushu Stationμ1.160.3470.667
λ(mm−1)5.8303.2804.360
N0(m−3mm−1)12,225.826331.592671.379
Emei Mount Stationμ2.1−0.35−0.03
λ(mm−1)5.241.161.96
Table 3. The μ–λ relations of other parts of the world.
StationCoefficient aCoefficient bCoefficient c
Northern Taiwan [31]0.02350.4722.394
West Pacific [30]0.02780.6011.381
Nanjing Jiangning [32] μ = 0.021 λ 2 + 0.988 λ 2.669
Cumulonimbus clouds in Yushu area0.93441.5972.574
Hybrid cloud in Yushu area0.03792.3442.587
stratiform cloud in Yushu area0.725−0.2224.73
Publisher’s Note: MDPI stays neutral with regard to jurisdictional claims in published maps and institutional affiliations.

