
Meteo-Climatic Conditions of Wind and Wave in the Perspective of Joint Energy Exploitation: Case Study of Dongluo Island, Hainan


Abstract
:1. Introduction
2. Data and Method
2.1. Data Gathering and Preprocess
2.2. Assessment Method of Two Offshore Resources
2.3. Statistical Method
3. Result and Discussion
3.1. Wind and Wave Conditions
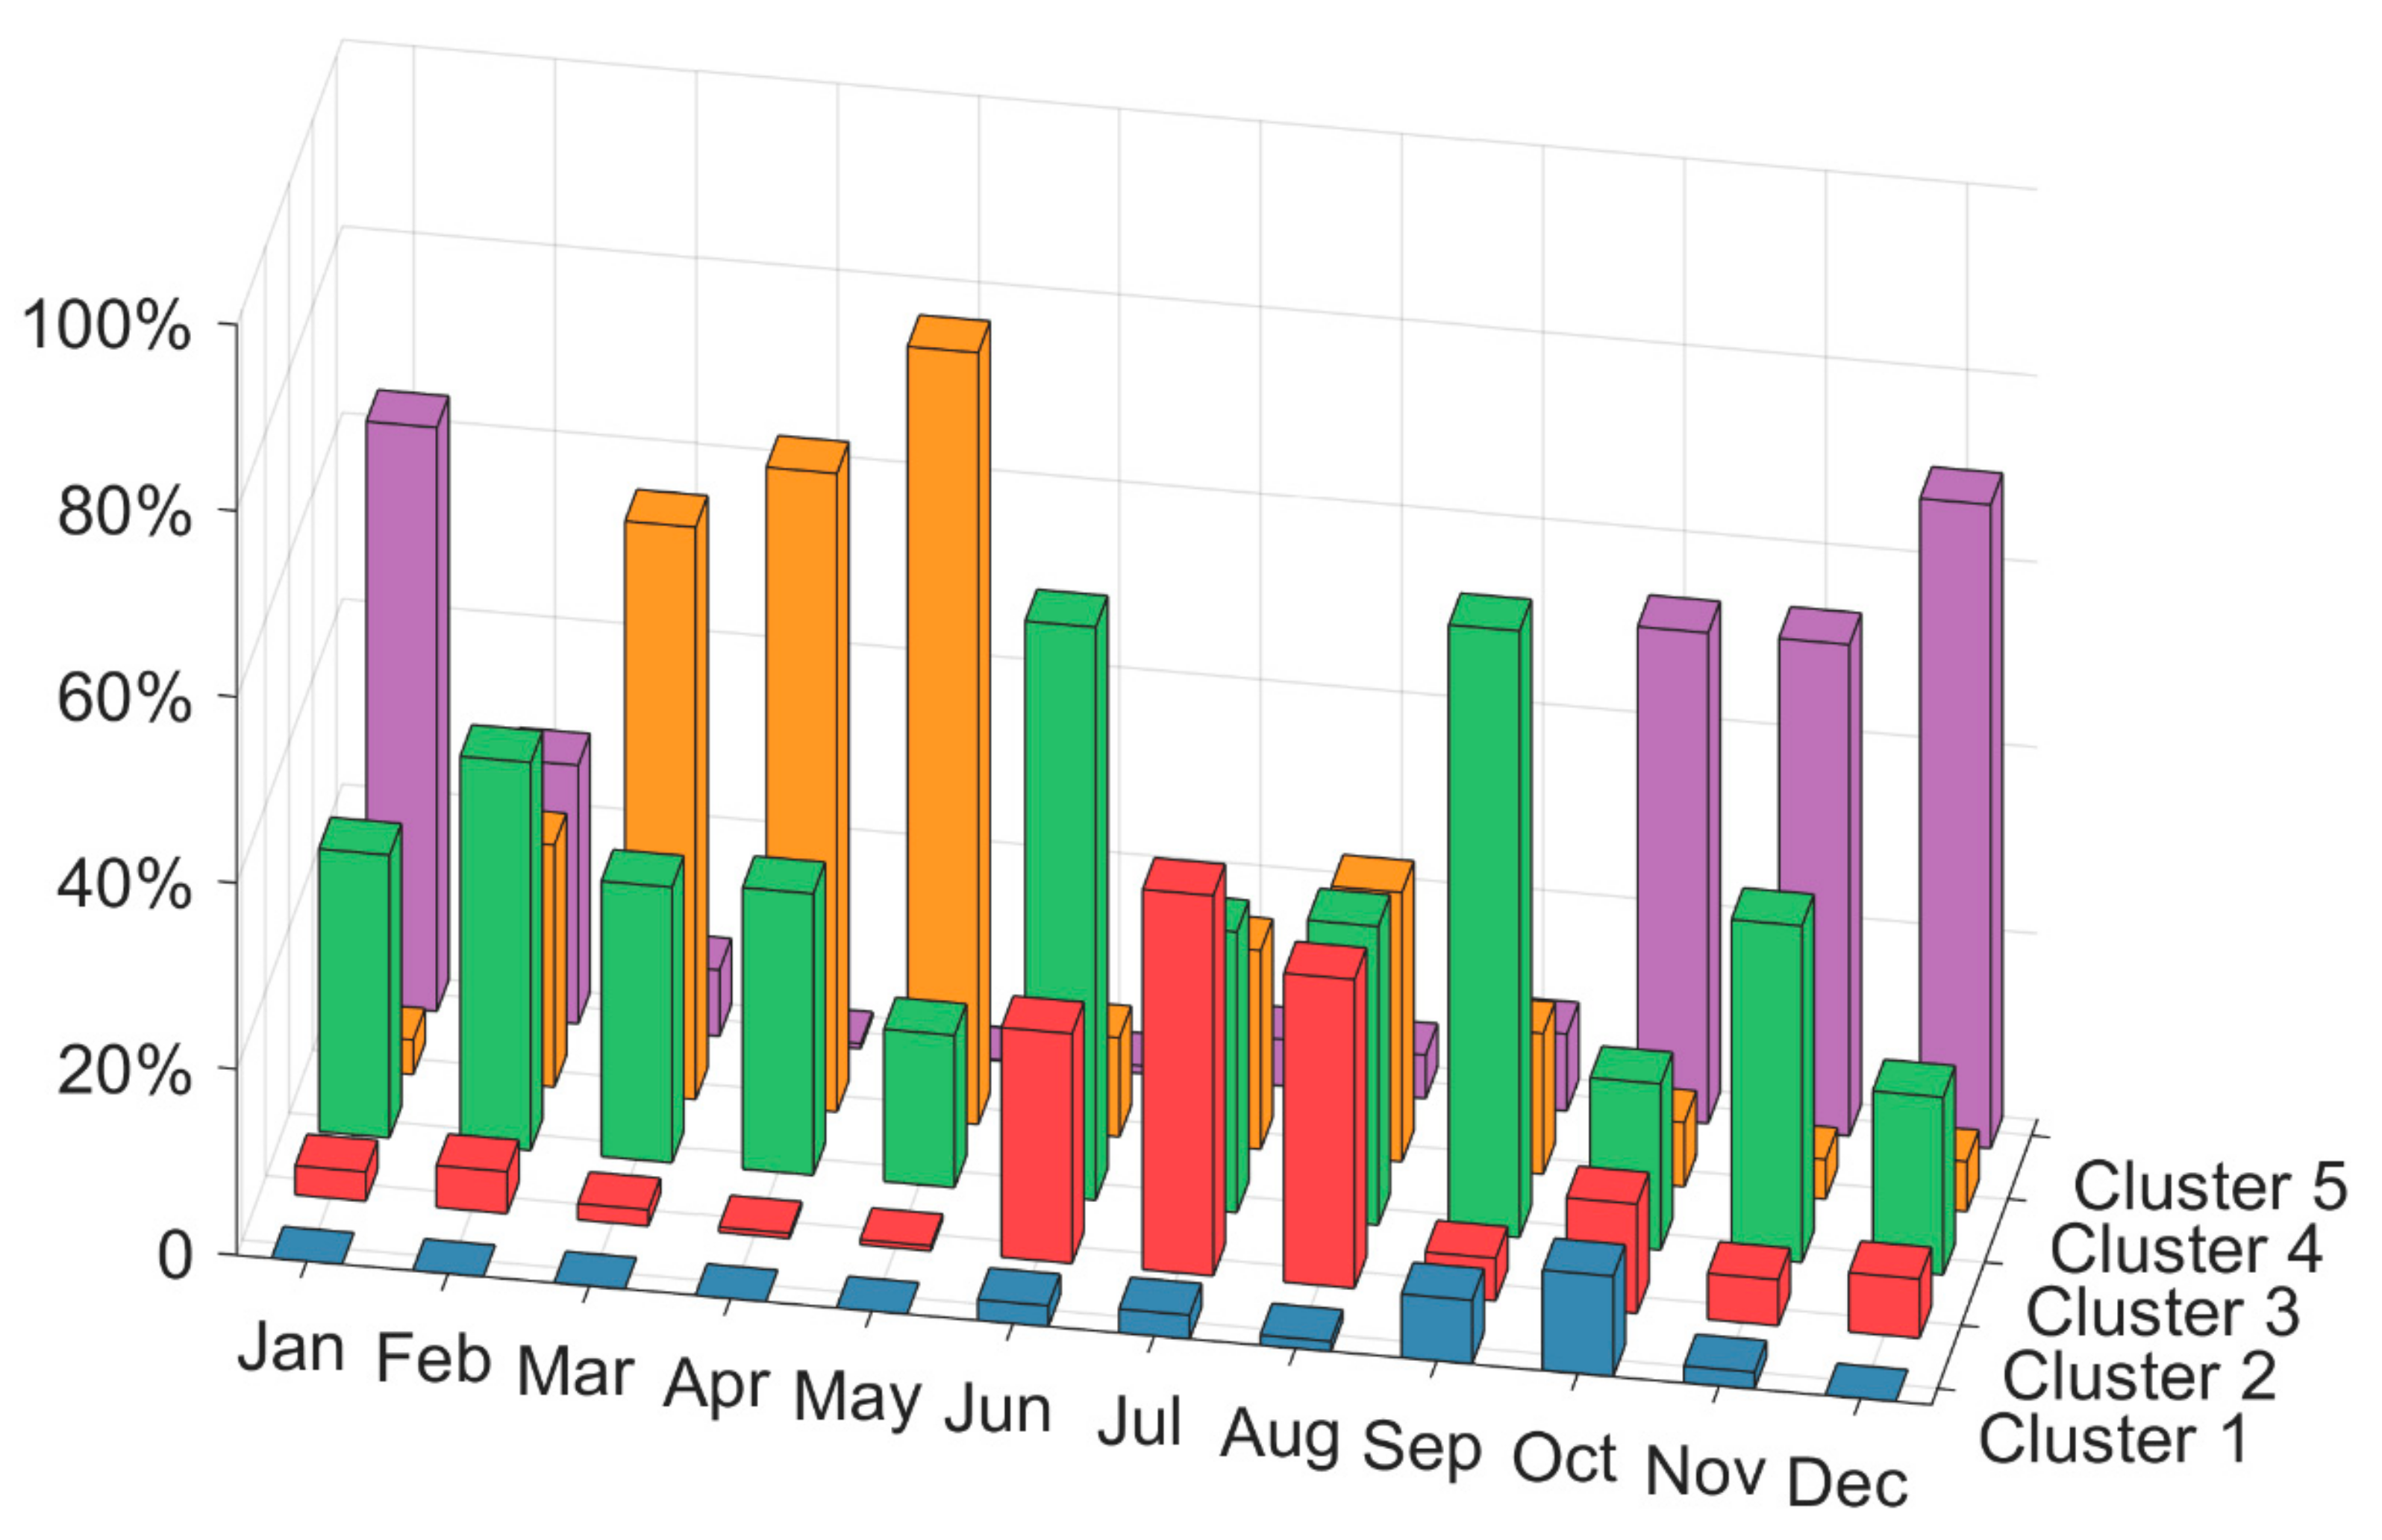
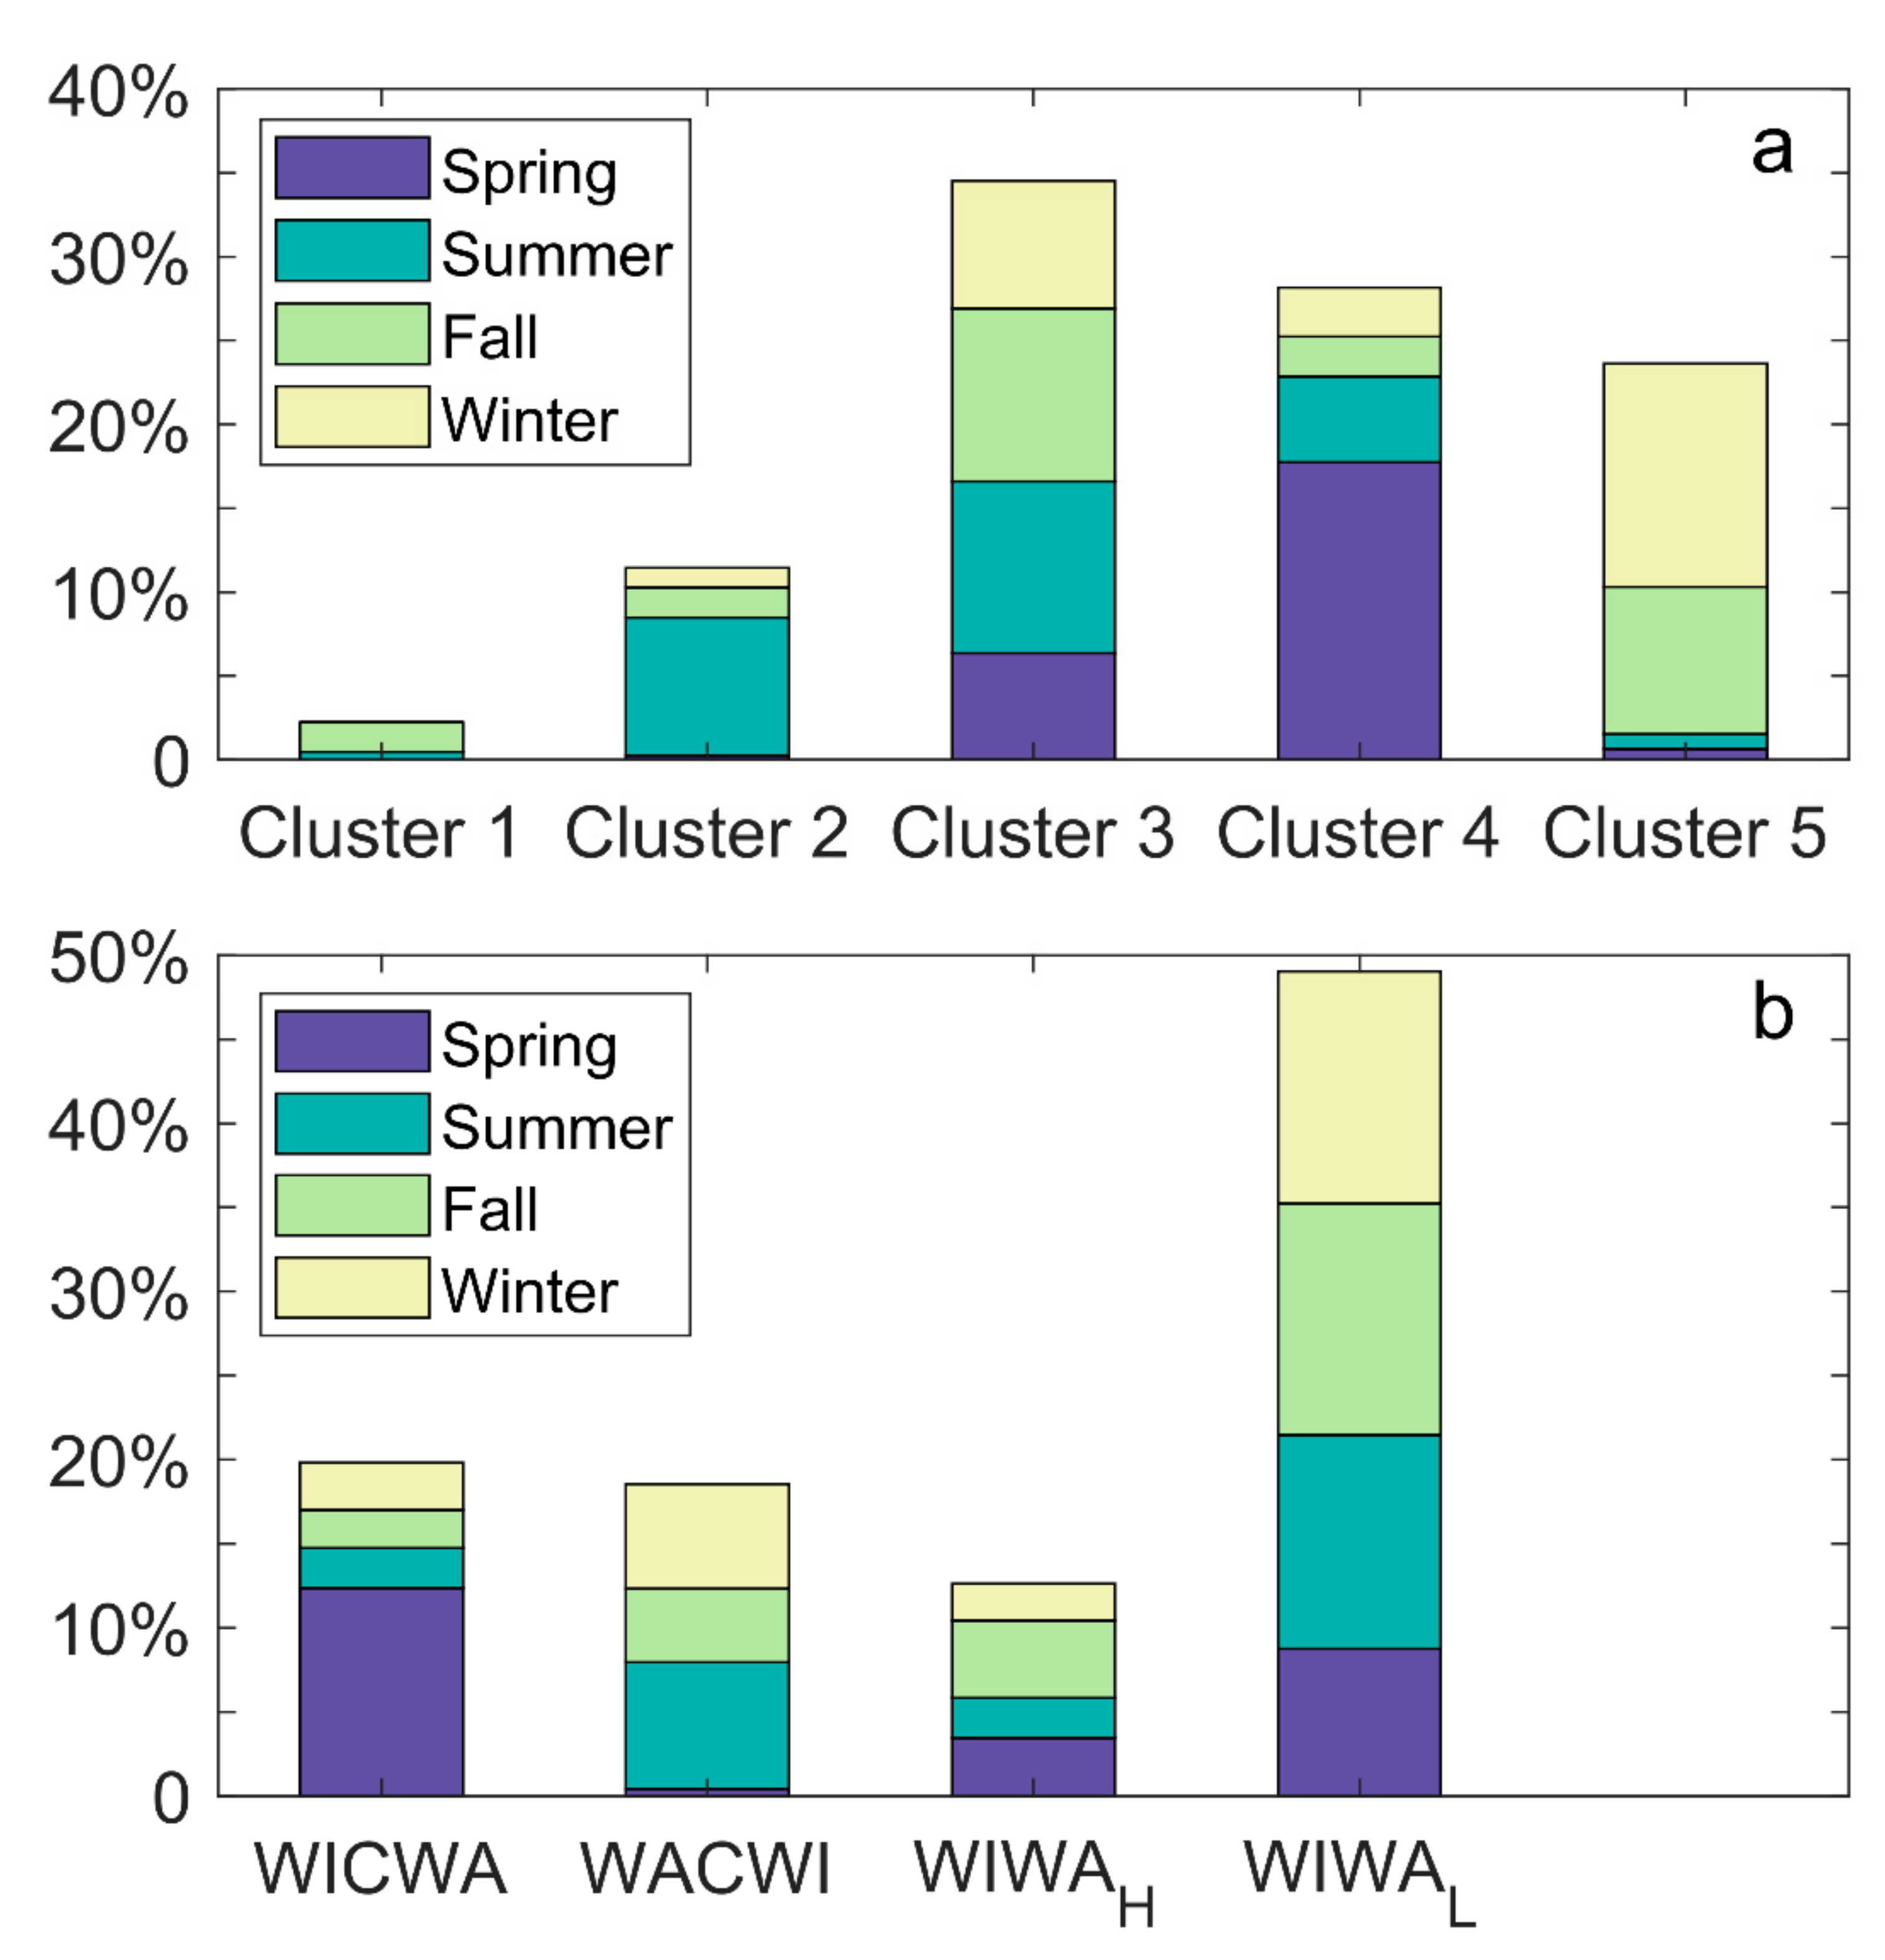
3.2. Classification of the Meteo-Climatic Conditions
4. Conclusions
Author Contributions
Funding
Data Availability Statement
Acknowledgments
Conflicts of Interest
References
- Borthwick, A.G.L. Marine eenewable energy seascape. Engineering 2016, 2, 69–78. [Google Scholar] [CrossRef] [Green Version]
- Pérez-Collazo, C.; Greaves, D.; Iglesias, G. A review of combined wave and offshore wind energy. Renew. Sustain. Energy Rev. 2015, 42, 141–153. [Google Scholar] [CrossRef] [Green Version]
- Albert, L. Wave and Wind Are the New Hybrid Renewable Energy Source; Seabased: Uppsala, Sweden, 2020; Available online: https://seabased.com/news-insights/wave-and-wind-are-the-new-hybrid-renewable-energy-source (accessed on 7 July 2020).
- Robertson, B.; Dunkle, G.; Gadasi, J.; Garcia-Medina, G.; Yang, Z. Holistic marine energy resource assessments: A wave and offshore wind perspective of metocean conditions. Renew. Energy 2021, 170, 286–301. [Google Scholar] [CrossRef]
- Wen, Y.; Kamranzad, B.; Lin, P. Joint exploitation potential of offshore wind and wave energy along the south and southeast coasts of China. Energy 2022, 249, 123710. [Google Scholar] [CrossRef]
- Rasool, S.; Muttaqi, K.M.; Sutanto, D.; Hemer, M. Quantifying the reduction in power variability of co-located offshore wind-wave farms. Renew. Energy 2022, 185, 1018–1033. [Google Scholar] [CrossRef]
- Azzellino, A.; Lanfredi, C.; Riefolo, L.; De Santis, V.; Contestabile, P.; Vicinanza, D. Combined exploitation of offshore wind and wave energy in the Italian Seas: A spatial planning approach. Front. Energy Res. 2019, 7, 42. [Google Scholar] [CrossRef] [Green Version]
- Ferrari, F.; Besio, G.; Cassola, F.; Mazzino, A. Optimized wind and wave energy resource assessment and offshore exploitability in the Mediterranean Sea. Energy 2020, 190, 116447. [Google Scholar] [CrossRef]
- Lira-Loarca, A.; Ferrari, F.; Mazzino, A.; Besio, G. Future wind and wave energy resources and exploitability in the Mediterranean Sea by 2100. Appl. Energy 2021, 302, 117492. [Google Scholar] [CrossRef]
- Widén, J.; Carpman, N.; Castellucci, V.; Lingfors, D.; Olauson, J.; Remouit, F.; Bergkvist, M.; Grabbe, M.; Waters, R. Variability assessment and forecasting of renewables: A review for solar, wind, wave and tidal resources. Renew. Sustain. Energy Rev. 2015, 44, 356–375. [Google Scholar] [CrossRef]
- Astariz, S.; Iglesias, G. The collocation feasibility index–A method for selecting sites for co-located wave and wind farms. Renew. Energy 2017, 103, 811–824. [Google Scholar] [CrossRef] [Green Version]
- Contestabile, P.; Russo, S.; Azzellino, A.; Cascetta, F.; Vicinanza, D. Combination of local sea winds/land breezes and nearshore wave energy resource: Case study at MaRELab (Naples, Italy). Energy Convers. Manag. 2022, 257, 115356. [Google Scholar] [CrossRef]
- Wan, Y.; Fan, C.; Dai, Y.; Li, L.; Sun, W.; Zhou, P.; Qu, X. Assessment of the joint development potential of wave and wind energy in the South China Sea. Energies 2018, 11, 398. [Google Scholar] [CrossRef] [Green Version]
- Fairley, I.; Lewis, M.; Robertson, B.; Hemer, M.; Masters, I.; Horrillo-Caraballo, J.; Karunarathna, H.; Reeve, D.E. A classification system for global wave energy resources based on multivariate clustering. Appl. Energy 2020, 262, 114515. [Google Scholar] [CrossRef]
- Li, B.; Chen, W.; Li, J.; Liu, J.; Shi, P. Integrated monitoring and assessments of marine energy for a small uninhabited island. Energy Rep. 2022, 8, 63–72. [Google Scholar] [CrossRef]
- Planton, S. (Ed.) IPCC Annex III: Glossary. In Climate Change 2013: The Physical Science Basis. Contribution of Working Group I to the Fifth Assessment Report of the Intergovernmental Panel on Climate Change; Cambridge University Press: Cambridge, UK; New York, NY, USA, 2013; Available online: https://web.archive.org/web/20160524223615/http://www.ipcc.ch/pdf/assessment-report/ar5/wg1/WG1AR5_AnnexIII_FINAL.pdf (accessed on 4 July 2022).
- Cornett, A.M. A global wave energy resource assessment. In Proceedings of the 18th International Conference on Offshore and Polar Engineering, Vancouver, BC, Canada, 6–11 July 2008; The International Society of Offshore and Polar Engineers: Vancouver, BC, Canada, 2008; Volume 1, pp. 318–326. [Google Scholar]
- Large, W.G.; Pond, P. Open ocean momentum flux measurements in moderate to strong winds. J. Phys. Oceanogr. 1981, 11, 324–336. [Google Scholar] [CrossRef] [Green Version]
- Sutton, A.J.; Wanninkhof, R.; Sabine, C.L.; Feely, R.A.; Cronin, M.F.; Weller, R.A. Variability and trends in surface seawater pCO2 and CO2 flux in the Pacific Ocean. Geophys. Res. Lett. 2017, 44, 5627–5636. [Google Scholar] [CrossRef] [Green Version]
- Zheng, C.W.; Pan, J.; Li, J.X. Assessing the China Sea wind energy and wave energy resources from 1988 to 2009. Ocean Eng. 2013, 65, 39–48. [Google Scholar] [CrossRef]
- Chen, X.; Wang, K.; Zhang, Z.; Zeng, Y.; Zhang, Y.; O’Driscoll, K. An assessment of wind and wave climate as potential sources of renewable energy in the nearshore Shenzhen coastal zone of the South China Sea. Energy 2017, 134, 789–801. [Google Scholar] [CrossRef] [Green Version]
- Wang, Z.; Duan, C.; Dong, S. Long-term wind and wave energy resource assessment in the South China sea based on 30-year hindcast data. Ocean Eng. 2018, 163, 58–75. [Google Scholar] [CrossRef]
- Wang, H.; Fu, D.; Liu, D.; Xiao, X.; Liu, B. Analysis and prediction of significant wave height in the Beibu Gulf, South China Sea. J. Geophys. Res. Ocean. 2021, 126, e2020JC017144. [Google Scholar] [CrossRef]
- Li, B.; Li, J.; Liu, J.; Tang, S.; Chen, W.; Shi, P.; Liu, Y. Calibration experiments of CFOSAT wavelength in the Southern South China Sea by artificial neural networks. Remote Sens. 2022, 14, 773. [Google Scholar] [CrossRef]


| Hs | Tp | Wavedir | Wsp | U | |
| Hs | 1 | ||||
| Tp | 0.253 ** | 1 | |||
| Wavedir | 0.204 ** | 0.064 ** | 1 | ||
| Wsp | 0.345 ** | −0.130 ** | −0.215 ** | 1 | |
| U | 0.108 ** | −0.252 ** | −0.320 ** | 0.624 ** | 1 |
| V | −0.130 ** | 0.408 ** | 0.152 ** | −0.234 ** | −0.237 ** |
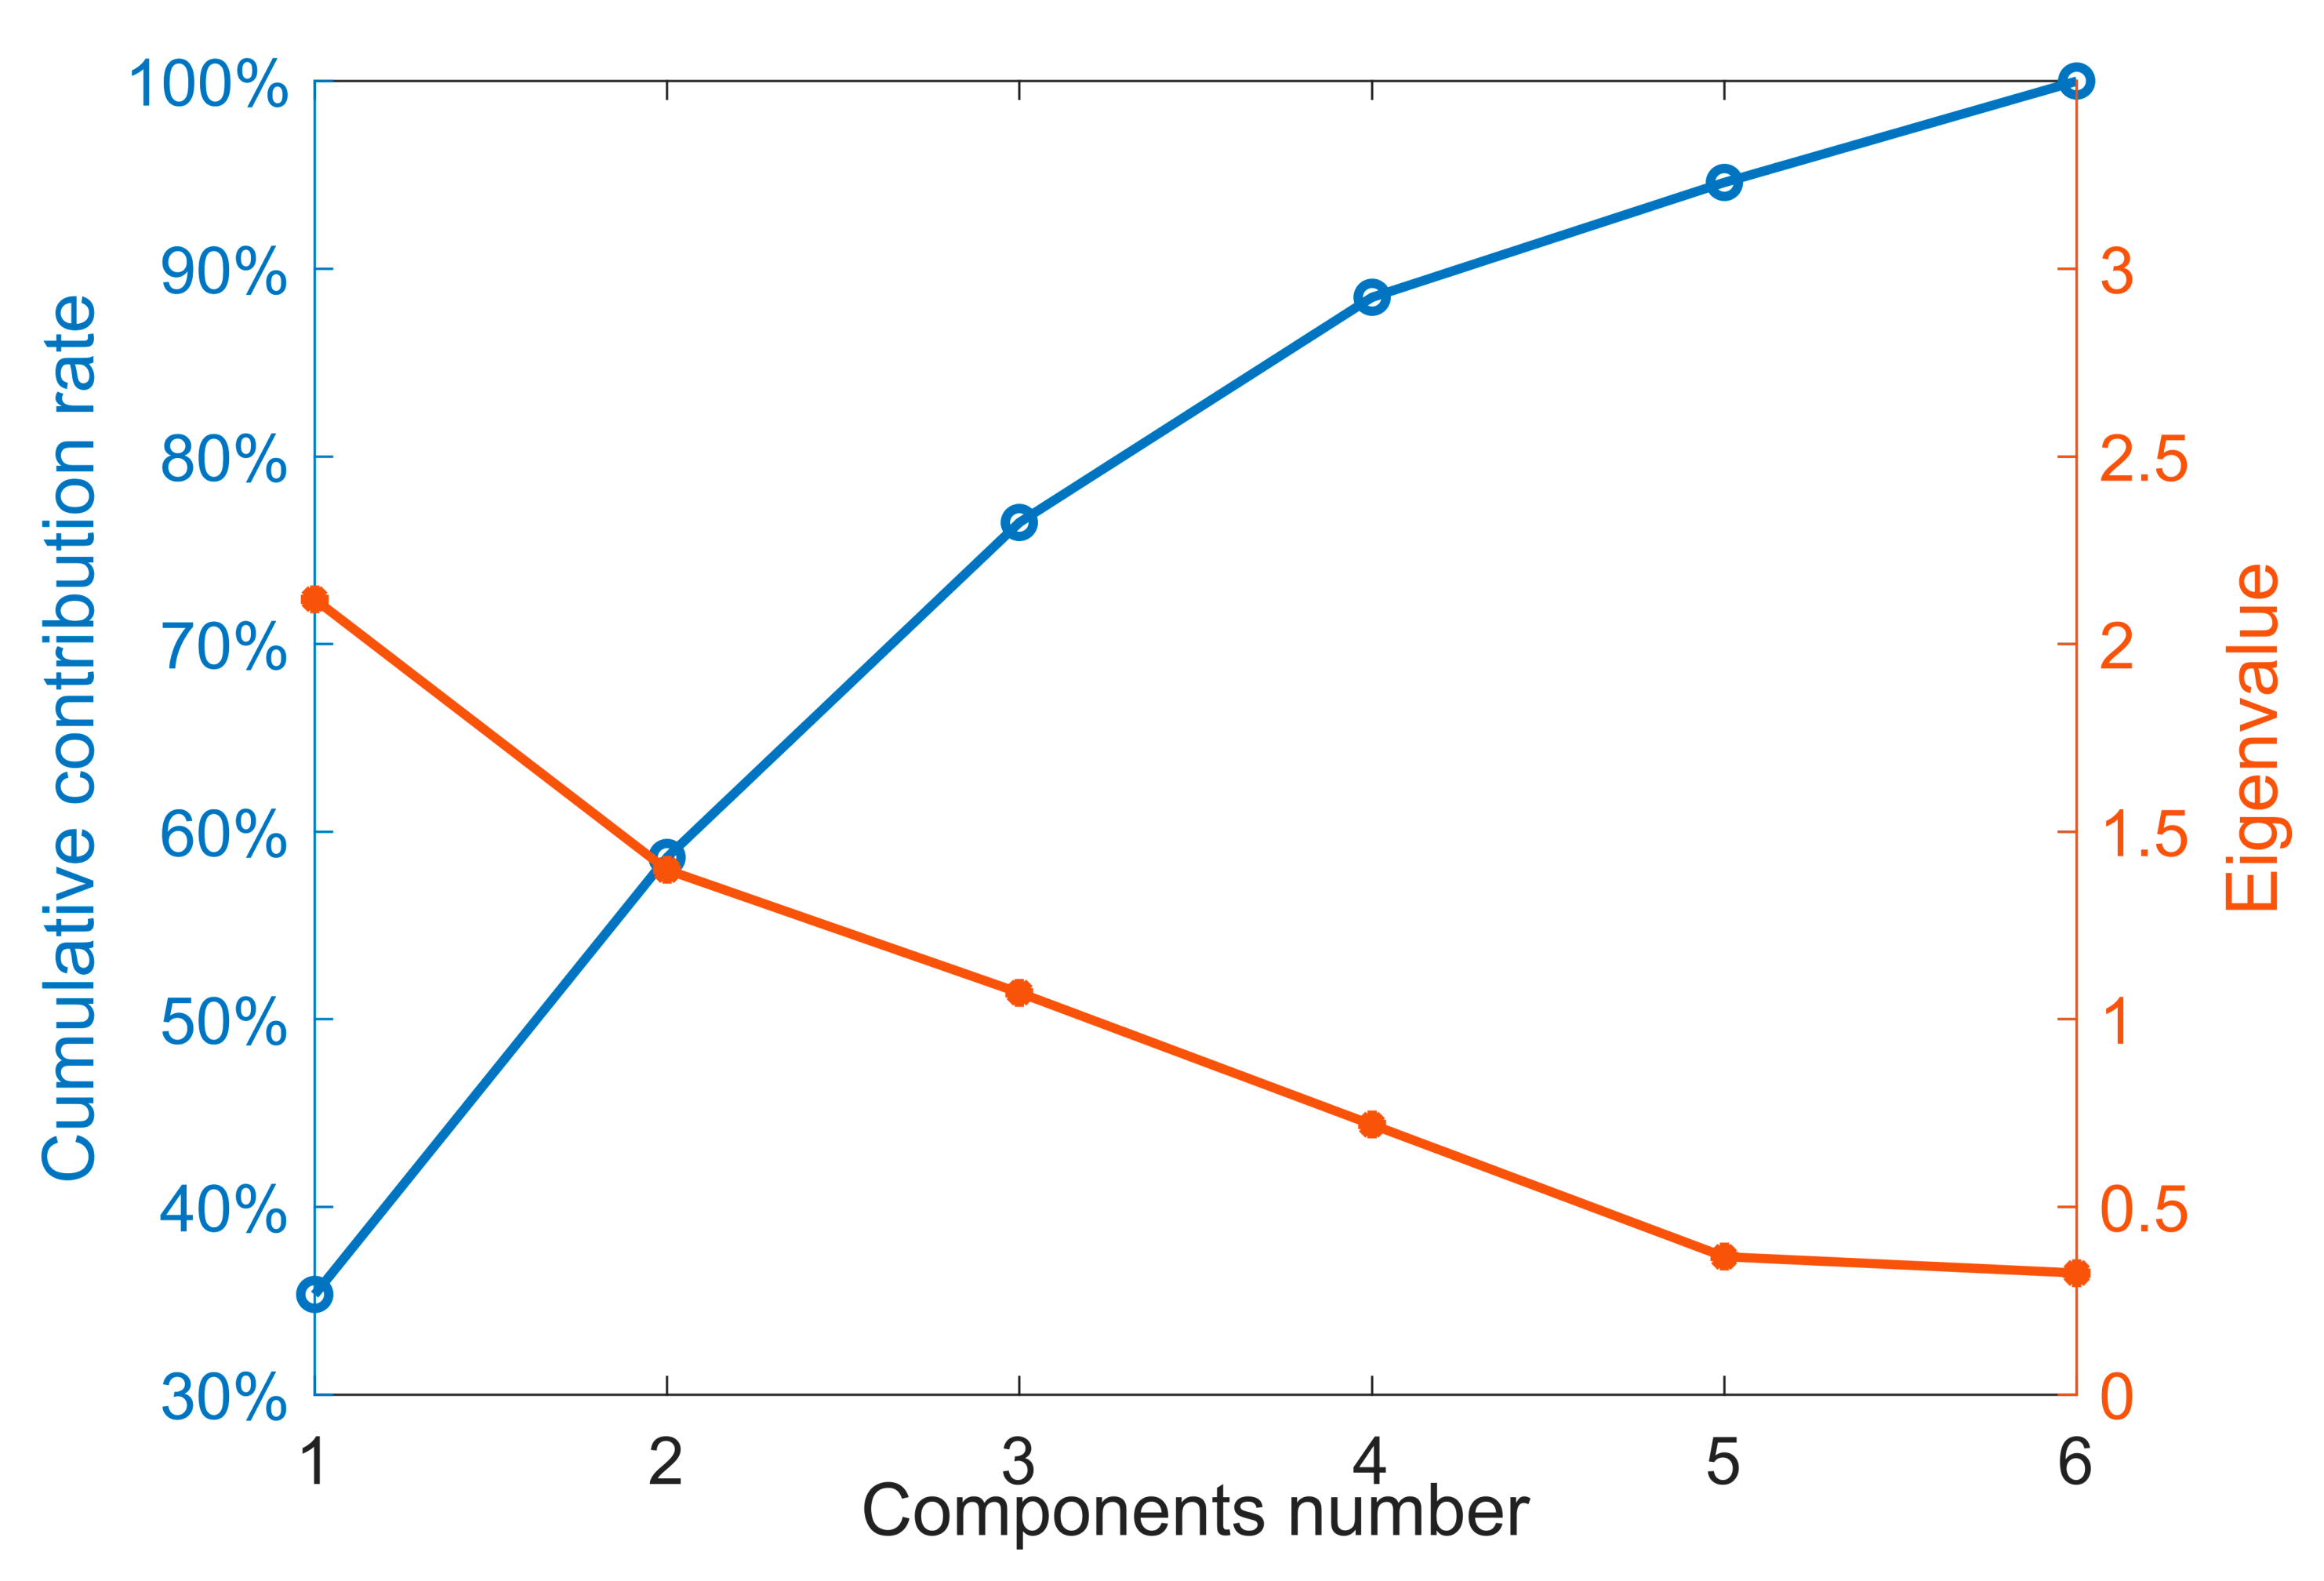
| Component | 1 | 2 | 3 | |
|---|---|---|---|---|
| Contribution rate | 35.33% | 23.31% | 17.85% | |
| Eigenvalue | 2.12 | 1.40 | 1.07 | |
| Loading | Hs | 0.722 | ||
| Tp | 0.512 | |||
| Wavedir | 0.634 | |||
| Wsp | 0.540 | |||
| U | 0.564 | |||
| V | −0.518 | |||
| Hs | Tp | Wsp | p | ||
| Cluster 1 | Hs | 1 | 0.486 ** | 0.143 * | |
| N = 217 | Tp | 1 | 0.138 * | ||
| J | 0.153 * | ||||
| Cluster 2 | Hs | 1 | 0.155 ** | 0.154 ** | |
| N = 1292 | Tp | 1 | −0.031 | ||
| J | 0.187 ** | ||||
| Cluster 3 | Hs | 1 | 0.208 ** | 0.050 ** | |
| N = 3514 | Tp | 1 | −0.229 ** | ||
| J | −0.076 ** | ||||
| Cluster 4 | Hs | 1 | 0.461 ** | 0.319 ** | |
| N = 3080 | Tp | 1 | −0.126 | ||
| J | 0.202 ** | ||||
| Cluster 5 | Hs | 1 | −0.106 ** | 0.226 ** | |
| N = 1588 | Tp | 1 | −0.053 * | ||
| J | 0.241 ** | ||||
| Total | Hs | 1 | 0.253 ** | 0.345 ** | |
| N = 9691 | Tp | 1 | −0.130 ** | ||
| J | 0.287 ** |
| Value via Formula (5) | J (W m−2) | P (kW m−1) | r (J, p) | |||
|---|---|---|---|---|---|---|
| Mean | Cv | Mean | Cv | |||
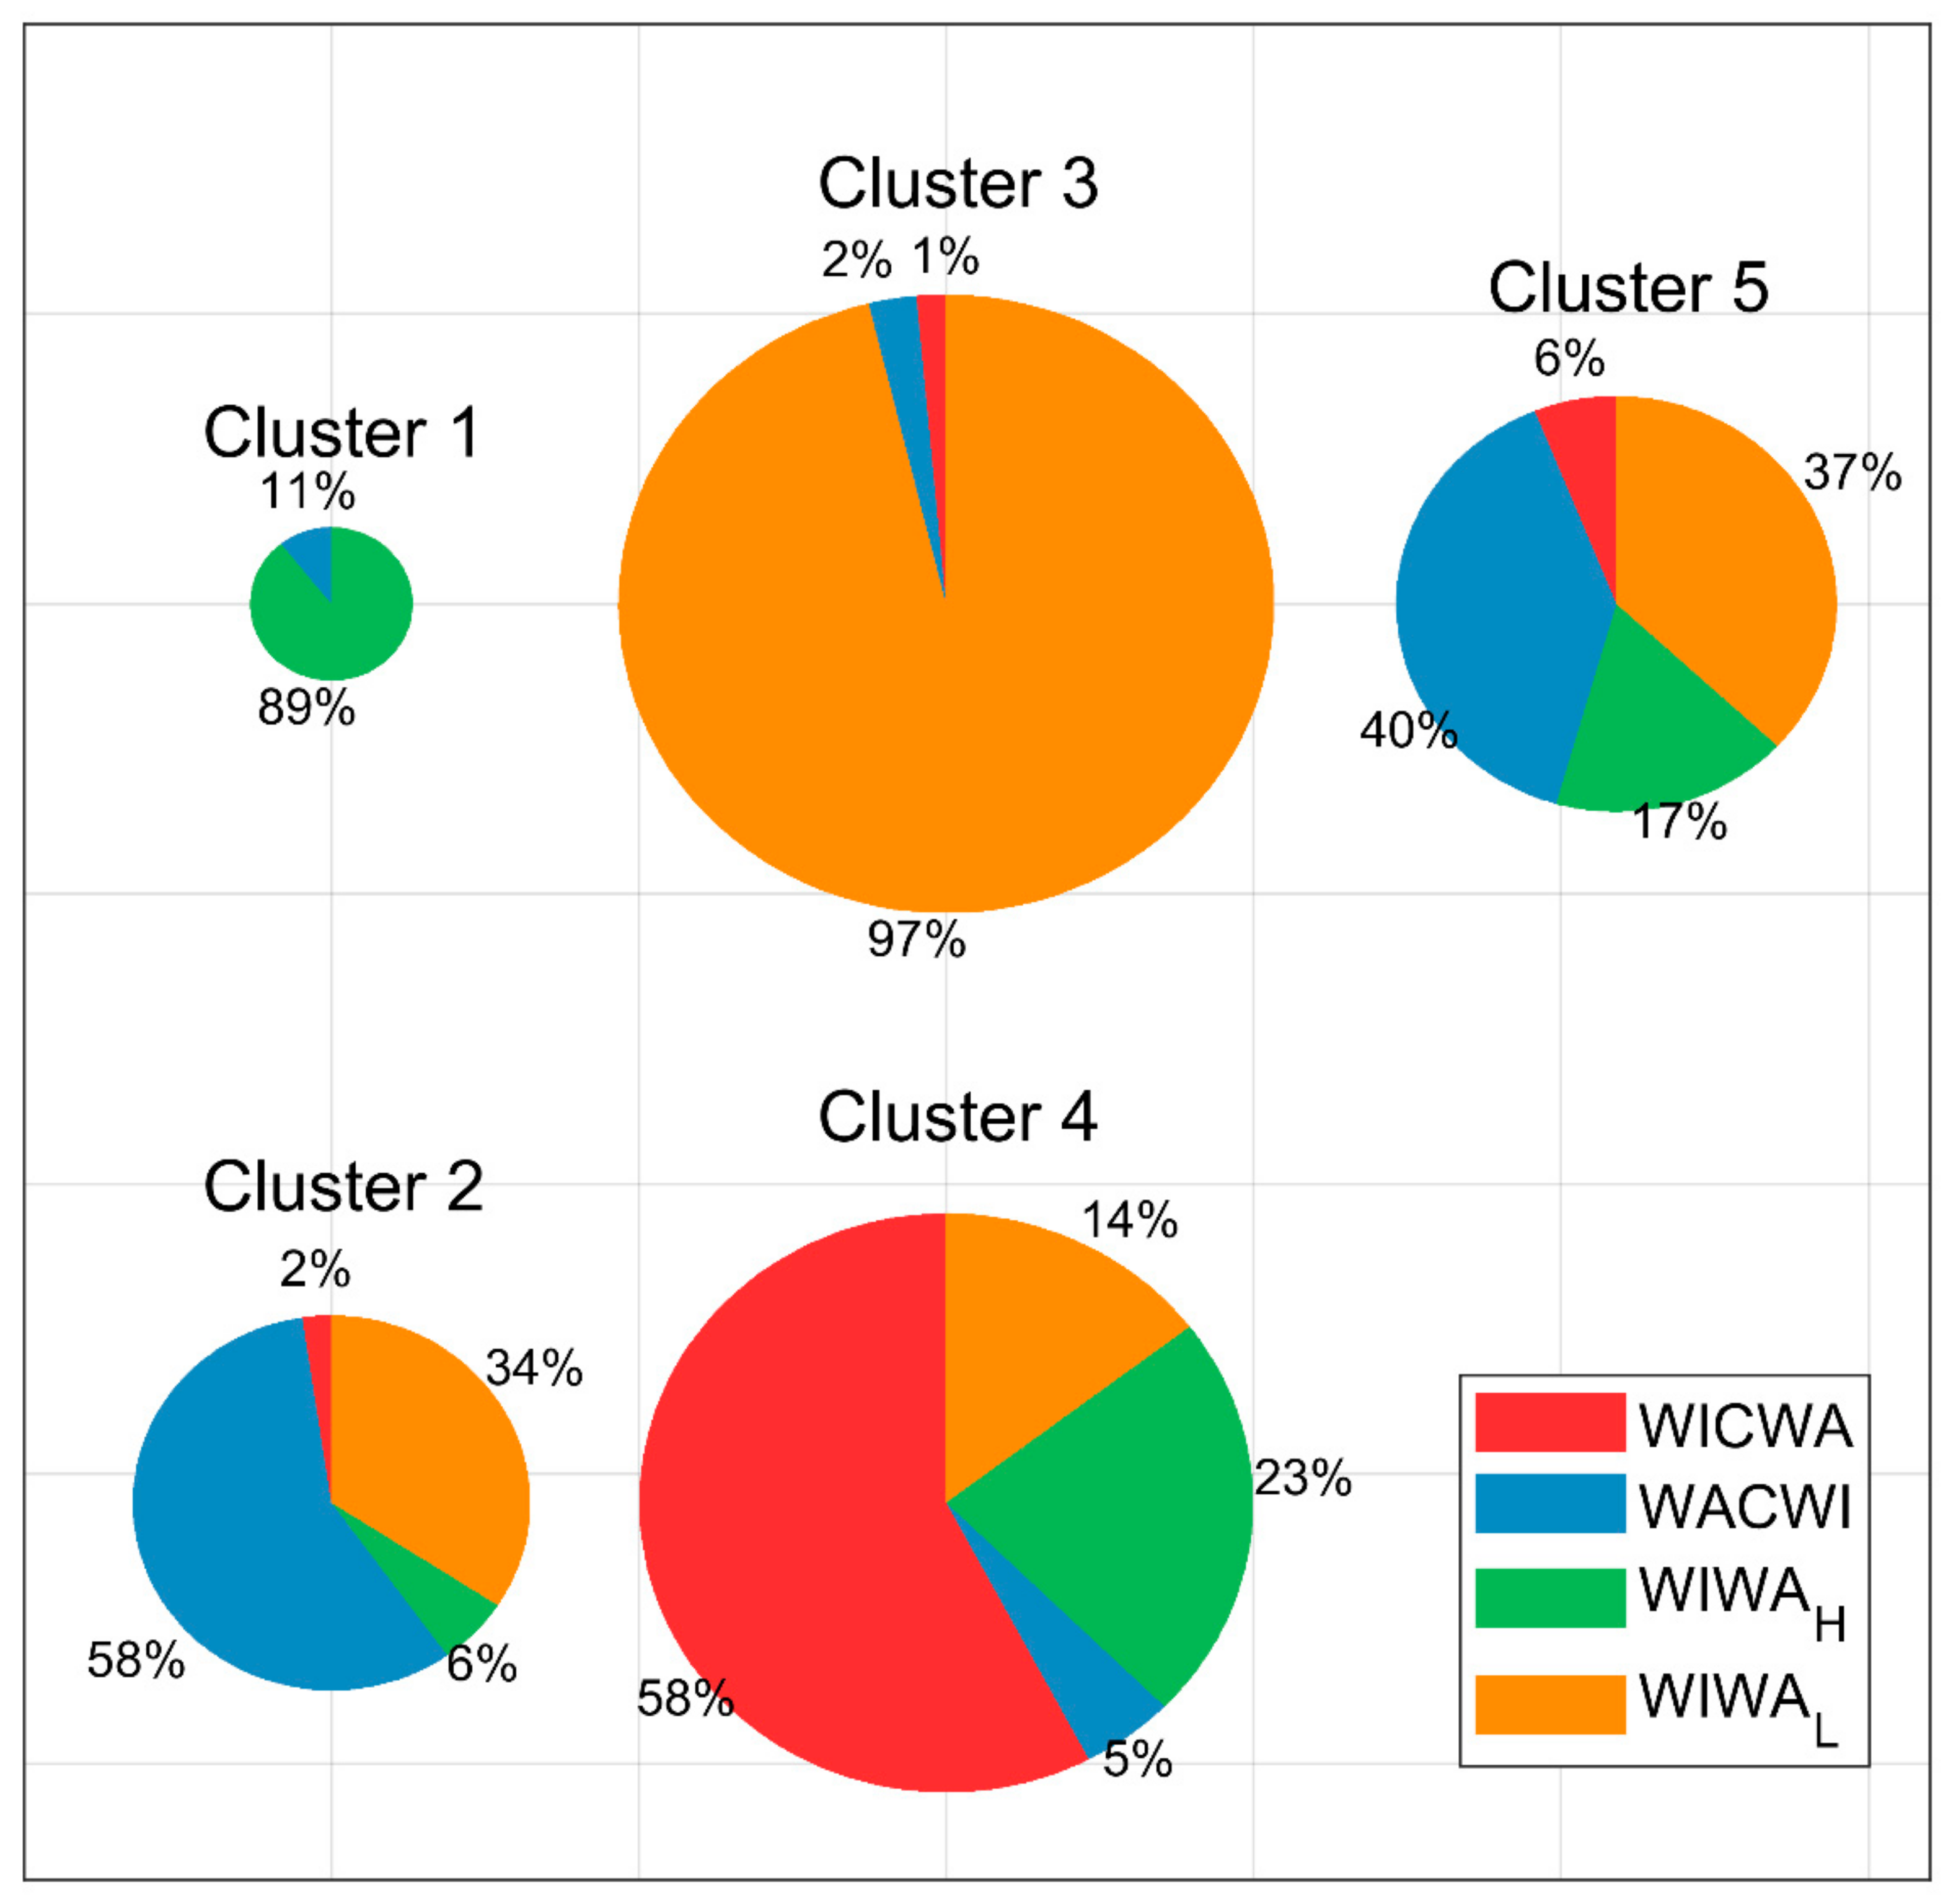
| WICWA (J > 80, p < 2) N = 1954 | 20.16% | 166.043 | 0.5043 | 1.091 | 0.450 | 0.317 ** |
| WACWI (J < 80, p > 2) N = 1629 | 16.81% | 24.457 | 0.930 | 3.515 | 0.566 | 0.030 |
| WIWAH (J > 80, p > 2) N = 1250 | 12.90% | 217.591 | 0.652 | 4.244 | 1.024 | 0.259 ** |
| WIWAL (J < 80, p < 2) N = 4858 | 50.13% | 25.830 | 0.850 | 0.789 | 0.685 | 0.045 ** |
| Total N = 9691 | 100% | 78.604 | 1.289 | 1.754 | 1.297 | 0.287 ** |
Publisher’s Note: MDPI stays neutral with regard to jurisdictional claims in published maps and institutional affiliations. |
© 2022 by the authors. Licensee MDPI, Basel, Switzerland. This article is an open access article distributed under the terms and conditions of the Creative Commons Attribution (CC BY) license (https://creativecommons.org/licenses/by/4.0/).
Share and Cite
Li, B.; Li, J.; Chen, W.; Liu, J.; Shi, P. Meteo-Climatic Conditions of Wind and Wave in the Perspective of Joint Energy Exploitation: Case Study of Dongluo Island, Hainan. Atmosphere 2022, 13, 1076. https://doi.org/10.3390/atmos13071076
Li B, Li J, Chen W, Liu J, Shi P. Meteo-Climatic Conditions of Wind and Wave in the Perspective of Joint Energy Exploitation: Case Study of Dongluo Island, Hainan. Atmosphere. 2022; 13(7):1076. https://doi.org/10.3390/atmos13071076
Chicago/Turabian StyleLi, Bo, Junmin Li, Wuyang Chen, Junliang Liu, and Ping Shi. 2022. "Meteo-Climatic Conditions of Wind and Wave in the Perspective of Joint Energy Exploitation: Case Study of Dongluo Island, Hainan" Atmosphere 13, no. 7: 1076. https://doi.org/10.3390/atmos13071076
APA StyleLi, B., Li, J., Chen, W., Liu, J., & Shi, P. (2022). Meteo-Climatic Conditions of Wind and Wave in the Perspective of Joint Energy Exploitation: Case Study of Dongluo Island, Hainan. Atmosphere, 13(7), 1076. https://doi.org/10.3390/atmos13071076