Article

The Impact of High-Resolution SRTM Topography and Corine Land Cover on Lightning Calculations in WRF

1
MetClim, 21025 Varese, Italy
2
Space and Atmospheric Sciences Division, Physical Research Laboratory, Ahmedabad 380009, India
3
Aryabhatta Research Institute of Observational Sciences (ARIES), Nainital 26300, India
4
Royal Meteorological Institute of Belgium, 1180 Brussels, Belgium
5
Atmospheric Chemistry Department, Max Planck Institute for Chemistry, 55131 Mainz, Germany
*
Author to whom correspondence should be addressed.
Atmosphere 2022, 13(7), 1050; https://doi.org/10.3390/atmos13071050
Submission received: 26 April 2022 / Revised: 23 June 2022 / Accepted: 29 June 2022 / Published: 30 June 2022
(This article belongs to the Section Meteorology)

Abstract

:
The goal of this study is to investigate the impact of high-resolution SRTM and Corine Land Cover on the number of cloud–ground lightning flashes and their spatial distribution simulated by a numerical weather-prediction model. Two lightning episodes were selected: (1) over a non-complex terrain and (2) over a complex terrain, the Alps. Significant discrepancies were found in the geographical distribution of the land-cover classes and also in the topography between Corine Land Cover and 30-arc seconds USGS. In general, the timing and the spatial distribution of Cloud-to-Ground (CG) lightning by the model were well-represented when compared to the observations. In general, more CG flashes were calculated by the simulation with USGS Land Cover and topography than the simulation with Corine Land Cover and SRTM topography. It appears that the differences in sensible and latent heat fluxes between the simulations were caused by the differences in land-cover classes. Moreover, differences in the vertical wind speeds, specific humidity, temperature and the convective available potential energy were found when compared to observations, resulting in the differences in cloud–ground lightning flashes between the simulation with the SRTM topography and Corine Land Cover and the simulation with the USGS Land Cover and topography. Using the high-resolution land cover and topography data may help to reduce uncertainties in CG lightning calculations by the model.

1. Introduction

Climate change will impact the global mean temperatures, sea level, heat content of the oceans and precipitation profiles, with a likely increase in the frequency and intensity of precipitation episodes in Europe and North America [1]. Heavy precipitation episodes or thunderstorms are often accompanied by hail and lightning activity. A study by [2] showed that current climate models predict a 12 ± 5% increase per degree Celsius per year and a 50% increase in lightning flashes across the United States by 2100 as a result of global warming (RCP8.5 scenario). Meanwhile, [3] found, in general, a decrease of 15% in total lightning flash rate in 2100, related to uncertainties in cloud ice and microphysics processes. Industries, the service sector (e.g., hospitals, telecom and electricity power supply networks), farms, aviation and urban areas (and individuals) are exposed to the potential damages that lightning can cause. Moreover, wildfires are often initiated by lightning [4,5,6], and lightning plays an important role in the production of atmospheric nitrogen oxides [7], which contribute to the formation of tropospheric ozone [8]. The convective available potential energy (CAPE; [9,10]), together with precipitation rates, is often used to estimate the potential of thunderstorms and lightning. Updrafts, downdrafts and cloud microphysics play important roles in the build-up of electrical charges in convective clouds (by the formation of ascending water droplets and collisions with descending ice particles), causing a separation of electrical charges between the water droplets and ice particles [11,12,13]. Recent studies investigated the sensitivity of different dynamics in cloud formation and reduced the uncertainties of cloud microphysics [14,15,16,17,18,19,20,21,22,23,24,25,26,27,28,29,30,31,32,33,34,35,36], planetary boundary layer (PBL) development [37,38,39,40,41,42], and many more. However, the impact of land surface types and topography on meteorological variables and lightning has received less attention and is therefore less understood. The accuracy of input land-use classifications can affect simulated meteorological parameters, such as wind fields and temperature near the surface [42]. A study by [43] evaluated the impact of the high-resolution Shuttle Radar Topography Mission (SRTM) (90 × 90 m; Ref. [44]) and Corine Land Cover (100 × 100 m; [45,46,47]) on simulated meteorological parameters in the Weather Research Forecast model (WRF) [48,49] by comparing it with a simulation using the 30-arc seconds USGS Land Cover and topography and comparing both simulations with observations. That study showed large differences in the fraction of urban built-up areas between the Corine Land Cover and USGS Land Cover, which impacted the calculated meteorological parameters. For example, the simulation with the SRTM and Corine Land Cover resulted in lower wind speeds and showed a better agreement with the observations. Moreover, differences in precipitation quantities, temperature at 2 m, sensible and latent heat fluxes, and the related PBL were found. A follow-up study by [50] investigated the impact of the SRTM and Corine Land Cover on gas and PM10 calculations in WRF-Chem [51,52]. The authors found a better agreement with the observations for CO, NO, SO2 and PM10 concentrations over the Po Valley, due to the reduced wind speeds and differences in PBL heights, when compared to the simulation with the USGS topography and land cover. Therefore, improved simulations of meteorological variables (precipitation, vertical wind profiles, temperature, heat fluxes, PBL development, cloud formation and dissipation) can also reduce the uncertainties in the calculation of lightning. A study by [53] implemented the calculations of lightning based on [54], which uses the cloud-top height and the vertical updraft velocity via the cumulus parameterization scheme. The authors of Ref. [55] studied 10 different lightning episodes over Greece and found that WRF, in general, overestimates the number of cloud-to-ground lightning flashes, mainly related to the calculations of the cloud-top height in [54], the vertical velocity and CAPE values.
To the authors’ knowledge, the investigation of the impact of land-surface classes and topography on lightning calculations has not yet been reported.
The goal of this study is to investigate the impact of high-resolution SRTM and Corine Land Cover on the number of CG lightning flashes and their spatial distribution by WRF. In order to investigate this, the simulations are compared with the results of the WRF simulation using the standard 30-arc seconds United States Geological Survey (USGS) Land Cover and topography [56], and both simulations are compared to lightning observations (more information on the observations are given in Section 3). Two severe lightning episodes are studied, one over Belgium on 18 August 2011 (causing fatalities during a festival), and the second one over the Alps on 29 July 2013.
In order to improve CG lightning calculations by numerical weather-prediction models (NWP), it is important to reduce the uncertainties in the physics and dynamics that contribute to the formation of convective clouds and lightning flashes. The present study is intended to explore the importance of topography and land-cover classes in CG lightning calculations, which may contribute to the improvement of the accuracy of CG lightning flashes by the NWPs.

2. Methodology

In this work, the WRF model (version 4.2.2, National Center for Atmospheric Research, Boulder, CO, USA) was used to investigate the impact of Corine Land Cover and high-resolution SRTM topography on simulated lightning flashes. The lightning parameterization used in the simulations was based on cloud top at 20 dBZ [54] (in WRF name list, lightning_option = 2). The updraft intensity, which is directly related to the lightning activity, is strongly correlated with cloud-top height. Processes that play an important role in the occurrence to lightning are microphysics, air pollution (acting as cloud condensation nuclei, impacting cloud droplet number), ice/graupel phase, latent heat fluxes and updraft [11]. In Section 2.1, more details on the WRF model are given. The model was applied on a 4 × 4 km resolution and with no nudging to the measurements of the meteorological stations. To investigate the importance of land-cover classes on lightning calculations, a severe weather lightning episode over a non-complex terrain was selected. On 18 August 2011 (Case I), a thunderstorm with lightning passed over the relatively flat terrain of Belgium, moving northeast towards Germany. Three simulations were performed, the first one with the USGS 30-arc seconds land-use data (~1 × 1 km) and GTOP 30-arc seconds topography data. The second one was performed with Corine Land Cover data only. The third one was performed with Corine Land Cover and SRTM topography.
Another episode (Case II) took place on 29 July 2013, when high lightning activity was observed over the complex terrain of the Alps. This episode helps us to investigate the effect of topography (surface elevation) on lightning calculations in WRF. Similar to Case I, we ran three simulations, one with USGS default land use and topography, the second with Corine Land Cover, and the third simulation with Corine and SRTM topography. Figure 1 presents the geographical position of the model grid domain for the two cases. The first column shows the default topographic height in the model (USGS), and the second column shows the difference between the USGS and the high-resolution topographic map from SRTM. Large differences were found in the topography height between SRTM and USGS over the Alps region (Case II); the impact of these differences on lightning flashes will be explained in Section 3.1.
In this work, we denote the simulation with Corine Land Cover as WRF_CLC and with Corine + SRTM as WRF_CLCS, while the simulation with 30-arc seconds is further denoted as WRF_USGS. To initialize the model, a spin-up time of two days was applied for the simulations. The model used meteorological initial conditions and lateral boundary conditions from European Centre for Medium-Range Weather Forecasts (ERA-5) at 6 h [52].
The USGS land-use data set was developed in 1993. Meanwhile, some of the urban areas in Europe have changed considerably. In 1985, the Directorate General of Environment of the European Commission initiated a program intended to provide consistent, localized geographical information on the land cover of the Member States of the European Community. The program was called the Corine Land Cover. Decision-makers recognize the Corine Land Cover as an essential reference data set for territorial and spatial analysis at different territorial levels [47].
A recent version of the Corine data (Corine Land Cover 2018) GeoTIFF file is used here. These data are available at 100 m resolution with Lambert Azimuthal Equal-Area projection (European Terrestrial Reference System 1989, (ETRS89)). These data were transformed to WGS84 and reclassified to USGS land-use/land-cover categories. The remapping from Corine to USGS was done following [57]. Data processing was done using QGIS, GDAL and Python. The Corine Land Cover data set can be found on: https://www.eea.europa.eu/data-and-maps/data/copernicus-land-monitoring-service-corine, accessed on 1 June 2022.
The topographic data with 3 s resolution (~90 m) based on the SRTM was downloaded from [58]. The GeoTIFF files contain 5° × 5° with the World Geodetic System of 1984 (WGS84) projection. The GDAL was used to merge the files, and data were further processed in python to make the data suitable for WPS-readable format.

2.1. Description of WRF

The WRF-ARW version 4.2.2 system is a non-hydrostatic model (with a hydrostatic option) that uses terrain following vertical coordinates based on hydrostatic pressure [49]. The geographical global terrestrial data sets for WRF include soil categories, terrain height, monthly albedo and vegetation fraction, land-use, snow albedo and slopes. The land-use proposed in this study was based on (i) the Corine 2018 Land Cover data set (100 × 100 m) and (ii) the 30-arc seconds United States Geological Survey (USGS) database, which corresponds to ~1 × 1 km. The horizontal resolution was set by the user in the pre-processing step in WPS.
The vertical discretization of WRF comprises 51 levels with model top at 10 hPa (about 18 km). For the simulations with Corine Land Cover (+SRTM) and WRF_USGS, the same microphysics and dynamics options were applied. The model was set up using a double-moment Morrison microphysics scheme [18], which calculates the mass mixing ratios and the number concentrations for five hydrometeor species (rain, graupel, cloud droplets, cloud ice and snow). The model used the Noah land surface model scheme [59], with soil, moisture and temperature in four layers, fractional snow cover and frozen soil physics, and heat and moisture fluxes for the PBL. The Mellor–Yamada–Janjic (MYJ, Janjic [60]) PBL scheme was used to set up the model. The MYJ scheme calculates the eddy diffusion coefficients, the mixing length, and the top of the PBL from the turbulence kinetic energy. It uses the Eta surface layer scheme [61,62], which is based on the similarity theory [63] and includes parameterizations of a viscous sub-layer.
The Rapid Radiative Transfer Model (RRTM) scheme [64] was used to account for long-wave radiation, while the Goddard scheme calculated the short-wave radiation [65]. The 5-layer thermal diffusion scheme was selected. It is recommended not to activate the cumulus scheme for grids smaller than 10 × 10 km [66]. Furthermore, the following lightning options were selected in the model: do_radar_ref = 1, lightning_option = 2, lightning_dt = 24, lightning_start_seconds = 600, flashrate_factor = 2, cellcount_method = 0, cldtop_adjustment = 2, iccg_method = 2. Explanation of these settings can be found in [67].

2.2. Land Coverage Differences between Corine and USGS

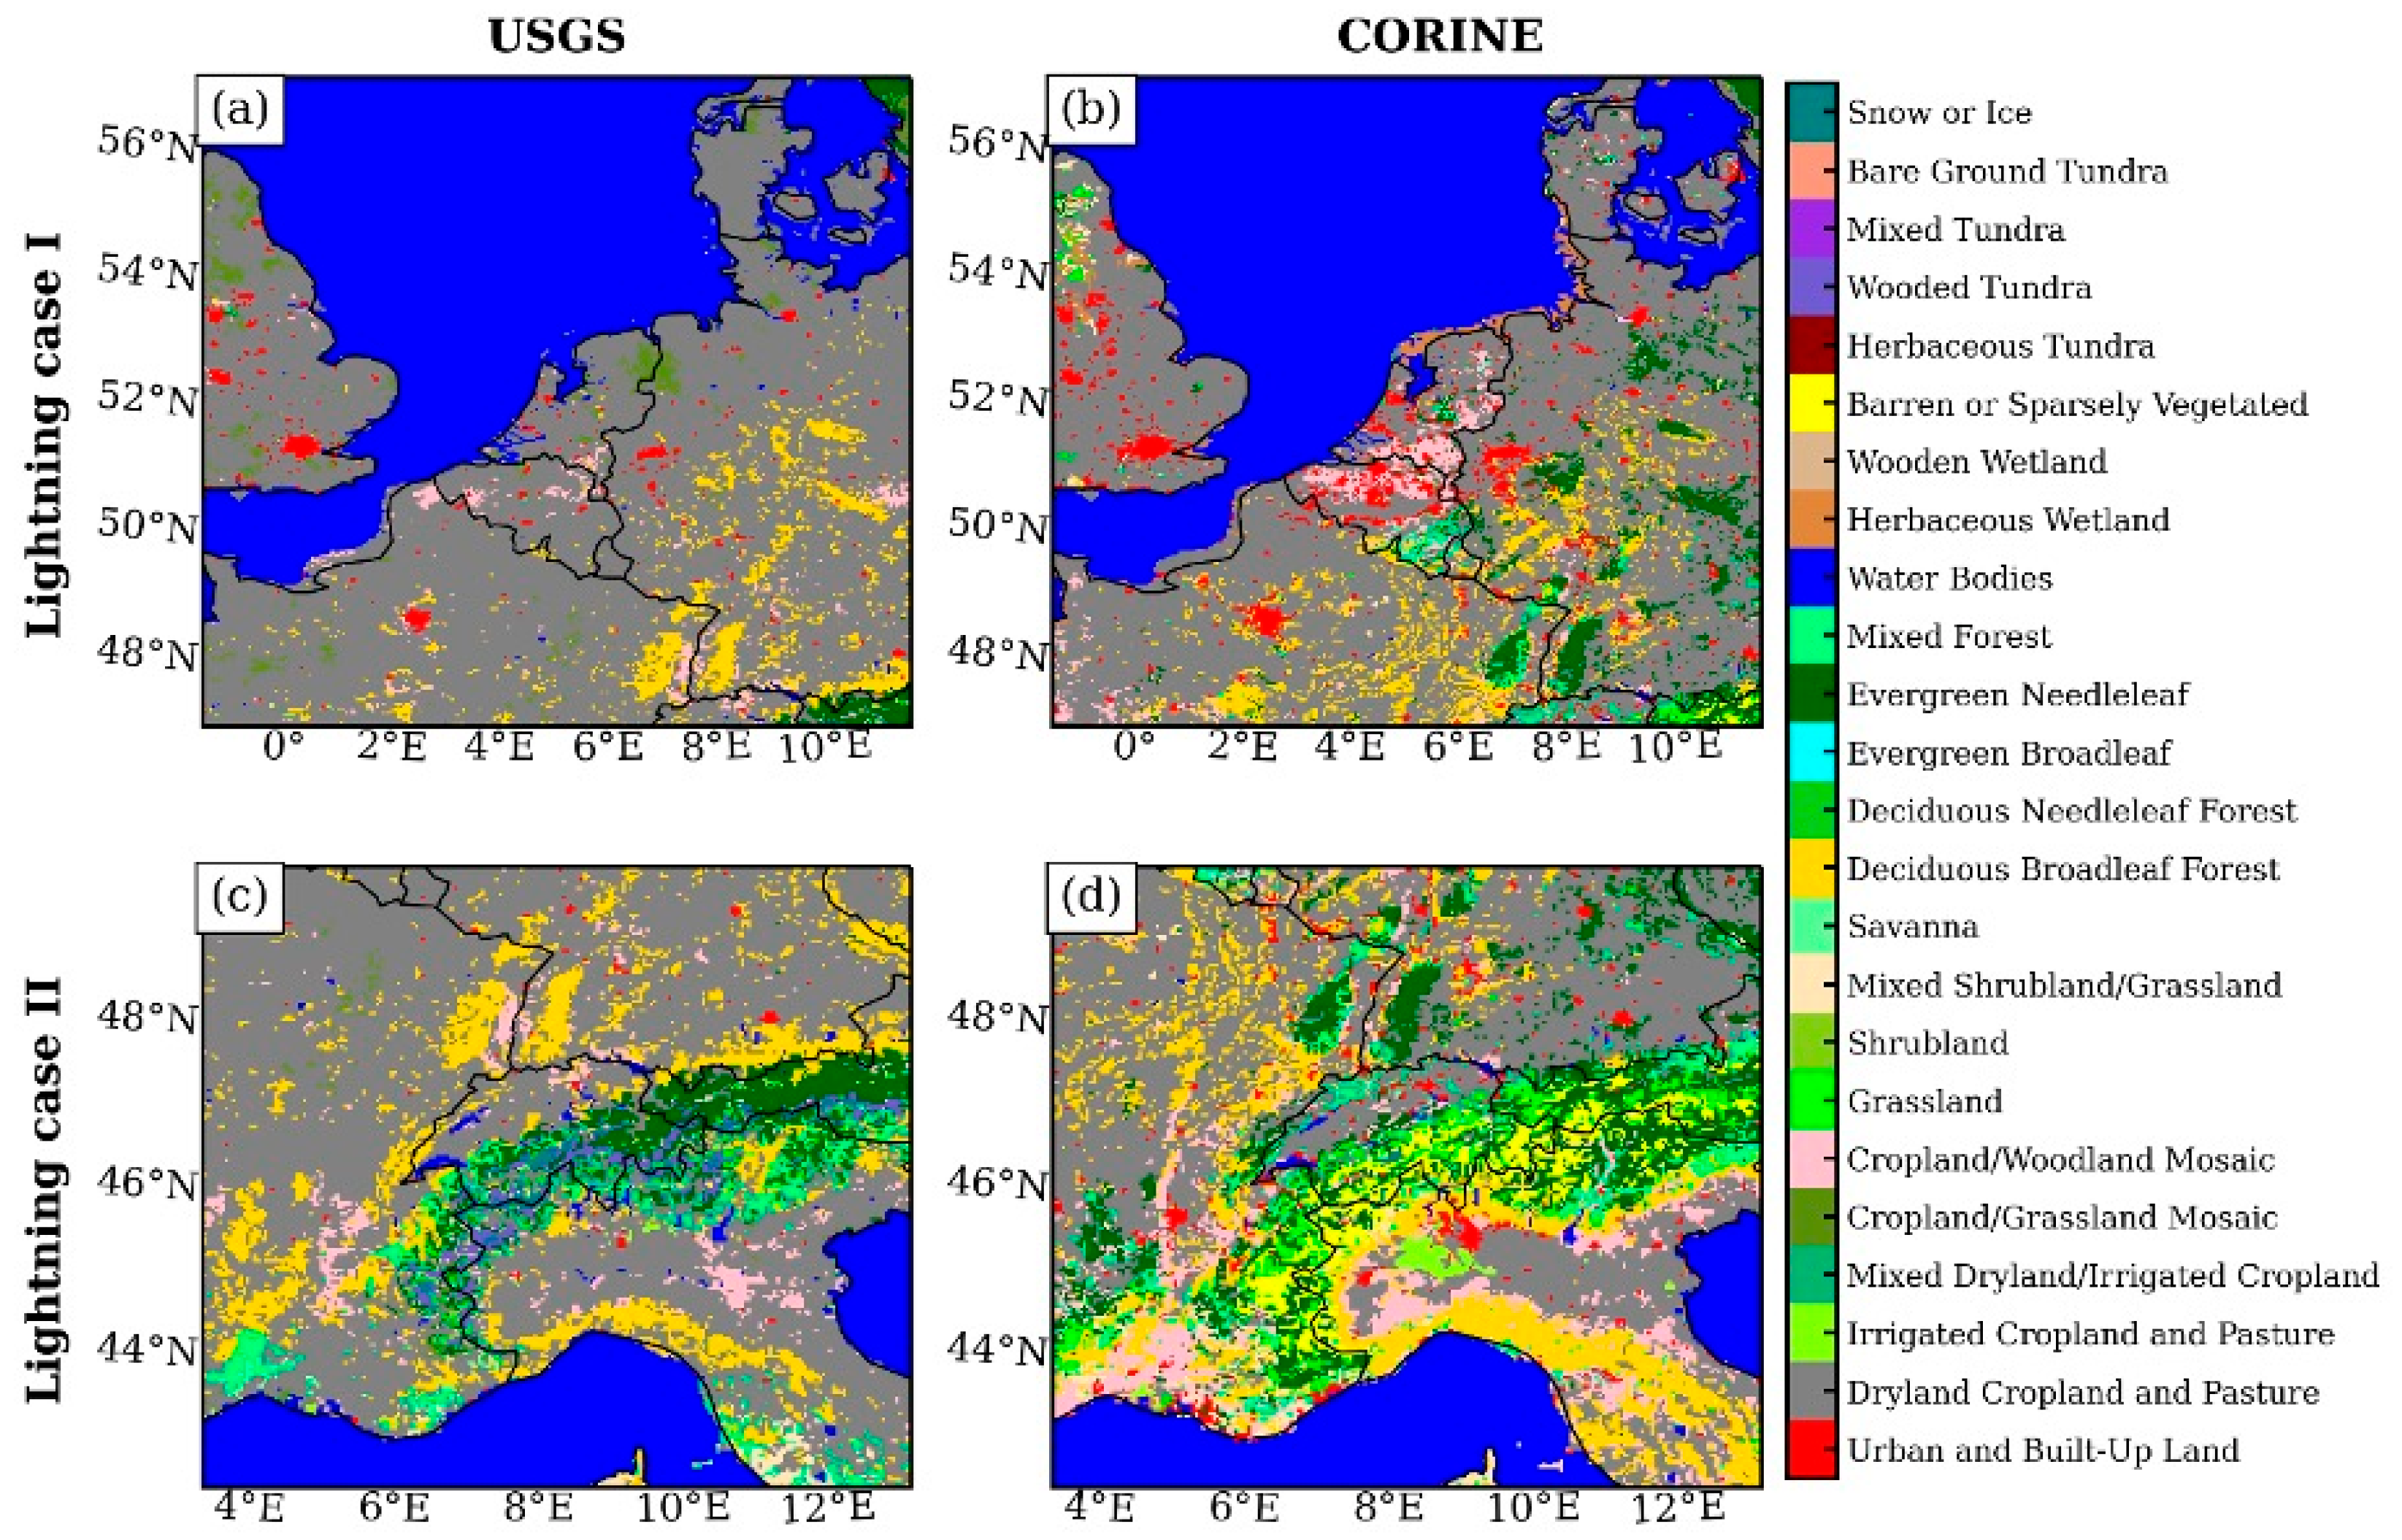
In Figure 2, the distribution of the land use and land cover (LULC) is presented both for the Corine Land Cover and 30-arc seconds USGS data.
Figure 2 is statistically summarized in Table 1, where the numbers of cells of each land-cover class in the domain are listed. Here, only the predominant land-use type in the grid cell has been used, considering the most dominant as the type with a fraction equal to or greater than 0.6 in the cell. In the selected domain, the largest contrasts were located over the Alps, where it was mostly listed as “Barren or sparsely vegetated” in the Corine data, while the USGS showed wooded tundra for this area. Significant discrepancies were also found, for example, in urban built-up land (more frequent in Corine), Cropland/Grassland Mosaic (zero in Corine), Evergreen Needleleaf (higher in Corine) and Herbaceous Wetland (zero in USGS).

3. Results

In the following section, we evaluate the CG lightning calculations by WRF_CLC, WRF_CLCS and WRF_USGS by comparing them to the CG observations from the European Cooperation for Lightning Detection (EUCLID) network [68,69]. We also compare the parameters that contribute to the development of convective thunderstorms and lightning, i.e., specific humidity and temperature, with observations from the radiosonde database from the University of Wyoming [70]. Furthermore, we compare the calculated heat fluxes between WRF_CLC, WRF_CLCS and WRF_USGS and the convective available potential energy (CAPE) and the vertical wind speeds with ERA5 reanalysis.
The European Cooperation for Lightning Detection (EUCLID) geolocates cloud-to-ground (CG) strokes and intracloud (IC) pulses through a combination of time-of-arrival (TOA) and direction-finding (DF) techniques. EUCLID is special as it combines real-time raw sensor data of independent lightning location systems—either managed by national meteorological services (NMSs) or by private companies—within a single central processor. The latter is possible considering that all the sensors operate in the same low-frequency (LF) range and are from the same manufacturer. The performance of EUCLID has been tested extensively over the years, including in terms of location accuracy (LA) and detection efficiency (DE). Those performances have been determined either from direct lightning measurements at the Gaisberg Tower (GBT) [71], Peißenberg Tower in Germany [72] and Säntis Tower in Switzerland [73,74] or from video and E-field records collected in different regions within Europe [68,75]. The current LA is of the order of 100 m based on the location error directly measured at the GBT and based on video and E-field recordings within the majority of the network. The DE for negative CG strokes and flashes reaches 70% and 96%, respectively, based on GBT data and are determined to be 84% and 98%, respectively, using video and E-field records. On the other hand, the DE for positive discharges is greater than 84% and 87% for CG strokes and CG flashes, respectively [68]. Finally, IC DE was validated during the HyMeX experiment [76,77] in the south of France [78,79]. It followed that the DE of isolated IC flashes, i.e., pure IC flashes without any CG stroke in them, has a large variation ranging from 10% up to 67% from one thunderstorm to another. This variability is mainly attributed to differences in the vertical extent of the IC flash and to the flash rates during a storm.

3.1. Lightning

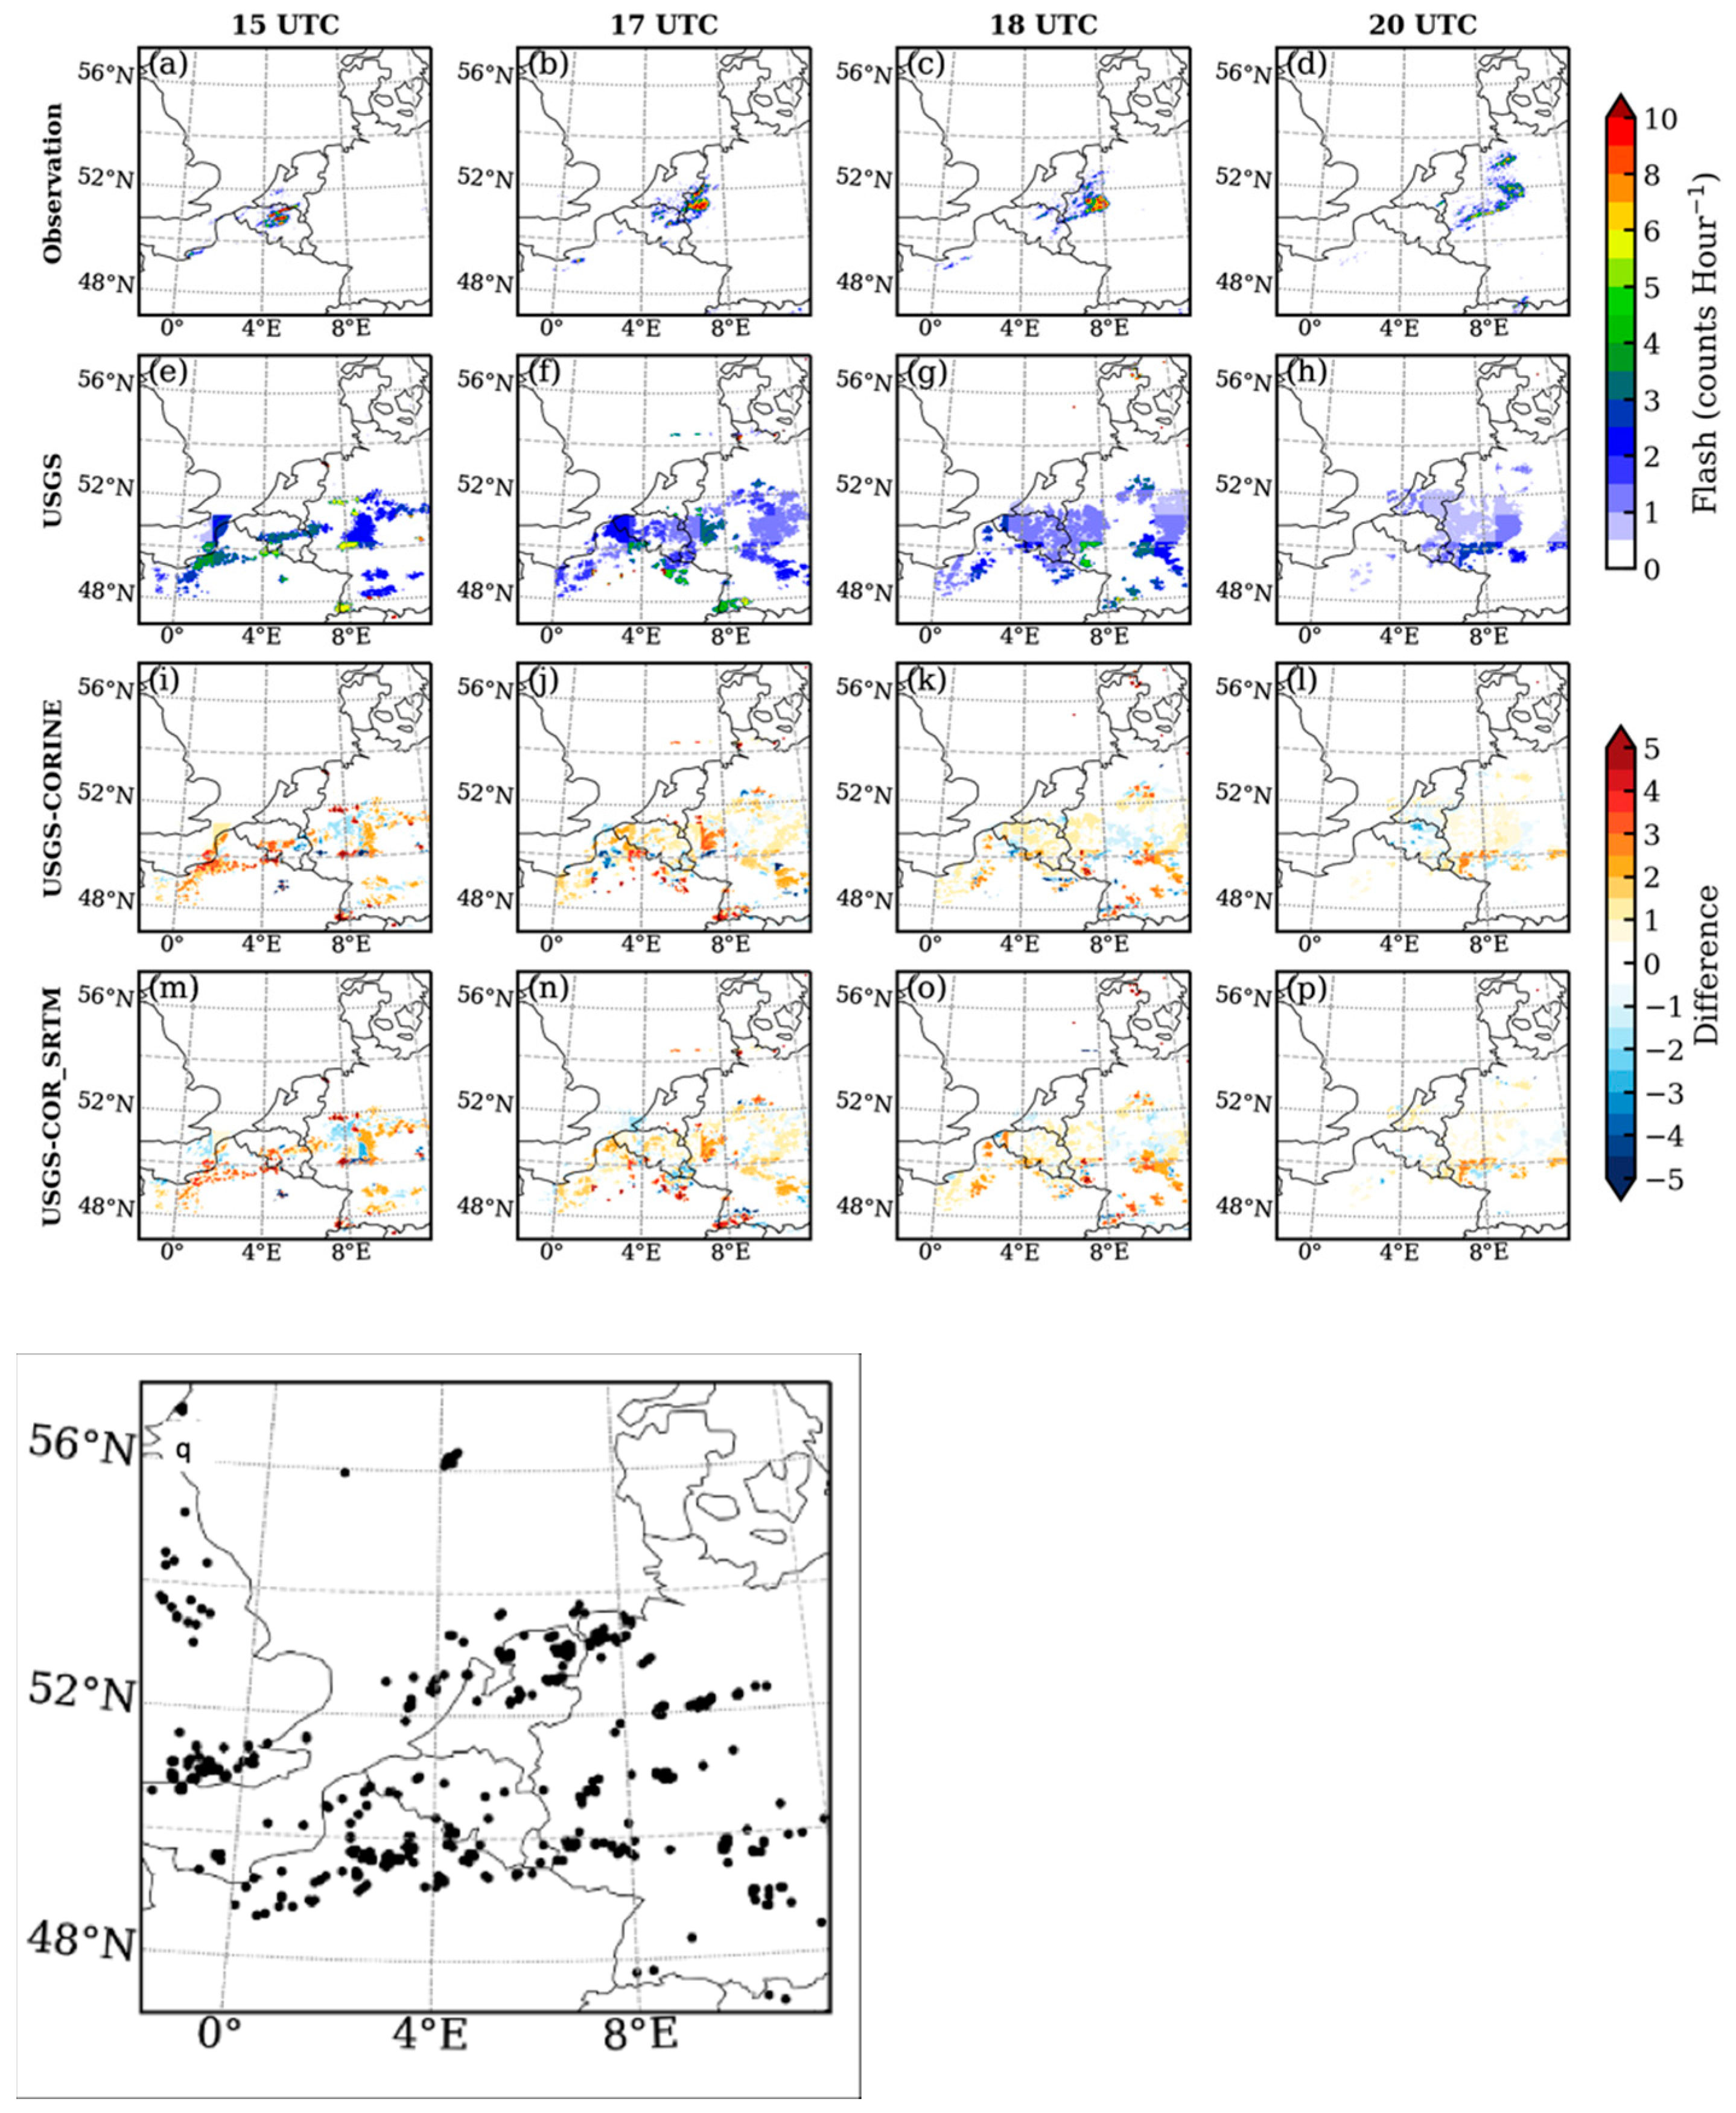
WRF-simulated lightning flashes were compared with the ground-based observations for the two cases: 18 August 2011 (Figure 3) and 29 July 2013 (Figure 4), considered in the study. The comparisons were made over different times of the day to evaluate the model performance in capturing the temporal evolution of thunderstorms. Overall, WRF overestimated the flash counts for both simulations (WRF_USGS as well as WRF_CLC and WRF_CLCS). The overestimation was found to be lower in the case of WRF_CLC(S), as seen in the difference between WRF_USGS and WRF_CLC(S).
In Figure 3a, the cloud-to-ground (CG) lightning flashes according to WRF_CLC, WRF_CLCS, WRF_USGS and observations are shown for 18 August 2011 at 15, 17, 18 and 20 UTC. Intracloud flashes were not considered in the analysis. CG lightning according to WRF_CLC, WRF_CLCS and WRF_USGS were calculated over parts of Belgium and the north-western part of France, which is in agreement with the observations. This indicates that the timing and the spatial distribution of CG lightning was well-represented by the model. Until 20:00 UTC, WRF_CLC, WRF_CLCS and WRF_USGS calculated no lightning flashes over the Netherlands, the southern of Paris, the eastern part of the UK, Luxembourg or over a large part of Germany, which is corroborated by the observations.
At 20:00 UTC, the thunderstorm with lightning activity moved further eastwards and covered the German cities of Dusseldorf, Cologne and Dortmund, moving further north-eastwards up to Bremen. WRF_CLC, WRF_CLCS and WRF_USGS simulated the eastward progression of the thunderstorm, as seen in the observations. However, the three simulations calculated CG lightning activity over the northern part of France and Belgium, whilst the observations showed minor lightning activity. In general, WRF_USGS calculated more CG lightning flashes over the northern part of France, Belgium, the Netherlands and Germany than WRF_CLC and WRF_CLCS. East and northwest of Paris, WRF_CLC calculated more CG lightning activity than WRF_USGS. The fact that WRF_USGS generally calculated more lightning flashes than WRF_CLC corroborates the results of [55], which shows that WRF overestimates the number of lightning flashes.
The differences in CG lightning between WRF_CLC and WRF_USGS LULC are shown in the third and fourth row (WRF_CLCS vs. WRF_LULC). The differences in CG lightning are clearly visible over parts of Belgium and northwest of Paris. In general, WRF_USGS calculated a higher number of lightning flashes over Belgium and the northern part of France than WRF_CLC and WRF_CLCS. Only west of Paris did WRF_CLC(S) calculate more CG flashes than WRF_USGS. The difference in CG lightning showed a similar pattern to the differences in land-cover classes between USGS and Corine. This is further investigated in the following sections.
A quantitative comparison of the reduction in the lightning flashes between USGS and Corine LULC showed that, with the latter, 8% fewer lightning flashes were found. With Corine + SRTM (WRF_CLCS), 10% fewer flashes were found when compared to the simulation with USGS topography.
In Figure 3q, the Student’s t-test was performed at individual grid points between WRF_USGS and WRF_CLCS for Case I (18 August 2011), and the region with the statistically significant difference (dots) is shown. The dots imply a statistically significant difference at 95% level.
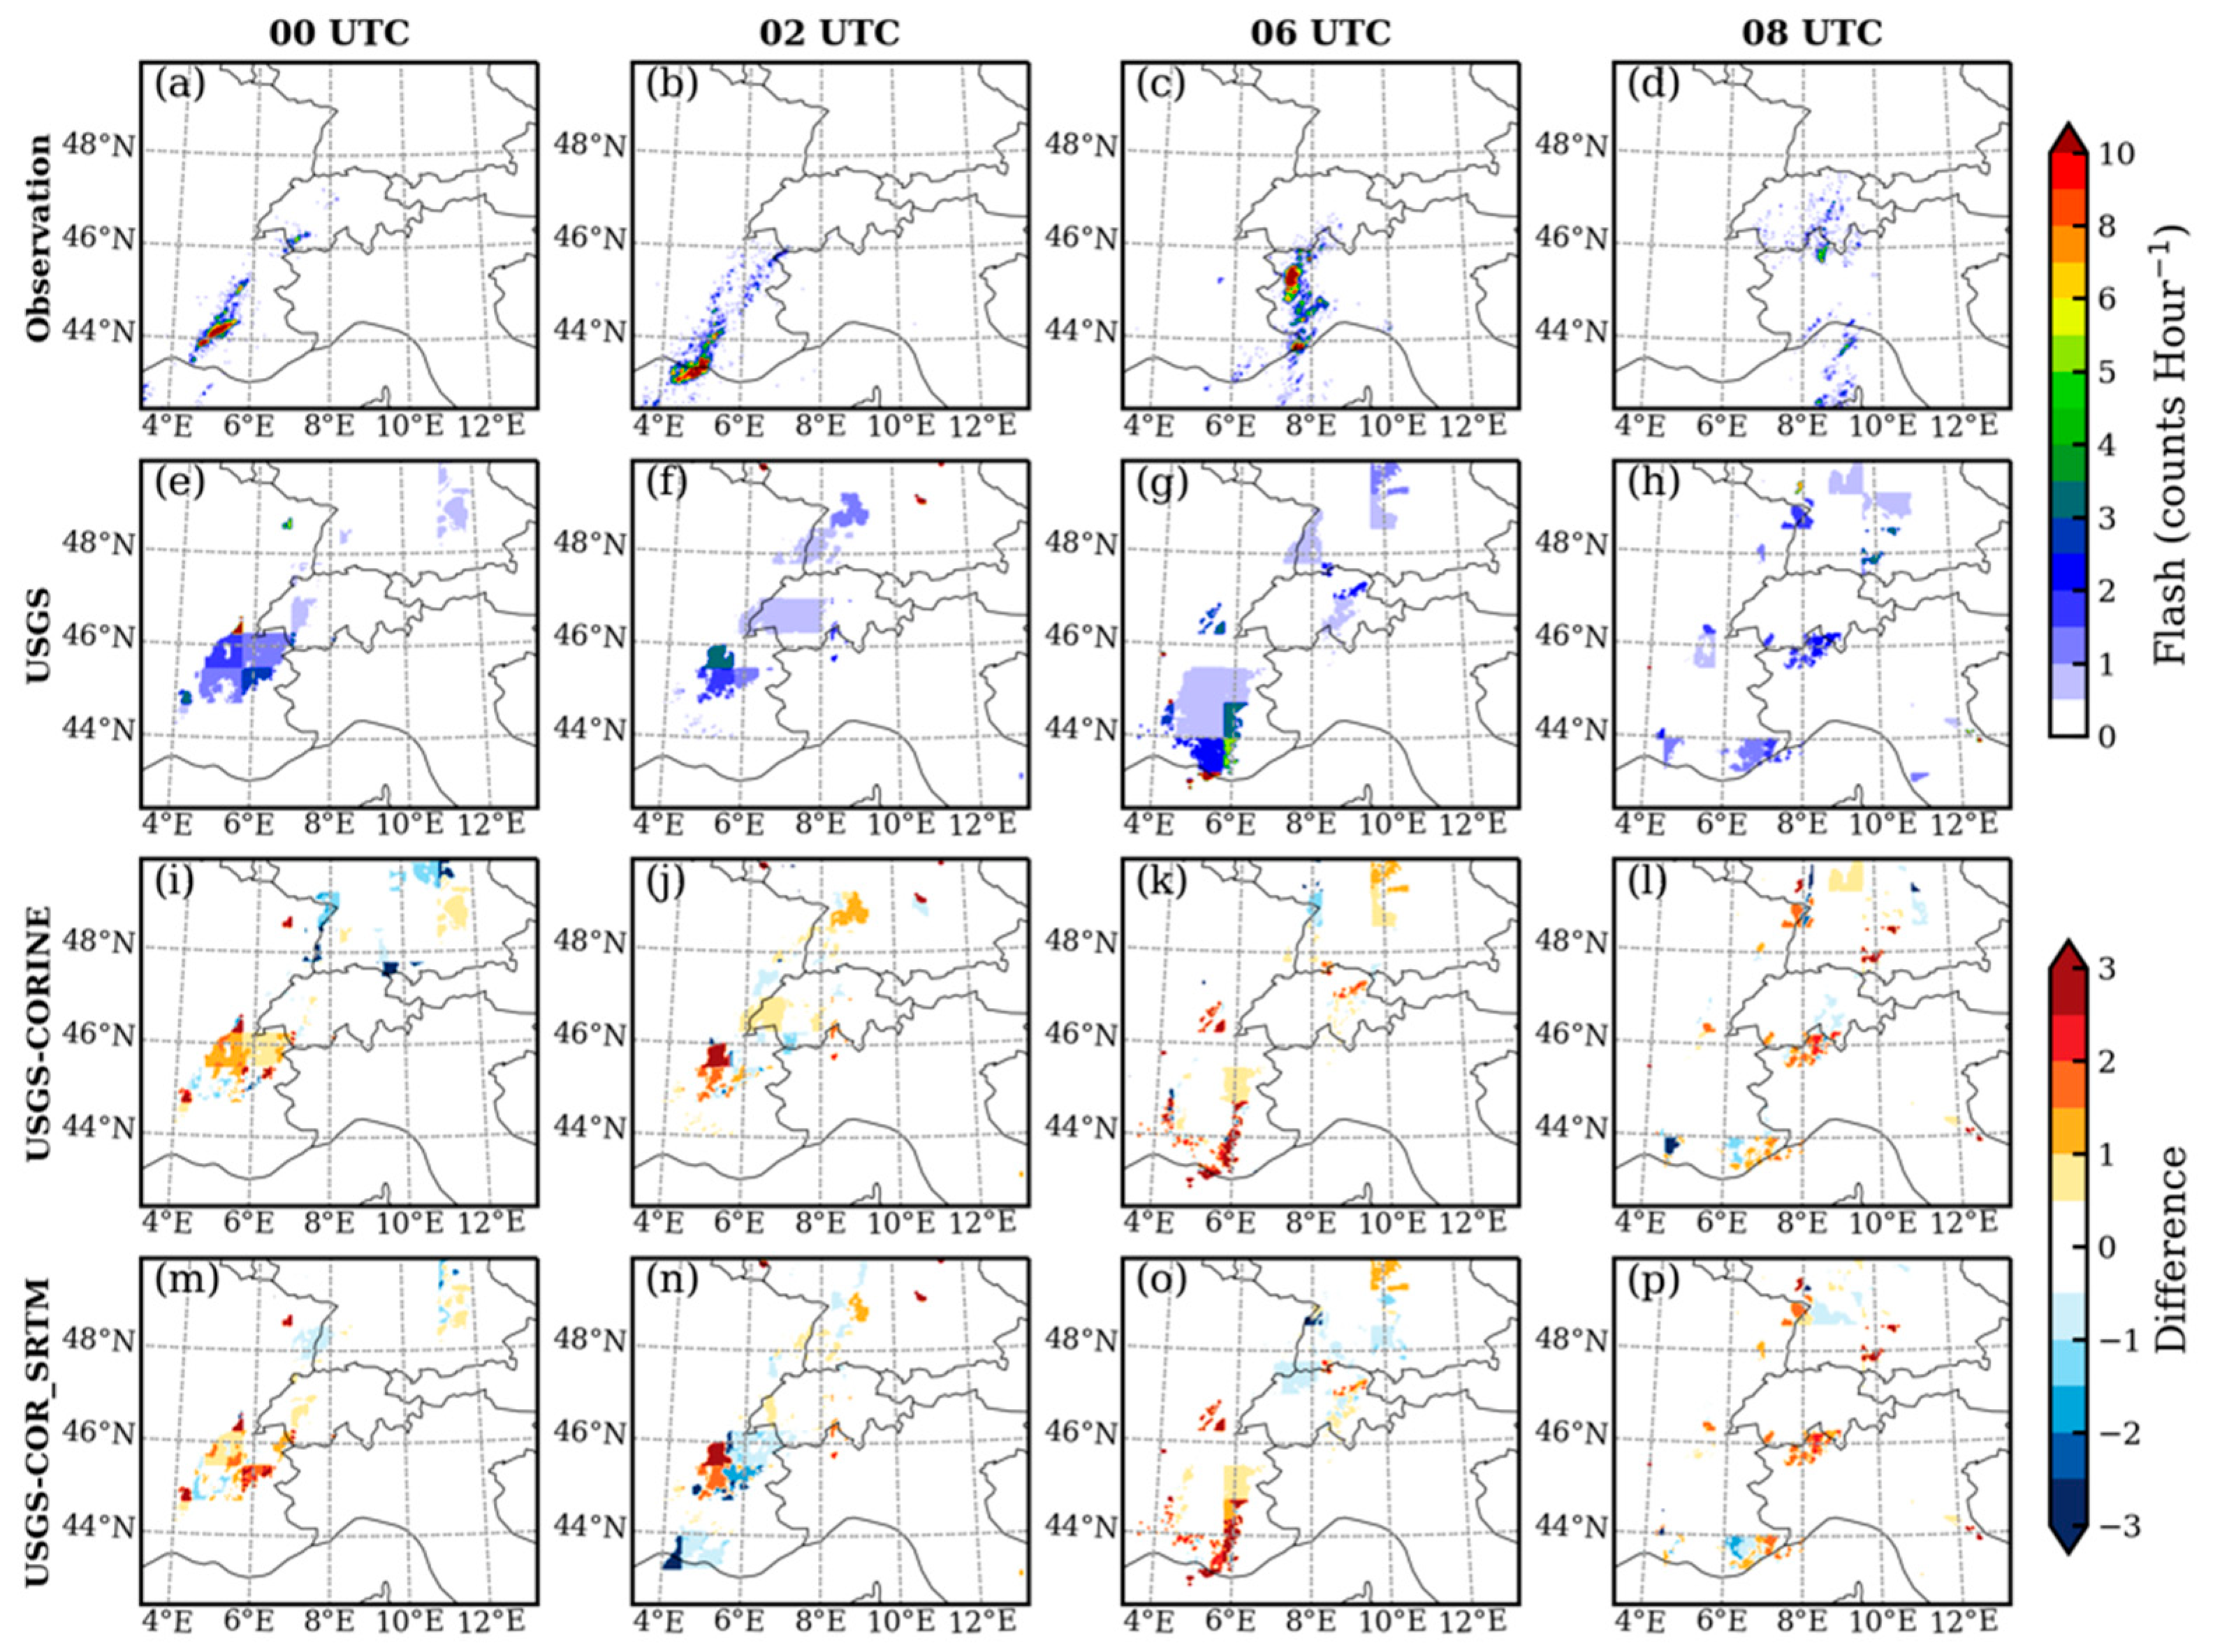
In Figure 4, the CG lightning flashes over the Alps as observed by EUCLID and by WRF_CLC, WRF_CLCS and WRF_USGS on 29 July 2013 at 00, 02, 06 and 08 UTC are presented. This allowed us to investigate the impact of the topography on CG lightning flashes. The observations showed that high lightning activity was observed over the southwestern part of the Alps, stretching from the Provence (southeast France) and Piedmont region in Italy up to the central part of Switzerland.
For Case II, the number of lightning flashes between USGS and Corine LULC was 6% lower with Corine LULC. With Corine + SRTM, 9% fewer flashes were found when compared to the simulation with USGS topography, which is in line with the results of [55] as described earlier. Interesting to see is the differences southwest of the Alps and over the Piedmont region in Italy, which corresponds to the observed high lightning activity, indicating that the timing and the spatial distribution of the calculated CG lightning by the two simulations were in agreement with the observations. The differences in the number of CG flashes between the two simulations mainly follow the largest differences in the topography.
To better understand the topography’s impact on the number and spatial distribution of the lightning flashes, the difference in topography height between SRTM and USGS is shown in Figure 1d. The blue and red colours indicate a difference in height larger than 30 m between the two data sets. The red colour indicates that SRTM is higher, while the blue one implies that the USGS is higher. The green colour reveals areas where differences between SRTM and USGS are within ±10 m. It is clear from this figure that SRTM shows higher terrain southwest of the Alps, including the Piedmont region and parts of Switzerland.
The highest mountain peaks were calculated by the USGS topography (maximum was 3518 m, whilst the maximum by SRTM was 3458 m). The higher-resolution SRTM topography resolved the mountain peaks, slopes and valleys (the latter indicated in blue in Figure 1d) better than the coarser resolution of the USGS data set, which impacts the horizontal and vertical wind speeds and directions, important processes in the occurrence of lightning [11]. Research in Ref. [43] found higher wind speeds, cloud liquid water and precipitation quantities in the simulation using the SRTM topography than the simulation using the USGS topography.

3.2. Heat Fluxes

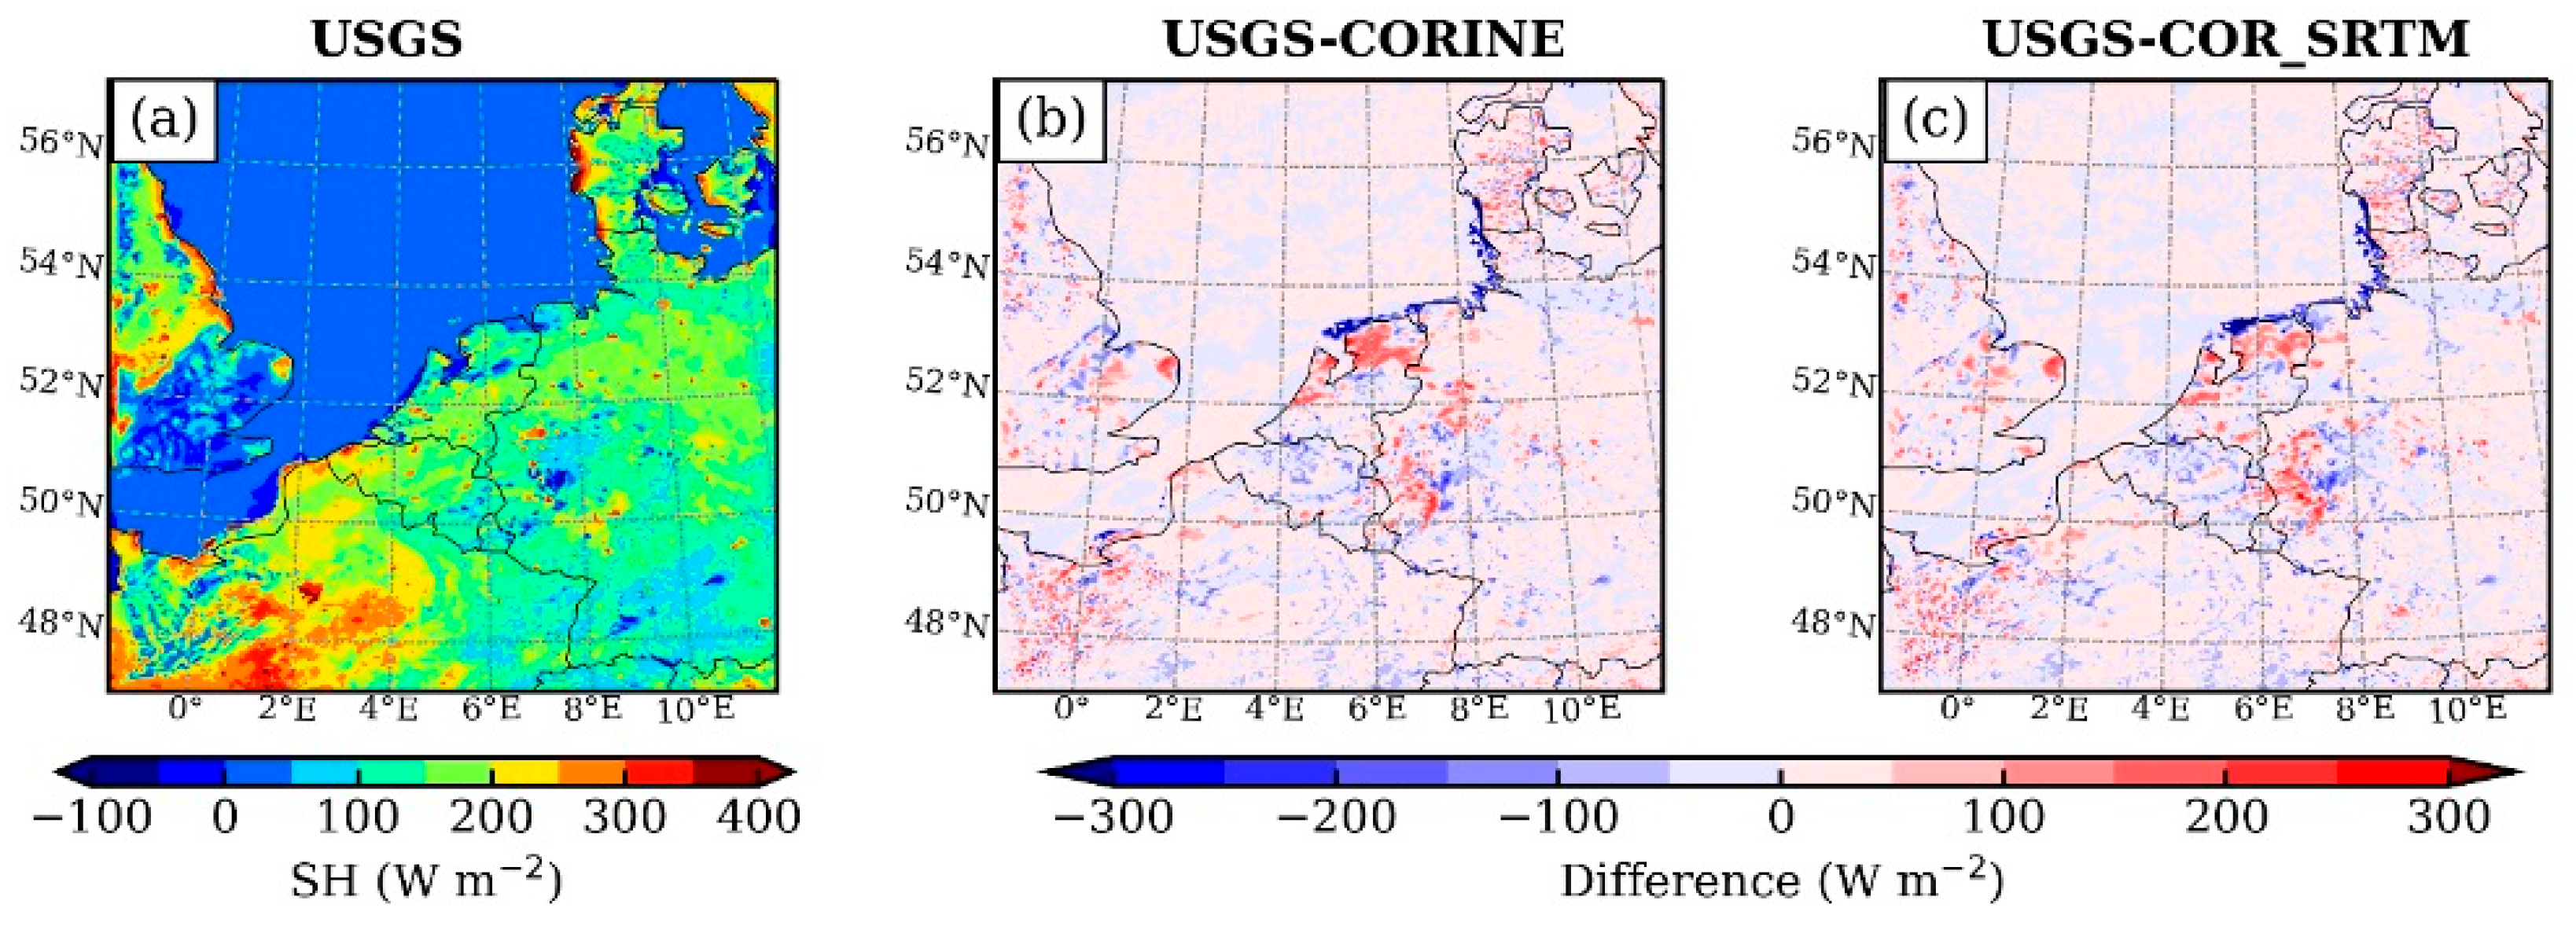
To explain the differences in CG lightning according to WRF_CLC, WRF_CLCS and WRF_USGS, the sensible and latent heat fluxes were investigated, since those are responsible for the amount of moisture, temperature profiles and PBL development.
The diurnal growth of the PBL is regulated by the sensible (dry) and latent (moist) heat fluxes. When the Bowen ratio, i.e., sensible-over-latent heat flux, is greater than one, i.e., sensible heat flux > latent heat, the PBL is deeper than when the Bowen ratio is small, e.g., 0.5 over wet areas. In Ref. [80], research showed that the convection, and therefore the PBL height, is controlled mostly by sensible heat fluxes. Nevertheless, in areas with Bowen ratios below one, the near-surface temperature is lower than in areas with a Bowen ratio above one [81]. The diversity in CG lightning flashes can be explained by the different heat fluxes in the three simulations by WRF_CLC, WRF_CLCS and WRF_USGS.
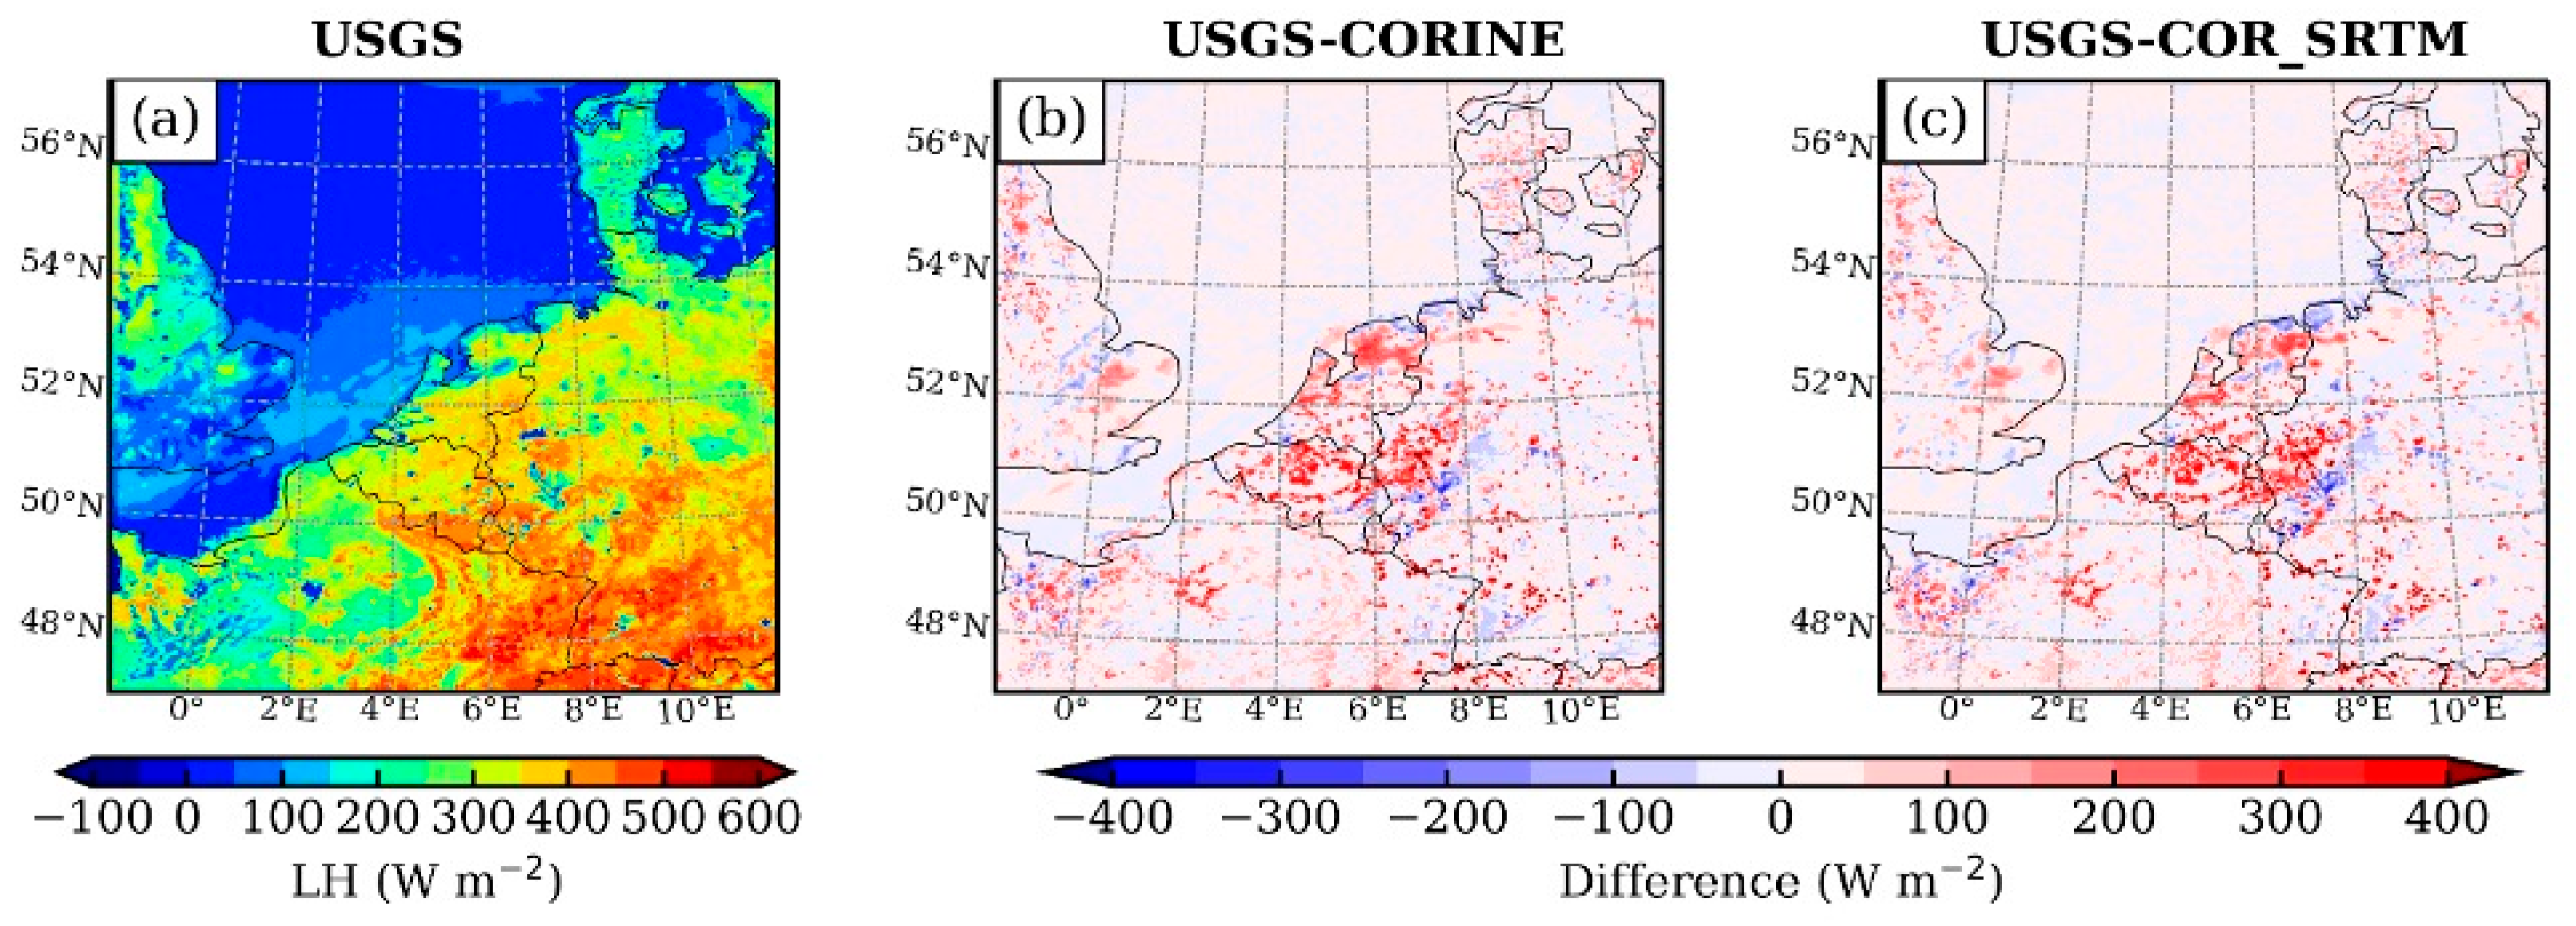
Analysing the latent (moist) heat fluxes (LH) on 18 August at 12 UTC in Figure 5, it can be seen that, over the south-eastern part of Belgium, large differences were found between WRF_CLC and WRF_USGS. In general, LH fluxes by WRF_USGS were around 390 W/m2, while by WRF_CLC, they were around 350 W/m2. The reason for this is that the dominant type of land cover in USGS was classified as Dryland Cropland and in the Corine data set as Mixed Forest.
Moreover, large differences in the LH fluxes were found over those areas that are classified as urban built-up in Corine, but classified differently in USGS. For example, more urban built-up areas were found in the Netherlands, Belgium and Paris in Corine (see Figure 2), resulting in lower LH fluxes than by WRF_USGS, which corroborates the results by [43,50].
Just the opposite, for the grid cells where Corine Land Cover registers more urban Land Cover classification than USGS, higher sensible heat fluxes were generally found by Corine, as shown in Figure 6. The blue colour indicates higher sensible heat fluxes by WRF_CLC than by WRF_USGS. Moreover, higher sensible heat fluxes were found over the southern part of the Ardennes in Belgium, which is related to the differences in land cover between USGS and Corine, as mentioned earlier.
The differences in the heat fluxes between the two simulations, as described above, may play an important role in the formation and height of the convective clouds. In fact, the origin of the convective clouds often lies above the PBL [82,83]; higher sensible heat fluxes deepen the PBL heights [43,50,84] and therefore impact the height of the convective cloud base and the depth of the convective clouds. Shallower convective clouds may lead to a reduced build-up of electrical charges, which may decrease the number of lightning flashes.

3.3. Vertical Profiles of Model Bias

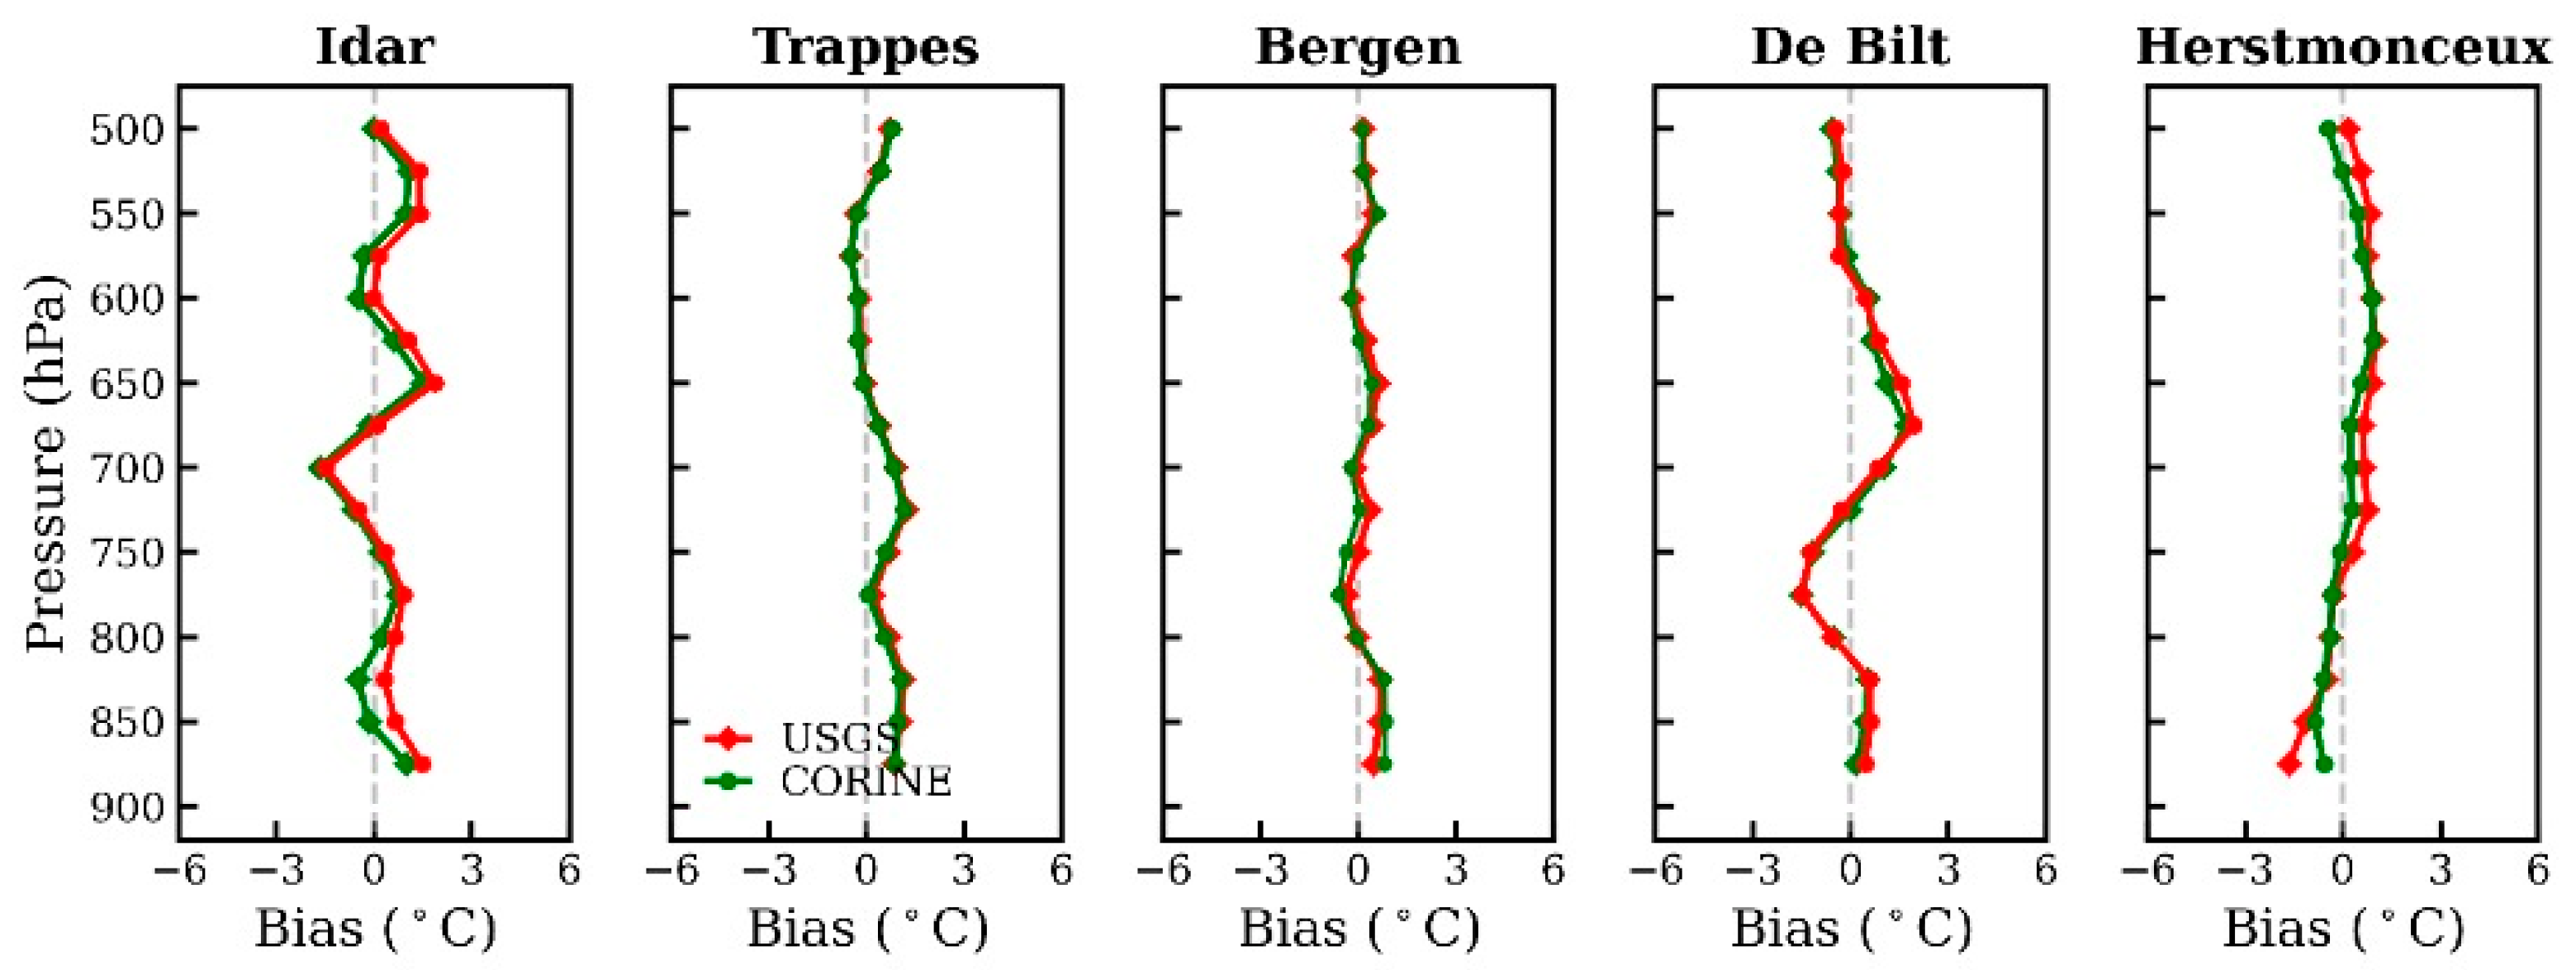
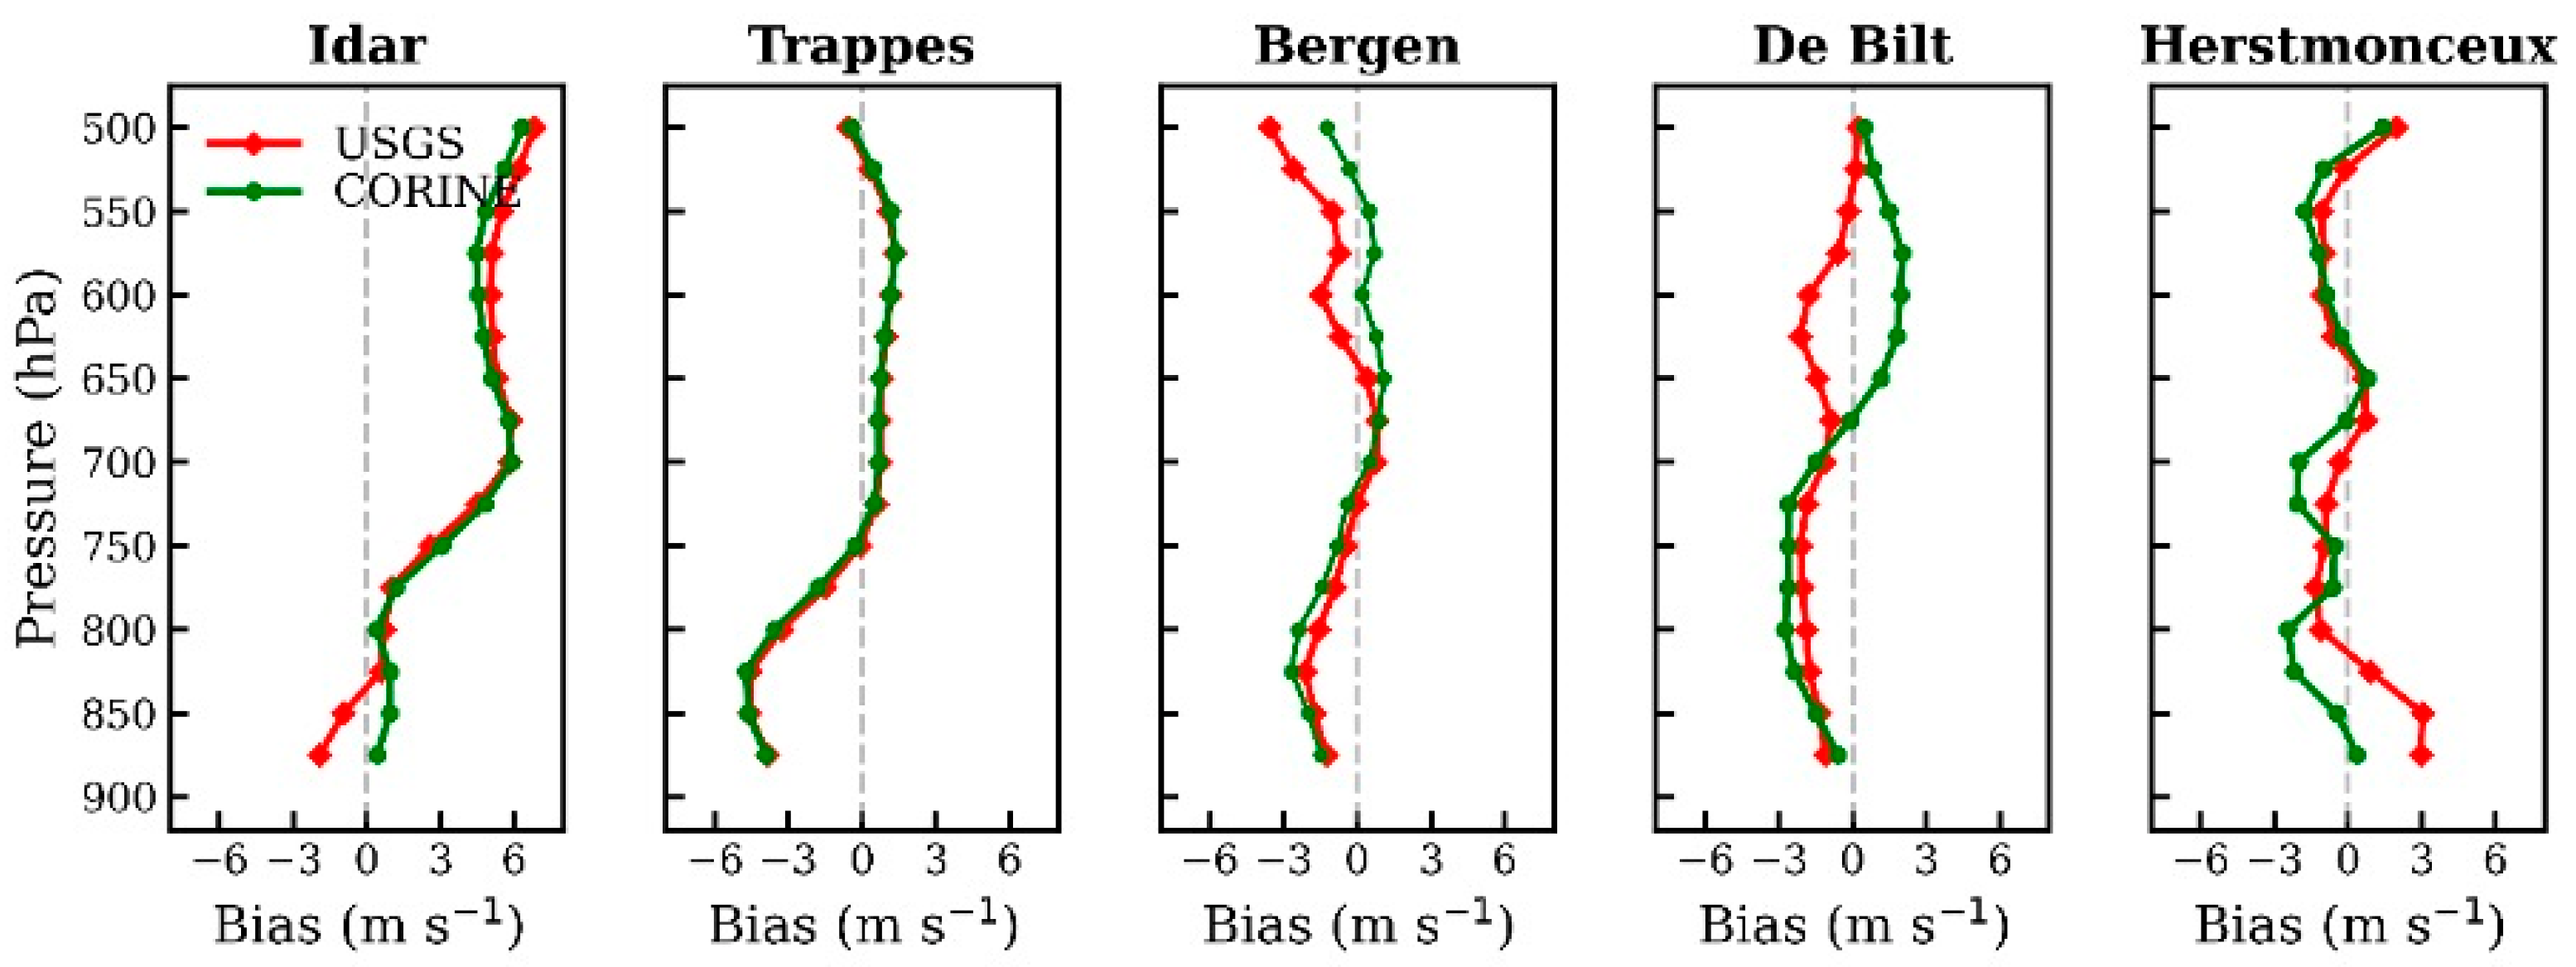
WRF simulations, driven by USGS and Corine data sets, were compared with radiosonde observations from Idar, Trappes, Bergen, De Bilt and Hestmonceux, and the vertical profiles of biases (model–radiosonde) were estimated for temperature (T), specific humidity (Q) and wind speed (WS) (Figure 7, Figure 8 and Figure 9 and Table 2). USGS- and Corine-driven model simulations showed good agreement with the radiosonde observations. Earlier studies have also applied Corine data to simulate meteorology over the European domain and have reported good agreement of WRF results with observations [43,85].
In Figure 7, the bias of the vertical profile of the temperature over five radiosonde stations are shown for 18 August 2011 at 12 UTC. For Idar and Hestmonceux, larger biases were found by WRF_USGS (four times higher by WRF_USGS), indicating that WRF_CLC was in better agreement with the observations.
Figure 8 presents the bias of the vertical profile of the specific humidity over five radiosonde stations (Idar, Trappes, Bergen, De Bilt and Herstmonceux) at 12 UTC on 18 August 2011. In general, the biases by the two simulations varied, except for Trappes. Looking at the bias values in Table 2, we see that only for Idar was WRF_CLC (1.01) in better agreement with the observations than WRF_USGS (1.50), while for the other stations, the biases were similar between the two simulations.
In Figure 9, the bias of the vertical profile of the wind speed over five radiosonde stations are shown for 18 August 2011 at 12 UTC. For Trappes, small differences between WRF_CLC and WRF_USGS were found when compared to the observations, whilst for the other stations, larger differences were found. The largest difference in the bias between WRF_USGS and WRF_CLC when compared to the observations was found for Herstmonceux at 12 UTC, 0.11 and −0.80, respectively.

3.4. CAPE and Vertical Wind

CAPE is a measure of the potential development of severe weather. CAPE depends on how much water vapour is available in the atmosphere and determines the velocity of upward drafts in convective clouds. More water vapour in the atmosphere leads to potentially more convection. Furthermore, the lightning activity is strongly linked with the convective updrafts and variations in the vertical velocity. Therefore, we also evaluated the convective available potential energy (CAPE) and vertical wind velocity in the WRF simulations against the ERA5 reanalysis [86], which was assimilated with a variety of observational data sets (Figure 10 and Figure 11). The vertical wind velocity is a measure of atmospheric stability and depends on the type of land cover, the friction, the vertical transport of the sensible and latent heat fluxes and the resulting vertical temperature profiles [82]. Higher vertical winds were simulated by WRF_USGS, resulting in more convection and, therefore, deeper convective cloud formation and the potential of more lightning.
Domain-wide mean values of CAPE and vertical winds are given in the Table 3 for ERA5 and the three different WRF simulations. The spatial distribution of CAPE in the WRF simulations was found to be similar to that in the ERA5 reanalysis, despite lesser variability over local scales in the ERA5 due to its coarser resolution than WRF. While both WRF simulations tended to overestimate the CAPE values in ERA5, nevertheless, the WRF_CLC simulation showed a slightly lower bias than the USGS simulation. Both of the WRF simulations reproduced general features of vertical wind variability seen in the ERA5 reanalysis, though the winds were slightly weaker in WRF_CLC and WRF_CLCS than that in the WRF_USGS (Figure 11). The reason for the differences in vertical wind speeds between the simulations are the differences in land cover and the resulting sensible and latent heat fluxes, as described before. Quantitatively, WRF_CLC and WRF_CLCS had a lower mean bias against the ERA5 reanalysis in comparison to that in WRF_USGS.
In Figure 10, the CAPE values (J/kg) are presented by ERA5 data, WRF_CLC and WRF_USGS for 18 August 12 UTC. At 12 UTC, higher CAPE values were generally found by WRF_USGS over the north of France, the northeast of Belgium, south of the Netherlands and the western part of Germany. Higher CAPE values by WRF_USGS were in agreement with more lightning activity calculated than by WRF_CLC, as described earlier. As mentioned before, WRF_USGS produced generally higher latent heat fluxes over the north of France and the southern part of Belgium due to the differences in land-cover classes between USGS and Corine Land Cover data sets (Table 1 and Figure 2). CAPE is a measure of buoyant energy of the air parcels, and the sensible heat flux represents the energy transferred to the atmosphere. The higher values of sensible heat fluxes were observed in the regions of high CAPE values. However, since the heat fluxes are affected by the type of land use, there were some differences in the spatial distribution of the two parameters. The higher lightning activities were shown to be prominent over the regions of higher CAPE values (Figure 3 and Figure 10), attributed to stronger convective conditions. These regions showed greater change in heat flux by up to 200 W m−2 in response to change in terrain and land-cover data in the model. The results suggest that lightning activities are associated with the CAPE and heat fluxes.
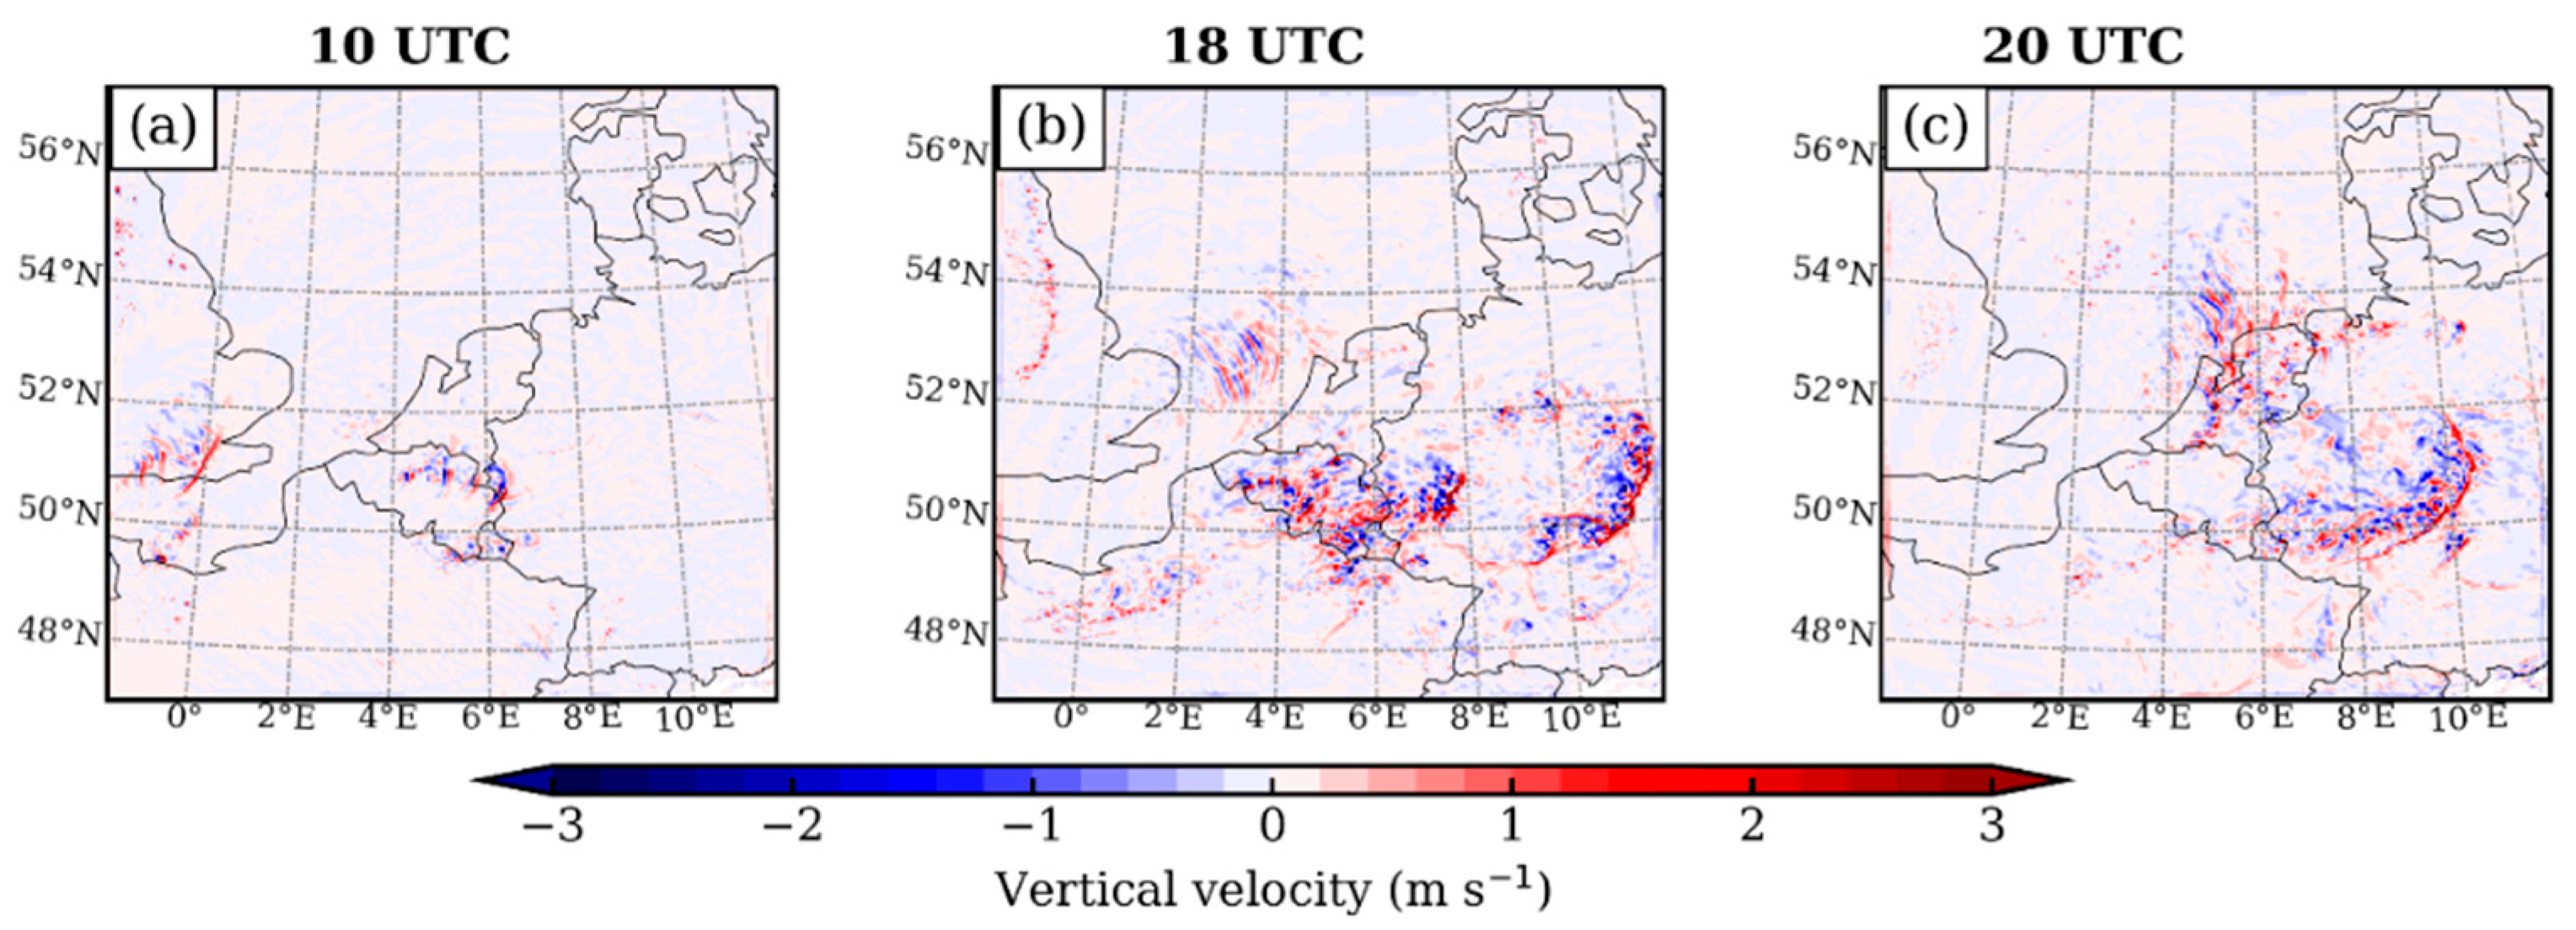
The vertical velocities become larger with the passing of thunderstorms. The comparison of the vertical velocity for three different hours, 10 UTC (before the lightning event) and 18–20 UTC (during the lightning event) in Case I, is shown in Figure 12.
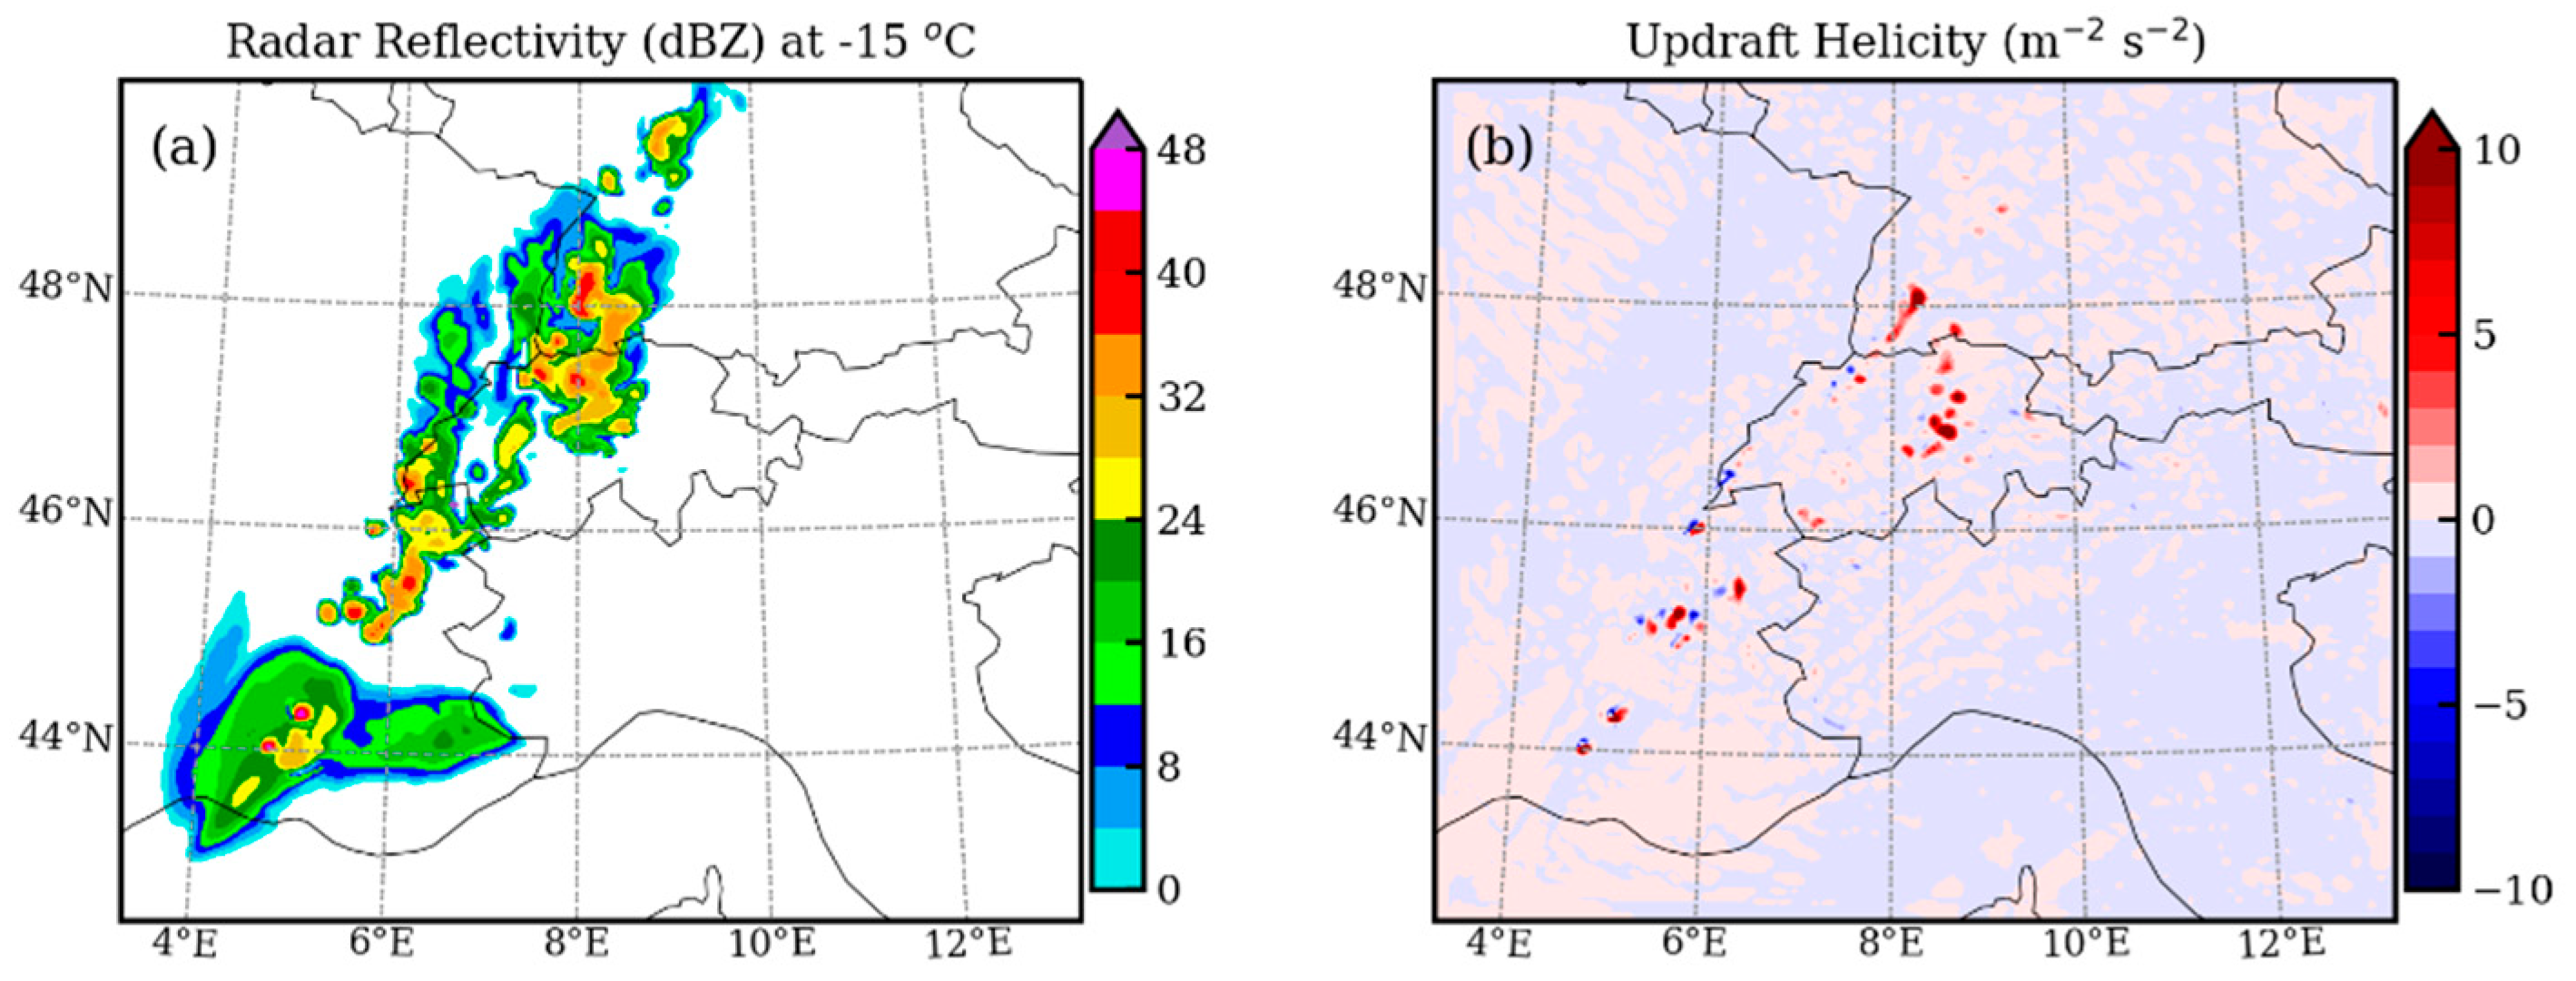
We further checked the radar reflectivity at −15 °C and updraft helicity in the model (Figure 13). The radar reflectivity and updraft helicity were seen to be higher over the regions of prominent lightning flashes in our simulations. This is in agreement with previous studies suggesting that the fluxes of the microphysical species, such as graupel at −15 °C in the mixed phase, are correlated strongly with the storm flash rates [87,88].
Table 3 shows the domain median values for CAPE and vertical winds. Between WRF_USGS, WRF_CLC and WRF_CLCS, the differences in CAPE values over the modelling domain were small, while compared with ERA5, the differences were larger (up to a factor of 1.5). The absolute differences in the vertical wind speeds between ERA5 and the three simulations were small. However, looking at more specific locations in the model domain, where high lighting activity was observed, we see in Figure 11 that the impact of changing LULC on vertical wind speeds at 850 hPa showed differences between USGS and Corine (Figure 11c,d) up to 3 Pa·s−1. As mentioned earlier, updrafts play an important role in the build-up of electrical charges in the convective clouds and the potential resulting lightning flashes.

4. Conclusions and Discussions

In this paper, the impact of the high-resolution Corine Land Cover and the SRTM topography data sets on CG lightning calculations by the numerical regional model WRF model was investigated. Two lightning episodes were selected: (1) a lightning episode on 18 August 2011 over the non-complex terrain over Belgium and (2) a lightning episode on 29 July 2013 over a complex terrain, the Alps. The analysis of CG lightning flashes was performed by comparing the results of a WRF simulation using USGS topographic and land-cover data (resolved to 30-arc seconds) to a simulation using Corine Land Cover (100 × 100 m), a third simulation using Corine and SRTM topography data (90 × 90), and observations.
In general, CG lightning flashes calculated by WRF were in qualitative agreement with the observations. This indicates that the timing and the spatial distribution of CG lightning by the model are well-represented. Nevertheless, the analysis of the differences in CG lightning over Belgium showed that WRF_USGS generally calculated more CG flashes than WRF_CLC. The difference in CG lightning showed a similar pattern to the differences in land-cover classes between USGS and Corine. Large difference in the sensible and latent heat fluxes were found between the two simulations due to the differences in land-cover classes between Corine and USGS. WRF simulation, driven by the updated Corine Land Cover data, reproduced the meteorological observations consistent with previous studies. The differences with ERA5 reanalysis fields were slightly lesser for Corine simulation than that in the USGS simulation. In general, higher vertical wind speeds by WRF_USGS were found, resulting in more convection and deeper convective clouds. While both of the simulations predicted more lightning flashes, the overestimation by WRF_CLC and WRF_CLCS was lower. This corroborates the higher calculated CAPE values by WRF_USGS when compared to ERA5, leading to more CG lightning flashes than by WRF_CLC and WRF_CLCS.
The analysis over the Alps showed that the timing and the spatial distribution of the calculated CG lightning flashes by WRF were in good agreement with the observations. The differences in the topography led to differences in vertical wind speeds and in the formation and height of the convective clouds, which explain the differences in CAPE values and the resulting differences in CG lightning flashes between the two simulations.
It is suggested that the potential improvements in meteorology due to better representation of the LULC could be offset, to some extent, by the parameterizations of physical processes. Significant improvements in meteorological parameters were achieved over the Himalayas through an improved representation of topography; however, the model still showed limitation in reproducing local-scale dynamics [90].
This study shows that high-resolution land cover and topography data reduce the number of CG lightning flashes simulated by WRF, which may contribute to reducing the uncertainties in CG lightning calculations by the model. Therefore, we emphasize that it is crucial to exploit the full potential of accurate topographical inputs. Moreover, further improvements in parameterizing land–atmosphere interactions will be important future steps to improve lightning calculations.
We showed the differences in the geographical and temporal distributions of the cloud–ground lightning flashes between the WRF simulation with USGS Land Cover and topography and the simulation with Corine Land Cover and SRTM topography. In addition, we showed the differences in calculated latent and sensible heat fluxes, vertical wind and temperature profiles and CAPE values between these simulations. These differences translated into differences in CG lightning flashes between the simulation with the Corine Land Cover and SRTM topography and the simulation with the USGS Land Cover and topography. Some studies [43,50,91] have previously evaluated the impact of the Corine Land Cover and SRTM topography on calculated meteorological parameters by comparing with observations. These studies showed that the improved meteorological variables are the result of implementing the high-resolution Corine Land Cover and SRTM topography in the WRF model. Our study confirmed that implementing high-resolution land cover and topography contributes to the reduction in uncertainties in calculating cloud–ground lightning flashes. We recommend the use of high-quality resolution land cover and topography data in modelling experiments that study extreme weather events, such as heat waves, and land–atmosphere interactions, such as lightning flashes.

Author Contributions

Conceptualisation, A.d.M.; methodology, A.d.M., N.O., N.S., J.S. and A.P.; software, A.d.M., N.O., N.S. and J.S.; validation.; A.d.M., N.O., N.S., J.S. and A.P.; formal analysis, A.d.M., N.O., N.S. and J.S.; investigation, A.d.M., N.O., N.S., J.S. and A.P.; resources, A.d.M., N.O., N.S., J.S., A.P. and D.R.P.; writing—original draft preparation A.d.M.; writing—review and editing, A.d.M., N.O., N.S., J.S., D.R.P. and A.P.; project administration, A.d.M. and A.P. All authors have read and agreed to the published version of the manuscript.

Funding

This research received no external funding.

Institutional Review Board Statement

Not applicable.

Informed Consent Statement

Not applicable.

Data Availability Statement

Not applicable.

Acknowledgments

The authors wish to acknowledge the use of NCAR Command Language (NCL) software for analysis and graphics in this paper (information is available at https://www.ncl.ucar.edu/, accessed on 1 June 2022). Radiosonde data available from the website of University of Wyoming (http://weather.uwyo.edu/upperair/sounding.html, accessed on 1 June 2022) are acknowledged. We also would like to thank G. Milev and W. Schulz for their valuable comments and for the distribution of the lightning observations by the EUCLID network. N.O. acknowledges the use of Vikram HPC at PRL.

Conflicts of Interest

The authors declare no conflict of interest.

References

  1. IPCC. Climate Change 2014: Synthesis Report. Contribution of Working Groups I, II and III to the Fifth Assessment Report of the Intergovernmental Panel on Climate Change; Core Writing Team, Pachauri, R.K., Meyer, L.A., Eds.; IPCC: Geneva, Switzerland, 2014; 151p. [Google Scholar]
  2. Romps, D.M.; Seeley, J.T.; Vollaro, D.; Molinari, J. Projected increase in lightning strikes in the United States due to global warming. Science 2014, 346, 851–854. [Google Scholar] [CrossRef] [PubMed]
  3. Finney, D.L.; Doherty, R.M.; Wild, O.; Stevenson, D.S.; MacKenzie, I.A.; Blyth, A.M. A projected decrease in lightning under climate change. Nat. Clim. Chang. 2018, 8, 210–213. [Google Scholar] [CrossRef]
  4. Pineda, N.; Montanyà, J.; van der Velde, O.A. Characteristics of lightning related to wildfire ignitions in Catalonia. Atmospheric Res. 2014, 135–136, 380–387, ISSN 0169-8095. [Google Scholar] [CrossRef]
  5. Moris, J.V.; Conedera, M.; Nisi, L.; Bernardi, M.; Cesti, G.; Pezzatti, G.B. Lightning-caused fires in the Alps: Identifying the igniting strokes. Agric. For. Meteorol. 2020, 290, 107990, ISSN 0168-1923. [Google Scholar] [CrossRef]
  6. Pérez-Invernón, F.J.; Huntrieser, H.; Soler, S.; Gordillo-Vázquez, F.J.; Pineda, N.; Navarro-González, J.; Reglero, V.; Montanyà, J.; van der Velde, O.; Koutsias, N. Lightning-ignited wildfires and long continuing current lightning in the Mediterranean Basin: Preferential meteorological conditions. Atmos. Chem. Phys. 2021, 21, 17529–17557. [Google Scholar] [CrossRef]
  7. Schumann, U.; Huntrieser, H. The global lightning-induced nitrogen oxides source. Atmos. Chem. Phys. 2007, 7, 3823–3907. [Google Scholar] [CrossRef] [Green Version]
  8. Ryu, J.-H.; Jenkins, G. Lightning-tropospheric ozone connections: EOF analysis of TCO and lightning data. Atmos. Environ. 2005, 39, 5799–5805. [Google Scholar] [CrossRef]
  9. Williams, E.; Renno, N. An analysis of the conditional instability of the tropical atmosphere. Mon. Weather. Rev. 1993, 121, 21–26. [Google Scholar] [CrossRef] [Green Version]
  10. Moncrieff, M.W.; Miller, M.J. The dynamics and simulation of tropical cumulonimbus and squall lines. Q. J. R. Meteorol. Soc. 120 1976, 432, 373–394. [Google Scholar] [CrossRef]
  11. Sun, M.; Liu, D.; Qie, X.; Mansell, E.R.; Yair, Y.; Fierro, A.O.; Yuan, S.; Chen, Z.; Wang, D. Aerosol effects on electrification and lightning discharges in a multicell thunderstorm simulated by the WRF-ELEC model. Atmos. Chem. Phys. 2021, 21, 14141–14158. [Google Scholar] [CrossRef]
  12. Mansell, E.R.; Ziegler, C.L. Aerosol Effects on Simulated Storm Electrification and Precipitation in a Two-Moment Bulk Microphysics Model. J. Atmos. Sci. 2013, 70, 2032–2050. [Google Scholar] [CrossRef]
  13. Zhao, P.; Yin, Y.; Xiao, H. The effects of aerosol on development of thunderstorm electrification: A numerical study. Atmos. Res. 2015, 153, 376–391. [Google Scholar] [CrossRef]
  14. Jankov, I.; Gallus, W.A., Jr.; Segal, M.; Shaw, B.; Koch, S.E. The impact of Different WRF Model Physical Parameterizations and Their Interactions on Warm Season MCS Rainfall. Weather. Forecast. 2005, 20, 1048–1060. [Google Scholar] [CrossRef]
  15. Jankov, I.; Grasso, L.D.; Sengupta, M.; Neiman, P.J.; Zupanski, D.; Zupanski, M.; Lindsey, D.; Hillger, D.; Birkenheuer, D.L.; Brummer, R.; et al. An Evaluation of Five ARW-WRF Microphysics Schemes Using Synthetic GOES Imagery for an Atmospheric River Event Affecting the California Coast. J. Hydrometeorol. 2011, 12, 618–633. [Google Scholar] [CrossRef] [Green Version]
  16. Morrison, H.; Curry, J.A.; Khvorostyanov, V.I. A New Double-Moment Microphysics Parameterization for Application in Cloud and Climate Models. Part I: Decription. J. Atmos. Sci. 2005, 62, 1665–1677. [Google Scholar] [CrossRef]
  17. Morrison, H.; Gettelman, A. A new two-moment bulk stratiform cloud microphysics scheme in the Community Atmospheric Model (CAM3), Part I: Description and Numerical Tests. J. Clim. 2008, 21, 3642–3659. [Google Scholar] [CrossRef]
  18. Morrison, H.; Thompson, G.; Tatarskii, V. Impact of Cloud Microphysics on the Development of Trailing Stratiform Precipitation in a Simulated Squall Line: Comparison of One- and Two-Moment Schemes. Mon. Weather Rev. 2009, 137, 991–1007. [Google Scholar] [CrossRef] [Green Version]
  19. Morrison, H.; Morales, A.; Villanueva-Birriel, C. Concurrent Sensitivities of an Idealized Deep Convective Storm to Parameterization of Microphysics, Horizontal Grid Resolution, and Environmental Static Stability. Mon. Weather Rev. 2015, 143, 2082–2104. [Google Scholar] [CrossRef]
  20. Thompson, G.; Rasmussen, R.M.; Manning, K. Explicit Forecasts of Winter Precipitation Using an Improved Bulk Microphysics Scheme. Part I: Description and Sensitivity Analysis. Mon. Weather Rev. 2004, 132, 519–542. [Google Scholar] [CrossRef] [Green Version]
  21. Thompson, G.; Field, P.R.; Rasmussen, R.M.; Hall, W.D. Explicit Forecasts of winter precipitation using an improved bulk microphysics scheme. Part II: Implementation of a new snow parameterization. Mon. Weather Rev. 2008, 136, 5095–5115. [Google Scholar] [CrossRef]
  22. Vigaud, N.; Richard, Y.; Rouault, M.; Fauchereau, N. Moisture transport between the South Atlantic Ocean and southern Africa: Relationships with summer rainfall and associated dynamics. Clim. Dyn. 2009, 32, 113–123. [Google Scholar] [CrossRef]
  23. Hong, S.-Y.; Lim, K.-S.S.; Lee, Y.-H.; Ha, J.-C.; Kim, H.-W.; Ham, S.-J.; Dudhia, J. Evaluation of the WRF Double-Moment 6-Class Microphysics Scheme for Precipitating Convection. Adv. Meteorol. 2010, 2010, 707253. [Google Scholar] [CrossRef] [Green Version]
  24. Rajeevan, M.; Kesarkar, A.; Thampi, S.B.; Rao, T.N.; Radhakrishna, B.; Rajasekhar, M. Sensitivity of WRF cloud microphysics to simulations of a severe thunderstorm event over Southeast India. Ann. Geophys. 2010, 28, 603–619. [Google Scholar] [CrossRef]
  25. Pohl, B.; Crétat, J.; Camberlin, P. Testing WRF capability in simulating the atmospheric water cycle over Equatorial East Africa. Clim. Dyn. 2011, 37, 1357–1379. [Google Scholar] [CrossRef]
  26. Niu, G.-Y.; Yang, Z.-L.; Mitchell, K.E.; Chen, F.; Ek, M.B.; Barlage, M.; Kumar, A.; Manning, K.; Niyogi, D.; Rosero, E.; et al. The community Noah land surface model with multiparameterization options (Noah-MP): 1. Model description and evaluation with local-scale measurements. J. Geophys. Res. 2011, 116, D12109. [Google Scholar] [CrossRef] [Green Version]
  27. Lee, S.S.; Donner, L.J. Effects of cloud parameterization on radiation and precipitation: A comparison between single-moment microphysics and double-moment microphysics. Terr. Atmos. Ocean. Sci. 2011, 22, 403–420. [Google Scholar] [CrossRef] [Green Version]
  28. Molthan, A.L. Evaluating the Performance of Single and Double Moment Microphysics Schemes During a Synoptic-Scale Snowfall Event; AMS Conferences on Weather and Forecasting/Numerical Weather Prediction: Seattle, WA, USA, 2011. [Google Scholar]
  29. Song, X.; Zhang, G.J.; Li, J.-L.F. Evaluation of Microphysics Parameterization for Convective Clouds in the NCAR Community Atmosphere Model CAM5. J. Clim. 2012, 25, 8568–8590. [Google Scholar] [CrossRef]
  30. Wheatley, D.M.; Yussouf, N.; Stensrud, D.J. Ensemble Kalman Filter Analyses and Forecasts of a Severe Mesoscale Convective System Using Different Choices of Microphysics Schemes. Mon. Weather Rev. 2014, 142, 3243–3263. [Google Scholar] [CrossRef]
  31. Grabowski, W.W. Extracting Microphysical Impacts in Large-Eddy Simulations of Shallow Convection. J. Atmos. Sci. 2014, 71, 4493–4499. [Google Scholar] [CrossRef]
  32. Storer, R.L.; Zhang, G.J.; Song, X. Effects of Convective Microphysics Parameterization on Large-Scale Cloud Hydrological Cycle and Radiative Budget in Tropical and Midlatitude Convective Regions. J. Clim. 2015, 28, 9277–9297. [Google Scholar] [CrossRef]
  33. Min, K.-H.; Choo, S.-H.; Lee, D.-H.; Lee, G.-W. Evaluation of WRF Cloud Microphysics Schemes Using Radar Observations. Weather Forecast. 2015, 30, 1571–1589. [Google Scholar] [CrossRef]
  34. Pieri, A.B.; Von Hardenberg, J.; Parodi, A.; Provenzale, A. Sensitivity of Precipitation Statistics to Resolution, Microphysics, and Convective Parameterization: A Case Study with the High-Resolution WRF Climate Model over Europe. J. Hydrometeorol. 2015, 16, 1857–1872. [Google Scholar] [CrossRef]
  35. Halder, M.; Hazra, A.; Mukhopadhyay, P.; Siingh, D. Effect of the better representation of the cloud ice-nucleation in WRF microphysics schemes: A case study of a severe storm in India. Atmos. Res. 2015, 154, 155–174. [Google Scholar] [CrossRef]
  36. Khain, A.; Lynn, B.; Shpund, J. High resolution WRF simulations of Hurricane Irene: Sensitivity to aerosols and choice of microphysical schemes. Atmos. Res. 2016, 167, 129–145. [Google Scholar] [CrossRef] [Green Version]
  37. Bossioli, E.; Tombrou-Tzella, M.; Dandou, A.; Athanasopoulou, E.; Varotsos, K.V. The Role of Planetary Boundary-Layer Parameterizations in the Air Quality of an Urban Area with Complex Topography. Bound.-Layer Meteorol. 2009, 131, 53–72. [Google Scholar] [CrossRef]
  38. De Meij, A.; Gzella, A.; Cuvelier, C.; Thunis, P.; Bessagnet, B.; Vinuesa, J.F.; Menut, L.; Kelder, H.M. The impact of MM5 and WRF meteorology over complex terrain on CHIMERE model calculations. Atmos. Chem. Phys. 2009, 9, 6611–6632. [Google Scholar] [CrossRef] [Green Version]
  39. De Foy, B.; Lei, W.; Zavala, M.; Volkamer, R.; Samuelsson, J.; Mellqvist, J.; Galle, B.; Martínez, A.-P.; Grutter, M.; Molina, L.T. Modelling constraints on the emission inventory and on vertical diffusion for CO and SO2 in the Mexico City Metropolitan Area using Solar FTIR and zenith sky UV spectroscopy. Atmos. Chem. Phys. Discuss. 2006, 6, 6125–6181. [Google Scholar]
  40. Mao, Q.; Gautney, L.L.; Cook, T.M.; Jacobs, M.E.; Smith, S.N.; Kelsoe, J.J. Numerical experiments on MM5–CMAQ sensitivity to various PBL schemes. Atmos. Environ. 2006, 40, 3092–3110. [Google Scholar] [CrossRef]
  41. Pérez, C.; Jiménez, P.; Jorba, O.; Sicard, M.; Baldasano, J.M. Influence of the PBL scheme on high-resolution photochemical simulations in an urban coastal area over the Western Mediterranean. Atmos. Environ. 2006, 40, 5274–5297. [Google Scholar] [CrossRef]
  42. Lee, S.H.; Kim, S.W.; Angevine, W.; Bianco, L.; McKeen, S.; Senff, C.; Trainer, M.; Tucker, S.; Zamora, R. Evaluation of urban surface parameterizations in the WRF model using measurements during the Texas Air Quality Study 2006 field campaign. Atmos. Chem. Phys. 2010, 11, 2127–2143. [Google Scholar] [CrossRef] [Green Version]
  43. De Meij, A.; Vinuesa, J. Impact of SRTM and Corine Land Cover data on meteorological parameters using WRF. Atmos. Res. 2014, 143, 351–370. [Google Scholar] [CrossRef]
  44. Farr, T.G.; Rosen, P.A.; Caro, E.; Crippen, R.; Duren, R.; Hensley, S.; Kobrick, M.; Paller, M.; Rodriguez, E.; Roth, L.; et al. The Shuttle Radar Topography Mission. Rev. Geophys. 2007, 45, RG2004. Available online: https://agupubs.onlinelibrary.wiley.com/doi/full/10.1029/2005RG000183 (accessed on 25 April 2022). [CrossRef] [Green Version]
  45. Heymann, Y.; Steenmans, C.; Croissille, G.; Bossard, M. CORINE Land Cover. In Technical Guide; EUR12585; Office for Official Publications of the European Communities: Luxembourg, 1994. [Google Scholar]
  46. Büttner, G.; Feranec, J.; Jaffrain, G.; Mari, L.; Maucha, G.; Soukup, T. The European CORINE Land Cover Database. In Proceedings of the ISPRS Commission VII Symposium, Budapest, Hungary, 1–4 September 1998; pp. 633–638. [Google Scholar]
  47. Büttner, G.; Feranec, G.; Jaffrain, G. Corine Land Cover Update 2000, Technical Guidelines. EEA Technical Report No 89. 2002. Available online: http://reports.eea.europa.eu/technical_report_2002_89/en (accessed on 25 April 2022).
  48. Weather Research and Forecasting Model. Available online: https://www.mmm.ucar.edu/weather-research-and-forecasting-model (accessed on 25 April 2022).
  49. Skamarock, W.C.; Klemp, J.B.; Dudhia, J.; Gill, D.O.; Liu, Z.; Berner, J.; Wang, W.; Powers, J.G.; Duda, M.G.; Barker, D.M.; et al. A Description of the Advanced Research WRF Version 4; NCAR Technical Note NCAR/TN-556 + STR; National Center for Atmospheric Research: Boulder, CO, USA, 2019; 145p. [Google Scholar] [CrossRef]
  50. De Meij, A.; Bossioli, E.; Penard, C.; Vinuesa, J.; Price, I. The effect of SRTM and Corine Land Cover data on calculated gas and PM10 concentrations in WRF-Chem. Atmos. Environ. 2015, 101, 177–193. [Google Scholar] [CrossRef]
  51. Grell, G.A.; Peckham, S.E.; Schmitz, R.; McKeen, S.A.; Frost, G.; Skamarock, W.C.; Eder, B. Fully coupled online chemistry within the WRF model. Atmos. Environ. 2005, 39, 6957–6975. [Google Scholar] [CrossRef]
  52. Fast, J.D.; Gustafson, W.I., Jr.; Easter, R.C.; Zaveri, R.A.; Barnard, J.C.; Chapman, E.G.; Grell, G.A.; Peckham, S.E. Evolution of ozone, particulates, and aerosol direct radiative forcing in the vicinity of Houston using a fully coupled meteorology-chemistry-aerosol model. J. Geophys. Res. 2006, 111, D21305. [Google Scholar] [CrossRef]
  53. Wong, J.; Barth, M.C.; Noone, D. Evaluating a lightning parameterization based on cloud-top height for mesoscale numerical model simulations. Geosci. Model Dev. 2013, 6, 429–443. [Google Scholar] [CrossRef] [Green Version]
  54. Price, C.; Rind, D. A simple lightning parameterization for calculating global lightning distributions. J. Geophys. Res. Earth Surf. 1992, 97, 9919–9933. [Google Scholar] [CrossRef]
  55. Giannaros, T.; Kotroni, V.; Lagouvardos, K. Predicting Lightning Activity in Greece with the Weather Research and Forecasting (WRF) Model. Atmos. Res. 2015, 156, 1–13. [Google Scholar] [CrossRef]
  56. Anderson, J.R. System for Land Use and Land Cover Classification; US Government Printing Office: Washington, DC, USA, 1976.
  57. Pineda, N.; Jorba, O.; Jorge, J.; Baldasano, J.M. Using NOAA AVHRR and SPOT VGT data to estimate surface parameters: Application to a mesocale meteorological model. Int. J. Remote Sens. 2004, 25, 129–143. [Google Scholar] [CrossRef]
  58. SRTM 90 m DEM Digital Elevation Database. Available online: https://srtm.csi.cgiar.org/ (accessed on 25 April 2022).
  59. Chen, F.; Dudhia, J. Coupling an advanced landsurface/ hydrologymodel with the Penn State/NCAR MM5 modeling system. Part I: Model description and implementation. Mon. Weather Rev. 2001, 129, 569–585. [Google Scholar] [CrossRef] [Green Version]
  60. Janjic, Z.I. The Surface Layer in the NCEP Eta Model. In Proceedings of the 11th Conference on NWP, Norfolk, VA, USA, 19–23 August 1996; American Meteorological Society: Boston, MA, USA, 1996; pp. 354–355. [Google Scholar]
  61. Janjic, Z.I. Comments on Development and Evaluation of a Convection Scheme for Use in Climate Models. J. Atmos. Sci. 2000, 57, 3686. [Google Scholar] [CrossRef]
  62. Janjic, Z.I. The step-mountain eta coordinate model: Further developments of the convection, viscous sublayer and turbulence closure schemes. Mon. Weather Rev. 1994, 122, 927–945. [Google Scholar] [CrossRef] [Green Version]
  63. Monin, A.S.; Obukhov, A.M. Basic laws of turbulent mixing in the surface layer of the atmosphere. Tr. Akad. Nauk. SSSR Geofiz. Inst. 1954, 24, 163–187, English Translation by John Miller, 1959. [Google Scholar]
  64. Mlawer, E.J.; Taubman, S.J.; Brown, P.D.; Iacono, M.J.; Clough, S.A. Radiative transfer for inhomogeneous atmospheres: RRTM, a validated correlated-k model for the longwave. J. Geophys. Res. Atmos. 1997, 102, 16663–16682. [Google Scholar] [CrossRef] [Green Version]
  65. Chou, M.-D.; Suarez, M.J. A Solar Radiation Parameterization (CLIRAD-SW) Developed at Goddard Climate and Radiation Branch for Atmospheric Studies. Technical Memorandum 15, Technical Report Series on Global Modeling and Data Assimilation. NASA Tech. Memo. NASA/TM-1999-104606 1999, 15, 48. [Google Scholar]
  66. A Description of the Advanced Research WRF Model Version 4. Available online: https://opensky.ucar.edu/islandora/object/technotes%3A588/datastream/PDF/download/A_Description_of_the_Advanced_Research_WRF_Model_Version_4_3. (accessed on 25 April 2022).
  67. User’s Guide for the Advanced Research WRF (ARW) Modeling System Version 3.9. Available online: https://www2.mmm.ucar.edu/wrf/users/docs/user_guide_V3/user_guide_V3.9/users_guide_chap5.htm (accessed on 25 April 2022).
  68. Schulz, W.; Diendorfer, G.; Pedeboy, S.; Poelman, D.R. The European lightning location system EUCLID—Part 1: Performance analysis and validation. Nat. Hazards Earth Syst. Sci. 2016, 16, 595–605. [Google Scholar] [CrossRef] [Green Version]
  69. Poelman, D.R.; Schulz, W.; Diendorfer, G.; Bernardi, M. The European lightning location system EUCLID—Part 2: Observations. Nat. Hazards Earth Syst. Sci. 2016, 16, 607–616. [Google Scholar] [CrossRef] [Green Version]
  70. University of Wyoming, College of Engineering, Department of Atmospheric Science. Atmospheric Sounding. Available online: http://weather.uwyo.edu/upperair/sounding.html (accessed on 25 April 2022).
  71. Diendorfer, G.; Pichler, H.; Mair, M. Some Parameters of Negative Upward-Initiated Lightning to the Gaisberg Tower (2000–2007). IEEE Trans. Electromagn. Compat. 2009, 51, 443–452. [Google Scholar] [CrossRef]
  72. Heidler, F.; Schulz, W. Lightning current measurements compared to data from the lightning location system BLIDS. In Proceedings of the International Colloquium on Lightning and Power Systems (CIGRE), Bologna, Italy, 27–29 June 2016. [Google Scholar]
  73. Romero, C.; Paolone, M.; Rachidi, F.; Rubinstein, M.; Rubinstein, A.; Diendorfer, G.; Schulz, W.; Bernardi, M.; Nucci, C.A. Preliminary comparison of data from the Säntis Tower and the EUCLID lightning location system. In Proceedings of the 2011 International Symposium on Lightning Protection (XI SIPDA), Fortalzea, Brazil, 3–7 October 2011; pp. 140–145. [Google Scholar]
  74. Azadifar, M.; Rachidi, F.; Rubinstein, M.; Paolone, M.; Diendorfer, G.; Pichler, H.; Schulz, W.; Pavanello, D.; Romero, C. Evaluation of the performance characteristics of the European Lightning Detection Network EUCLID in the Alps region for upward negative flashes using direct measurements at the instrumented Säntis Tower. J. Geophys. Res. Atmos. 2016, 121, 595–606. [Google Scholar] [CrossRef]
  75. Poelman, D.R.; Schulz, W.; Vergeiner, C. Performance Characteristics of Distinct Lightning Detection Networks Covering Belgium. J. Atmos. Ocean. Technol. 2013, 30, 942–951. [Google Scholar] [CrossRef]
  76. Ducrocy, V.; Braud, I.; Davolio, S.; Ferretti, R.; Flamant, C.; Jansa, A.; Kalthoff, N.; Richard, E.; Taupier-Letage, I.; Ayral, P.-A.; et al. HyMeX-SOP1, the field campaign dedicated ot heavy precipitation and flash flooding in the northwestern Mediterranean. B Am. Meteorol. Soc. 2013, 95, 1083–1100. [Google Scholar] [CrossRef] [Green Version]
  77. Defer, E.; Pinty, J.-P.; Coquillat, S.; Martin, J.-M.; Prieur, S.; Soula, S.; Richard, E.; Rison, W.; Krehbiel, P.; Thomas, R.; et al. An overview of the lightning and atmospheric electricity observations collected in southern France during the HYdrological cycle in Mediterranean EXperiment (HyMeX), Special Observation Period 1. Atmos. Meas. Technol. 2015, 8, 649–669. [Google Scholar] [CrossRef] [Green Version]
  78. Schulz, W.; Pedeboy, S.; Vergeiner, C.; Defer, E.; Rison, W. Validation of the EUCLID LLS during HyMeX SOP1. In Proceedings of the 23rd International Lightning Detection Conference & 5th International Lightning Meteorology Conference (ILDC/ILMC), Tucson, AZ, USA, 18–21 March 2014. [Google Scholar]
  79. Pédeboy, S.; Defer, E.; Schulz, W. Performance of the EUCLID network in cloud lightning detection in the South-East France. In Proceedings of the 8th HyMeX Workshop, Valletta, Malta, 15–18 September 2014. [Google Scholar]
  80. Ball, F.K. Control of inversion height by surface heating. Quart. J. Roy. Meteor. Soc. 1960, 86, 483–494. [Google Scholar] [CrossRef]
  81. Fraedrich, K.; Kleidon, A.; Lunkeit, F. A Green Planet versus a Desert World: Estimating the Effect of Vegetation Extremes on the Atmosphere. J. Clim. 1999, 12, 3156–3163. [Google Scholar] [CrossRef]
  82. Stull, R.B. An Introduction to Boundary Layer Meteorology; Kluwer Academic: Amsterdam, The Netherlands, 1998; 670p. [Google Scholar]
  83. Corfidi, S.F.; Corfidi, S.J.; Schultz, D.M. Forecasters’ Forum, Elevated Convection and Castellanus: Ambiguities, Significance, and Questions. Weather Forecast. 2008, 23, 1280. [Google Scholar] [CrossRef] [Green Version]
  84. Van den Hurk, B.J.J.M. Sparse Canopy Parameterizations for Meteorological Models. Ph.D. Thesis, Wageningen Agricultural University, Wageningen, The Netherlands, 1995. [Google Scholar]
  85. Mar, K.A.; Ojha, N.; Pozzer, A.; Butler, T.M. Ozone air quality simulations with WRF-Chem (v3.5.1) over Europe: Model evaluation and chemical mechanism comparison. Geosci. Model Dev. 2016, 9, 3699–3728. [Google Scholar] [CrossRef] [Green Version]
  86. Hersbach, H.; Bell, B.; Berrisford, P.; Hirahara, S.; Horanyi, A.; Muñoz-Sabater, J.; Nicolas, J.; Peubey, C.; Radu, R.; Schepers, D.; et al. The ERA5 global reanalysis. Q. J. R. Meteorol. Soc. 2020, 146, 1999–2049. [Google Scholar] [CrossRef]
  87. Petersen, W.A.; Christian, H.J.; Rutledge, S.A. TRMM observations of the global relationship between ice water content and lightning. Geophys. Res. Lett. 2005, 32, L14819. [Google Scholar] [CrossRef] [Green Version]
  88. McCaul, E.W., Jr.; Goodman, S.J.; Lacasse, K.M.; Cecil, D.J. Forecasting Lightning Threat Using Cloud-Resolving Model Simulations. Weather Forecast. 2009, 24, 709–729. [Google Scholar] [CrossRef]
  89. Kain, J.S.; Weiss, S.J.; Bright, D.R.; Baldwin, M.E.; Levit, J.J.; Carbin, G.W.; Schwartz, C.S.; Weisman, M.L.; Droegemeier, K.K.; Weber, D.B.; et al. Some Practical Considerations Regarding Horizontal Resolution in the First Generation of Operational Convection-Allowing NWP. Weather. Forecast. 2008, 23, 931–952. [Google Scholar] [CrossRef]
  90. Singh, J.; Singh, N.; Ojha, N.; Sharma, A.; Pozzer, A.; Kumar, N.K.; Rajeev, K.; Gunthe, S.S.; Kotamarthi, V.R. Effects of spatial resolution on WRF v3.8.1 simulated meteorology over the central Himalaya. Geosci. Model Dev. 2021, 14, 1427–1443. [Google Scholar] [CrossRef]
  91. De Meij, A.; Zittis, G.; Christoudias, T. On the uncertainties introduced by land cover data in high-resolution regional simulations. Arch. Meteorol. Geophys. Bioclimatol. Ser. B 2018, 131, 1213–1223. [Google Scholar] [CrossRef]
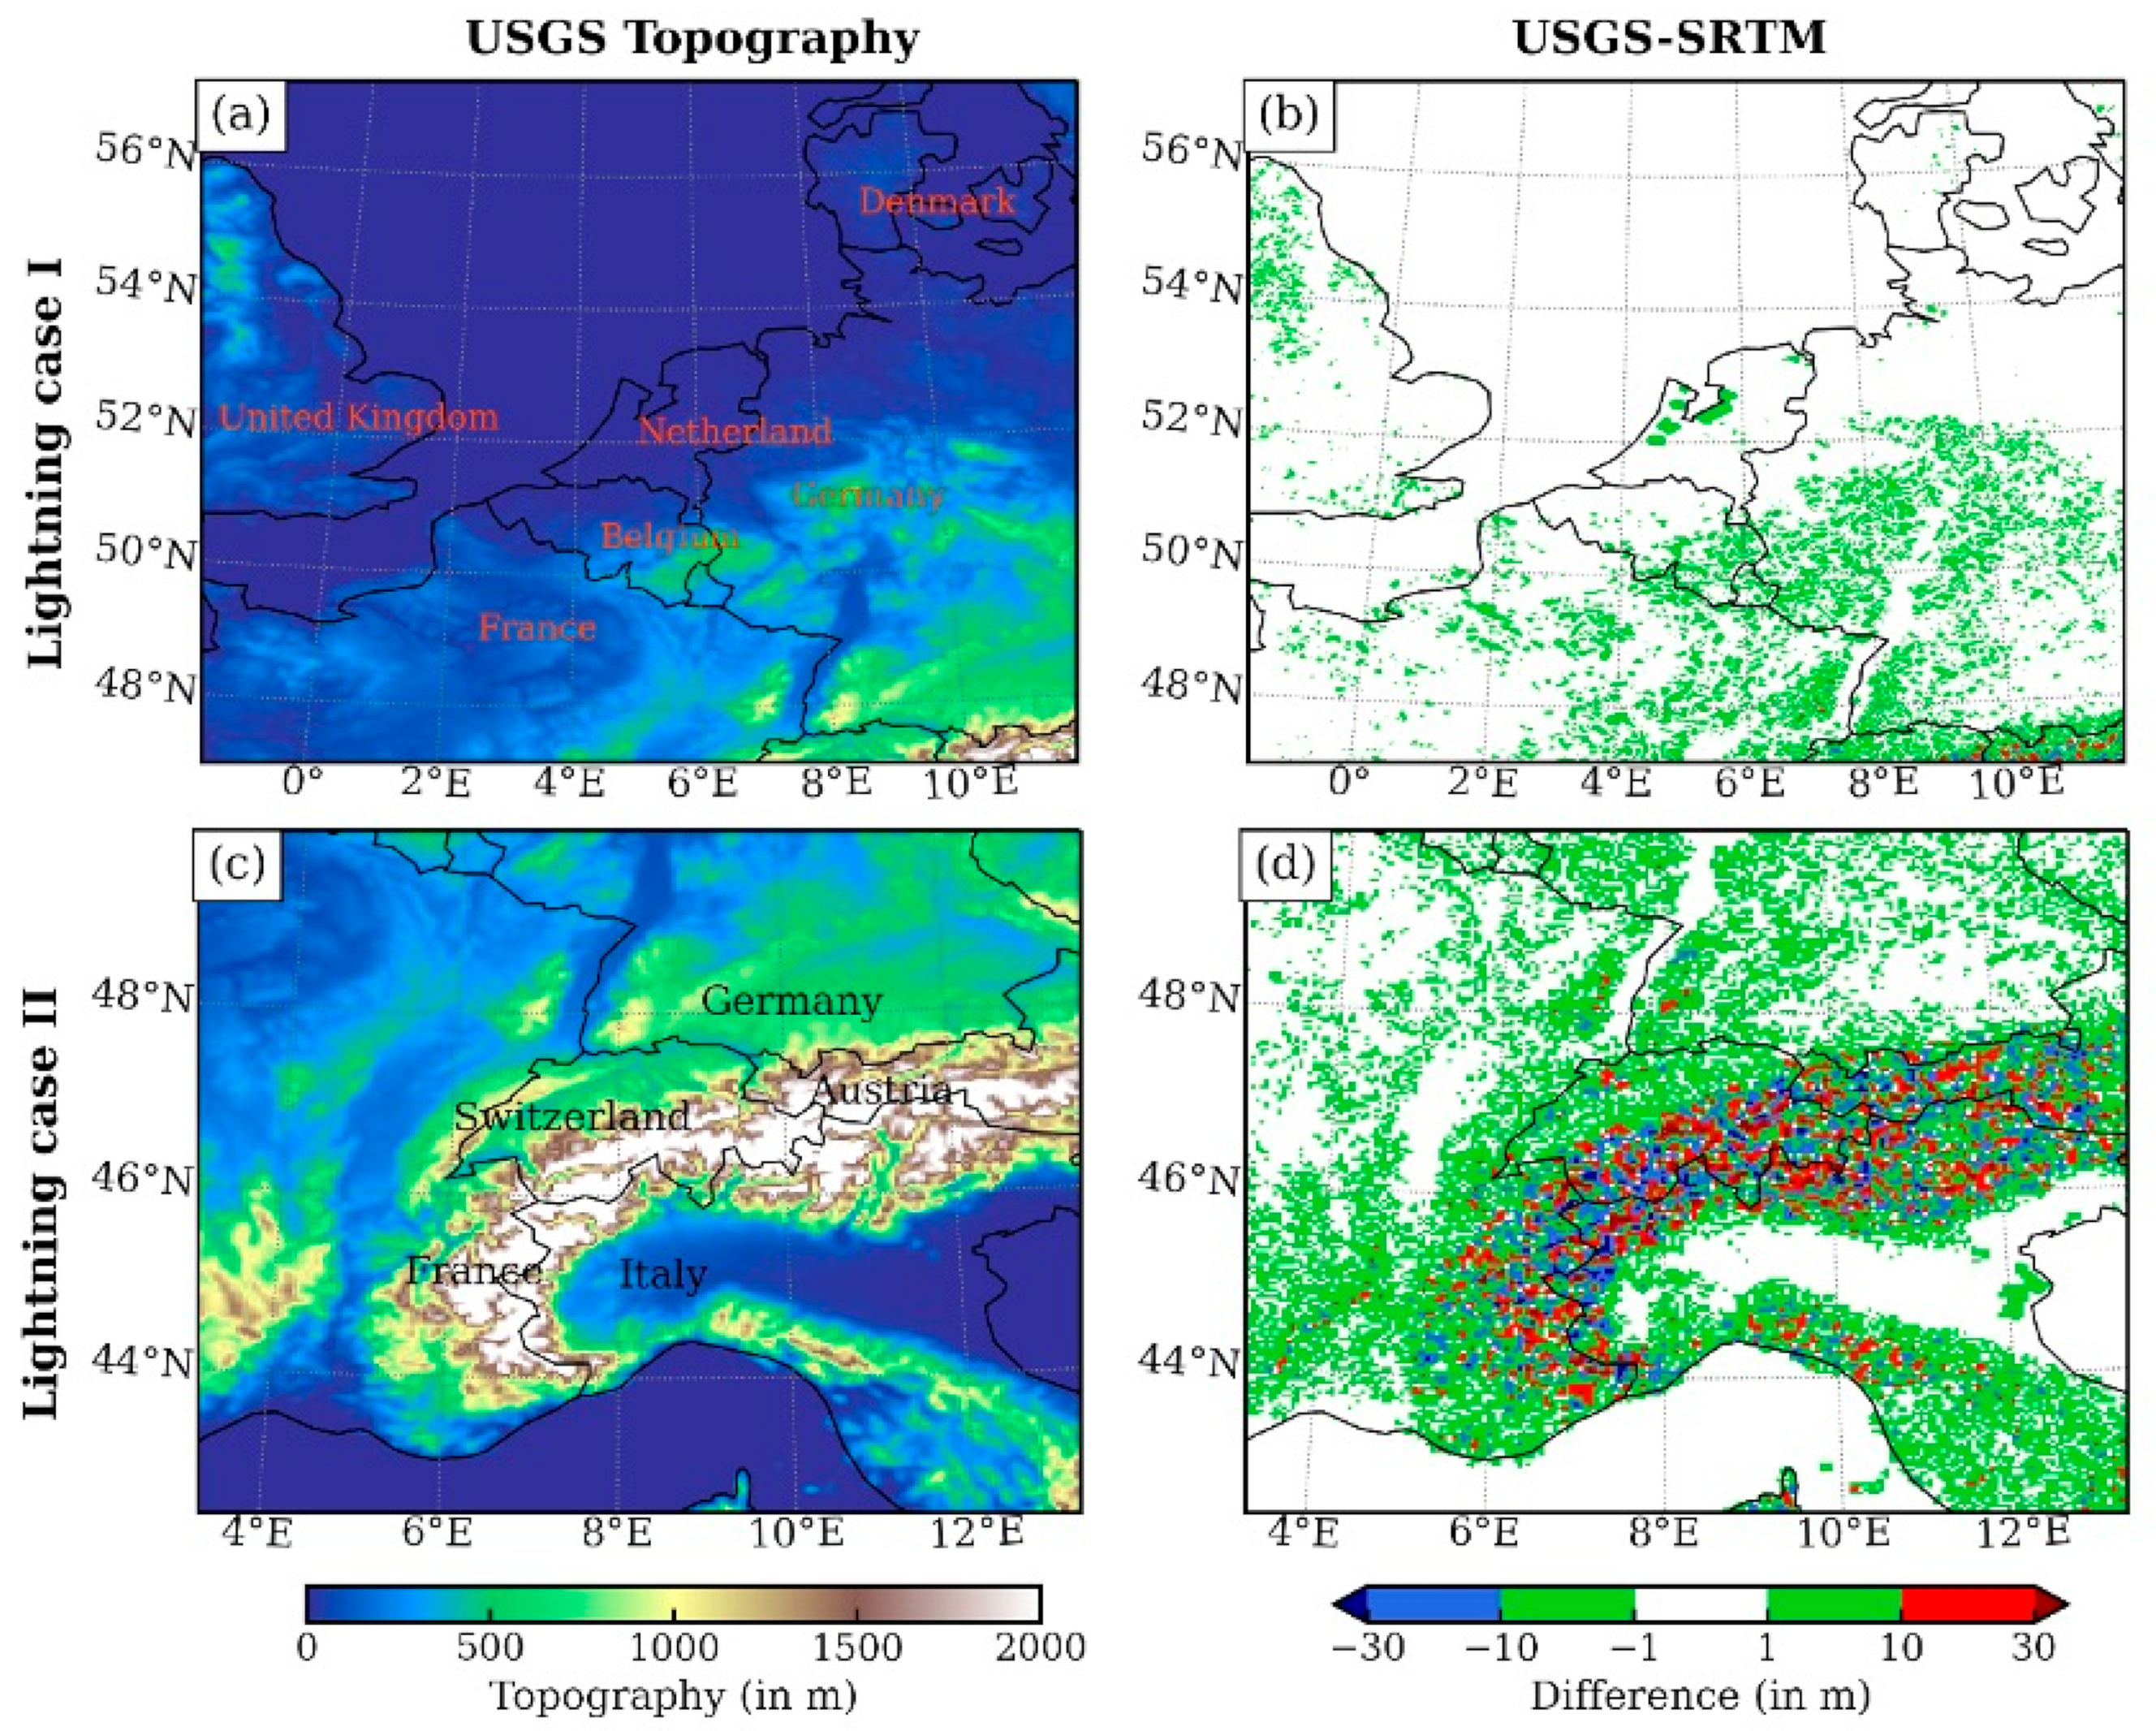
Figure 1. Area covered by the domain and variation in topographic height for (a,b) Case I: 18 August 2011 (first row) and (c,d) Case II: 29 July 2013 (second row).
Atmosphere 13 01050 g001
Figure 2. Geographical representation of the main land-use category classes with domains for (a,b) Case I: 18 August 2011 (first row) and (c,d) Case II: 29 July 2013 (second row). The first column shows default USGS LULC, and the second column shows updated Corine LULC.
Atmosphere 13 01050 g002
Figure 3. (a) The distribution of lightning flashes on 18 August 2011 at different hours (15, 17, 18 and 20 UTC) for ground-based observation (first row, ad) and USGS (second row, eh). The third row (il) shows the difference in the number of lightning flashes between USGS and Corine LULC, and the fourth row (mp) shows the difference between USGS and Corine with SRTM. (q) Statistically significant differences (indicated with dots at a statistically significant difference at 95% level) between WRF_USGS and WRF_CLC for 18 August 2011 Case I based on Student’s t-test.
Atmosphere 13 01050 g003
Figure 4. The distribution of lightning flashes based on ground-based observation (first row ad), USGS (second row eh), Corine (third row il), Corine + SRTM (fourth row) (mp) at different hours (0, 2, 6 and 8 UTC) on 29 July 2013. The differences between USGS, Corine and Corine + SRTM are shown in the third and fourth rows.
Atmosphere 13 01050 g004
Figure 5. Latent heat fluxes according to (a) USGS, and differences in LH between (b) USGS and Corine and (c) USGS and Corine + SRTM at 12 UTC on 18 August 2011.
Atmosphere 13 01050 g005
Figure 6. Sensible heat fluxes according to (a) USGS, and differences in LH between (b) USGS and Corine and (c) USGS and Corine + SRTM at 12 UTC on 18 August 2011.
Atmosphere 13 01050 g006
Figure 7. Vertical profile of bias in temperature over five radiosonde stations (Idar, Trappes, Bergen, De Bilt and Herstmonceux) on 18 August 2011 at 12 UTC. The values by WRF_USGS are presented in red colour, and the values by WRF_CLC are given in green colour.
Atmosphere 13 01050 g007
Figure 8. Vertical profile of bias in specific humidity (Q) over five radiosonde stations (Idar, Trappes, Bergen, De Bilt and Herstmonceux) on 18 August 2011 at 12 UTC. The values by WRF_USGS are presented in red colour, and the values by WRF_CLC are given in green colour.
Atmosphere 13 01050 g008
Figure 9. Vertical profile of bias in wind speed over five radiosonde stations (Idar, Trappes, Bergen, De Bilt and Herstmonceux) on 18 August 2011 at 12 UTC. The values by WRF_USGS are presented in red colour, and the values by WRF_CLC are given in green colour.
Atmosphere 13 01050 g009
Figure 10. Comparison of CAPE from (a)ERA5, (b) USGS, (c) Corine and (d) Corine + SRTM at 12 UTC on 18 August 2011.
Atmosphere 13 01050 g010
Figure 11. Comparison of the vertical wind at pressure level 850 hPa from ERA5 (a), USGS (b), Corine (c) and Corine + SRTM at 12 UTC on 18 August 2011.
Atmosphere 13 01050 g011
Figure 12. Comparison of the vertical velocity for three different hours, (a) 10 UTC (before the lightning event), (b) 18 UTC and (c) 20 UTC (during the lightning event) on 18 August 2011.
Atmosphere 13 01050 g012
Figure 13. Simulated radar reflectivity (a) at −15 °C and the updraft helicity (b) at 2 UTC on 29 July 2013. The upward helicity was calculated by the routine “udhel” in the wrf-python processing tool based on [89].
Atmosphere 13 01050 g013
Table 1. Comparison of the land-use categories together with the number of cells per land use with the domains; region of homogeneous terrain: Case I (18 August 2011), and region of complex mountain terrain: Case II (29 July 2013).
USGS Land-Use Category
Land-Use Description
# Cells in Case I# Cells in Case II
USGSCORINEUSGSCORINE
1Urban and Built-up Land82226491321105
2Dryland Cropland and Pasture38,51433,18523,80316,214
3Irrigated Cropland and Pasture20-74235
4Mixed Dryland/Irrigated Cropland and Pasture----
5Cropland/Grassland Mosaic1455-202-
6Cropland/Woodland Mosaic796152210943021
7Grassland103043721074
8Shrubland13-155-
9Mixed Shrubland/Grassland-375303734
10Savanna3-103-
11Deciduous Broadleaf Forest2863343452325845
12Deciduous Needleleaf Forest----
13Evergreen Broadleaf----
14Evergreen Needleleaf685306922254471
15Mixed Forest1172913601668
16Water Bodies28,80925,84962095995
17Herbaceous Wetland-775-56
18Wooden Wetland13-3-
19Barren or Sparsely Vegetated-14661933
20Herbaceous Tundra----
21Wooded Tundra20-945-
22Mixed Tundra----
23Bare Ground Tundra----
24Snow or Ice3-20976
Table 2. Mean bias error (MBE) and Root-mean-square error (RMSE) in the model-simulated meteorological profiles of Temperature (T), Specific humidity (Q) and Wind speed (WS) over five radiosonde stations between 900–500 hPa on 18 August 2011 at 12 UTC.
IdarTrappesBergenDe BiltHerstmonceux
USGSCorineUSGSCorineUSGSCorineUSGSCorineUSGSCorine
T (°C)MBE0.530.140.440.400.210.150.140.100.210.05
RMSE0.940.630.430.480.140.200.850.690.630.29
Q (g kg−1)MBE1.501.01−0.36−0.330.520.650.070.070.770.89
RMSE6.473.932.011.960.730.780.820.560.821.19
WS (ms−1)MBE3.603.64−0.67−0.73−1.02−0.51−1.25−0.440.11−0.80
RMSE20.1217.964.835.162.361.693.392.152.001.82
Table 3. Domain-wide median values of CAPE and the vertical wind among the ERA5, USGS, Corine and Corine + SRTM at 12 UTC on 18 August 2011.
ERA5USGS (WRF_USGS)CORINE (WRF_CLC)COR_SRTM (WRF_CLCS)
CAPE (J kg−1)768118011601154
Vertical wind (m·s−1)−0.020.030.040.04
Publisher’s Note: MDPI stays neutral with regard to jurisdictional claims in published maps and institutional affiliations.