1. Introduction
The Black Sea is a large deep-water basin on the border between the European and Asian continents lying in the continental mid-latitude climate zone. It is an important climatic factor for all borderline countries (Bulgaria, Romania, Ukraine, Russia, Georgia and Turkey). The open plane in the north enables the propagation effect of the Siberian High in winter, and thus severe winter conditions often occur. On the other hand, in the south, the Mediterranean Sea affects the climate: Mediterranean cyclones frequently pass through the area, leading to moderate or mild weather conditions.
Black Sea freezing is observed regularly in its northern parts and near the Kerch Straits, and occasionally spreads during cold winters to the south, reaching the Romanian coast [
1]. Russian authors reported several cases of heavy freezing on the northern coast in the 20th century [
2,
3,
4,
5,
6,
7]. The relation of the freezing events to weather conditions is investigated in [
8,
9], which identify the importance of the ratio between zonal and meridional atmosphere circulation: zonal circulation is enhanced in mild winters and meridional circulation is stronger in cold winters.
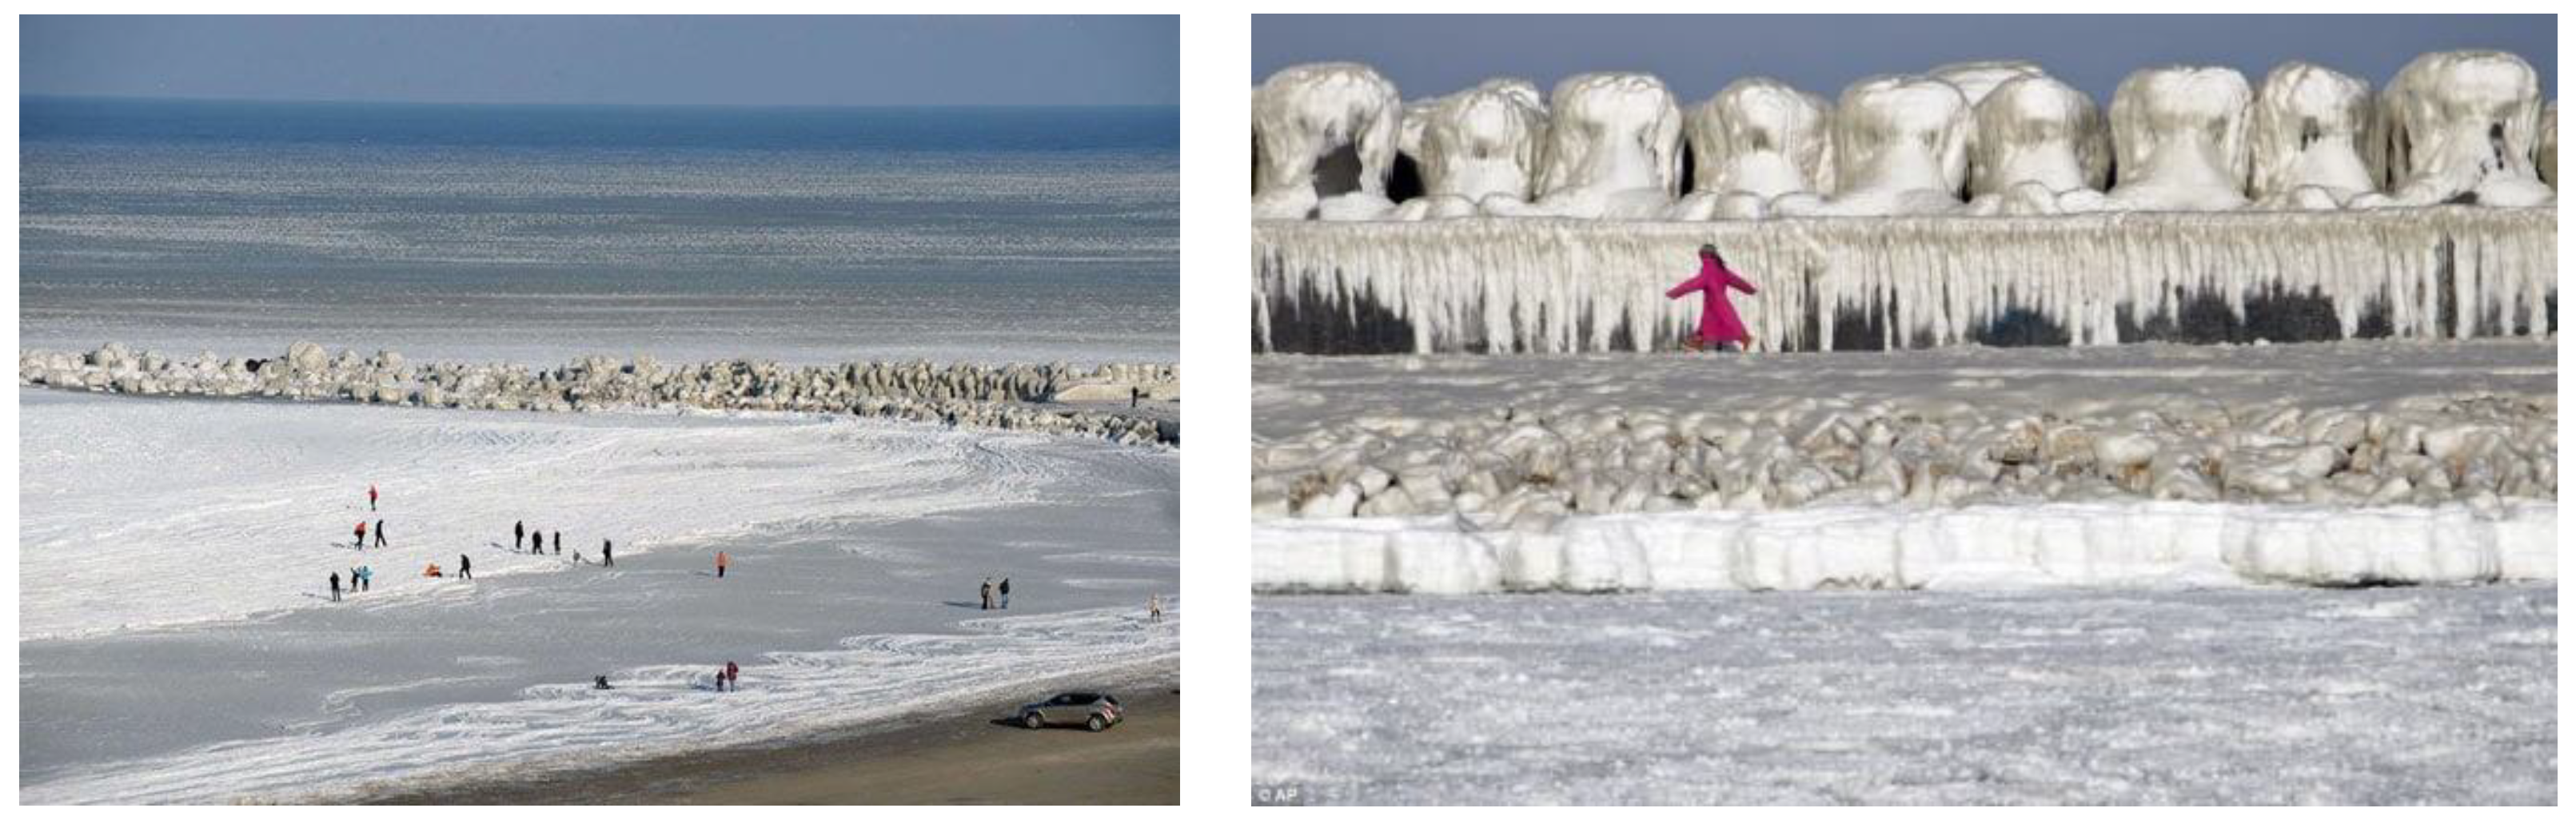
Since 1972, moderate freezing has been observed in the Black Sea, but February 2012 was extremely cold and the Black Sea ice reached Constanta in Romania (
Figure 1), as reported by the media. The winter of 2017 was also anomalously cold in this area. Most of the studies of Black Sea ice formation are published by Russian authors and are rather outdated. The present article is a continuation of our previous work [
10]. Our aim is to update the information on Black Sea freezing using available recent satellite observations. Further motivation for this is the fact that the present operational numerical models of Black Sea circulation (for example, the Copernicus Marine Service operational Black Sea model) do not take into account ice formation; we would like to determine if sea-ice occurrence is regular and needs to be considered.
The other objective of our work is to analyze the long-term variability of the thermal regime and winter severity in the region in relation to freezing, based on the available data for the 20th century and after. This could shed light on the atmospheric conditions leading to freezing and enhance the predictability of such events. We found that the winter conditions tended to be milder in the 20th century and the beginning of 21st century, but this is not directly related to the freezing events. Thus, ice formation could be taken as a measure of the local and regional atmospheric winter conditions.
The novelty of this paper is that we quantify the areas covered with ice in the Black Sea using the satellite data product of NSIDC, so that the identification of the intense freezing events since 2006 is possible. We also obtain new information from the qualitative analysis of the meteorological conditions favorable for ice formation.
2. Data and Methods Used in the Study
The aim of this study is to combine different data sources on sea-ice cover and air temperature in order to study the recent freezing occurrence and in general the interannual variability over recent decades.
Data for the extent of sea ice were taken from the US National Snow and Ice Data Center product Multisensor Analyzed Sea Ice Extent—Northern Hemisphere (MASIE-NH) [
12]. This provides daily sea-ice data from 1 January 2006 to the present (NICNSIDC, 2010). The accuracy of this product was investigated for the Arctic region in [
13], through a comparison using passive microwave sensors.
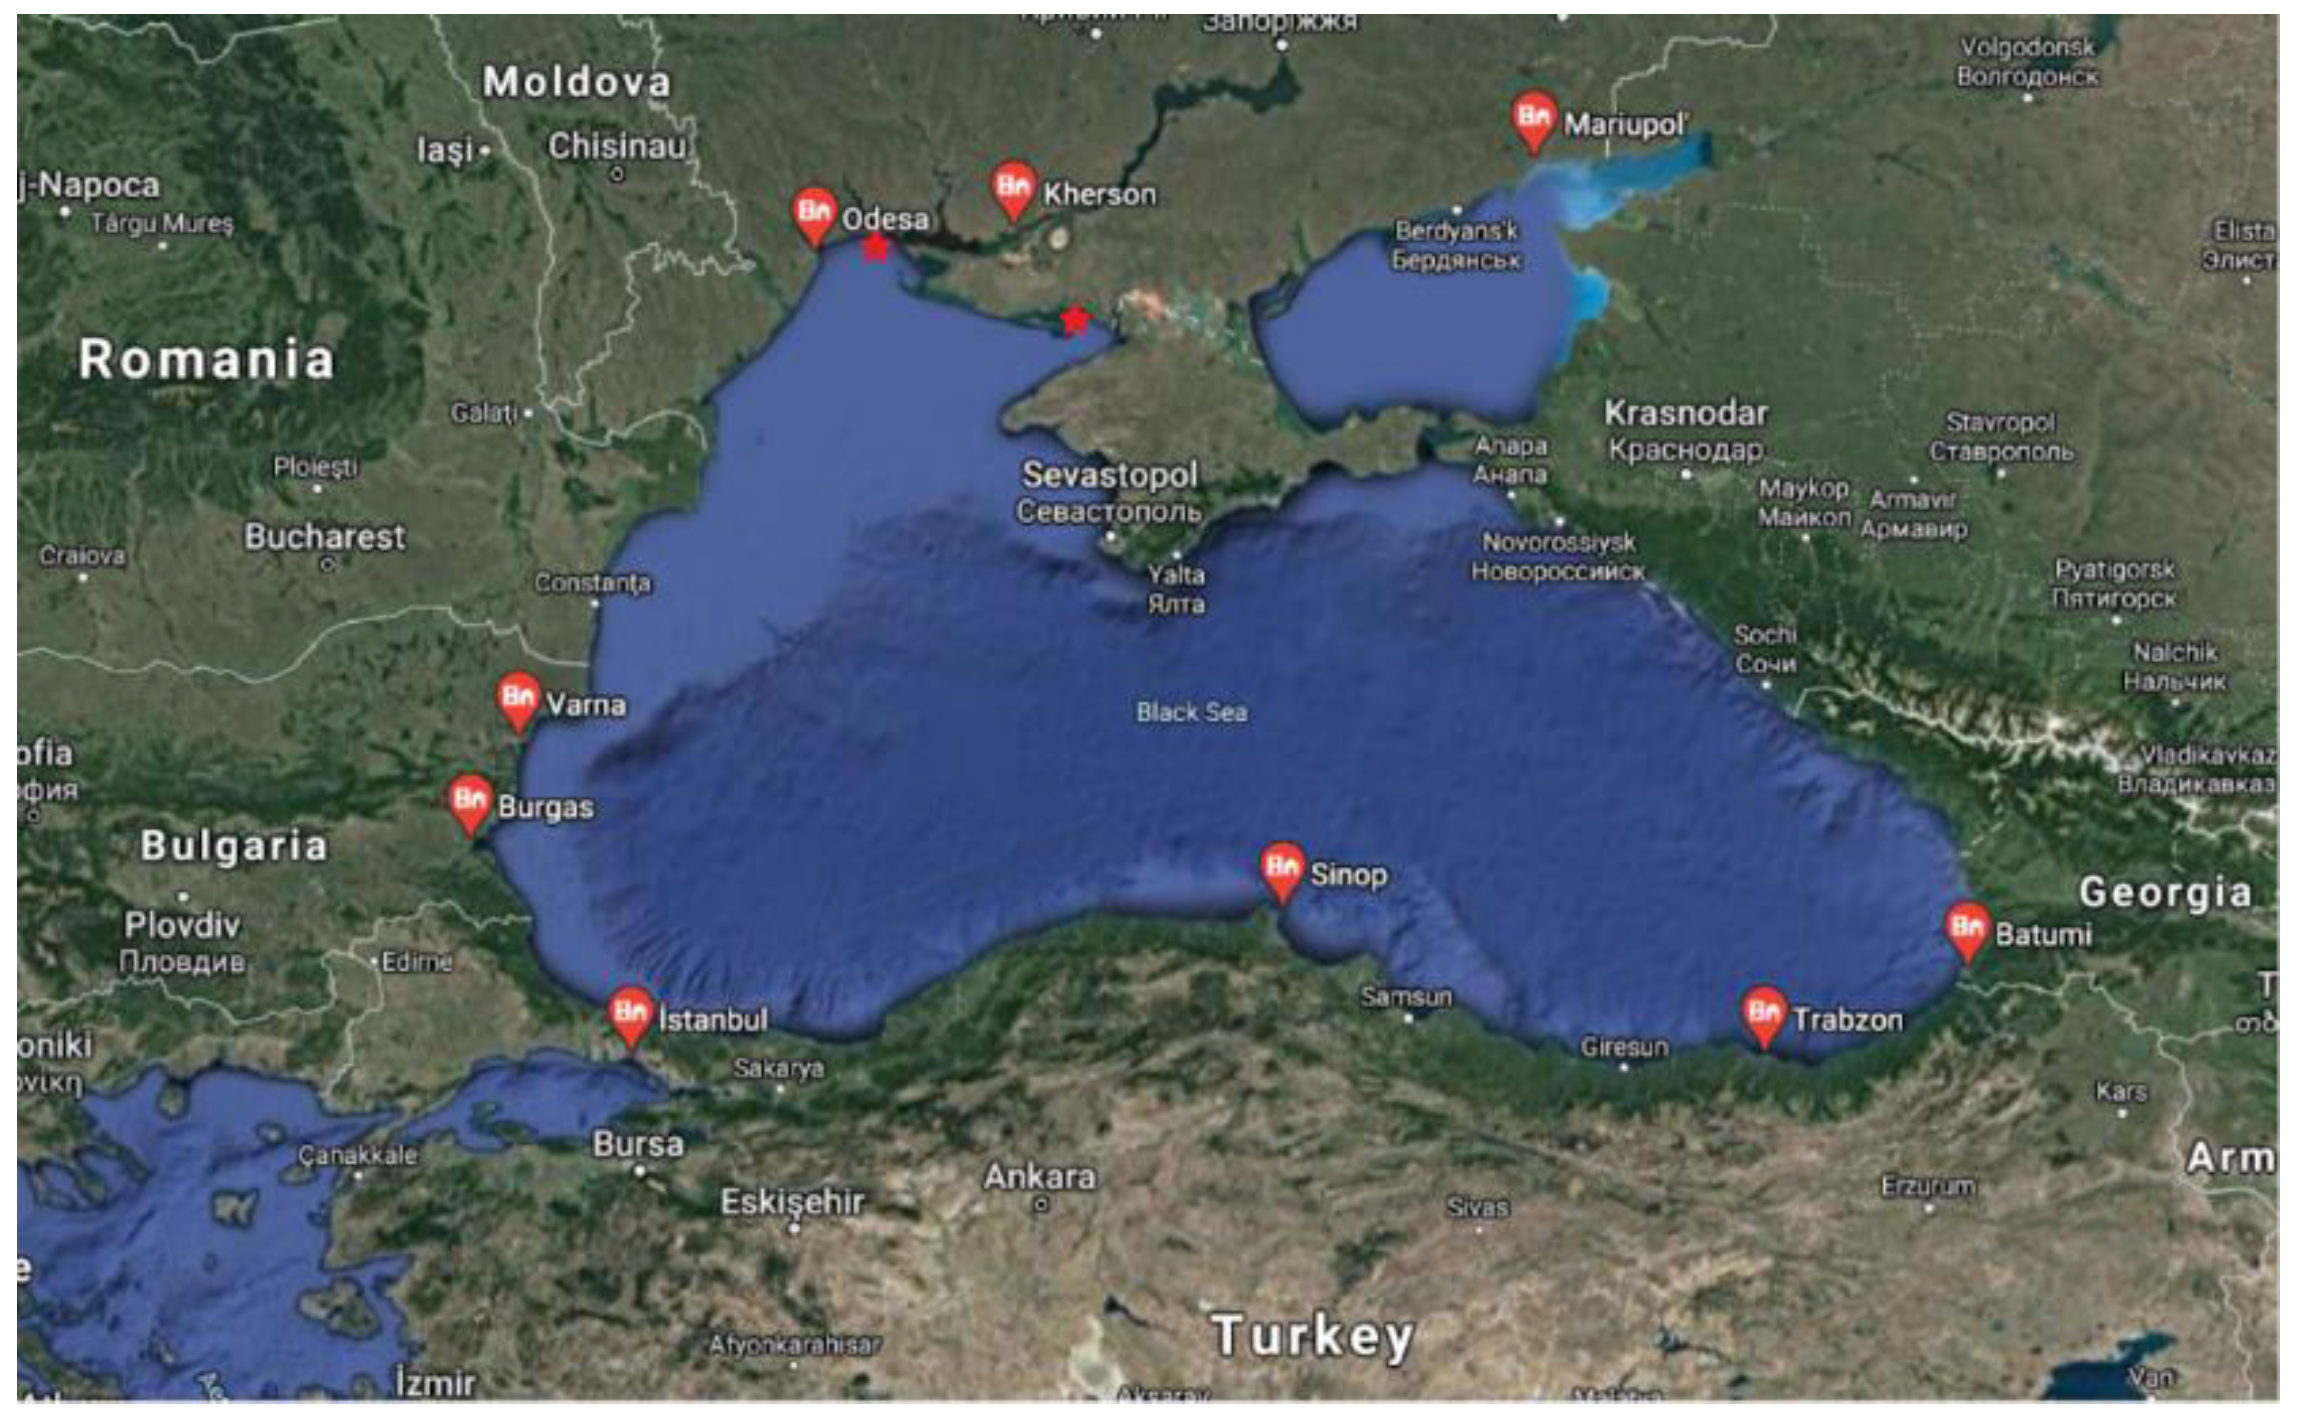
Synoptic data for the 2 m air temperature were collected from 9 coastal meteorological stations along the coast of the Black Sea—Burgas, Varna, Odessa, Herson, Mariupol, Batumi, Trabzon, Sinop, and Istanbul (
Figure 2). The data source is the regular SYNOP reports distributed by the Global Surface Summary of the Day (GSOD) data archive at
ncei.noaa.gov [
14]. The data cover the period from 1950 to the present, but there are numerous gaps, especially in the beginning of the period.
Historical archives and the literature on the Black Sea ice cover and air temperature in the 20th century were taken from
“Black Sea” Volume 4 of the book series
“Hydrometeorology and hydrochemistry of the USSR seas” [
1], Chapter IV.5,
“Ice”. To the best of our knowledge, this is the most comprehensive analysis of Black Sea ice cover; unfortunately, the data only cover up to 1985, and the processing is not well documented.
We combined weather maps of the 500 hPa geopotential height, sea-level pressure, and relative topography, with a difference of between 500 and 1000 hPa in geopotential height, copied from [
15]. These are used to represent the synoptic conditions for several instances of intense freezing.
Table 1 summarizes the data used in this study.
In order to qualitatively categorize how cold the winter was, we followed Simonov and Altman [
1] and Kryidin’s [
9] approaches: the Winter Severity Index (WSI) is defined as the sum of the negative daily temperature values (frozen days) from December to March for each of the 9 stations. The winters were considered mild, moderate, or cold using the threshold values of 200 and 400 °C.
We calculated the linear trends in the graphs by fitting the data points with a linear polynomial, using the gnuplot implementation of the nonlinear least-squares Marquardt–Levenberg algorithm.
3. Results
3.1. Black Sea Ice Cover from Satellite Observations from 2006 onwards
Three major European rivers flow along the north shore of the Black Sea—Danube, Dnieper, and Dniester. Negative air temperatures could lead to the freezing of the riverine water as this part of the Black Sea is relatively shallow. Freezing events can be identified on the satellite images. Data on the extent of freezing were taken from the US National Snow and Ice Data Center product Multisensor Analyzed Sea Ice Extent—Northern Hemisphere (MASIE-NH). This provides daily sea-ice data from 1 January 2006 to the present. The satellites used for this research are ALOS, AQUA, DMSP, ENVISAT, GOES, MSG, and RADARSAT-2. The parameters measured by these sensors include sea ice, ice edges, ice extent, and ice growth/melt. The spatial coverage in this study is the entire Northern Hemisphere, specified as N 90° to N 0° and E 180° to W −180°. The raster data pixels (grid cells) are 4 km × 4 km, thus covering an area of 16 km
2 each [
12]. Since 2014, MASIE-NH has also provided a product with a 1 km spatial resolution, but this period is too short for analysis. Before 2006, there was another NISCIDC product—IMS Daily Northern Hemisphere Snow and Ice Analysis (available from 1997 to the present)—but its spatial resolution is 24 km × 24 km, and thus it is not accurate enough to represent the areas of the Black Sea covered by ice.
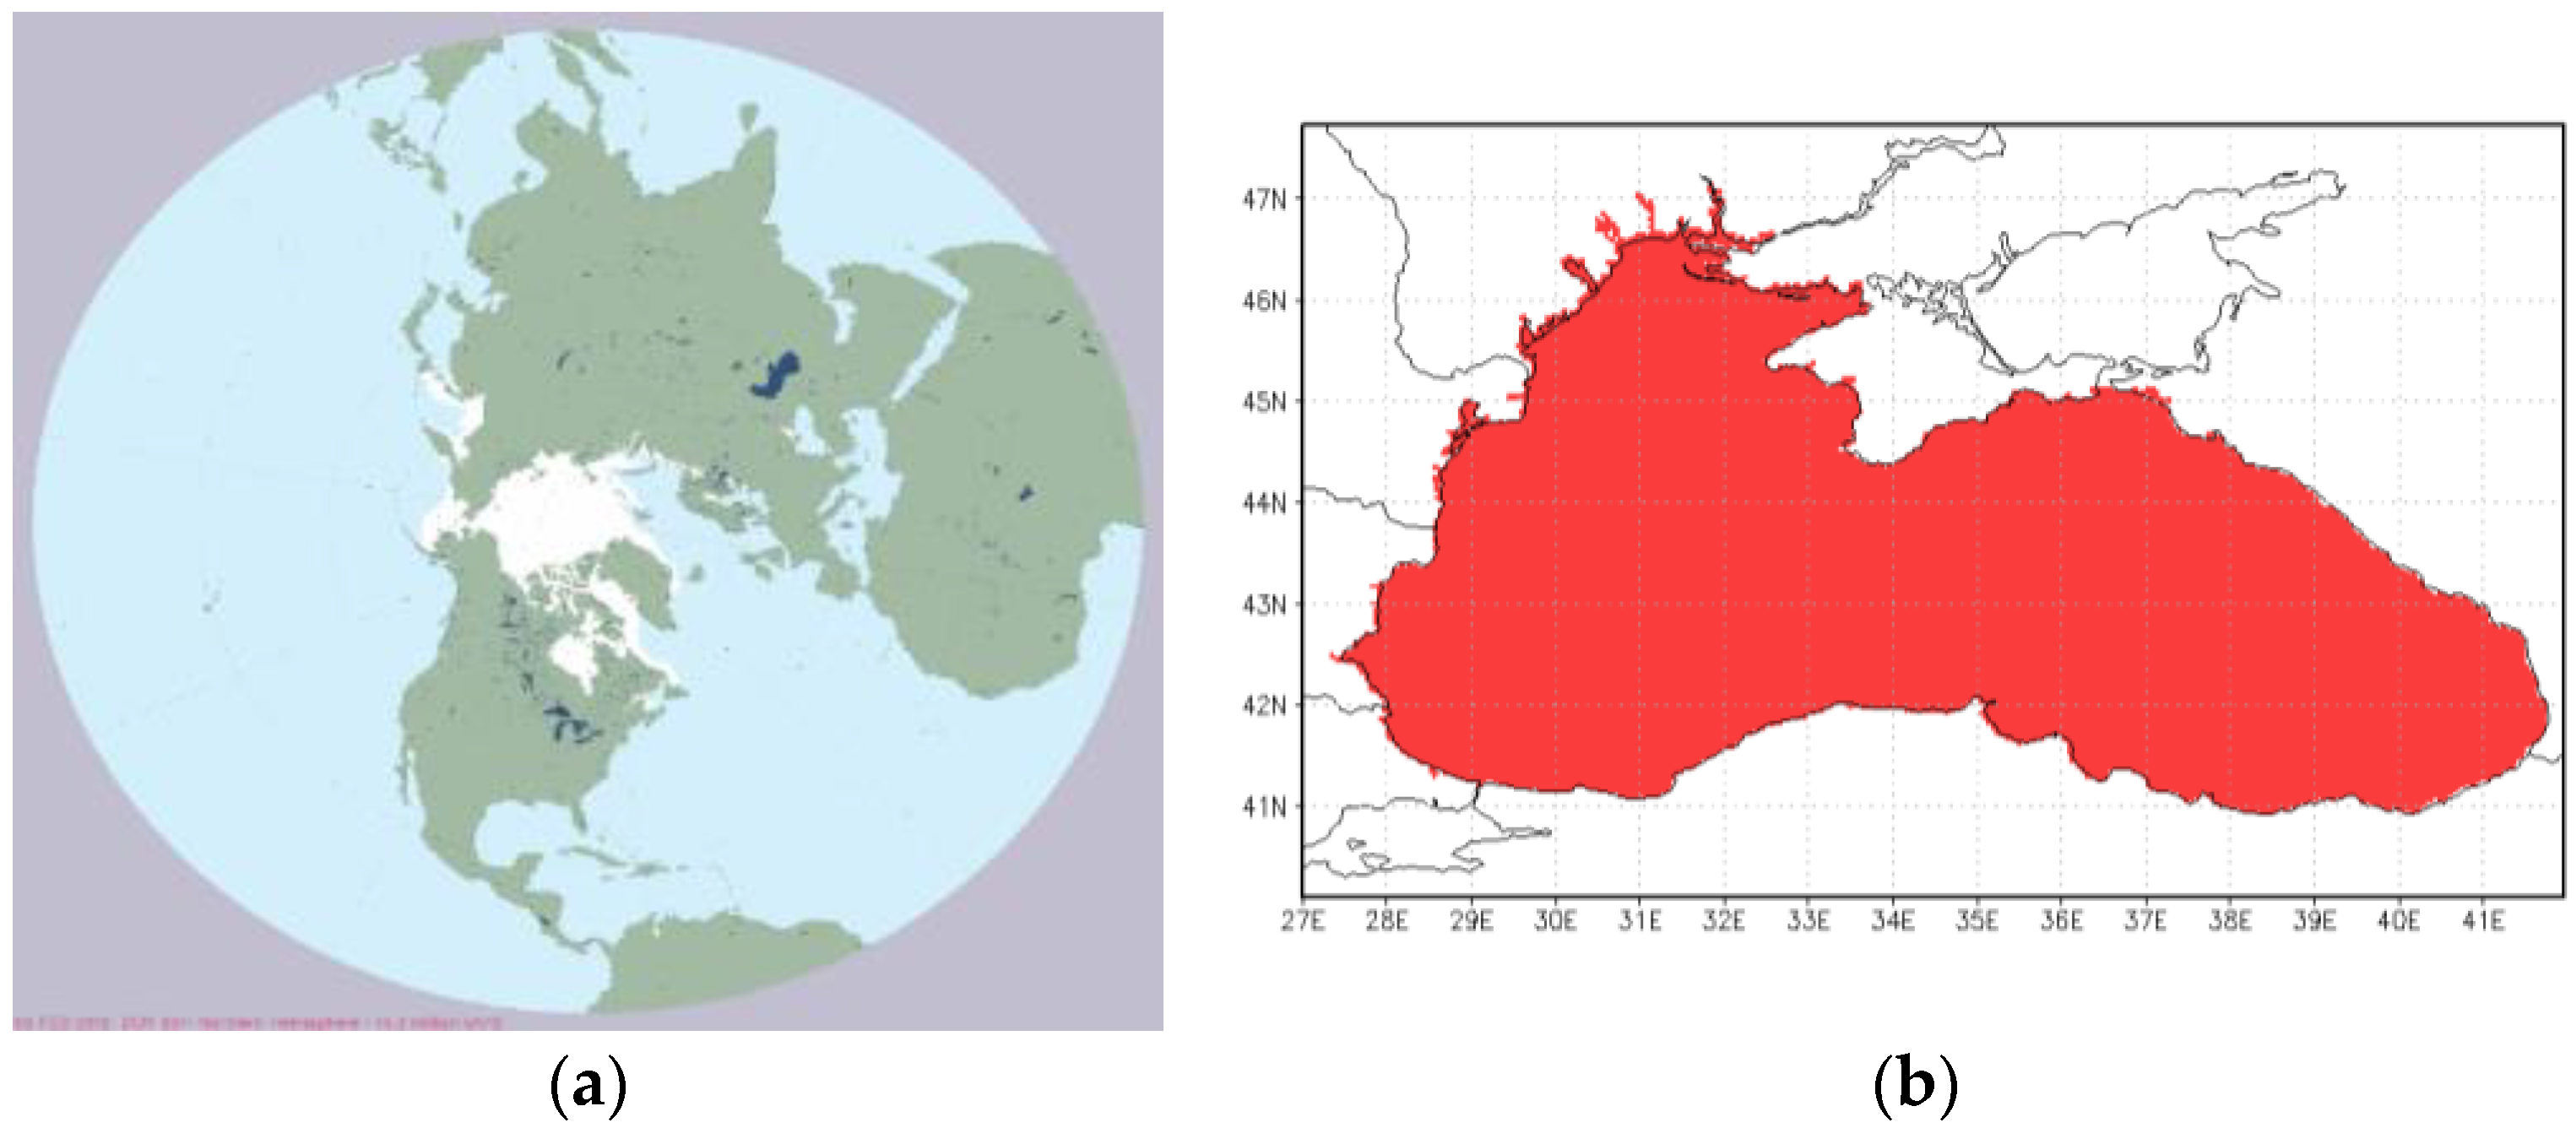
The available MASIE-NH geotiff images in a polar stereographic projection (
Figure 3a) were preprocessed into a Mercator projection, and the mask for the Black Sea pixels was applied (
Figure 3b); only the “sea” pixels with ice were counted. Thus, the average and the maximal extents of sea ice for the four months in the winter season (December to March) were estimated. One can note that the mask also contains the major rivers estuaries; these were taken into consideration as they are important for vessel navigation in this area. Obviously, the area depends on the choice of the pixels to consider in the daily ice cover map.
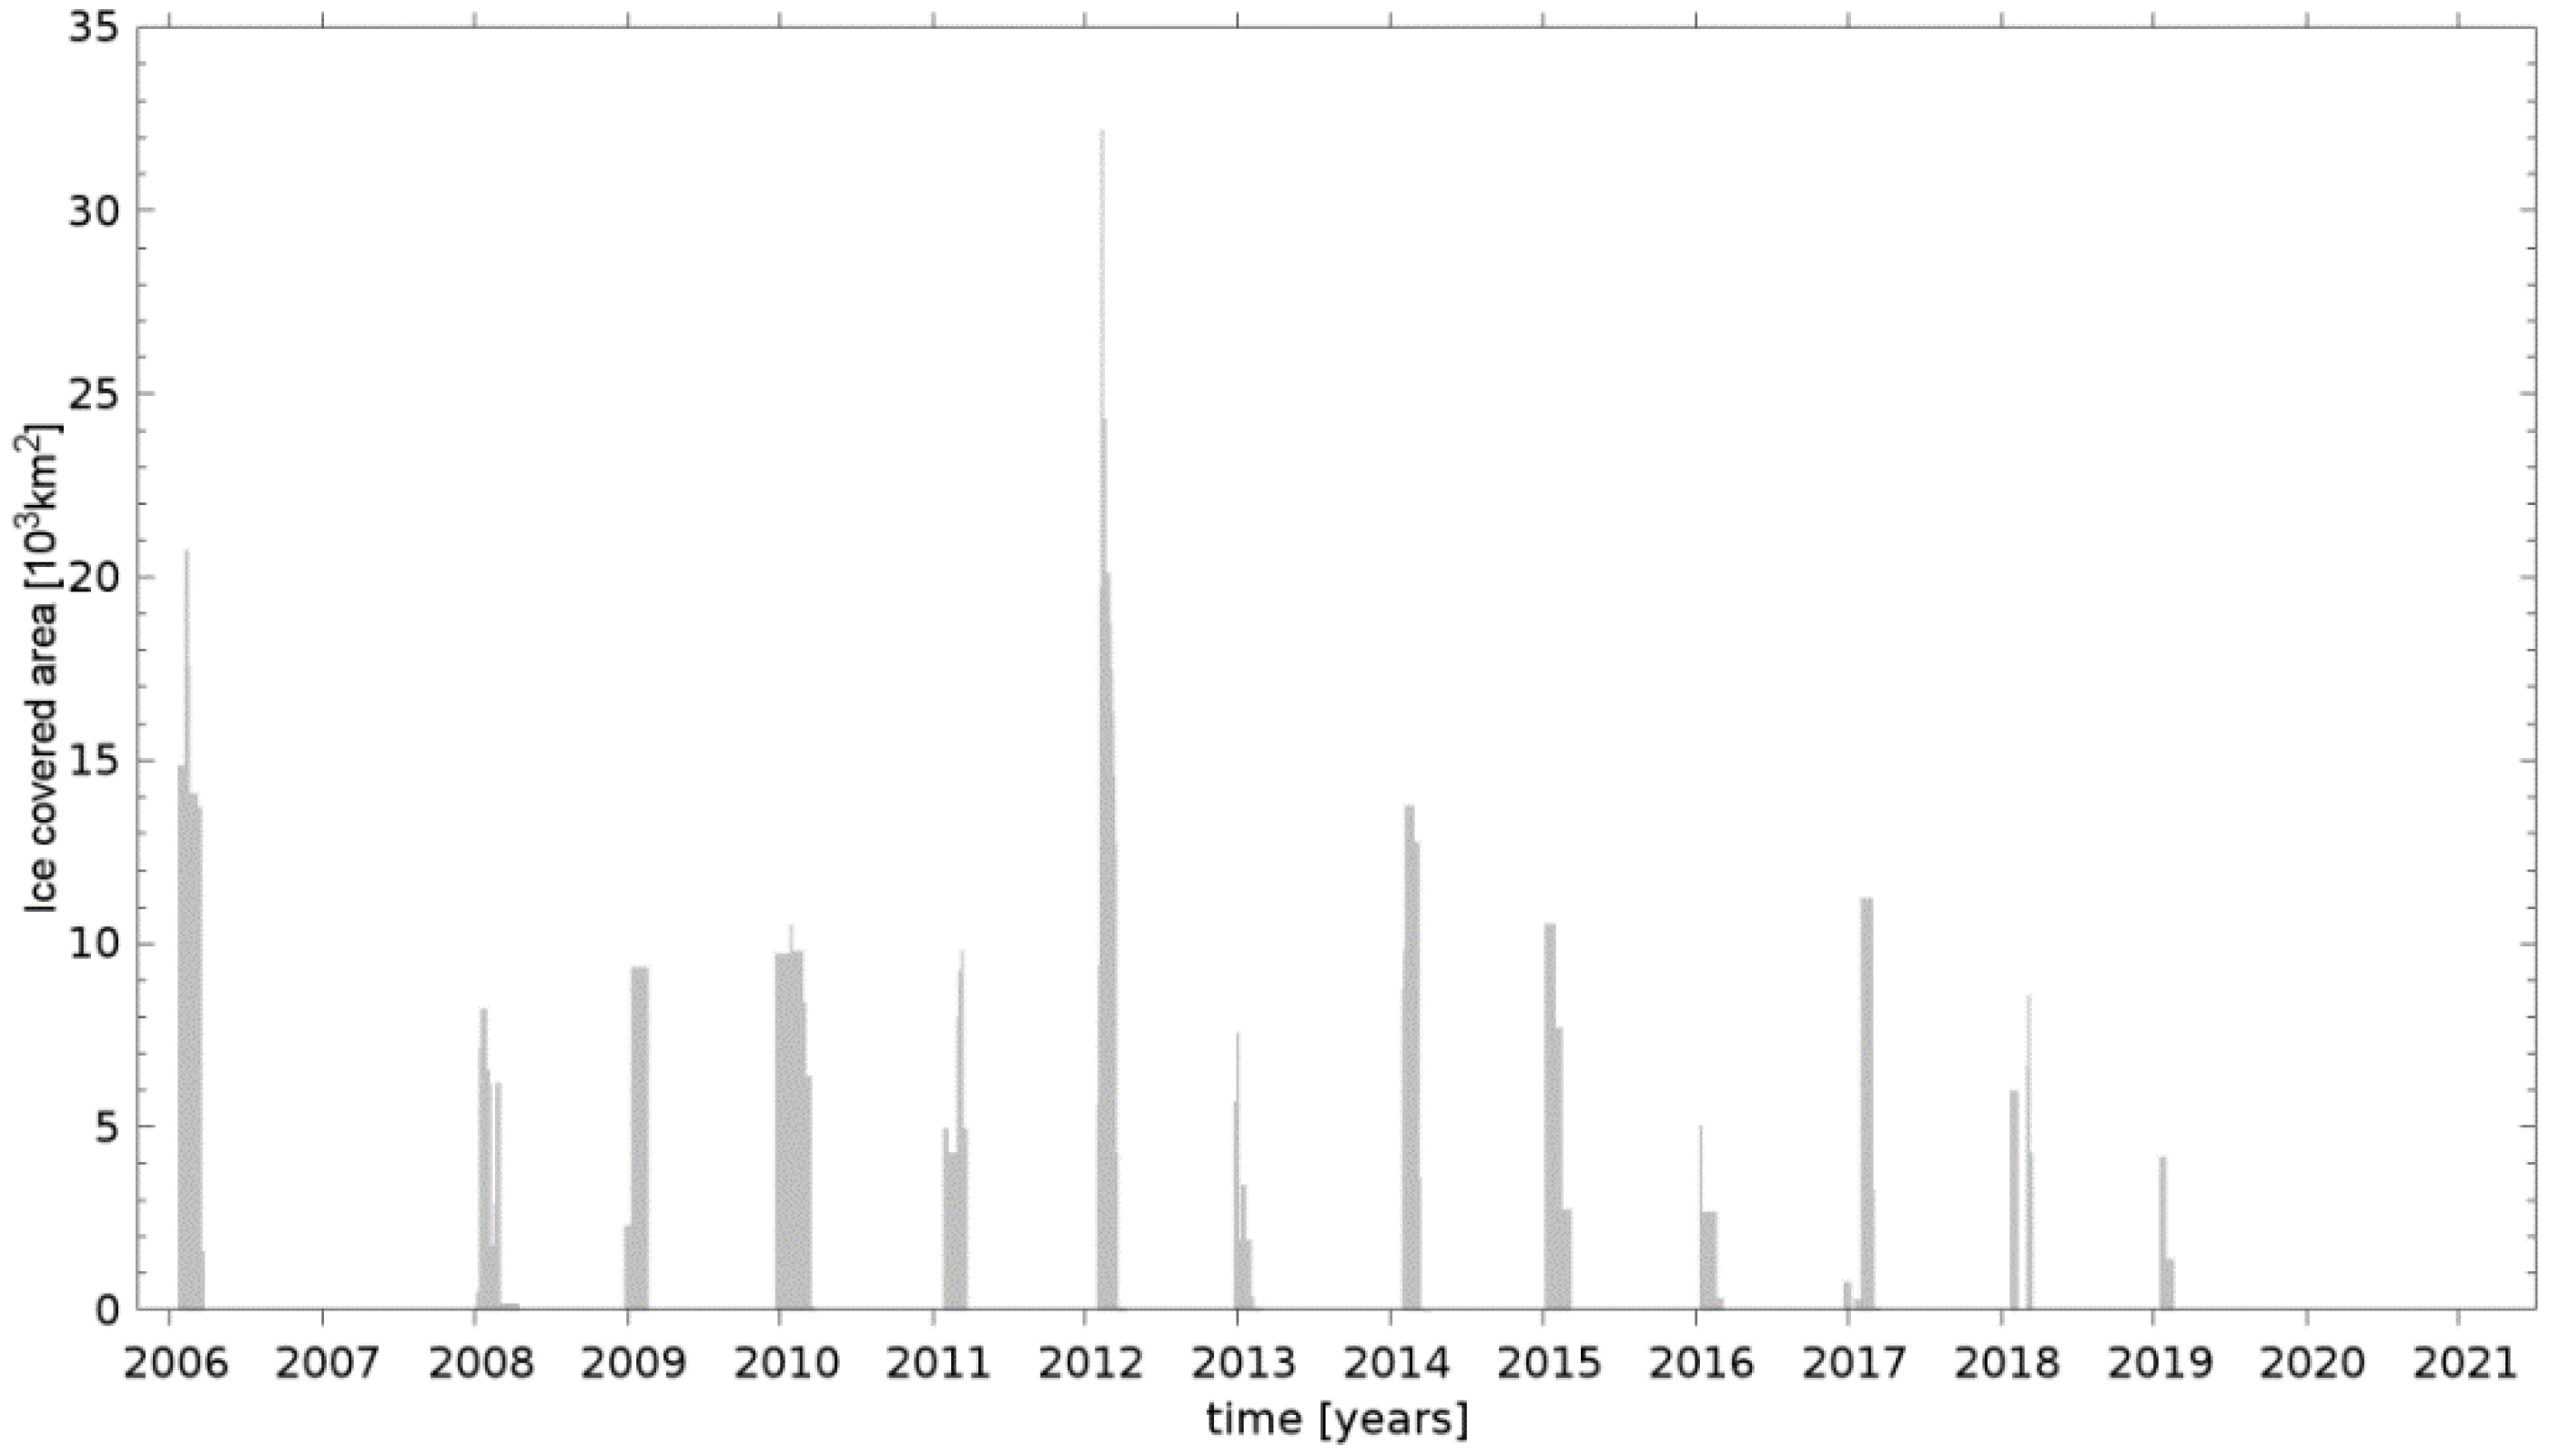
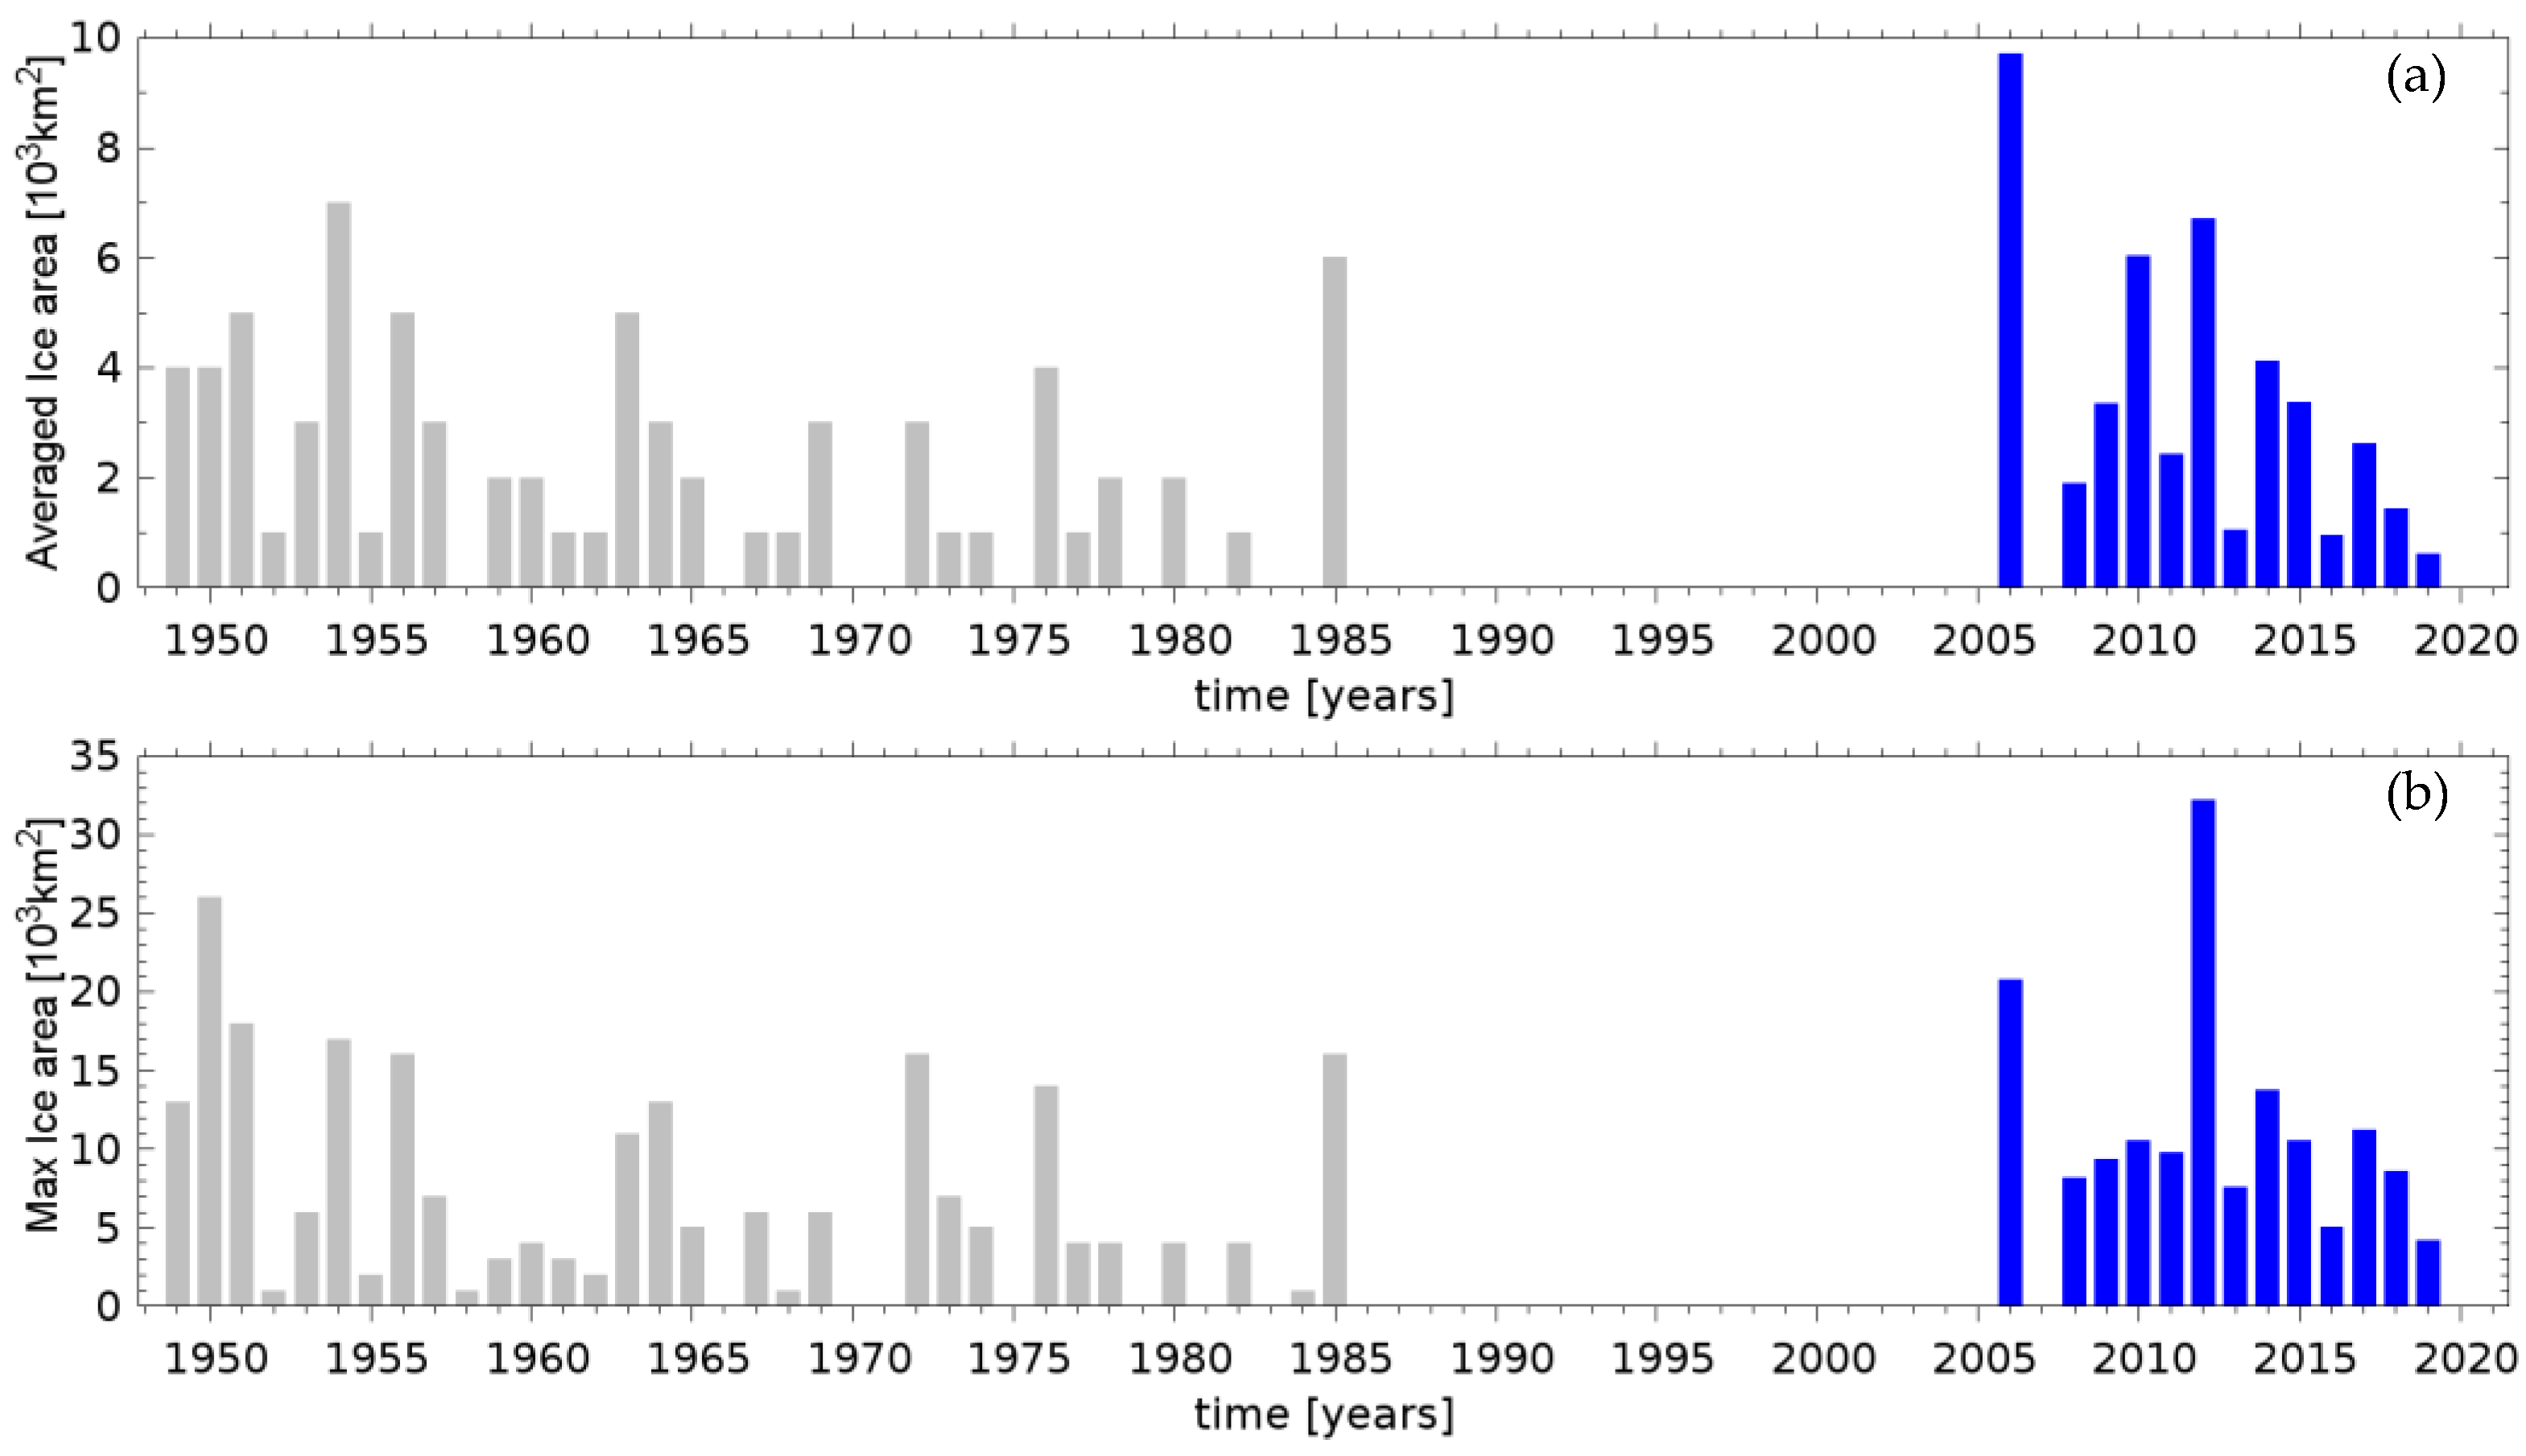
The results for the daily sea-ice cover in the winters of the period 2006–2021 are shown in
Figure 4. As shown in [
10], freezing occurred almost every year, with the exceptions of the winters of 2007, 2020, and 2021. The maximal ice extent was reached in February 2012, but only for a relatively short period. The maximal ice coverages in 2006 and 2010, for example, are less than that in 2012, but the ice formation was more stable and lasted longer. In fact, a significant trend could not be identified, probably due to the relatively short time period. During the latest winters in 2020 and 2021, ice only formed in the Azov Sea.
3.2. Winter Temperature Variations and Winter Severity Index
In order to relate the freezing events and the air temperature, we used data from the NOAA data set Global Surface Summary of the Day—GSOD [
14]. The same methodology was used in [
10]. In GSOD, we found daily data from nine meteorological stations along the Black Sea coast—Burgas and Varna in Bulgaria, along the west coast; Odessa, Herson and Mariupol in the north, in Ukraine; Batumi in Georgia on the east coast; and Istanbul, Trabzon and Sinop along the south coast in Turkey (
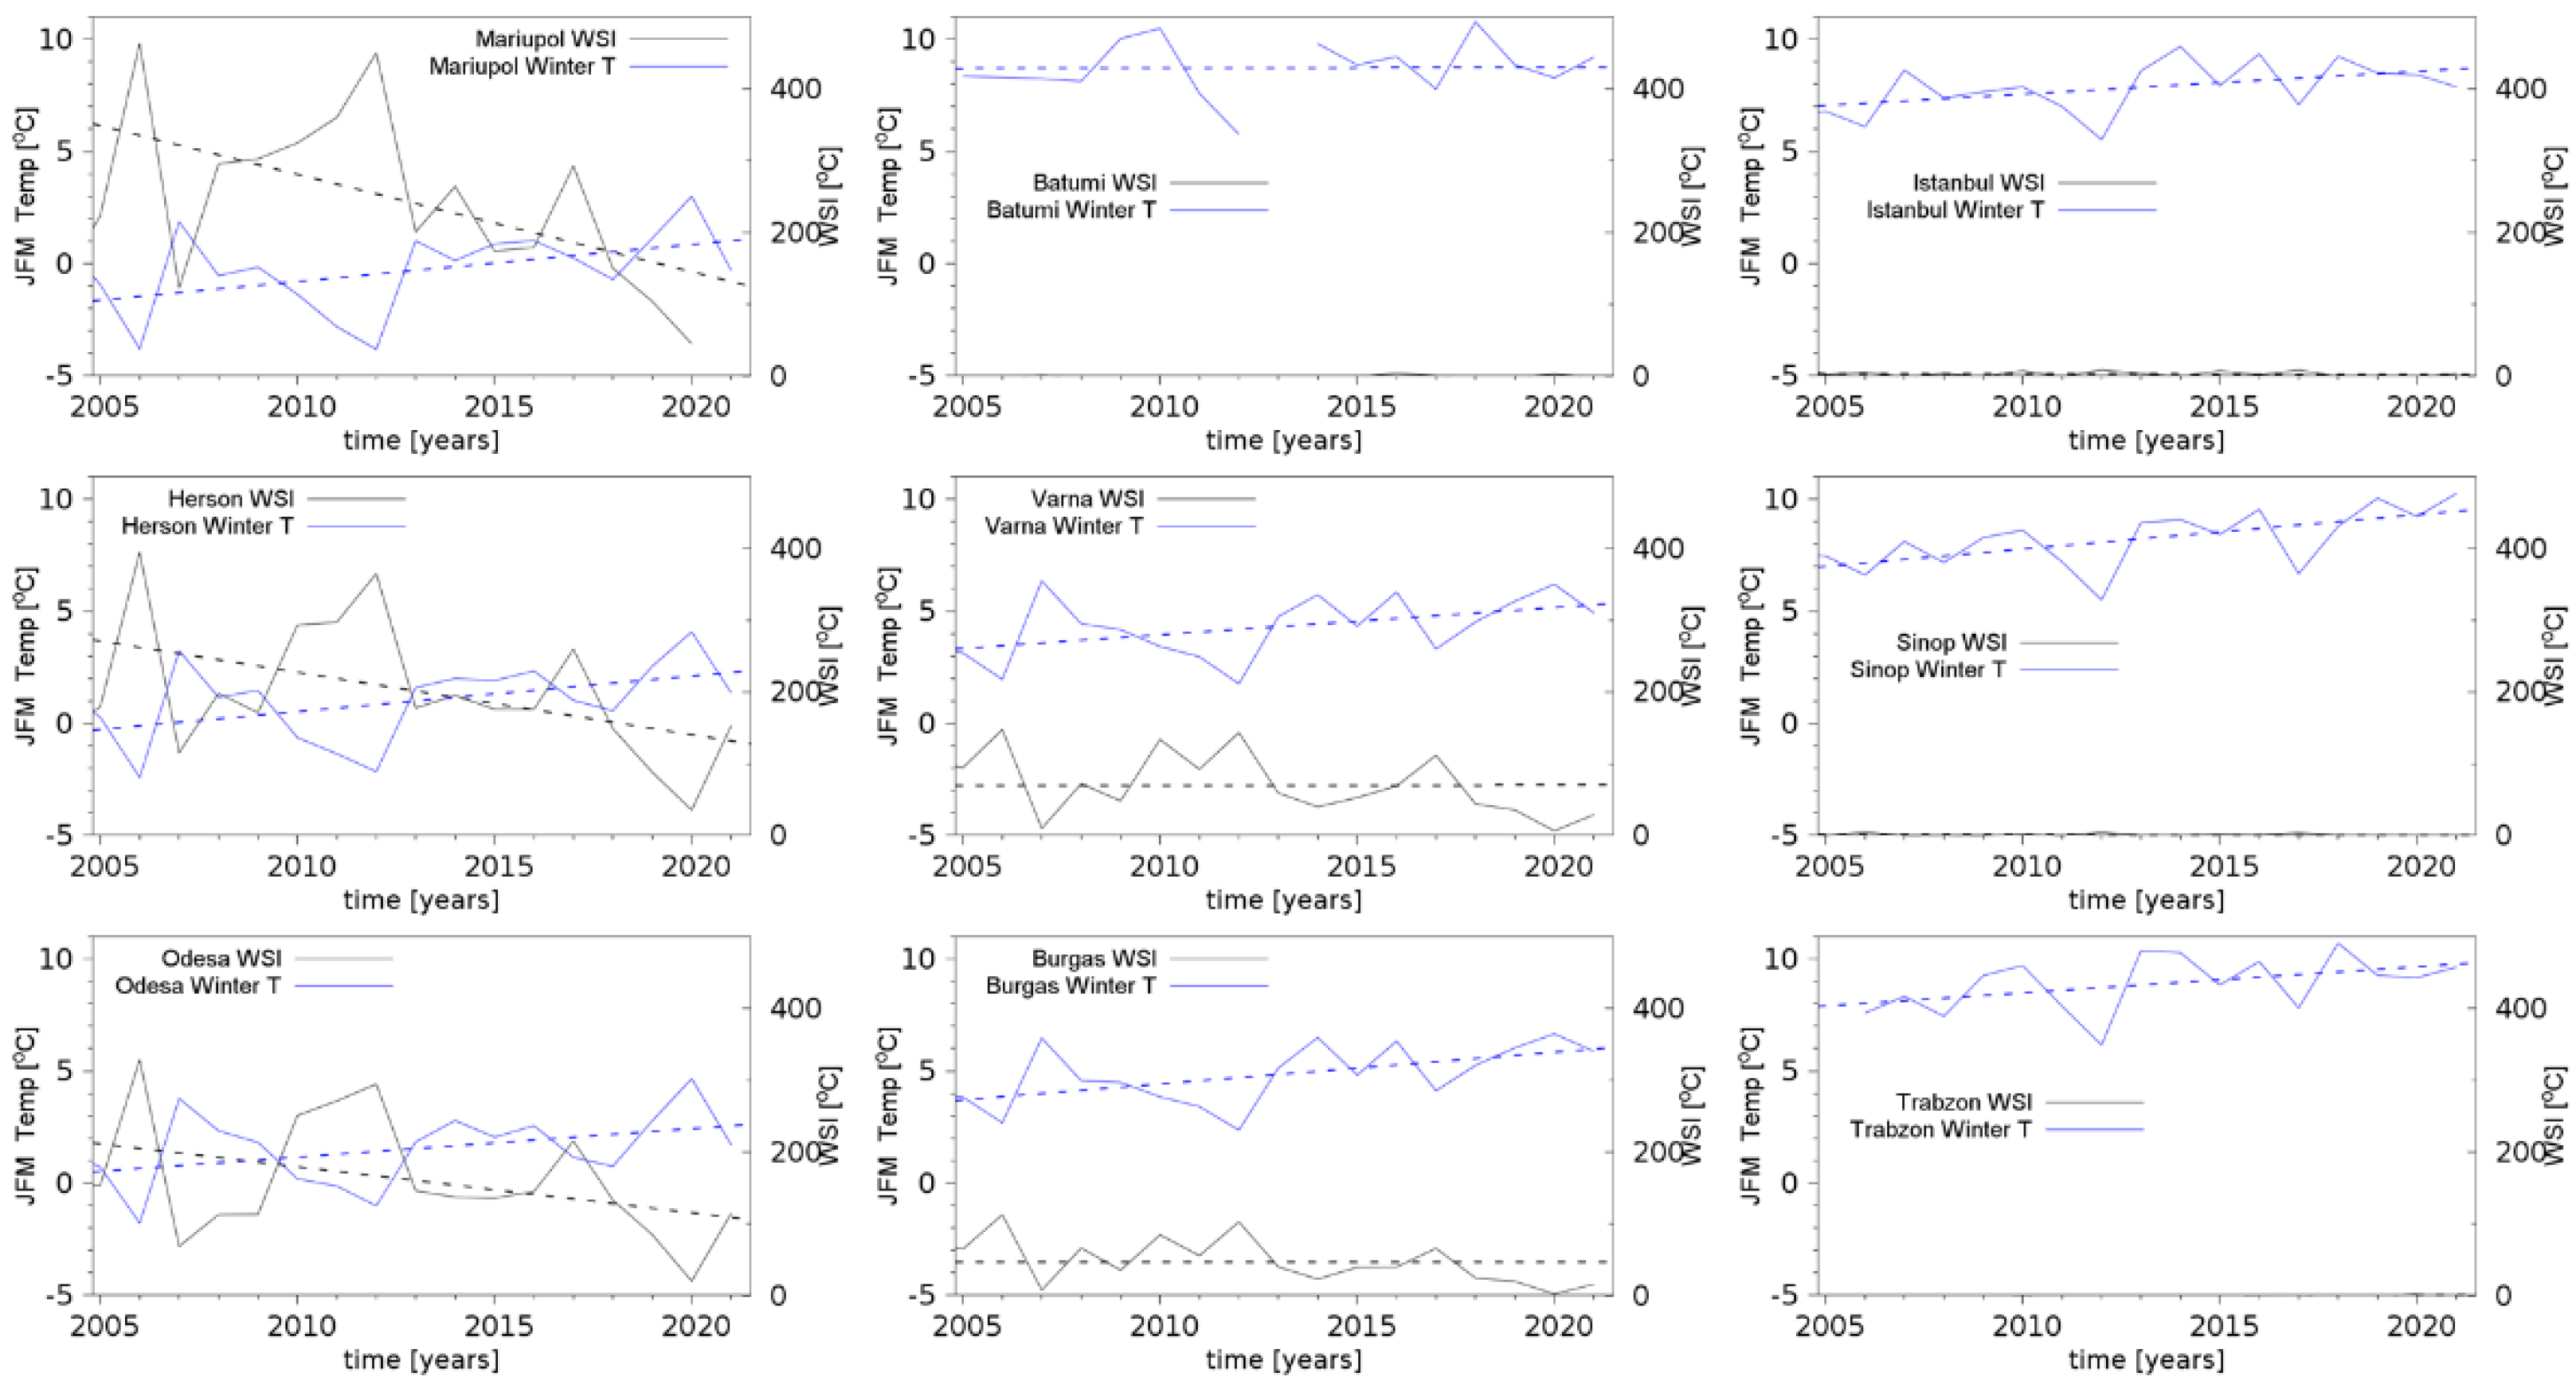
Figure 2, locations with balloons). Data are available from 1950 onwards, but, especially in the beginning of this period, many gaps are present. The mean winter temperature was calculated for the months January, February and March and the graphs are presented in
Figure 5 (blue lines). As expected, the north-coast stations (Odesa, Herson and Mariupol) are much colder than the south ones (Istanbul, Sinop and Trabzon), and the eastern one (Batumi) is similar to the south ones, as it is located on the south-east coast. On the west coast, Burgas and Varna’s winter temperatures are in between the aforementioned values. Overall, the variations in the nine stations are very similar (except for those in Trabzon and Batumi). The calculated Pearson correlation coefficients with respect to Odesa’s winter temperature are as follows: 0.98 for Herson; 0.94 for Mariupol; 0.9 for Burgas; 0.93 for Varna; 0.7 for Istanbul; 0.62 for Sinop; 0.41 for Trabzon; and 0.22 for Batumi. These results suggest that the winter conditions are uniform above the majority of the basin, with exception in the south-eastern part. This could be explained by the dominating north-eastern winds during winter.
It is interesting to note the asymmetry in the north–south and west–east directions: the mean winter temperature increased from north to south and west to east (the latter is due to the westerlies, typically spreading the marine influence in the east direction for this latitude).
The intensity of the winter in the nine meteorological stations is presented in
Figure 5 through the WSI. The black lines show that in Odesa, Mariupol, and Herson, frozen days occur regularly in winter; on the contrary, in Istanbul and Sinop, these are very rare. Burgas and Varna, on the west coast, are similar to the northern parts. Trabzon and Batumi practically never suffer from freezing air temperatures for a whole day (WSI ~ 0). In the considered period, there are several years with typical winter cold conditions—2006, 2012, and 2017. The recent winters of 2019, 2020, and 2021 are definitely mild with very low WSI.
The positive trend of the mean winter air temperature is accompanied by a negative trend in the winter severity, which is especially well pronounced along the north coast. The clear tendency for milder winters (the linear trend is shown with a dashed blue line) is consistent with the warming trend for the winter in the Northern Hemisphere [
17].
By comparing
Figure 4 and
Figure 5, one can conclude that the relation between freezing events and WSI (or winter temperature) is not direct: the tendency to milder winters is not so evident in
Figure 4. The freezing in the coldest years, 2006 and 2012, is in fact the most intense and longest. However, in 2017, which was also very cold, the freezing event was moderate and less intense than in the warmer years of 2010 and 2014. Thus, in the next section, we analyze the meteorological conditions which led to the most intense freezing events in the considered period. We suggest that the low winter seasonal temperature is not only important for ice formation, but also for the occurrence of specific meteorological events.
3.3. Analysis of the Impact of Synoptic Conditions on Freezing
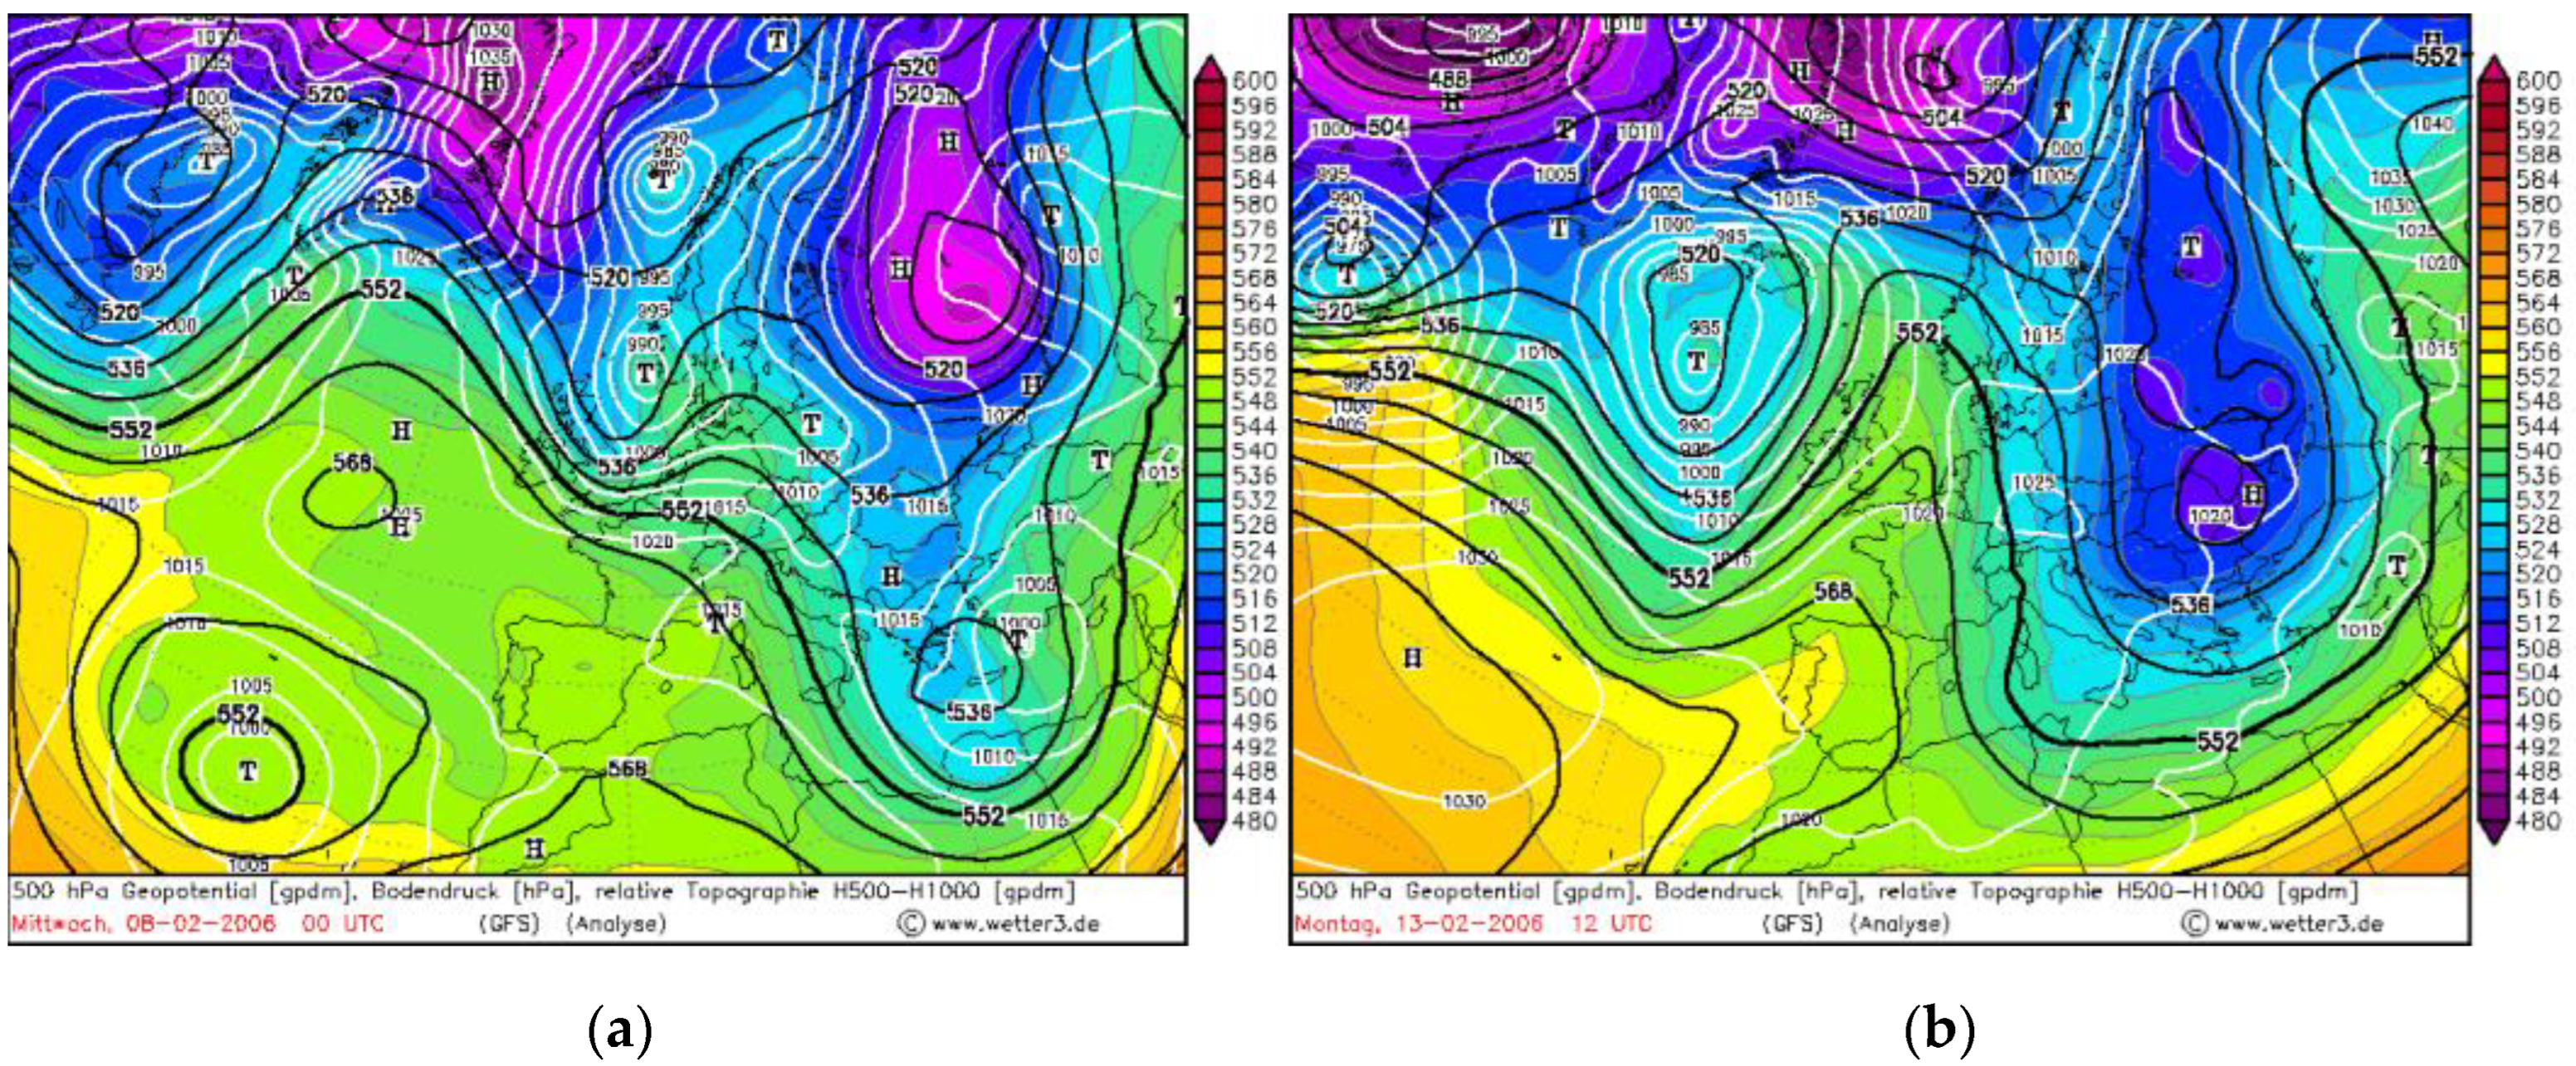
The aim of our study is to evaluate the importance of the mean seasonal temperature and synoptic conditions for freezing in the Black Sea. Of course, these conditions are related, as one season comprises several synoptic situations. In this section, we analyze the “cold” synoptic conditions in the winters of 2006, 2010, 2012, and 2017, which were associated with the intense penetration of cold air masses over the northern Black Sea area, which resulted in intense seawater freezing. For visualization, we used weather maps from the wetter3.de archive, which combine the sea-level pressure, 500 hPa geopotential height, and the relative geopotential height of 500–1000 hPa (the first two indicate the dynamic circulation, and latter is indicative of the thermal advection). The meteorological analysis results come from the Global Forecasting System maintained and run at the US National Center for Environmental Prediction. In order to better understand the dynamics of the processes, one should look at the whole series of maps with a 6 h time step, but we report here only the most representative instances for the purposes of analysis.
3.3.1. The Period of 8–13 February 2006
The weather maps shown in
Figure 6 are for the period of maximal sea ice, 8–13 February 2006. At the beginning of February (
Figure 6a), a deep cyclone of North Atlantic origin formed and was stationary in Northern Europe. A trough of cold air penetrated in the south, forming a cold core which was further transformed into an anticyclone on 13 February (
Figure 6b). This anticyclone lingered for several days over the Black Sea and then moved north. Overall, this could be classified as a penetration of a cold air mass of North Atlantic–Arctic origin.
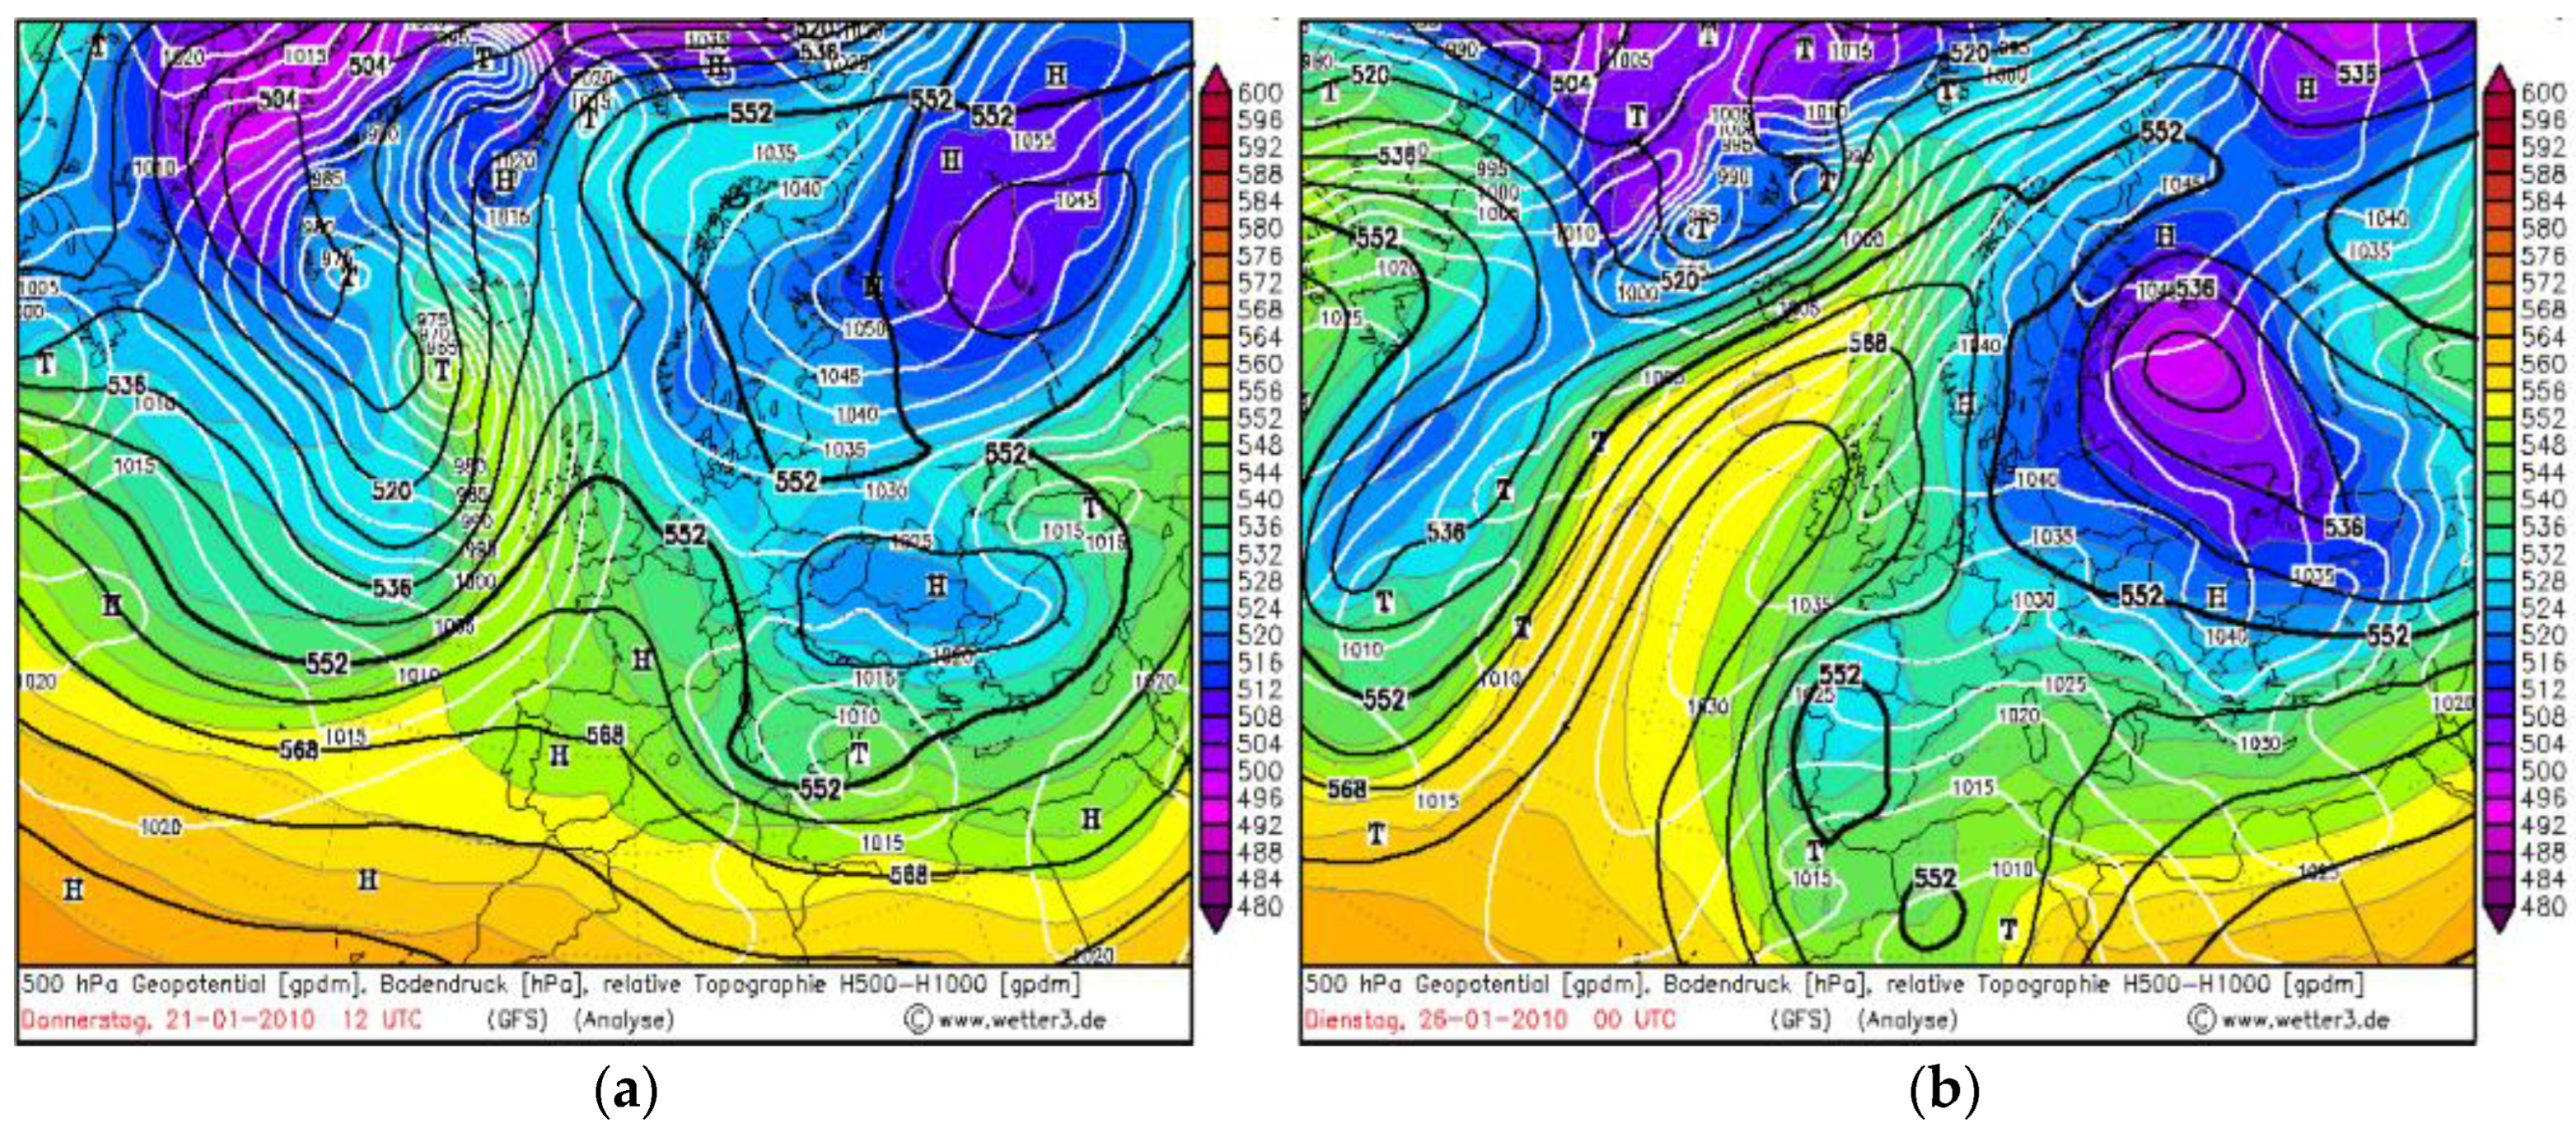
3.3.2. The Period of 21–27 January 2010
In the winter of 2010, freezing occurred for a long period: starting in late December and staying until the middle of March. The maximal extent was seen in the second half of January, associated with the stable Siberian High with expansion over Eastern Europe. The weather was very dynamic and a rapid cyclone of Scandinavian origin replaced the anticyclone. On 21 January (
Figure 7a), one can see that the weather was dominated by the large anticyclone, expanding over central Europe and Balkan Peninsula. In the Tyrrhenian Sea, a Mediterranean cyclone formed and propagated in an eastern direction above the Black Sea over the following three days. This caused a rapid flow of cold air along the north-west periphery of the cyclone, exacerbating the low temperature (
Figure 7b). After 27 January, a series of cyclones of high latitude and of Atlantic origin entered Europe and destroyed the Siberian High tongue. This prolonged freezing is related to consecutive penetrations of air masses of Siberian and Arctic origin.
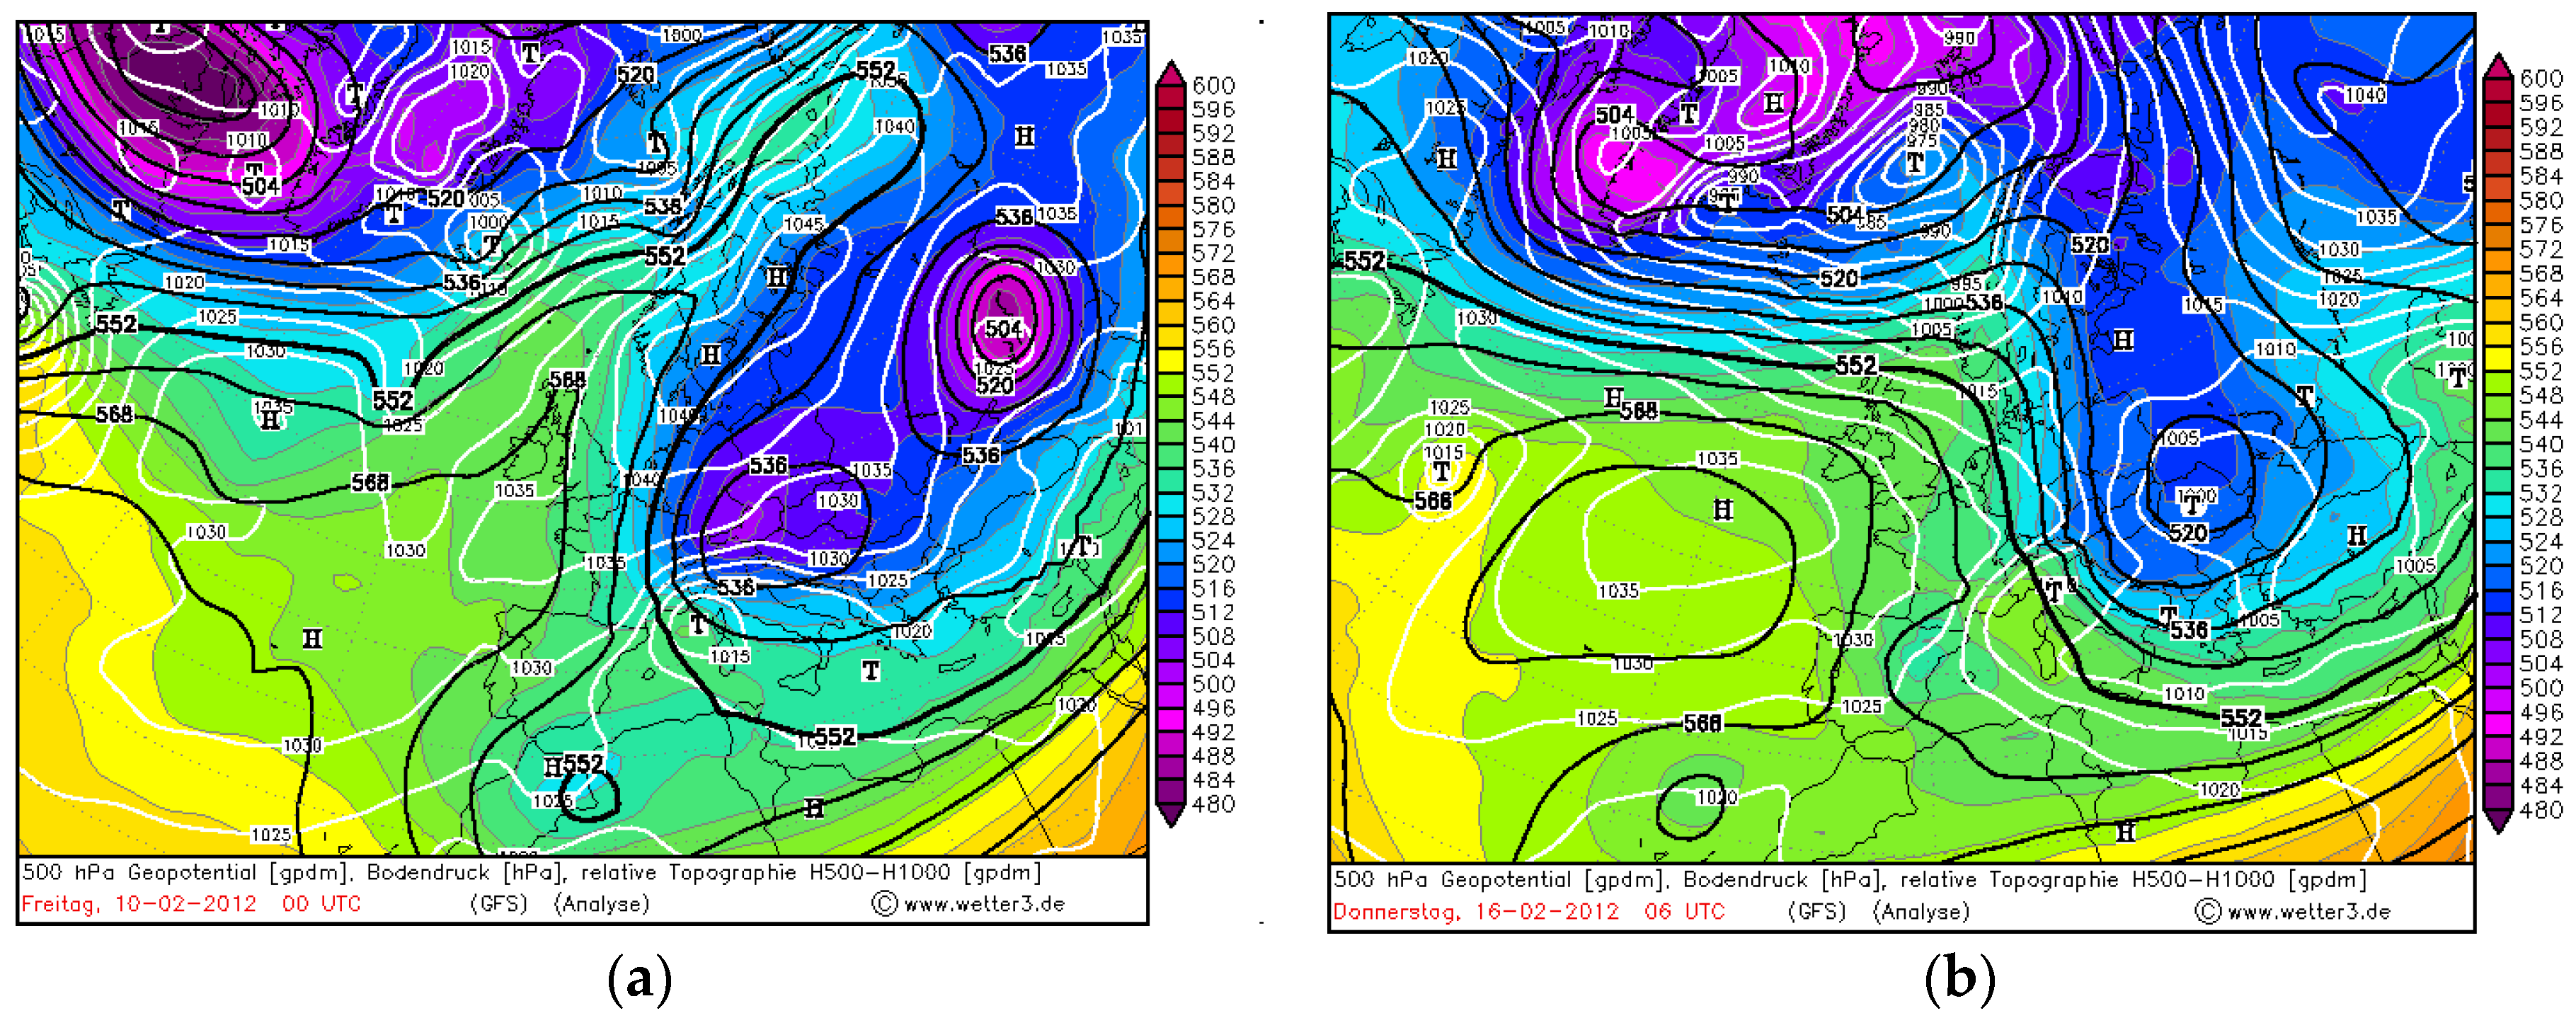
3.3.3. The Period of 10–20 February 2012
A maximum of the sea-ice cover seen by the satellites for the period 2006–2020 was reached on 10–11 February 2012. The beginning of February was dominated by a stable Siberian High tongue which expanded over a large part of Europe (
Figure 8a).
This blocking ended with a cyclone of high latitude of Atlantic and Arctic origin, which on 14 February passed through the Scandinavian Peninsula, migrated south to Northern and Central Europe, and on 16th February reached the Black Sea (
Figure 8b). As a consequence, the already cold weather conditions were exacerbated due to the introduction of cold arctic air into the periphery of the cyclone. This freezing occurrence could be related to the combined influence of Siberian and Arctic air masses.
A more detailed overview of the synoptic conditions over the Black Sea during the first half of February 2012 is available in the work of Galabov and Chervenkov [
18].
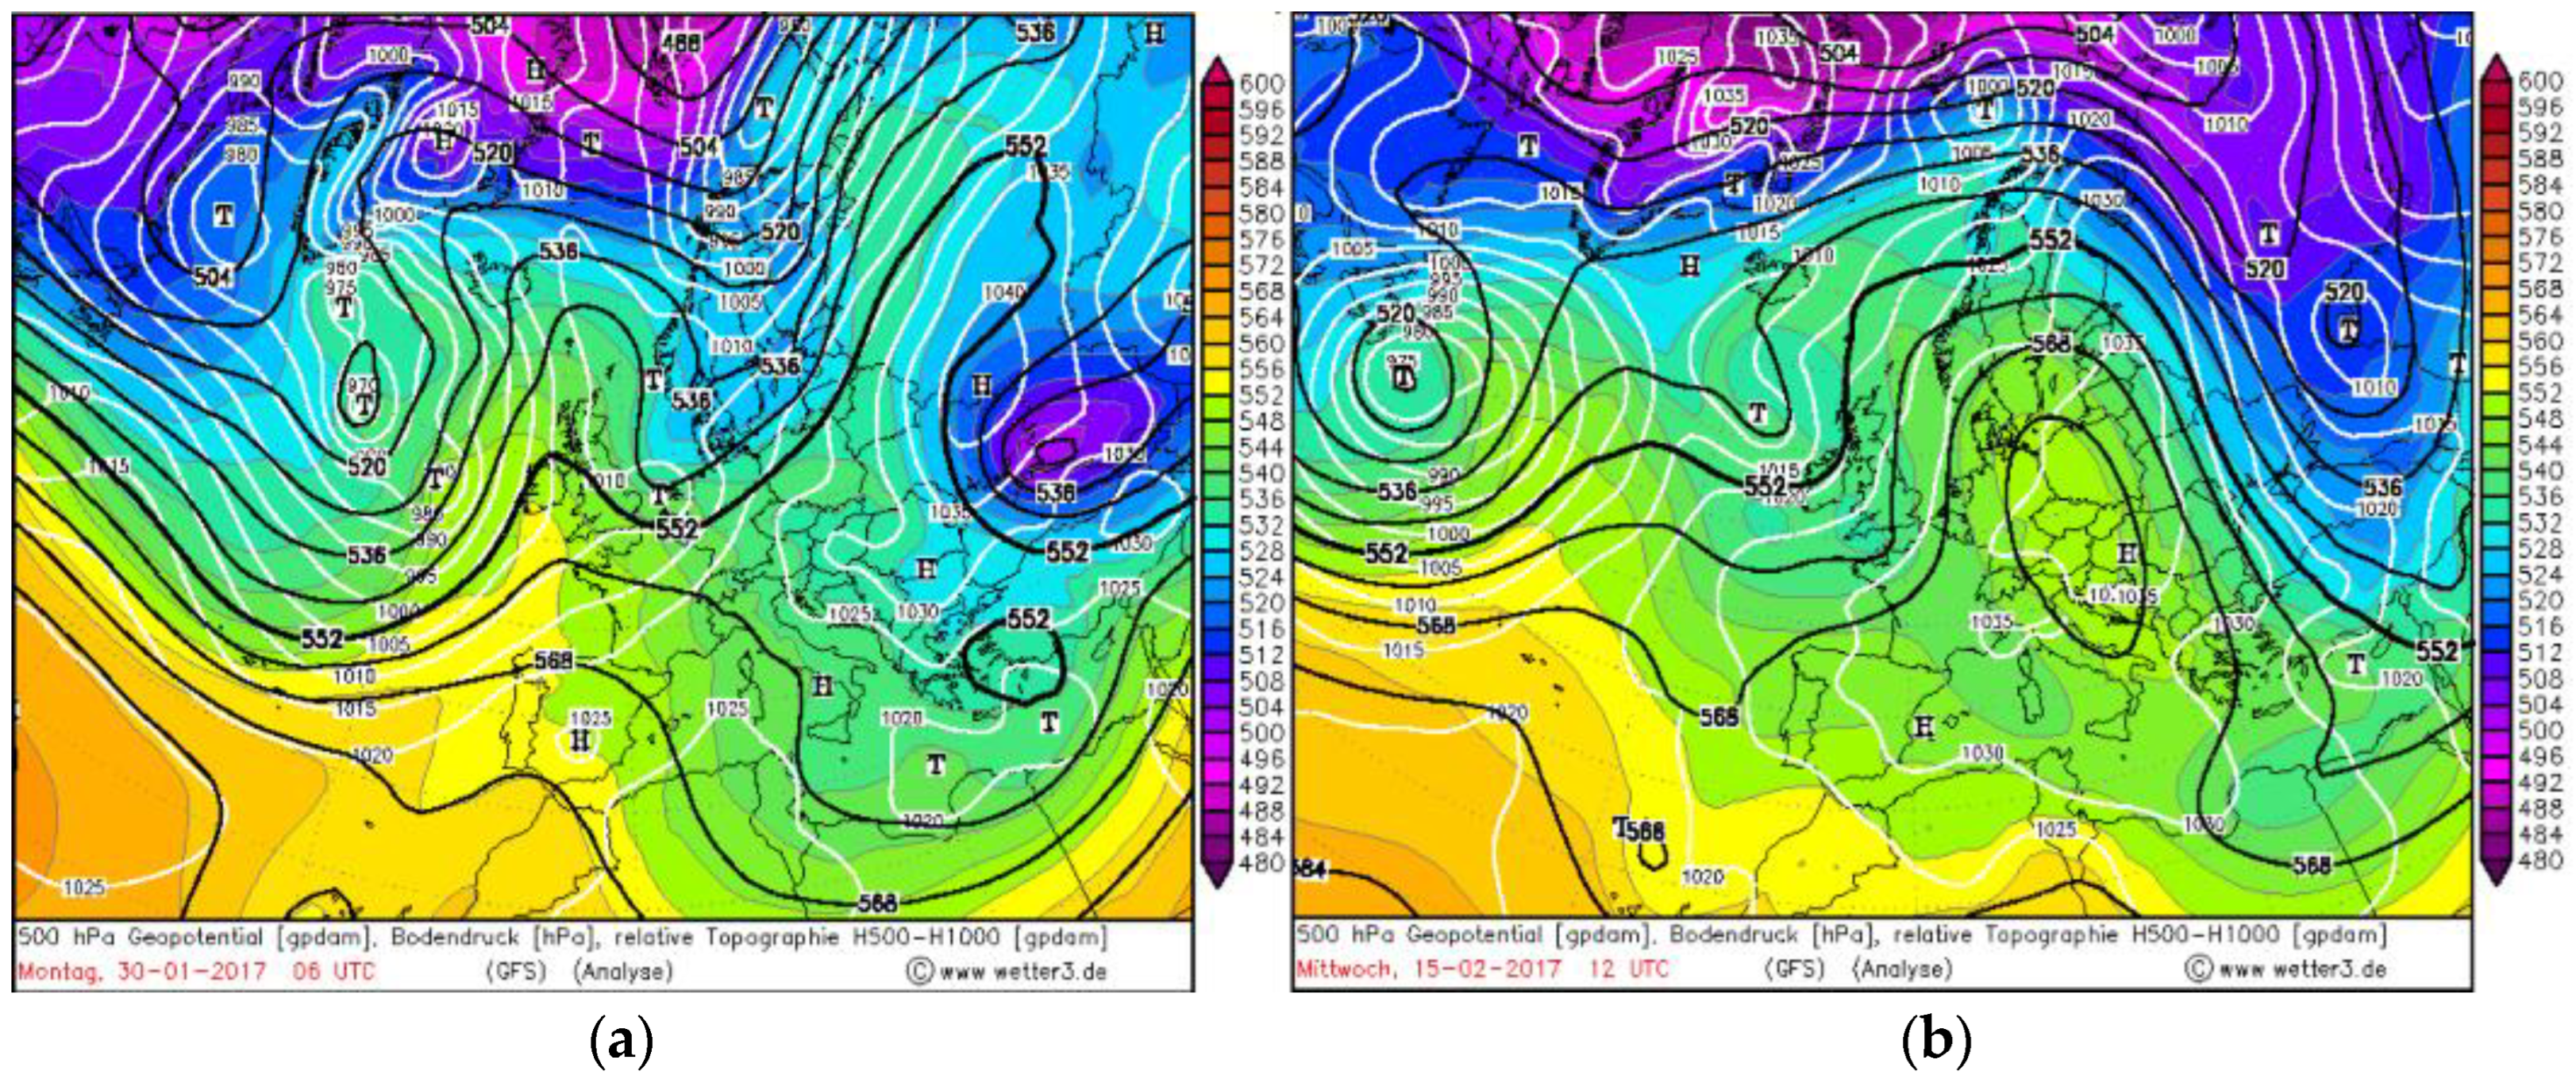
3.3.4. The Period of 30 January–15 February 2017
The winter in 2017 is characterized by almost constant sea ice in February. The end of January 2017 was influenced by the Siberian High expansion over the Balkan Peninsula (
Figure 9a). Then, February 2017 was very dynamic with many cyclones of high latitude Atlantic origin, which passed over central Europe and the north Balkan Peninsula. An interesting condition formed in the middle of the month—a stable anticyclone over central Europe, which brought cold air on its eastern periphery in the Black Sea region (
Figure 9b).
The analysis of the weather patterns during the periods of maximal sea-ice extent indicates that relatively long periods under Siberian High followed by an Arctic air mass penetration in the periphery of a high-latitude Atlantic cyclone are the main meteorological patterns responsible for sea-ice formation.
3.4. Black Sea Ice Cover in 20th Century
It is interesting to compare the results on the freezing area from satellites with the previously published study of Simonov and Altman [
1], which shows historical data for the period 1948–1984. Unfortunately, a direct comparison of our results (based on MASIE-NH, processed as described in
Section 3) with these data is not possible as the original source is not available; according to Simonov and Altman [
1], these are maps of the north-western Black Sea, drawn up in winter by the aviation intelligence service. The exact area used to estimate the ice cover is not well documented; it is summarized in plots and tables (pages 411–412 of the volume).
Combining the two data sources in
Figure 10, we did not aim to tailor the data in single homogenized time series; we could not find a way to do this as there is no overlap between the two data sources. Clearly, MASIE-NH has larger values, and we think the reason for this is the different areas chosen for estimation. We used the mask shown in
Figure 3b with a pixel size of 4 × 4 km, which is apparently different from analogous maps, shown by Simonov and Altman [
1]. What is important here is the fact that despite the global warming trend, freezing occurs rather regularly. This leads us to the conclusion that this is due to the synoptic conditions rather than the seasonal averages. An interesting observation is that the periods of no ice formation usually lasted only one year and rarely occurred two years in a row. This is also the case in the latest winters in 2020 and 2021. The results are also an update to those of Matov et al. [
10].
3.5. Winter Severity Index in the Period 1925–2021
In this section, we discuss the long-term variations in the winter severity in the northern areas of the Black Sea in an attempt to relate them to the documented freezing events. Because the most indicative parameter for winter intensity is the air temperature in the northern cities, Odesa, Mariupol and Herson, in the following analysis we only consider these three locations (the methodology is similar to that of Matov et al. [
10]).
In regard to the mean winter temperature, we can compare our results with the ones published in [
1]. These authors show a really long record of WSI, based on observations in the northern meteorological stations Odesa, Ochakiv and Khorli (the latter two are indicated with stars in
Figure 2), covering the period 1926–1985. As the original temperature records are not available, we compared the WSI calculated from the GSOD data in Odesa, Mariupol and Herson after 1950.
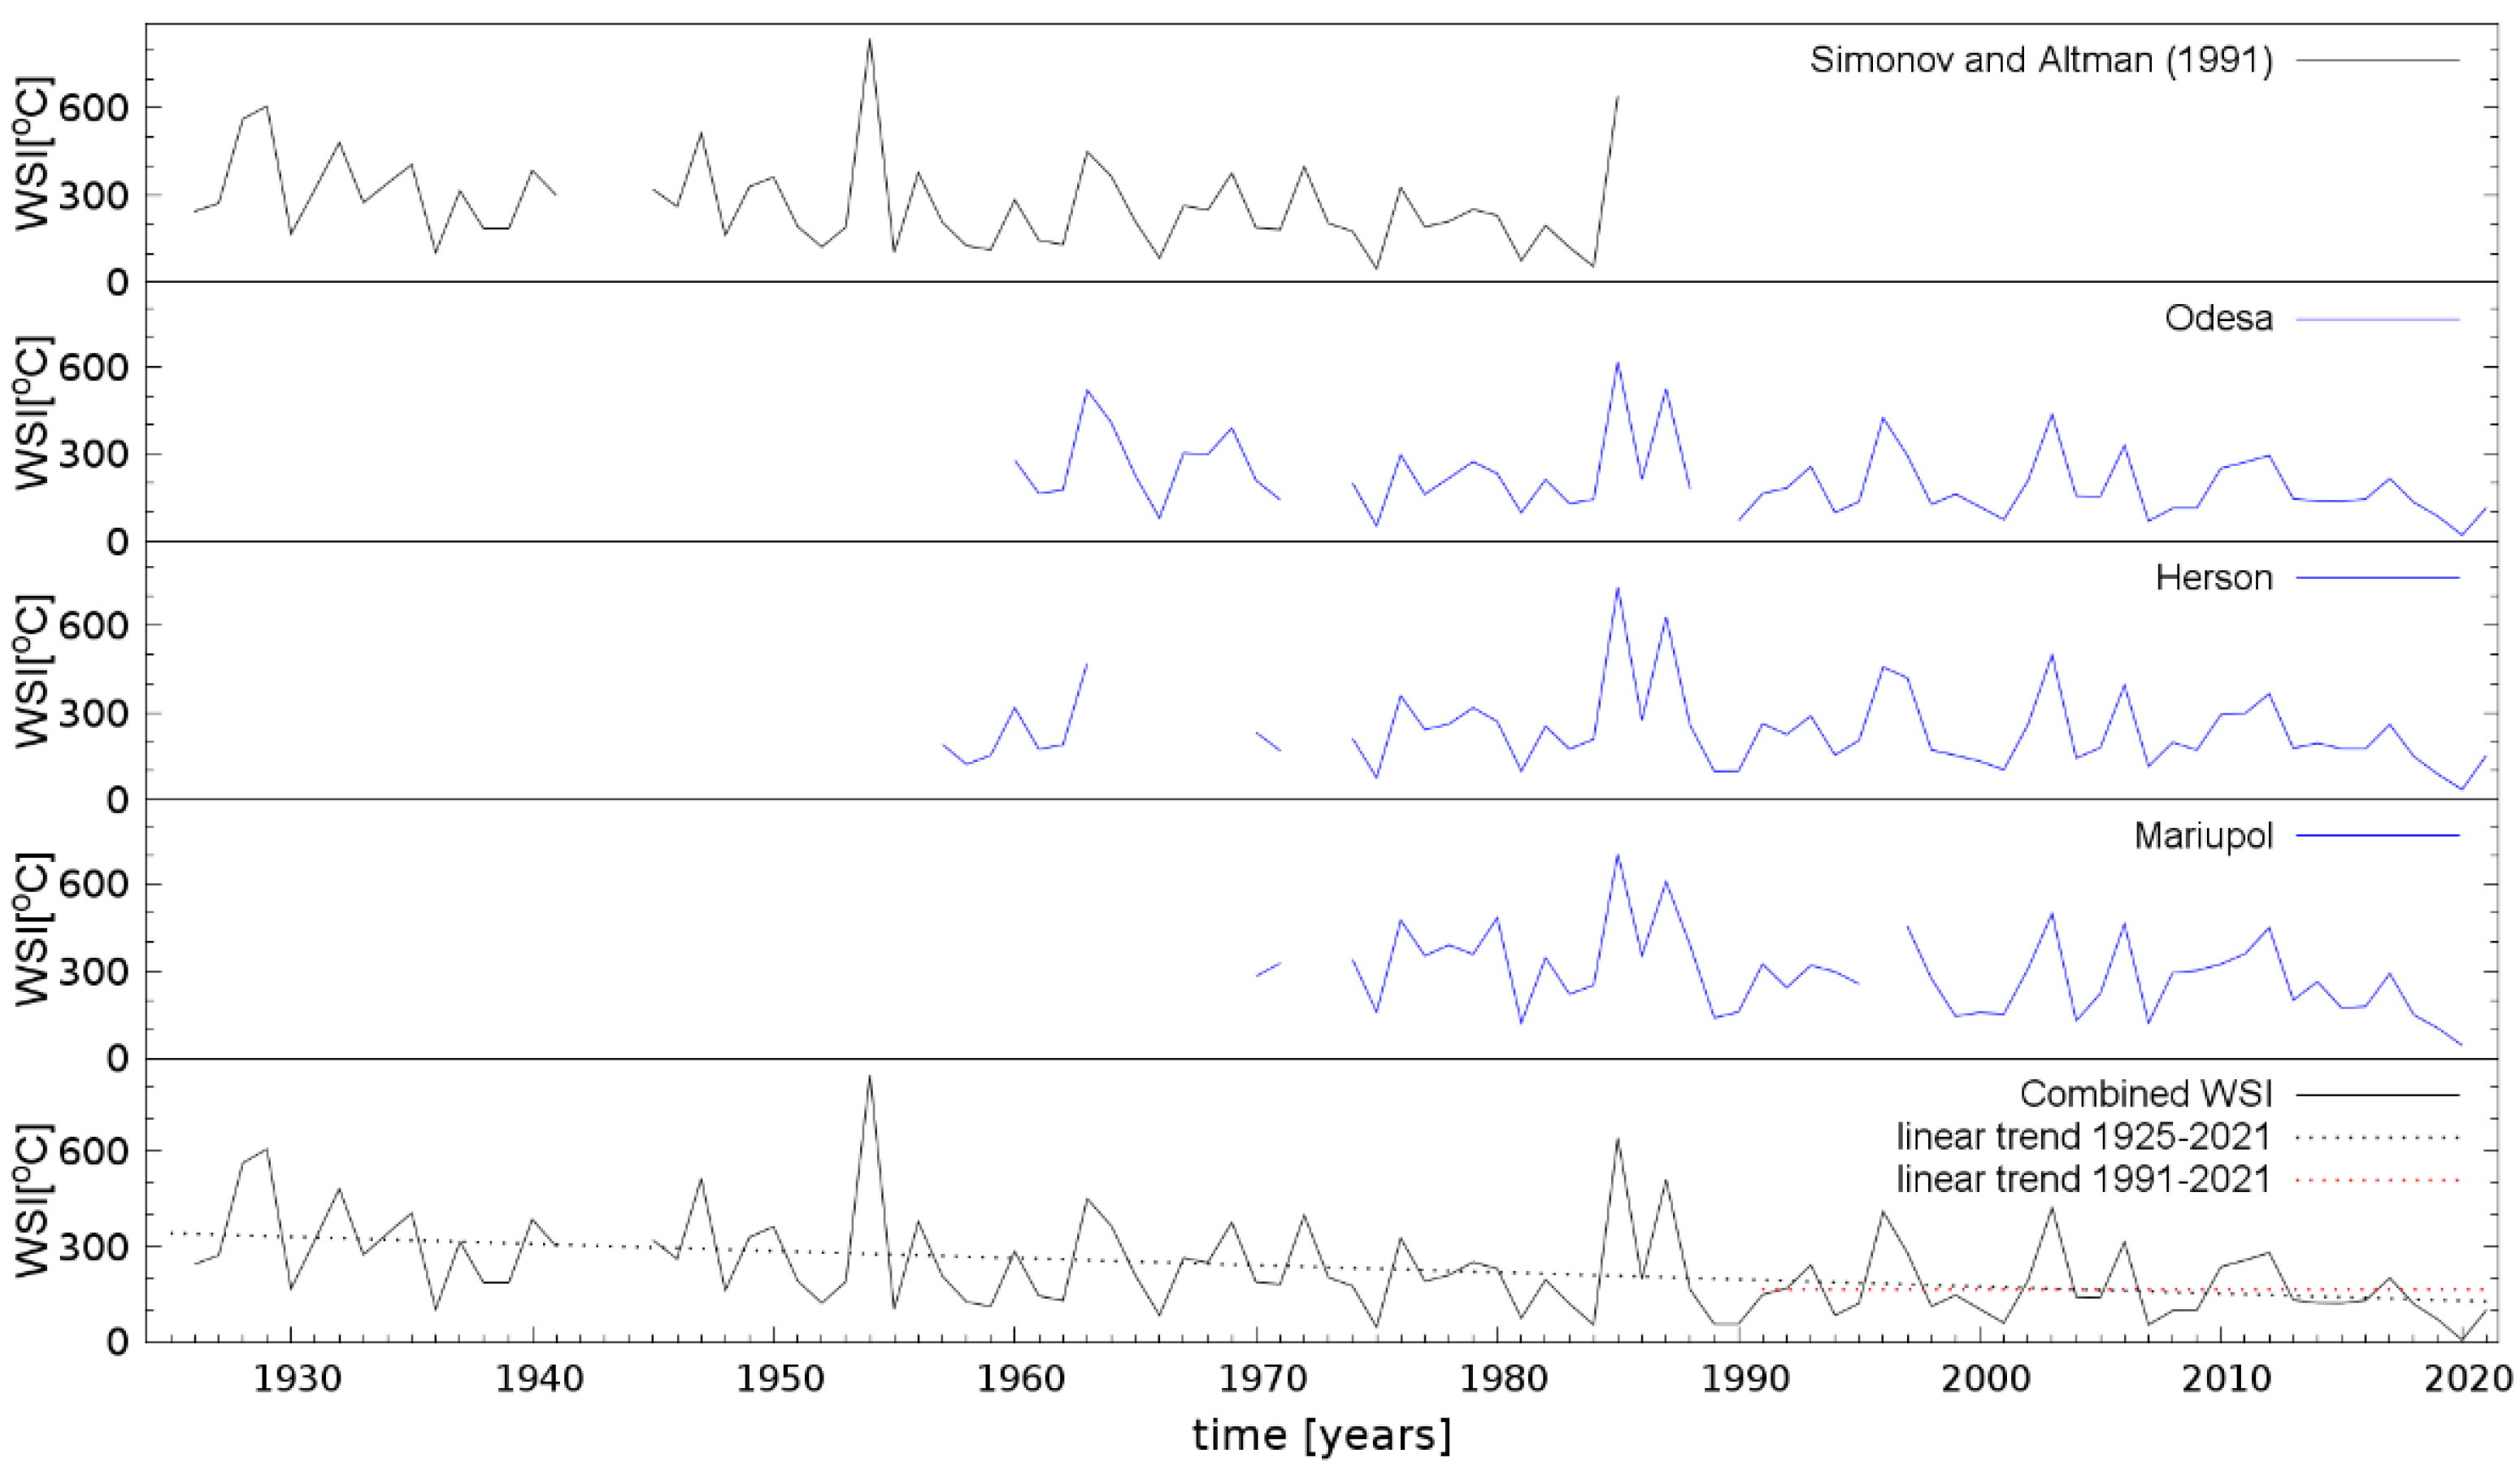
The graphs in
Figure 11 represent the WSI variations from the historical data of Simonov and Altman [
1] for the period 1926–1985; below, our calculated WSI from the synoptic measurements in Odesa, Herson and Mariupol is presented after 1950, when data are available. It can be seen that the values evolve in a very similar manner. Mariupol is the northern-most city and, as consequence, the winter severity index is the highest there. The Odesa and Herson graphs are similar. In 1954, there was an extremely cold winter in this area. The Pearson correlation coefficients of Herson and Mariupol’s WSI with respect to Odessa’s WSI are 0.97 and 0.88, which are quite high. In
Table 2, we show the calculated Pearson correlation coefficient of WSI in Odesa, Herson and Mariupol with respect to Simonov and Altman’s [
1] WSI in the overlapping period. This good correlation of historical WSI with Odesa’s WSI allows us to prolong the first time series with the data from Odesa. In order to tailor the two time series, we aligned the mean value in the overlapping period (WSI
mean 220 vs. 246 °C); the standard deviations are practically equal. The missing value in Odesa’s record for the year 1989 is substituted by the data of Herson.
Thus, we constructed a new WSI time series that is only missing the World War II period, 1942–1944, shown in the lowest panel of
Figure 11. In order to assess the combined WSI consistency, we ran a standard normal homogeneity test, developed by Alexandersson [
19], to detect potential change points in a time series (from R:
https://cran.r-project.org/web/packages/snht/snht.pdf, accessed on 11 June 2022). At a confidence level of 95%, the test discovered one change point in 1973. We decided, however, not to further modify the original time series of Simonov and Altman [
1] because there is also a gap in the Odesa record in this period (1972–1973) from GSOD.
The most notable fact in the combined time series in
Figure 11 is the negative trend of WSI during the period 1926–2021, estimated at ~25 °C/decade (black dashed line). We also present the linear trend for the latest 30 years, 1991–2021 (red dashed line); both lines nearly coincide. This suggests that the tendency to warmer winters in this region since the beginning of the 20th century did not change significantly in the almost 100-year period.
In regard to the reported freezing event during the 20th century, there is a relation to the winter temperature, but this is not direct. Comparing
Figure 10a,b, we see that the coldest winters in 1954, 1963 and 1985 led to a large average extent of sea ice. On the contrary, the ice-free winters in 1970, 1971, 1981 and 1983 are not the warmest on record. The winter-to-winter sea ice-covered area does not necessarily follow the WSI. This again leads us to the conclusion that the mean seasonal winter temperature is not the only factor impacting the north Black Sea freezing events.
3.6. Winter Classification Based on WSI
In this section, we aim to categorize the long-term winter conditions in the Black Sea region using the Winter Severity Index (WSI). The threshold values of WSI were determined following the approach of Simonov and Altman [
1] and are given in
Table 2. The same methodology was used in [
10].
According to the classification in
Table 3,
Table 4 shows the WSI of the winters in the period 1926–2021 and gives the type of winters. Note that, since 2003, no really “cold” winter conditions have been observed (e.g., WSI > 400), and the relative colder moderate winters are indicated as “Moderate *”. The information in
Table 4 has been updated since the study of Matov et al. (2020), where the same methodology was used.
From the winter classification, it can be seen that “cold winter” conditions usually last only one season, and the following winter is either mild or moderate. Rarely are there two cold winters in sequence. We think this is due to the the Black Sea acting as a buffer and its thermal inertia as a large water body. The recent study of Stanev et al. [
20] investigated the water mass formation of the Black Sea and found that the temperature of the winter atmosphere affected the formation of a specific layer in the Black Sea—the cold intermediate layer—thus affecting sea stratification. There is no doubt that sea temperature is one of the factors that impacts freezing in the basin and it is well known that the Black Sea’s surface temperature has been increasing in the last 30 years [
21]. Future work is intended in order to better understand the air–sea climate feedback mechanism in the Black Sea region.
4. Conclusions and Discussions
In this study, we combine data from satellite observations of Black Sea ice cover with data from synoptic measurements in coastal meteorological stations in an attempt to analyze the Black Sea freezing events and relate them to the winter conditions. We conclude that not only is a low air temperature necessary, but also is the occurrence of specific meteorological events.
The satellite daily product on the sea-ice cover from the archive MASIE-NH was used to estimate the sea ice-covered areas in the period 2006–2021. It was found that in the northern areas, freezing is observed rather regularly. The winters in 2007, 2020 and 2021 are unique, with no ice observed, and the maximal area covered with ice was reached in February 2012.
We used synoptic observations from nine coastal Black Sea meteorological stations in order to analyze the mean winter temperature and winter severity (Odesa, Herson, Mariupol, Burgas, Varna, Istanbul, Trabzon, Sinop, and Batumi). Winter is defined for the months January, February, and March. Our study shows that the variations between sites, especially for the northern parts of the Black Sea, are very similar and in phase, suggesting that the winter conditions are uniform in the majority of the basin. There has been a tendency for milder winters in the last two decades in all nine stations.
Our analysis of the mean air temperature in winter shows that freezing is partially related to a generally colder winter season. However, the analysis of the weather patterns during the periods of maximal sea-ice coverage indicates that the tendency for freezing in the northern Black Sea is a combined influence of Siberian High and Arctic air mass penetration on the periphery of a high-latitude Atlantic cyclones.
The results for the sea-ice cover derived from the satellite product were combined with published observations in the 20th century in an attempt to compare the trends and interannual variations. The direct comparison of these two nonoverlapping periods is not possible; however, it can be seen that the global warming does not affect the freezing events. There is no evident tendency for decreases in temperature and significant interannual variations are noted. The Winter Severity Index time series for the 20th century extends until 2021 and indicates a negative trend of ~25 °C/decade, reflecting the pattern of experiencing warmer winters in the Northern Hemisphere. The linear trend for the last 30 years, 1991–2021, is similar to this and suggests that the tendency for warmer winters in this region did not change significantly in the almost 100-year period.
The freezing events observed in the periods 1948–1985 and 2006 partially related to winter severity, but our analysis has unveiled that other factors (specific meteorological patterns) had an influence. Further work to clarify these relationships is warranted.
The WSI was used to classify the winters in the period 1926–2021 as cold, moderate or mild. Since 2003, no real “cold” winter conditions in the region were observed, but 2006, 2012 and 2017 were cool. On the other “warm” end are the winters in 2001, 2007, 2020 and 2021. The winter of 2020 was anomalously warm, the mildest of the analyzed period.
Author Contributions
Investigation, data processing and analysis, figure, and text preparation, M.M.; conceptualization, methodology and supervision, E.P.; analysis in
Section 3.3, V.G. All authors have read and agreed to the published version of the manuscript.
Funding
This research received no external funding.
Institutional Review Board Statement
Not applicable.
Informed Consent Statement
Not applicable.
Data Availability Statement
(1) Data on the extent of sea-ice extent are publicly available at the US National Snow and Ice Data Center (nsidc.org/data/masie), product Multisensor Analyzed Sea Ice Extent—Northern Hemisphere (MASIE-NH). The considered period is 2006–2021. (2). Daily data for the 2 m air temperature in nine coastal meteorological stations along the Black Sea coast—Burgas, Varna, Odessa, Herson, Mariupol, Batumi, Trabzon, Sinop and Istanbul—are distributed by the Global Surface Summary of the Day (GSOD) data archive, which is publicly available at NCEI NOAA, dataset reference gov.noaa.ncdc:C00516. The covered period is 1950 until the present. (3). Historical data on the extent of Black Sea ice (for the period 1948–1984) and winter severity index at the Northern Black Sea coast (the period 1926–1985) were taken from Simonov and Altman (1991). (4). The synoptic weather maps are publicly available on the wetter3.de archive, presenting results from the four times daily reanalysis of the GFS modelling system run at NCEP.
Acknowledgments
This work was carried out in the framework of the National Science Program “Environmental Protection and Reduction of Risks of Adverse Events and Natural Disasters”, approved by the Resolution of the Council of Ministers 577/17.08.2018 and supported by the Ministry of Education and Science (MES) of Bulgaria (Agreement D01-363/17.12.2020).
Conflicts of Interest
The authors declare no conflict of interest.
References
- Simonov, A.; Altman, E. (Eds.) Hydrometeorology and Hydrochemistry of the USSR Seas; Gidrometeoizdat: St. Petersburg, Russia, 1991; Volume 4, p. 426. (In Russian) [Google Scholar]
- Klimentov, L. About the ice cover of the Odessa Gulf. In Bulletin of the Oleskiy Komisii Kraiznavstva pri VUAI; 1924; Part 1; pp. 7–10. (In Russian) [Google Scholar]
- Sludsky, A.F.; Ratmanov, G.E. Freezing of the Feodosia port. In Bulletin of Weather and Sea State; Feodosia, 1928; No. 5; pp. 8–13. (In Russian) [Google Scholar]
- Belchenko, K.A. Ice in the southwestern part of the Black Sea in the winter of 1928-29. Notes Hydrogr. 1930, 62, 73–75. (In Russian) [Google Scholar]
- Zubakin, N.A. Ice of the northwestern region of the Black Sea and the ice regime near Odessa in the winter of 1946-47. In Proceedings of the Odessa Research Geophysical Observatory, 1950; Issue 1. pp. 16–22. (In Russian). [Google Scholar]
- Zhidkova, N.I. Ice conditions on the Black Sea of winters of varying severity. In Collection of Works by LYUM GOIN; 1972; Issue 11, pp. 103–111. (In Russian) [Google Scholar]
- Tyutnev, Y.A. On heavy ice conditions in the Black, Azov and Caspian seas in winter 1971/72. In Proceedings of the GMC, 1975; Issue 119. pp. 47–53. (In Russian). [Google Scholar]
- Shirkina, N.A. Synoptic conditions of freezing of the Azov and northwestern parts of the Black Sea. In Proceedings of the GGO; 1983; Volume 25, pp. 23–29. (In Russian). [Google Scholar]
- Kryidin, L.N. Seasonal and interannual changes in ice coverage and position of the ice edge in the Black and Azov Seas in connection with the peculiarities of atmospheric circulation. Trudy GOIN 1964, 76, 7–79. (In Russian) [Google Scholar]
- Matov, M.; Peneva, E.; Georgieva, G. Black Sea freezing and winter severity: Relation to the temperature. In Proceeding of the 1st International Conference on Environmental Protection and Disaster RISKs—Part One; Gadjev, G., Dobrinkova, N., Eds., Eds.; Publisher Az-buki National Publishing House: Sofia, 2020; pp. 134–143. [Google Scholar] [CrossRef]
- Romania Insider, Latest News & Feature Stories from Romania. Available online: https://www.romania-insider.com/ (accessed on 11 June 2022).
- National Snow and Ice Data Center. Available online: https://nsidc.org/data/g02156 (accessed on 11 June 2022).
- Meier, W.; Fetterer, F.; Stewart, J.; Helfrich, S. How do sea-ice concentrations from operational data compare with passive microwave estimates? Implications for improved model evaluations and forecasting. Ann. Glaciol. 2015, 56, 332–340. [Google Scholar] [CrossRef] [Green Version]
- Global Surface Summary of the Day—GSOD. Available online: https://www.ncei.noaa.gov (accessed on 19 April 2022).
- wetter3.de. (Rainer Behrendt, Holger Mahlke) FF14. Available online: http://wetter3.de (accessed on 11 June 2022).
- Google. Google Maps. Available online: https://www.google.com/maps (accessed on 11 June 2022).
- IPCC. AR5 Climate Change 2013: The Physical Science Basis. In Contribution of Working Group I to the Fifth Assessment Report of the Intergovernmental Panel on Climate Change; Stocker, T.F., Qin, D., Plattner, G.-K., Tignor, M., Allen, S.K., Boschung, J., Nauels, A., Xia, Y., Bex, V., Midgley, P.M., Eds.; Cambridge University Press: Cambridge, UK; New York, NY, USA, 2013; 1535p. [Google Scholar]
- Galabov, V.; Chervenkov, H. Study of the Western Black Sea Storms with a Focus on the Storms Caused by Cyclones of North African Origin. Pure Appl. Geophys. 2018, 175, 3779–3799. [Google Scholar] [CrossRef]
- Alexandersson, H. A homogeneity test applied to precipitation data. J. Climatol. 1986, 6, 661–675. [Google Scholar] [CrossRef]
- Stanev, E.V. Climate Change and Regional Ocean Water Mass Disappearance: Case of the Black Sea. J. Geophys. Res. Oceans 2019, 124, 4803–4819. [Google Scholar] [CrossRef]
- von Schuckmann, K.; Le Traon, P.-Y.; Alvarez-Fanjul, E.; Axell, L.; Balmaseda, M.; Breivik, L.-A.; Brewin, R.J.W.; Bricaud, C.; Drevillon, M.; Drillet, Y.; et al. The Copernicus Marine Environment Monitoring Service Ocean State Report. J. Oper. Oceanogr. 2016, 9 (Suppl. S2), s235–s320. [Google Scholar] [CrossRef]
| Publisher’s Note: MDPI stays neutral with regard to jurisdictional claims in published maps and institutional affiliations. |
© 2022 by the authors. Licensee MDPI, Basel, Switzerland. This article is an open access article distributed under the terms and conditions of the Creative Commons Attribution (CC BY) license (https://creativecommons.org/licenses/by/4.0/).


