
Study on the Source Profile Characteristics of Carbon Plant

Abstract
:1. Introduction
2. Materials and Methods
2.1. Sample Collection
2.2. Sample Analysis
2.2.1. Blank Filter Membrane Treatment
2.2.2. Filter Membrane Weighing
2.2.3. Elemental Composition Analysis
2.2.4. Water-Soluble Ions Analysis
2.2.5. Carbon Analysis
3. Results and Discussions
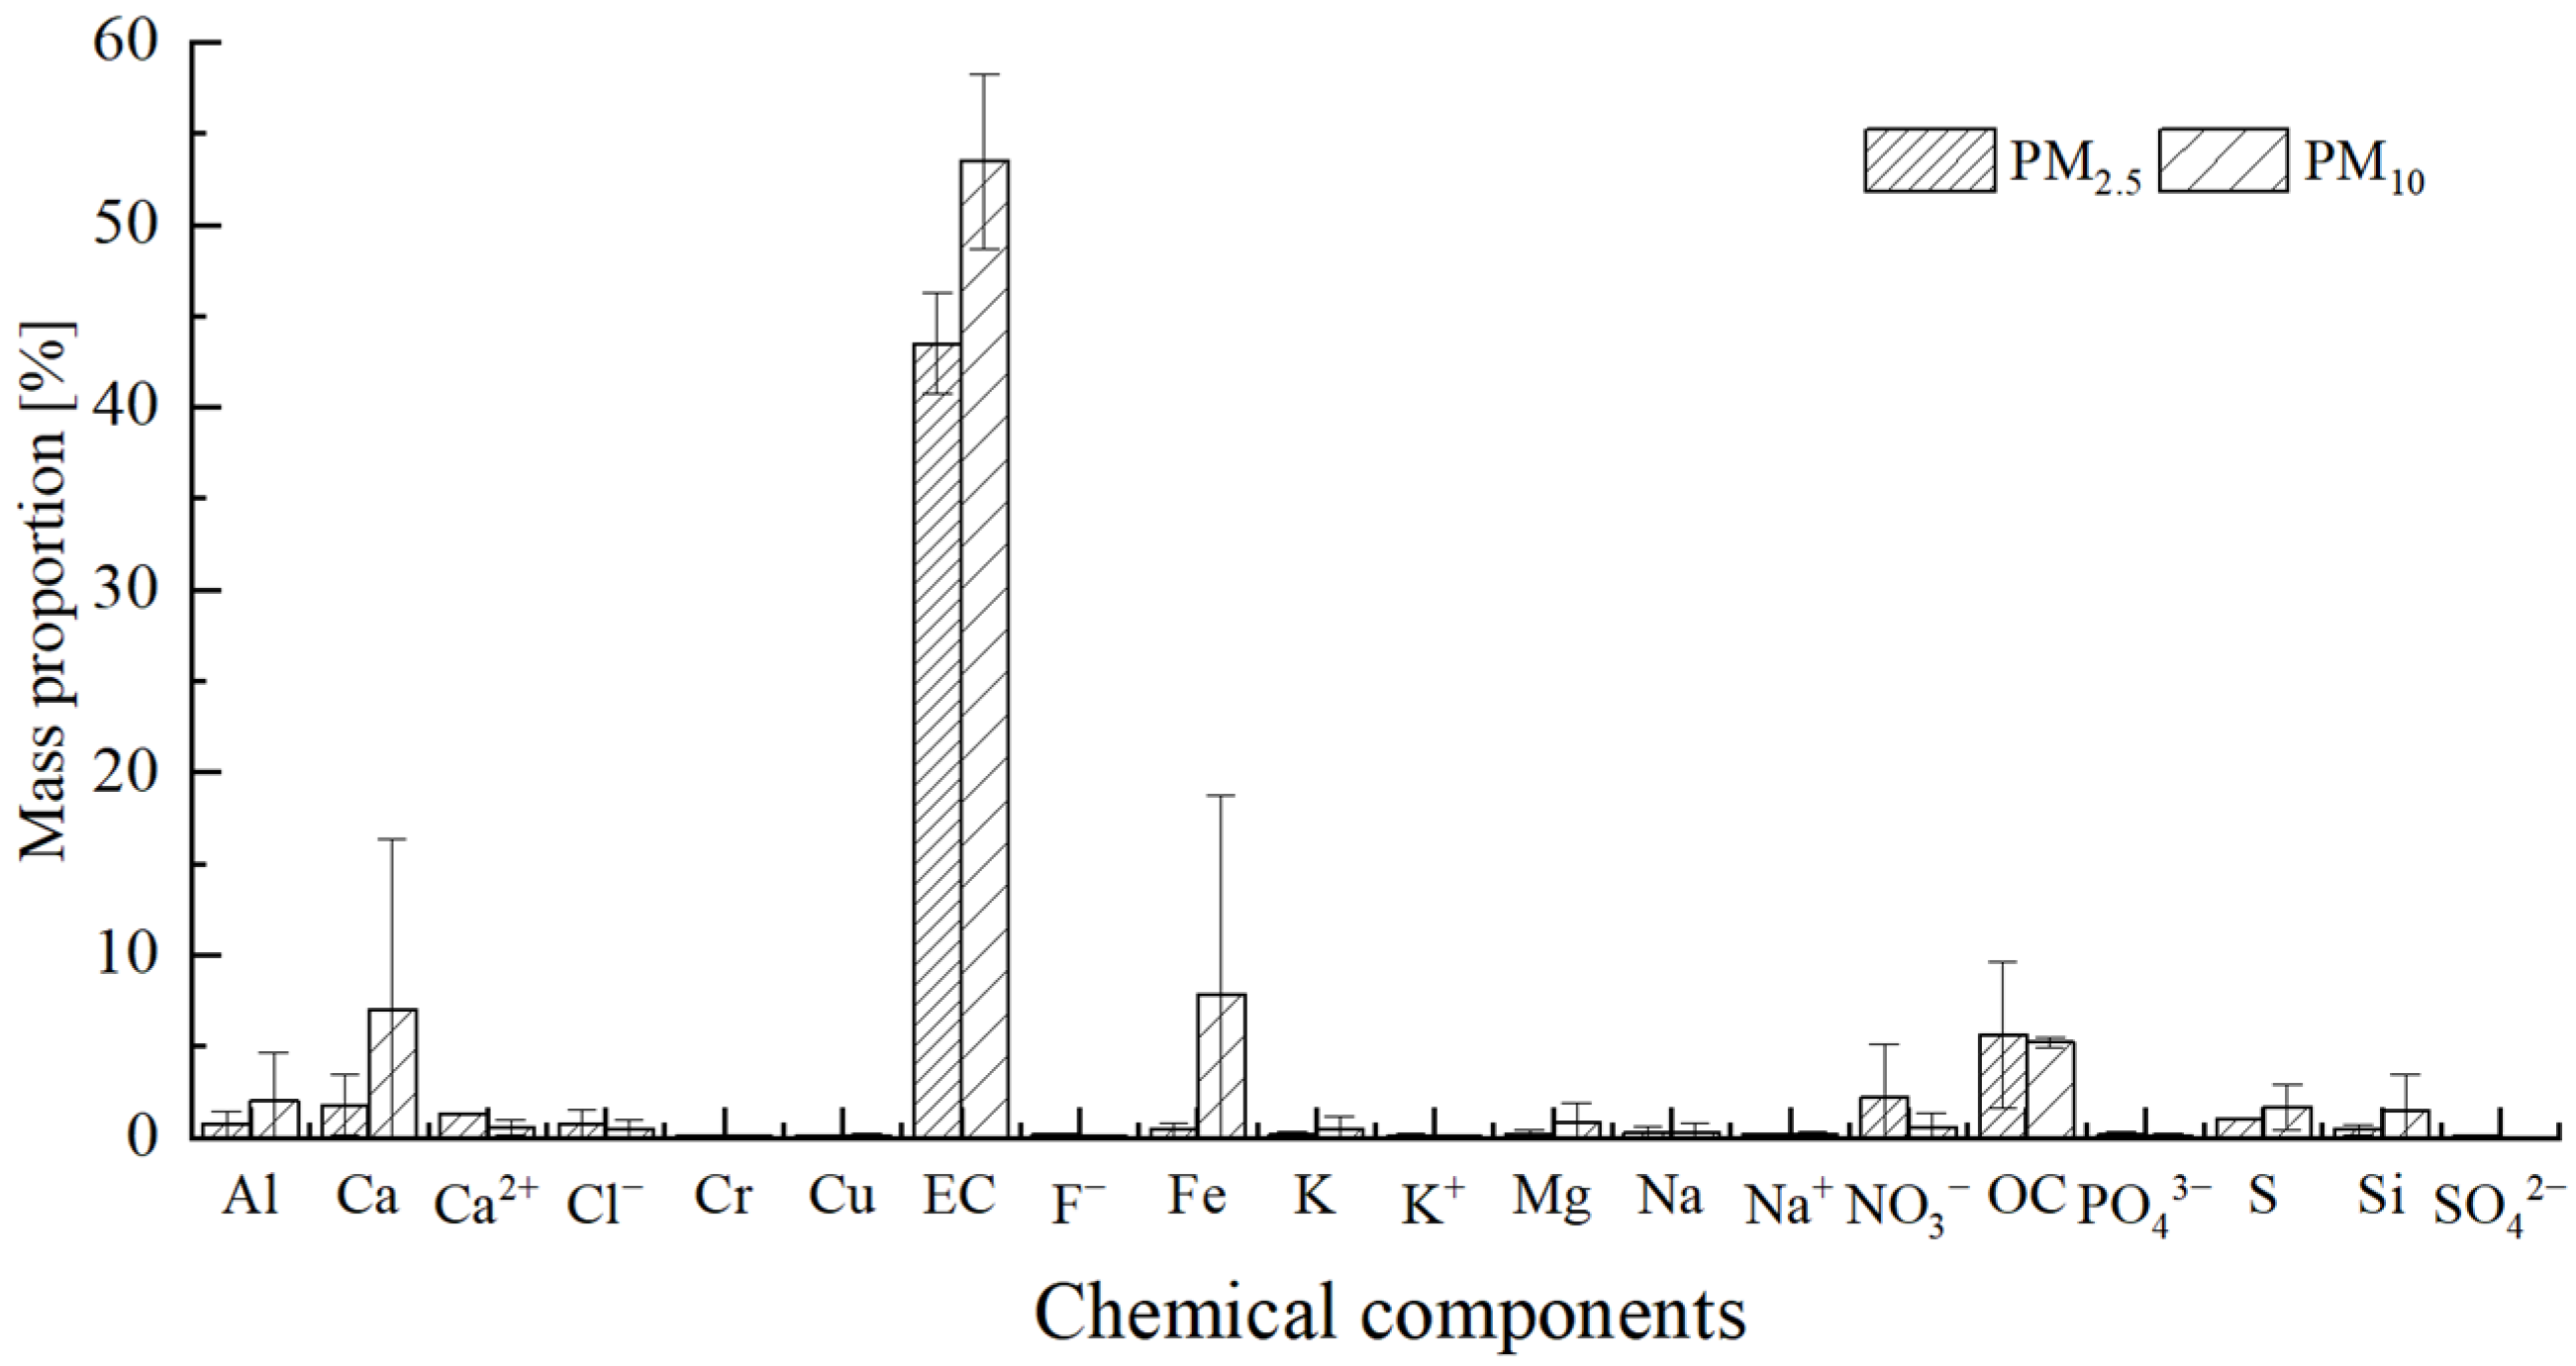
3.1. Source Profile Characteristics of Carbon Plant
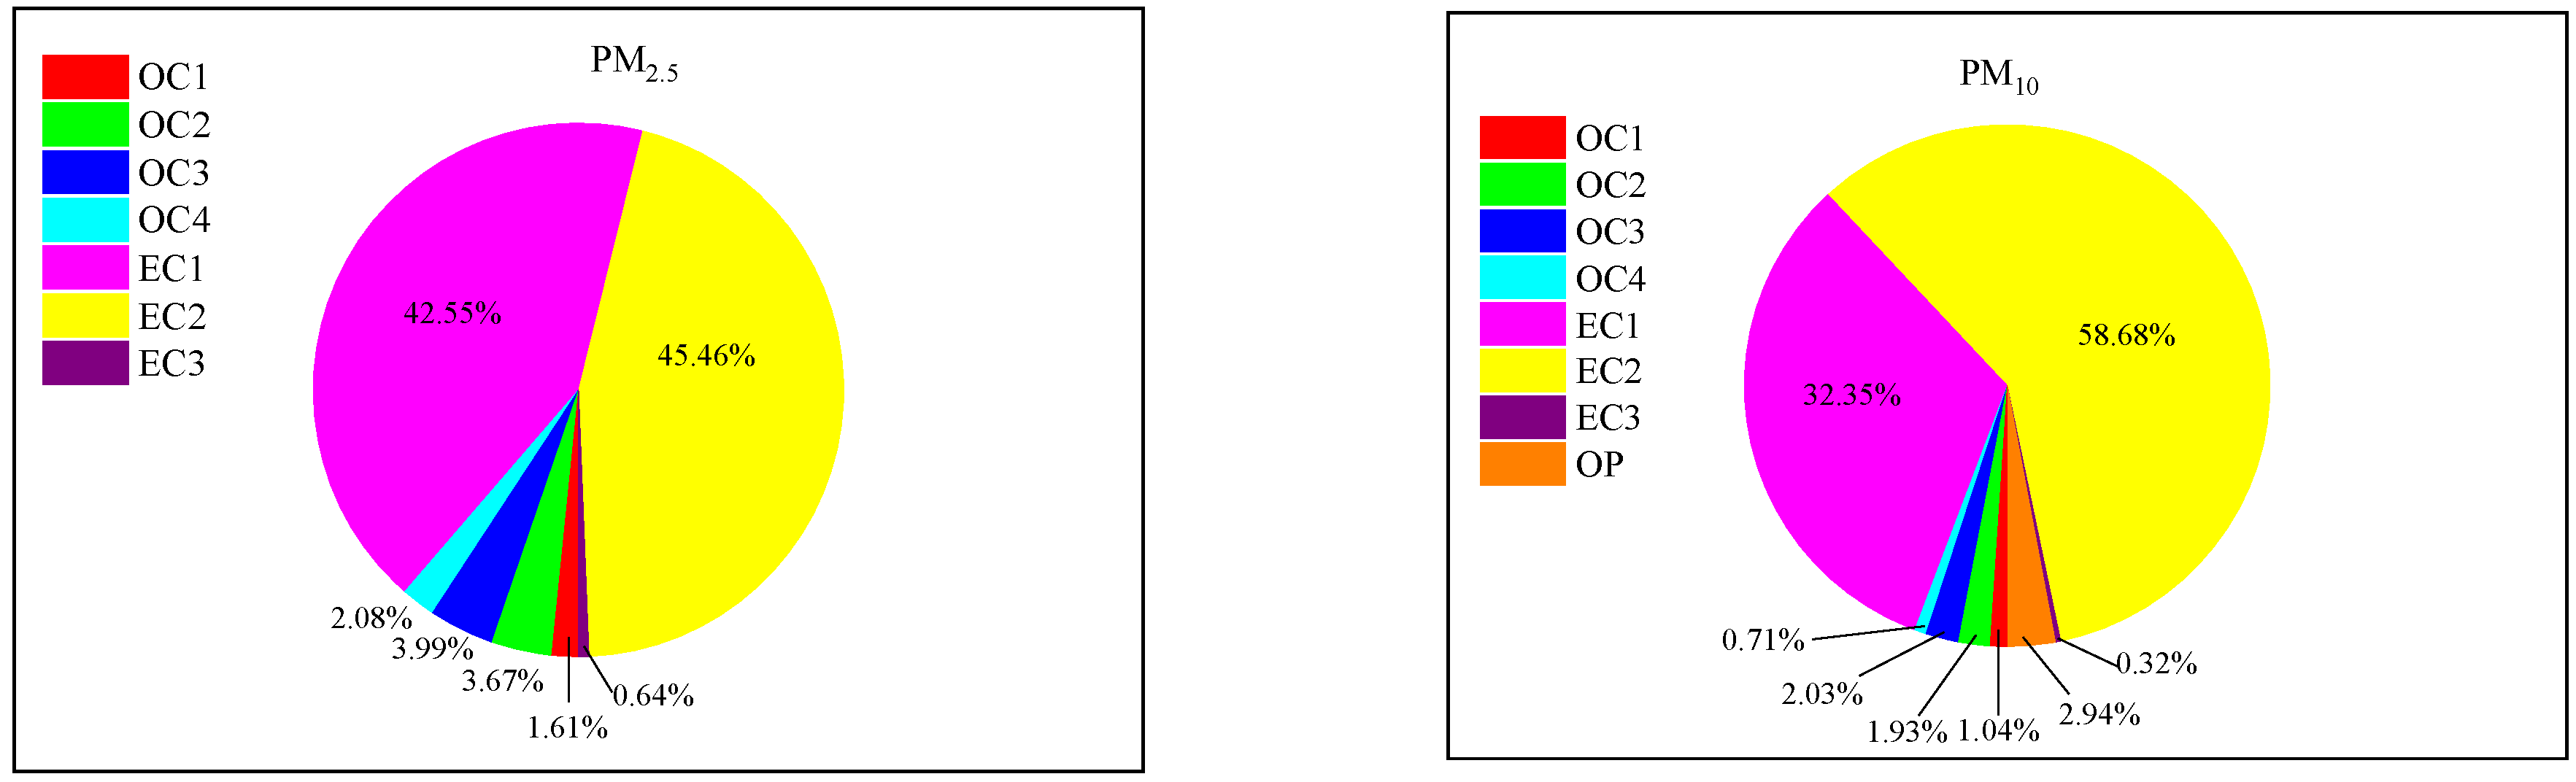
3.2. Distribution Characteristics of Carbonaceous Components
3.3. Comparison with Other Emission Sources by Identifiable Carbonaceous Components
4. Conclusions
- The percentages of EC, Ca, Ca2+, S, Al, Si and Fe were higher in particles from carbon plant than the remaining components.
- The chemical marker of carbon plant was EC, and the trace carbonaceous components of carbon plant were EC1 and EC2, which were very different from other emission sources.
- In the absence of other chemical composition information, eight carbonaceous components can be used to identify the sources of particulate matter.
Author Contributions
Funding
Institutional Review Board Statement
Informed Consent Statement
Data Availability Statement
Conflicts of Interest
References
- Wang, M.S.; Mo, D.G. Research on the Development of Modern Carbon Equipment and Production Technology for Aluminum. Inn. Mong. Sci. Technol. Econ. 2012, 9, 17–18+20. [Google Scholar]
- Zhao, Y.Z.; Gong, R.P. Environmental Pollution Problems and Countermeasures in Carbon Industry-Take Dantu District of Zhenjiang as an Example. Guangdong Chem. Ind. 2018, 22, 88–89. [Google Scholar]
- Jin, D. Design for the De-dusting & Scrubbing System for the Mixing & Compacting Sections in the Carbon Plant. J. Guizhou Univ. Technol. 2018, 37, 225–228. [Google Scholar]
- Peng, X.; Ding, J.; Shi, G.L.; Han, J.H.; Wu, W.Q.; Wang, K.L.; Feng, Y.C. Study on the Characteristics of Source Profiles in Hohhot. Environ. Pollut. Control 2016, 38, 57–61. [Google Scholar] [CrossRef]
- Simon, H.; Beck, L.; Bhave, P.V.; Divata, F.; Hsu, Y.; Luecken, D.; Mobley, D.; Pouliot, G.A.; Reff, A.; Sarwar, G.; et al. The Development and Uses of EPA’s SPECIATE Database. Atmos. Pollut. Res. 2010, 1, 196–206. [Google Scholar] [CrossRef] [Green Version]
- Liu, Y.Y.; Zhang, W.J.; Bai, Z.P.; Yang, W.; Zhao, X.Y.; Han, B.; Wang, X.H. Characteristics of PM2.5 Chemical Source Profiles of Coal Combustion and Industrial Process in China. Res. Environ. Sci. 2017, 30, 1859–1868. [Google Scholar] [CrossRef]
- Qin, Y.J.; Ni, J.W.; Zhao, D.X.; Yang, Y.; Han, L.Y.; Li, B.W. Emission Characteristics and Risk Assessment of Volatile Organic Compounds from Typical Factories in Zhengzhou. Environ. Sci. 2020, 4, 3056–3065. [Google Scholar] [CrossRef]
- Shao, S.J.; Zhang, X.L. The Design of Treatment System for Exhaust Pitch Gas in Carbon Plant. J. Jiaozuo Univ. 2003, 4, 50–52. [Google Scholar] [CrossRef]
- Fang, J.P.; Ding, G.H.; Huang, G.Q.; Song, W.M.; Zhu, H.G.; Jiang, S.H.; Jiang, Z.R. Study on the Effect of Air Pollution on Workers’ Health in Shanghai Carbon Plant. J. Occup. Med. 1994, S1, 52–53. [Google Scholar] [CrossRef]
- Chow, J.C.; Watson, J.G.; Chen, L.-W.A.; Arnott, W.P.; Moosmuller, H. Equivalence of Elemental Carbon by Thermal/Optical Reflectance and Transmittance with Different Temperature Protocols. Environ. Sci. Technol. 2004, 38, 4414–4422. [Google Scholar] [CrossRef]
- Chow, J.C.; Watson, J.G.; Chen, L.-W.A.; Chang, M.C.O.; Robinson, N.F.; Trimble, D.; Kohl, S. The IMPROVE_A Temperature Protocol for Thermal/Optical Carbon Analysis: Maintaining Consistency with a Long-Term Database. J. Air Waste Manag. Assoc. 2007, 57, 1014–1023. [Google Scholar] [CrossRef] [Green Version]
- Liu, B.S.; Song, N.; Dai, Q.L.; Mei, R.B.; Sui, B.H.; Bi, X.H.; Feng, Y.C. Chemical Composition and Source Apportionment of Ambient PM2.5 during the Non-heating Period in Tai’an, China. Atmos. Res. 2016, 170, 23–33. [Google Scholar] [CrossRef]
- Liu, G.; Li, J.H.; Xu, H. Chemical Composition and Source Apportionment of the Ambient PM2.5 in Hangzhou, China. Particuology 2015, 18, 135–143. [Google Scholar] [CrossRef]
- Wei, X.; Bi, X.H.; Dong, H.Y.; Chen, K.; Sun, R.; Feng, Y.C. Characteristics and Source of Particulate Matter during Hazy and Non-Hazy Episodes in Tianjin City in Summer. Res. Environ. Sci. 2012, 25, 1193–1200. [Google Scholar] [CrossRef]
- Zhang, Z.S. Emission Characteristics and Health Risk Assessment of Particulate Matter from Carbon Industry in Zhengzhou. Master’s Thesis, Zhengzhou University, Zhengzhou, China, 2020. [Google Scholar] [CrossRef]
- Wang, X.L.; Sato, T.; Xing, B.S. Size Distribution and Anthropogenic Sources Apportionment of Airborne Trace Metals in Kanazawa, Japan. Chemosphere 2006, 65, 2440–2448. [Google Scholar] [CrossRef]
- Teng, J.Q.; Wang, W.; Jiang, S.J.; Cheng, Z.; Xue, Y.G. Study on the Sources Profiles of PM2.5 Major Emissions in Changzhou. Environ. Sci. Technol. 2015, 28, 56–64. [Google Scholar]
- Guo, J.; Hua, L.; Jing, H.W. Summary of Current Research on Source Profiles of Atmospheric Particulates. Environ. Monit. 2011, 3, 28–32. [Google Scholar] [CrossRef]
- Cao, J.J.; Wu, E.; Chow, J.C.; Lee, S.C.; Li, Y.; Chen, S.W.; An, Z.S.; Fung, K.K.; Watson, J.G.; Zhu, C.S. Characterization and Source Apportionment of Atmospheric Organic and Elemental Carbon during Fall and Winter of 2003 in Xi’an, China. Atmos. Chem. Phys. 2005, 5, 3127–3137. [Google Scholar] [CrossRef] [Green Version]
- Zhang, C.; Zhou, Z.E.; Zhai, C.Z.; Bai, Z.P.; Chen, G.C.; Ji, Y.Q.; Ren, L.H.; Fang, W.K. Carbon Source Apportionment of PM2.5 in Chongqing Based on Local Carbon Profiles. Environ. Sci. 2014, 35, 810–819. [Google Scholar] [CrossRef]
- Chow, J.C.; Watson, J.G.; Kuhns, H.; Etyemezian, V.; Lowenthal, D.H.; Crow, D.; Kohl, S.D.; Engelbrecht, J.P.; Green, M.C. Source Profiles for Industrial, Mobile, and Area Sources in the Big Bend Regional Aerosol Visibility and Observational Study. Chemosphere 2004, 5, 185–208. [Google Scholar] [CrossRef]
- Gu, J.X.; Bai, Z.P.; Liu, A.X.; Wu, L.P.; Xie, Y.Y.; Li, W.F.; Dong, H.Y.; Zhang, X. Characterization of Atmospheric Organic Carbon and Element Carbon of PM2.5 and PM10 at Tianjin, China. Aerosol Air Qual. Res. 2010, 10, 167–176. [Google Scholar] [CrossRef] [Green Version]
- Zhu, C.S.; Chen, C.C.; Cao, J.J.; Tsai, C.J.; Chou, C.C.-K.; Liu, S.C.; Roam, G.D. Characterization of Carbon Fractions for Atmospheric Fine Particles and Nanoparticles in a Highway Tunnel. Atmos. Environ. 2010, 44, 2668–2673. [Google Scholar] [CrossRef]
- Wen, J.; Yang, J.M.; Li, P.; Yu, J.; Wu, J.H.; Tian, Y.Z.; Zhang, J.S.; Shi, G.L.; Feng, Y.C. Chemical Source Profiles of PM Emitted from the Main Processes of the Iron and Steel Industry in China. Environ. Sci. 2018, 39, 4885–4891. [Google Scholar] [CrossRef]
- Feng, X.Q.; Chen, J.H.; Xiong, W.P.; Mei, L.D.; Xu, X.M.; Yin, H.M.; Liu, Z.; Qian, J. Particulate Matter Emission Characteristics from the Main Processes of a Typical Iron and Steel Plant in Sichuan Province. Environ. Pollut. Control 2021, 43, 956–961. [Google Scholar] [CrossRef]
- Zhao, L.; Zhang, D.; Zhou, Z.E.; Ren, L.H.; Yin, B.H.; Yuan, R. A Study on Emission Characteristics of Particulate Matters from Typical Industrial Combustion Sources in Chongqing City. J. Environ. Eng. Technol. 2015, 5, 447–454. [Google Scholar] [CrossRef]

| Information | Data |
|---|---|
| name of sampling site | Tongliao Carbon Plant |
| boiler type | coal-powder boiler |
| boiler tonnage | 8 t/h |
| desulfurization method | lime method |
| denitration method | none |
| dust removal method | cloth bag and filter cylinder |
| sampling method | dilution four-channel |
| dilution multiplication factor | 3 |
| sampling duration | 2 h 10 min |
| sampling flow | 33.34 L/min |
| number of samples | two PM10, two PM2.5 |
| Components | PM2.5 | PM10 |
|---|---|---|
| Al | 0.766 ± 0.723 | 1.997 ± 2.690 |
| Ca | 1.796 ± 1.661 | 7.060 ± 9.308 |
| Co | 0.002 ± 0.001 | 0.001 ± 0.001 |
| Cr | 0.103 ± 0.091 | 0.123 ± 0.002 |
| Al | 0.766 ± 0.723 | 1.997 ± 2.690 |
| Cu | 0.085 ± 0.057 | 0.139 ± 0.075 |
| Fe | 0.450 ± 0.383 | 7.849 ± 10.910 |
| Hg | 0.004 ± 0.005 | 0.014 ± 0.019 |
| K | 0.175 ± 0.193 | 0.505 ± 0.674 |
| Mg | 0.202 ± 0.0219 | 0.829 ± 1.130 |
| Mn | 0.007 ± 0.003 | 0.055 ± 0.073 |
| Na | 0.307 ± 0.341 | 0.330 ± 0.445 |
| Ni | 0.047 ± 0.051 | 0.082 ± 0.104 |
| Pb | 0.013 ± 0.009 | 0.030 ± 0.036 |
| S | 1.064 ± 0.033 | 1.674 ± 1.222 |
| Si | 0.456 ± 0.275 | 1.523 ± 1.942 |
| Ti | 0.012 ± 0.009 | 0.045 ± 0.059 |
| V | 0.008 ± 0.006 | 0.018 ± 0.012 |
| Zn | 0.030 ± 0.008 | 0.089 ± 0.104 |
| OC | 5.624 ± 4.017 | 5.228 ± 0.264 |
| EC | 43.491 ± 2.748 | 53.471 ± 4.824 |
| F− | 0.159 ± 0.086 | 0.071 ± 0.053 |
| Cl− | 0.756 ± 0.820 | 0.505 ± 0.493 |
| Br− | 0.042 ± 0.012 | 0.014 ± 0.002 |
| NO3− | 2.224 ± 2.908 | 0.621 ± 0.745 |
| PO42− | 0.184 ± 0.180 | 0.123 ± 0.116 |
| SO42− | 0.091 ± 0.035 | 0.046 ± 0.021 |
| Na+ | 0.164 ± 0.115 | 0.176 ± 0.192 |
| NH4+ | 0.010 ± 0.012 | 0.003 ± 0.004 |
| K+ | 0.146 ± 0.104 | 0.089 ± 0.103 |
| Mg2+ | 0.045 ± 0.034 | 0.019 ± 0.020 |
| Ca2+ | 1.315 ± 0.037 | 0.609 ± 0.422 |
| Emission Sources | Trace Carbonaceous Components | References |
|---|---|---|
| carbon plant | EC1, EC2 | this study |
| biomass burning | OC1 | [19,20,21,22] |
| coal combustion | OC1, OC2, EC2 | [19,20,22] |
| motor vehicle | OC1, OP, EC1, EC2, EC3 | [19,20] |
| construction machinery | EC2 | [20] |
| catering industry | OC2, OC3 | [20,21] |
| diesel vehicle | EC2 | [23] |
Publisher’s Note: MDPI stays neutral with regard to jurisdictional claims in published maps and institutional affiliations. |
© 2022 by the authors. Licensee MDPI, Basel, Switzerland. This article is an open access article distributed under the terms and conditions of the Creative Commons Attribution (CC BY) license (https://creativecommons.org/licenses/by/4.0/).
Share and Cite
Li, S.; Liang, D.; Wu, J. Study on the Source Profile Characteristics of Carbon Plant. Atmosphere 2022, 13, 969. https://doi.org/10.3390/atmos13060969
Li S, Liang D, Wu J. Study on the Source Profile Characteristics of Carbon Plant. Atmosphere. 2022; 13(6):969. https://doi.org/10.3390/atmos13060969
Chicago/Turabian StyleLi, Sen, Danni Liang, and Jianhui Wu. 2022. "Study on the Source Profile Characteristics of Carbon Plant" Atmosphere 13, no. 6: 969. https://doi.org/10.3390/atmos13060969
APA StyleLi, S., Liang, D., & Wu, J. (2022). Study on the Source Profile Characteristics of Carbon Plant. Atmosphere, 13(6), 969. https://doi.org/10.3390/atmos13060969