
Reconstructed Centennial Mass Balance Change for Golubin Glacier, Northern Tien Shan

 , ,
, , 
Abstract
:1. Introduction
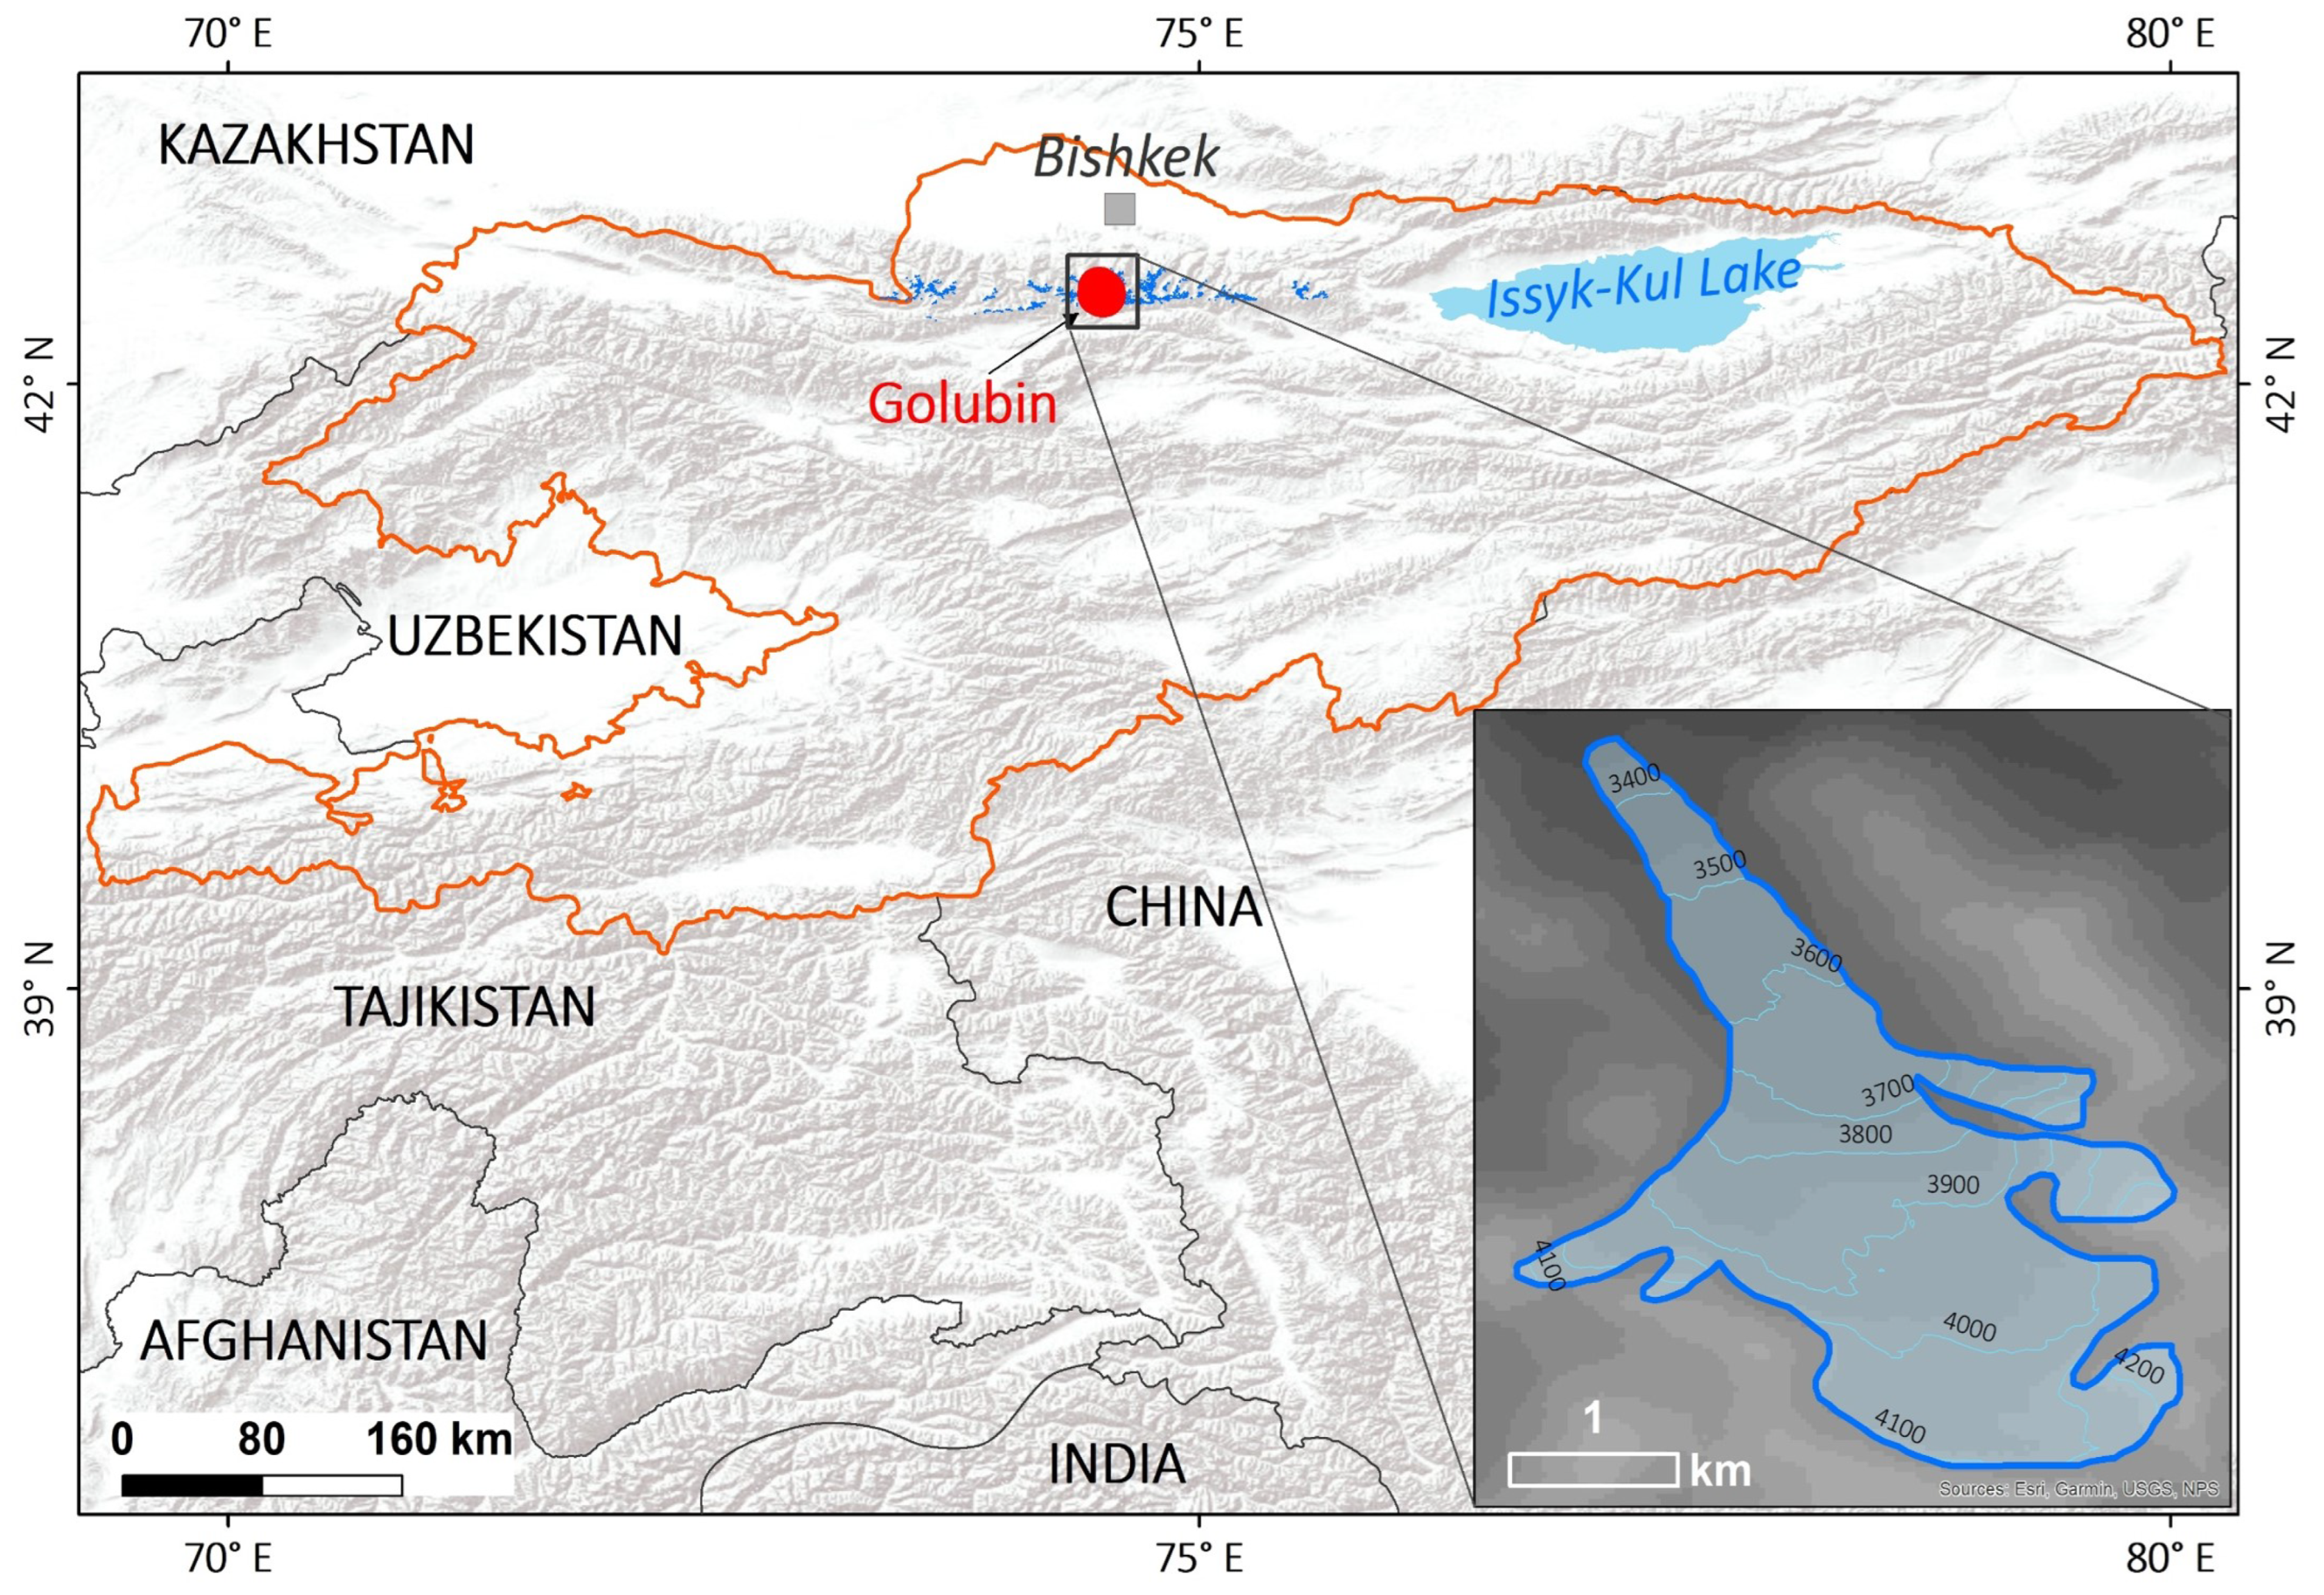
2. Study Area and Data
3. Methods
3.1. Secular Mass Balances from Glacier Length Changes
3.2. ERA20C Reanalysis Data Time Series from 1900 to Present
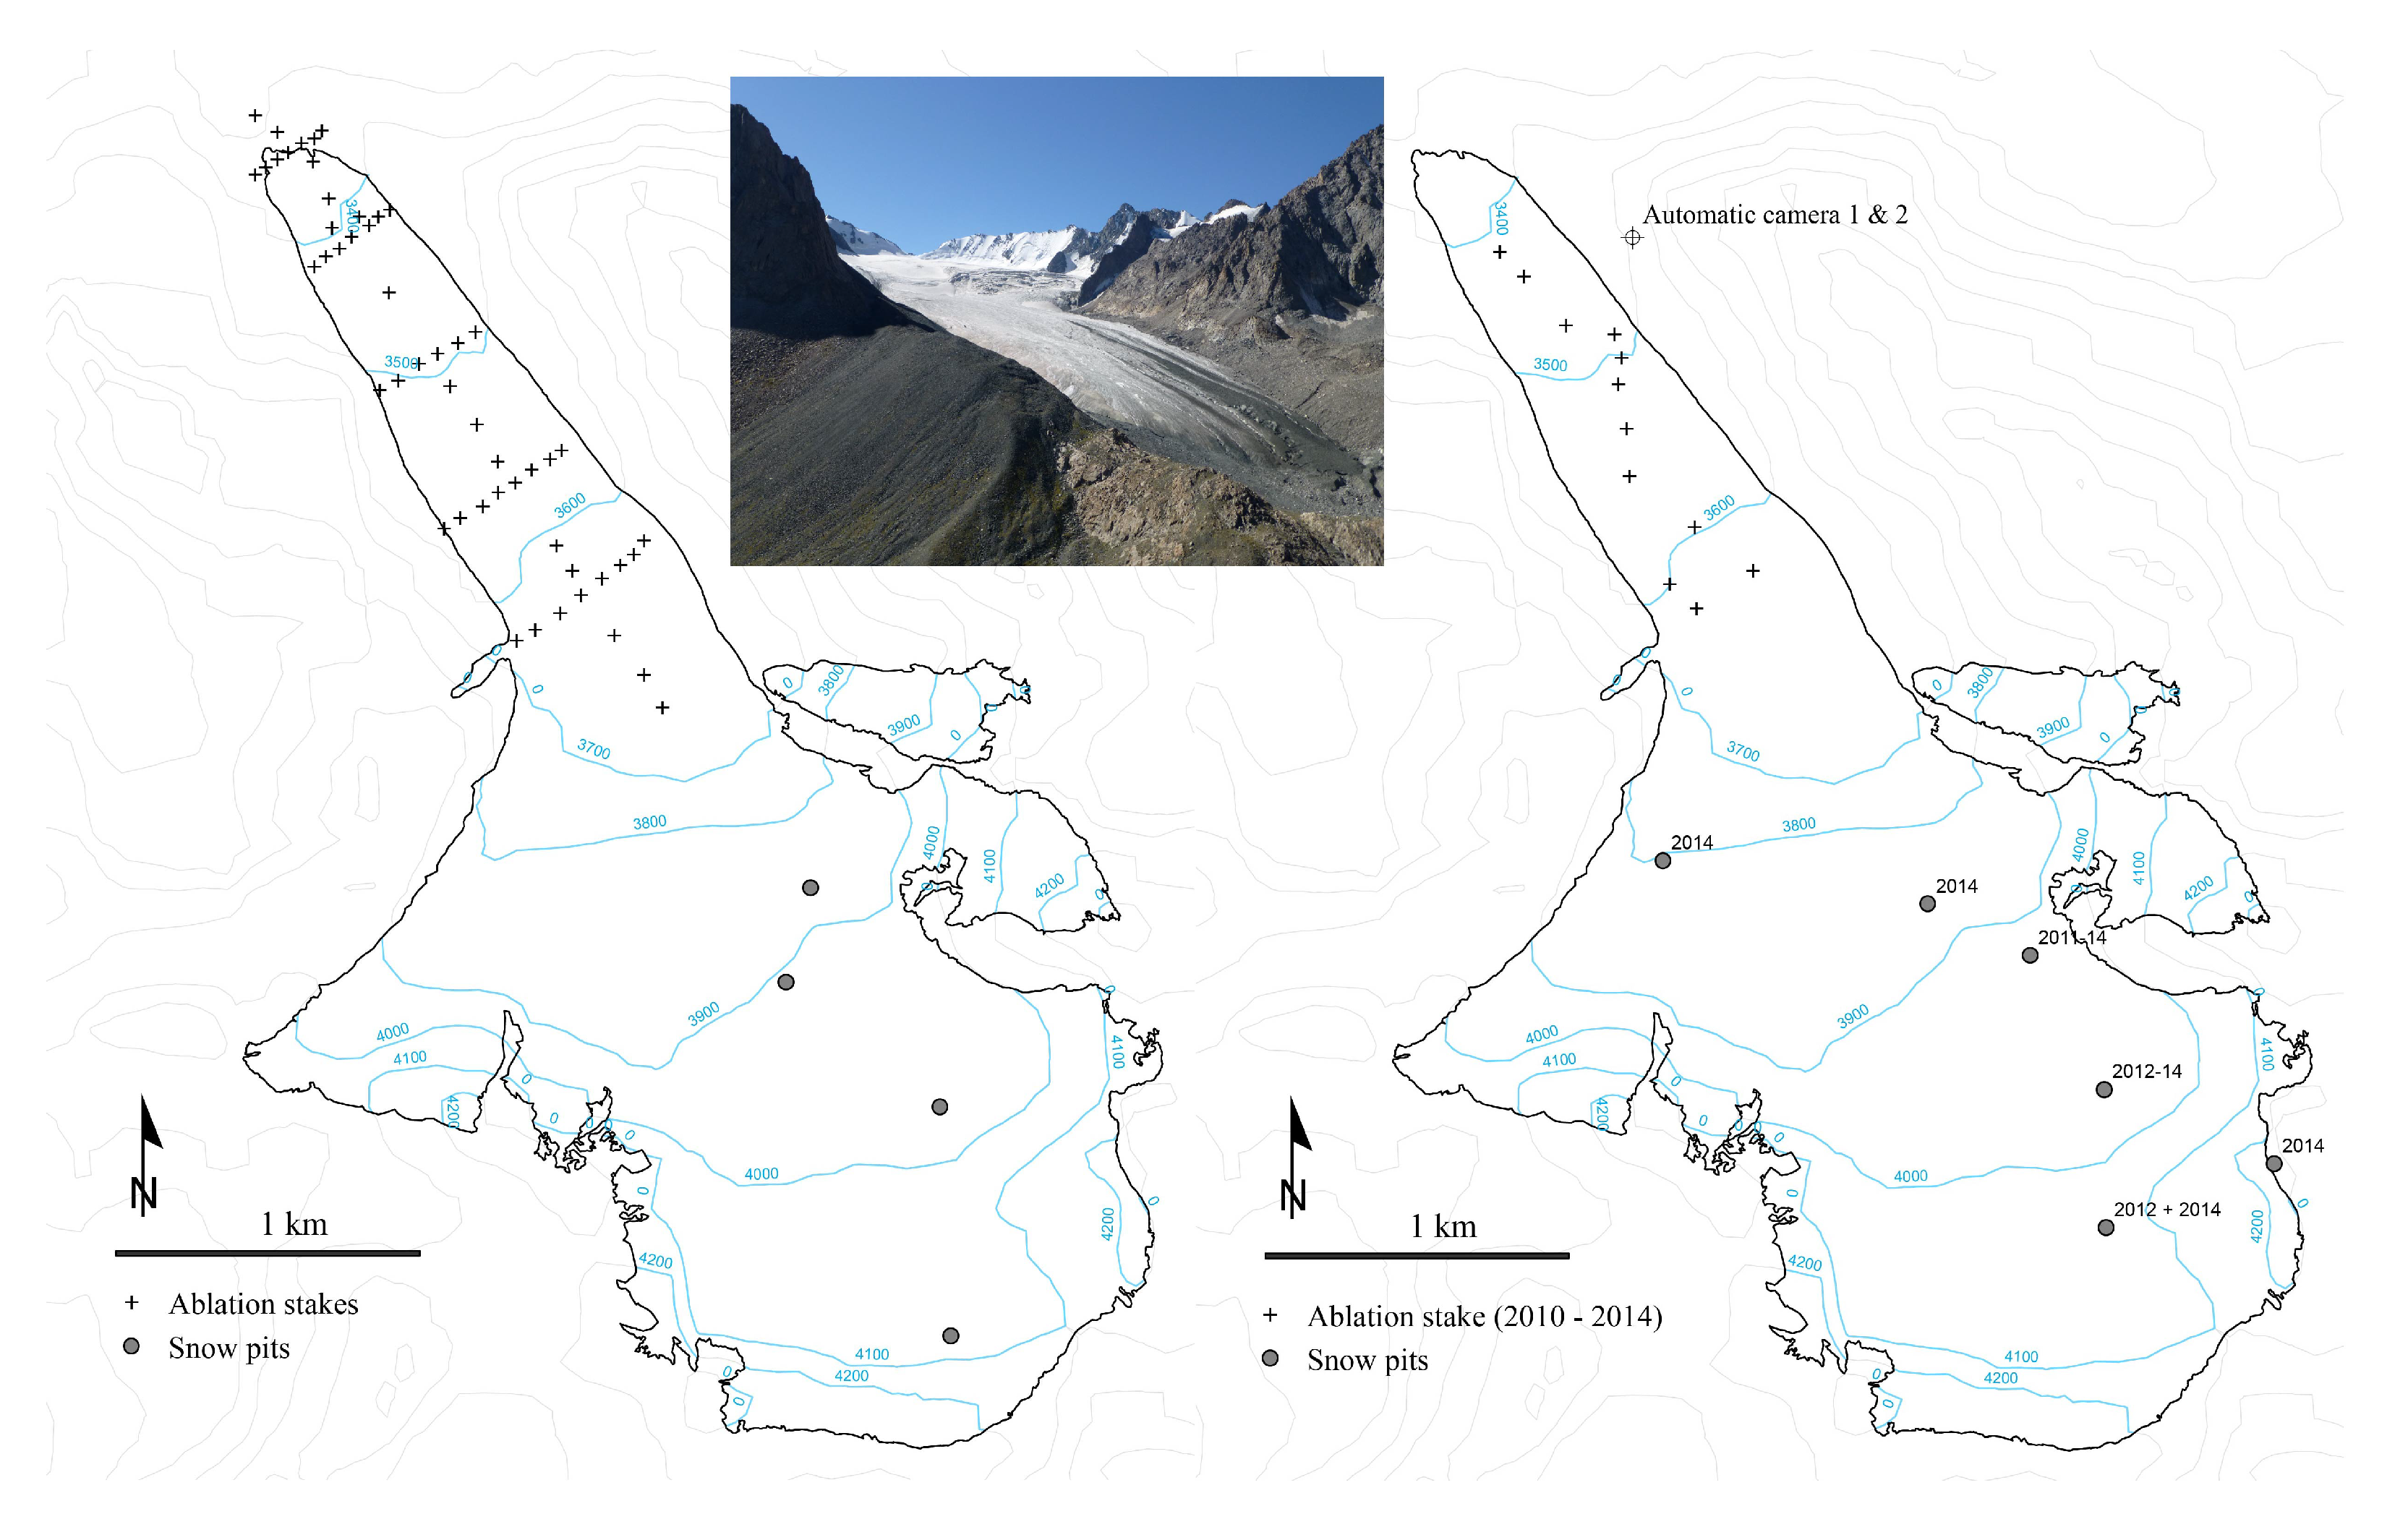
3.3. Glaciological Measurements from 2011 to Present
3.4. Surface Mass Balance Model
3.5. Model Calibration and Validation
3.6. Model Mass Balance Uncertainty
4. Results
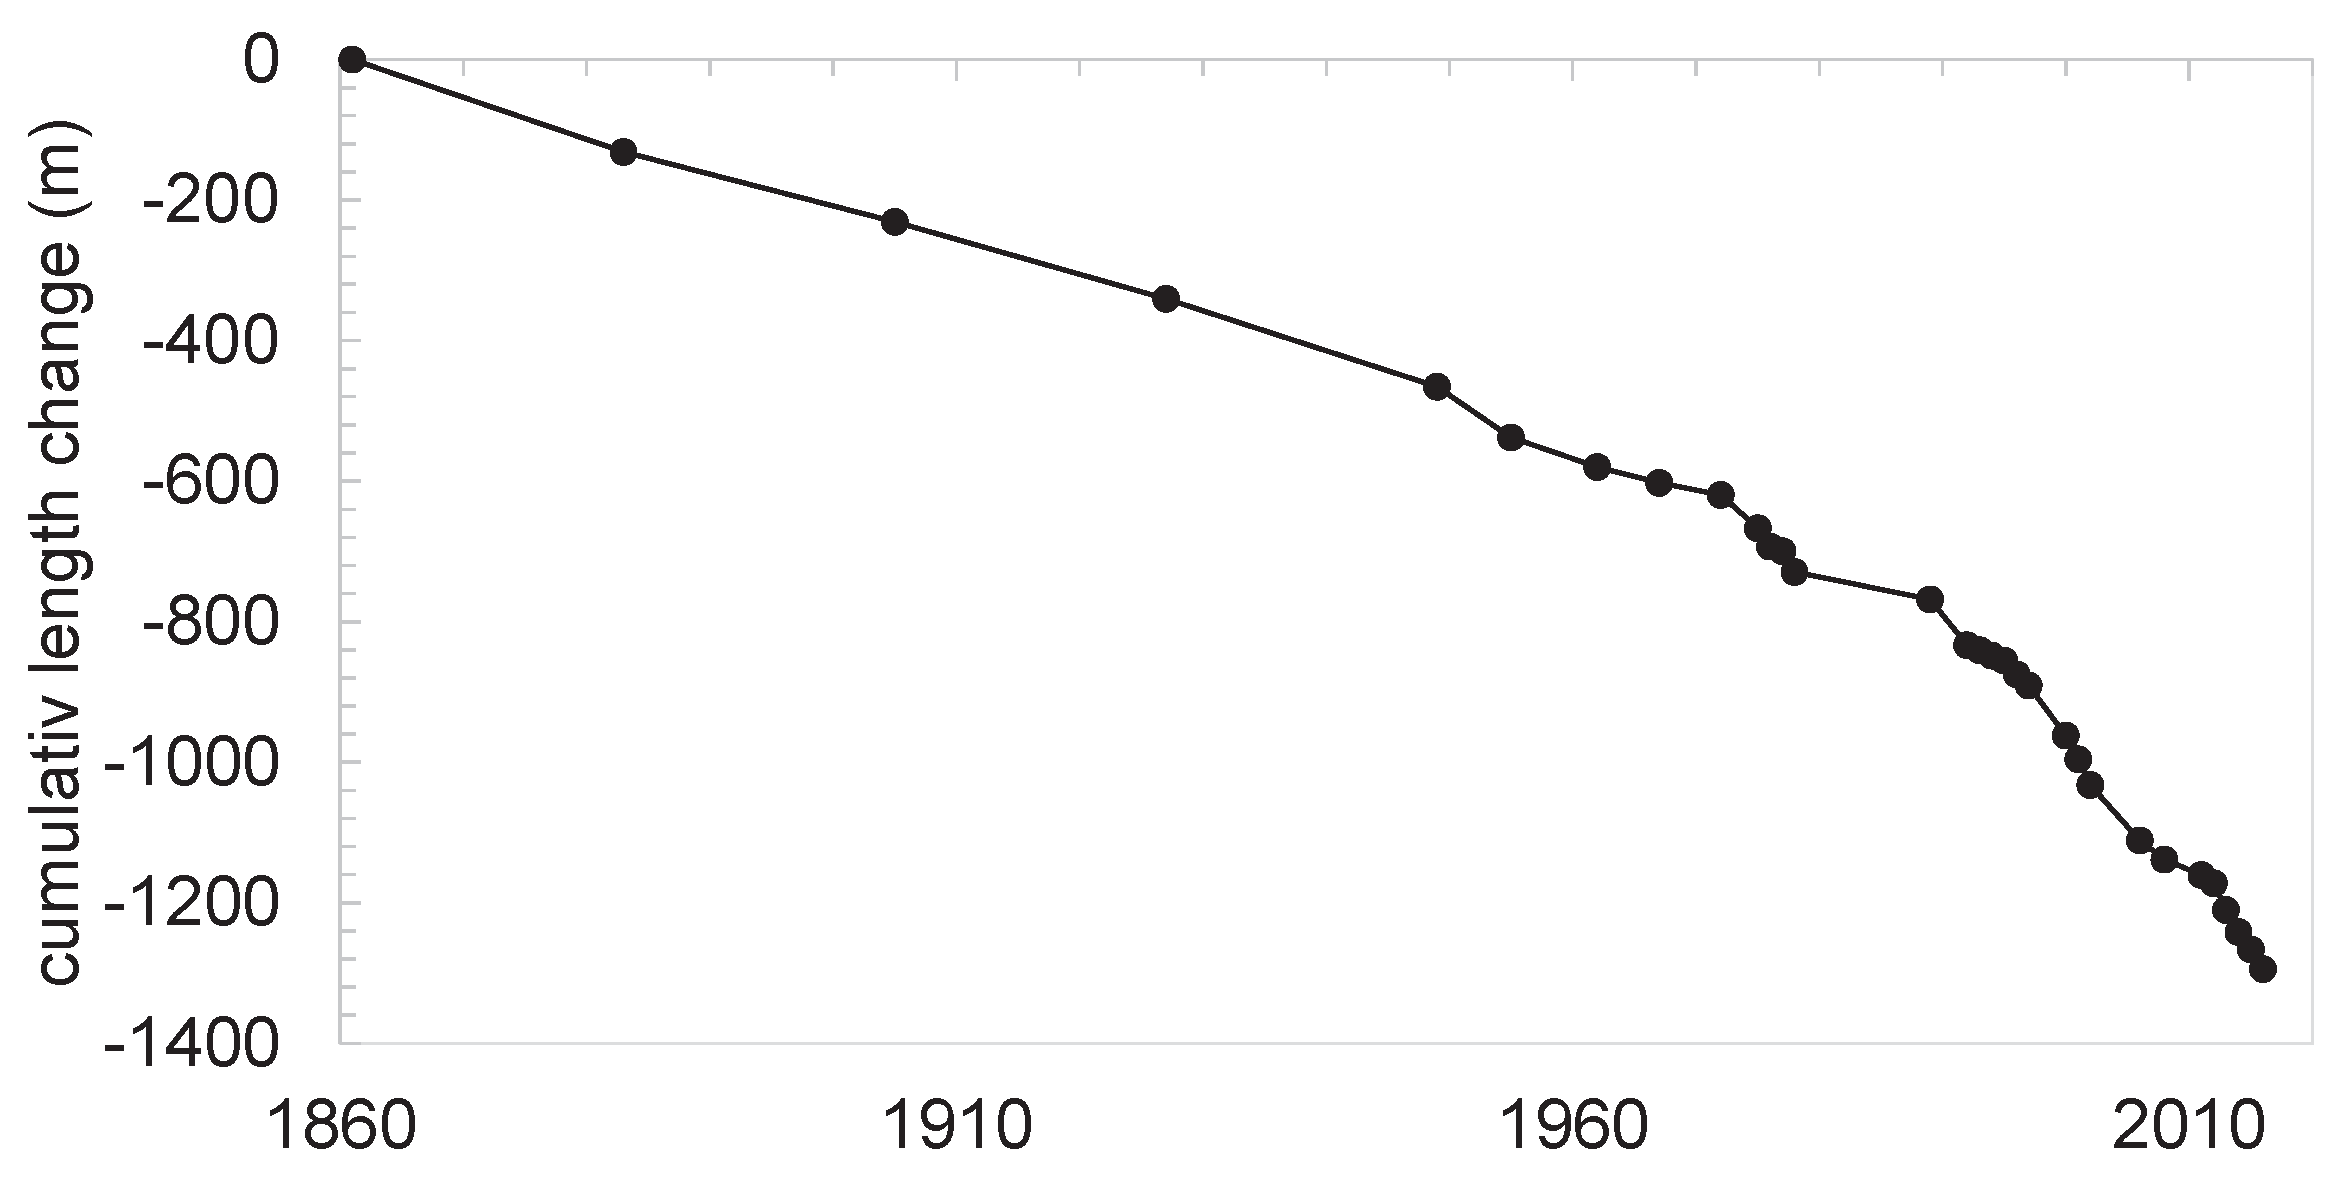
4.1. Length Change
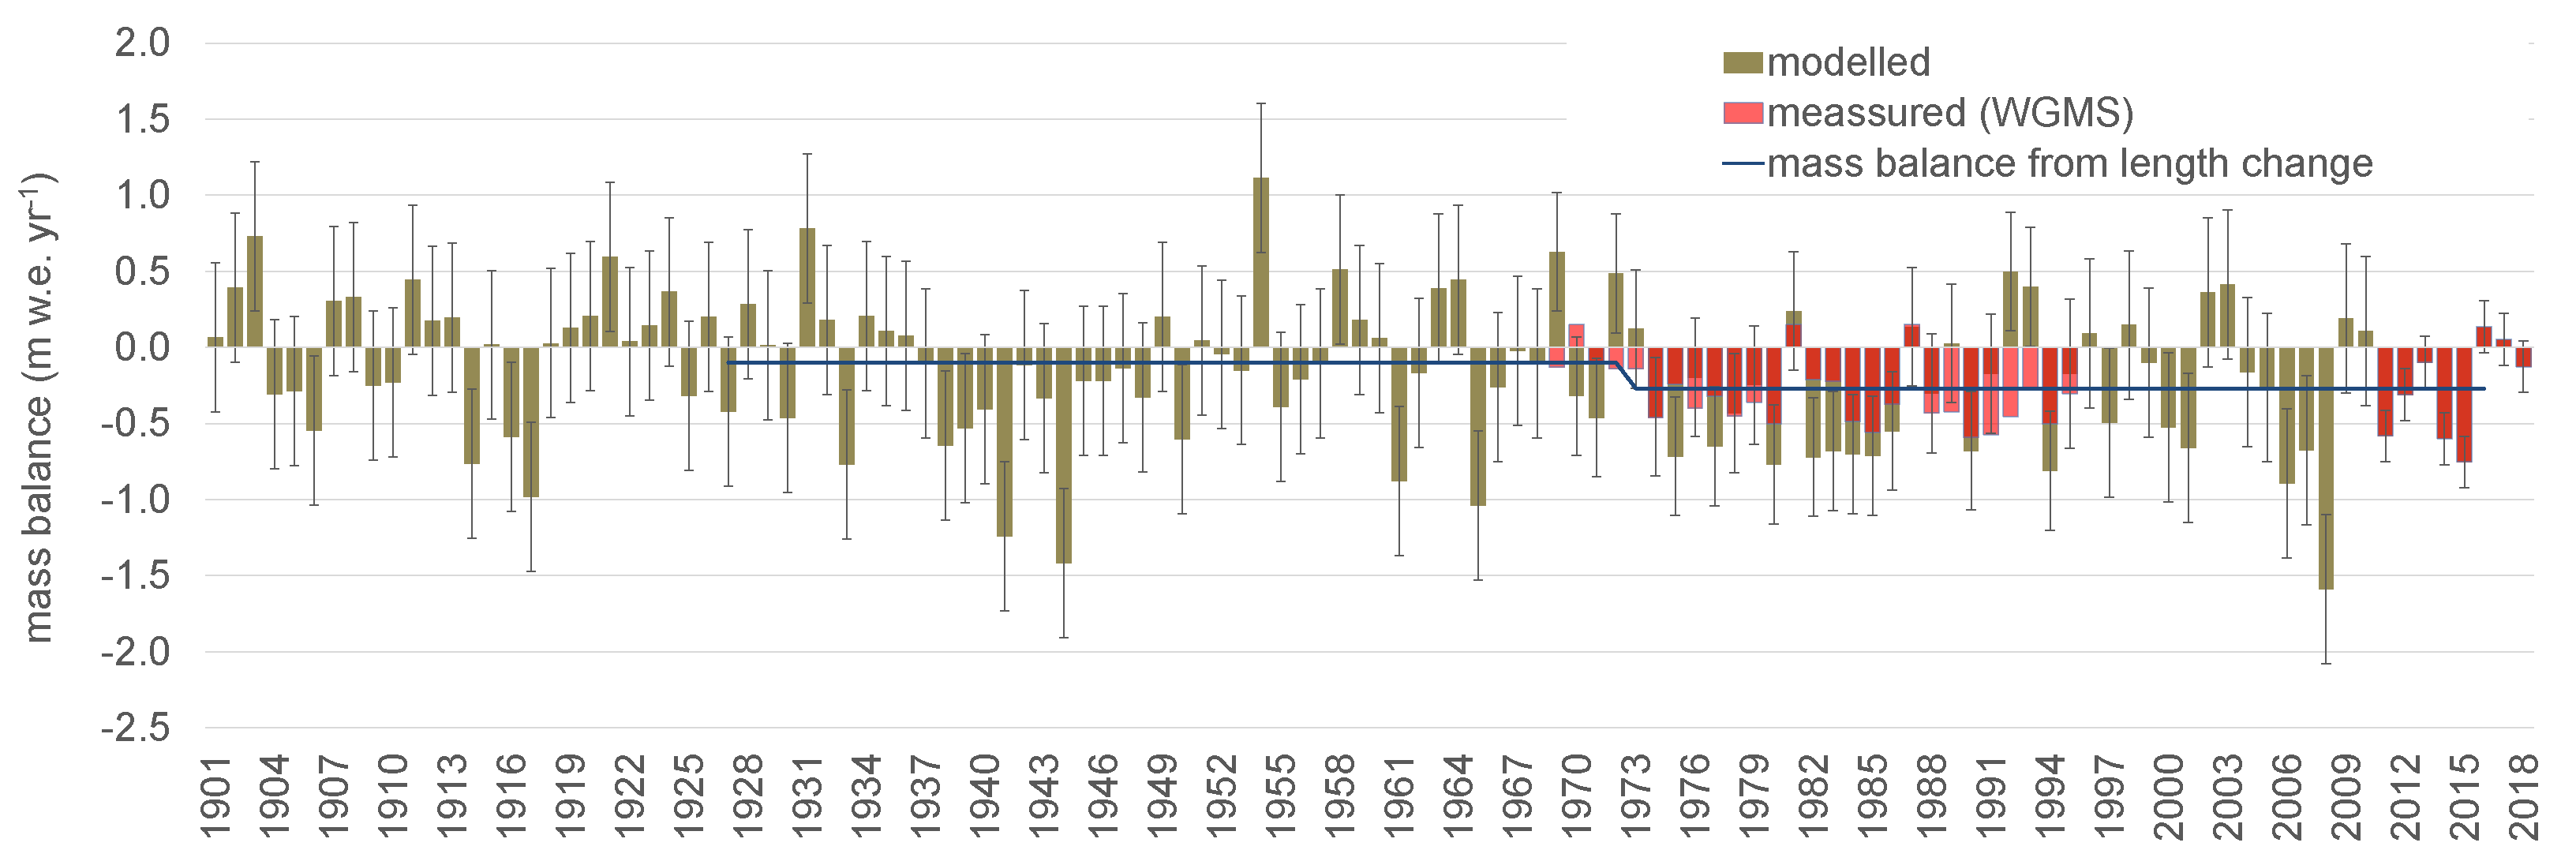
4.2. Observed and Modeled Mass Balance Time Series
4.3. Mass Balance Time Series Based on Length Change Observations
5. Discussion
5.1. First Centennial Mass Balance Time Series for Golubin Glacier
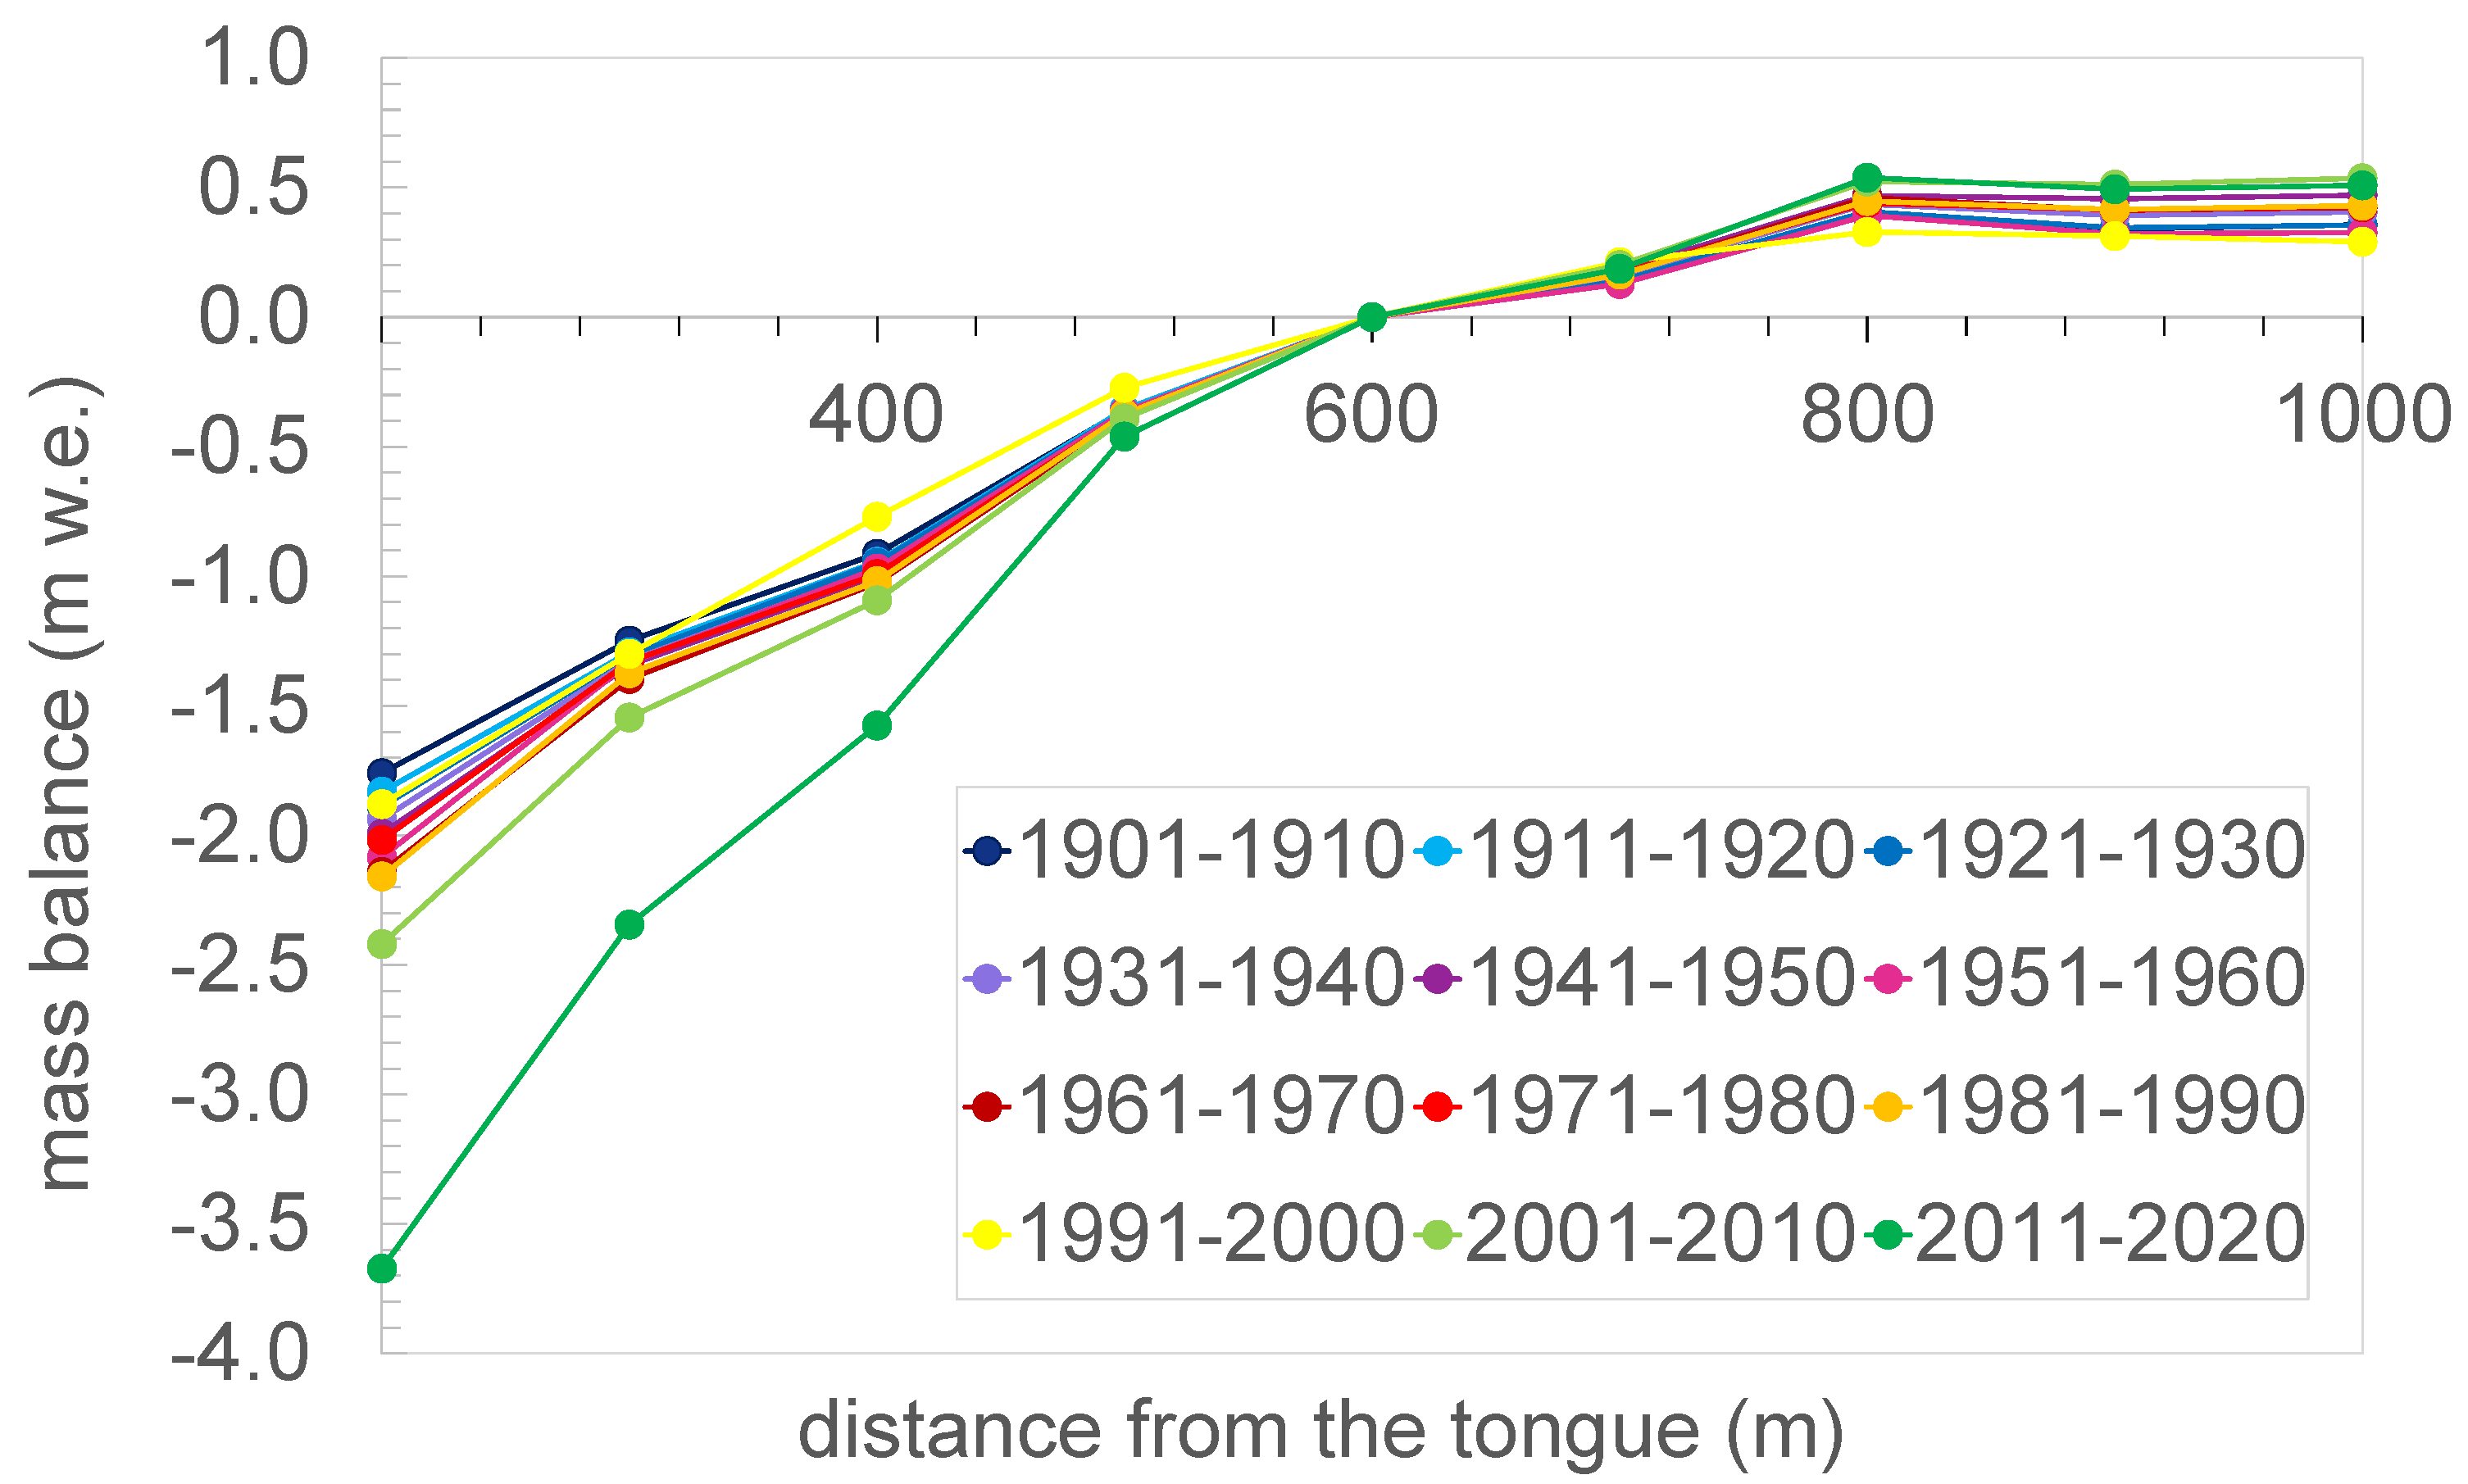
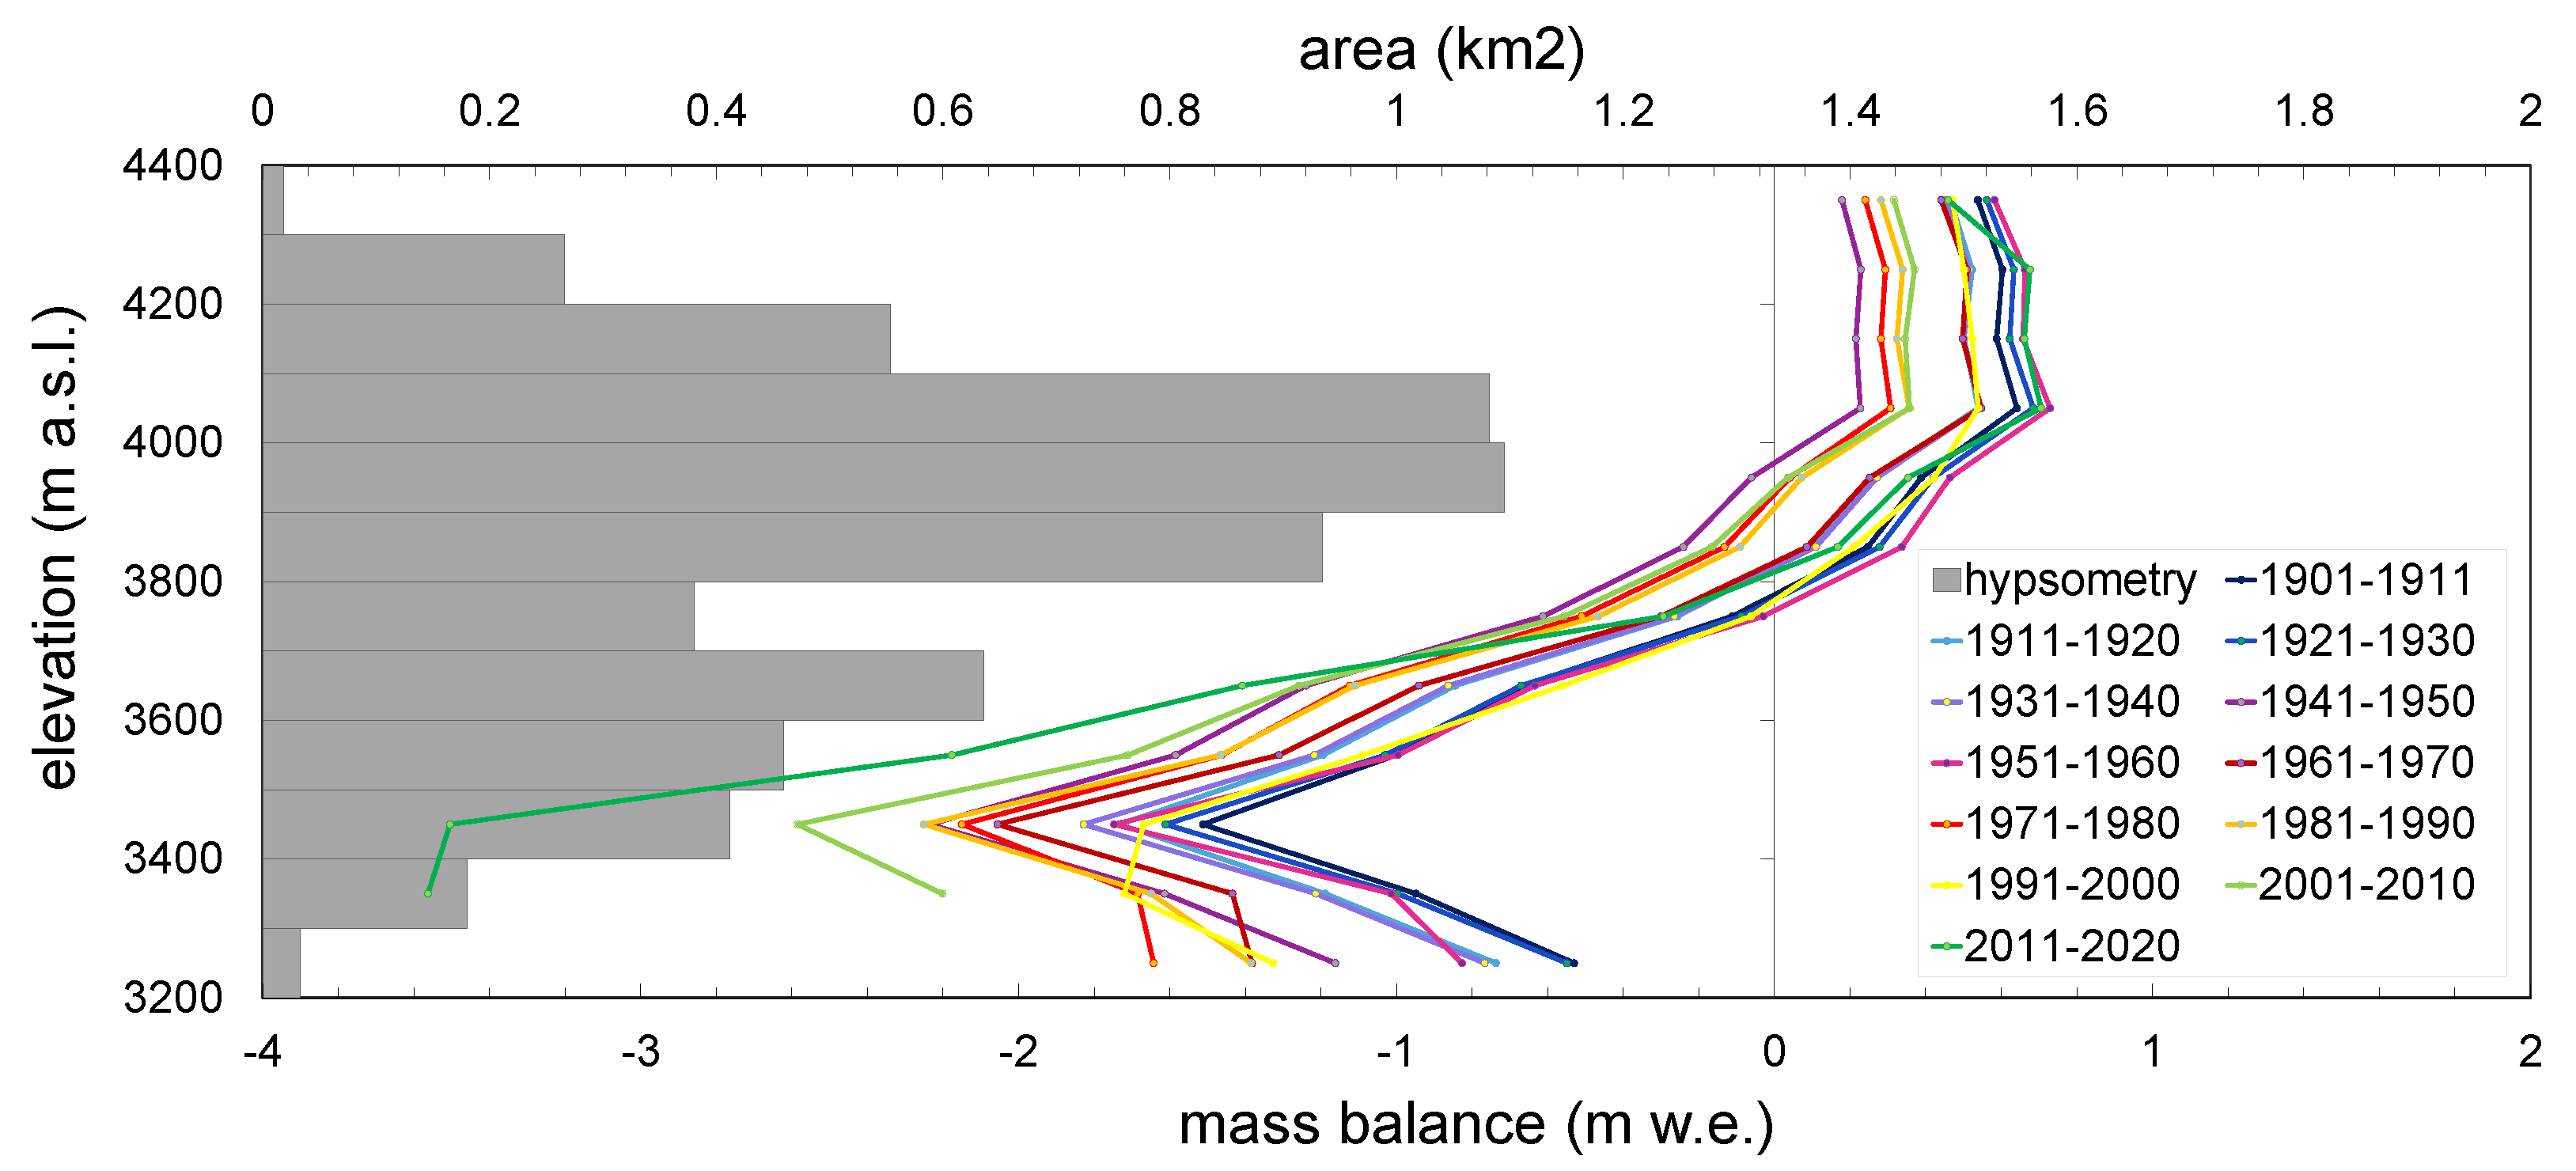
5.2. Changes in Mass Balance Gradient
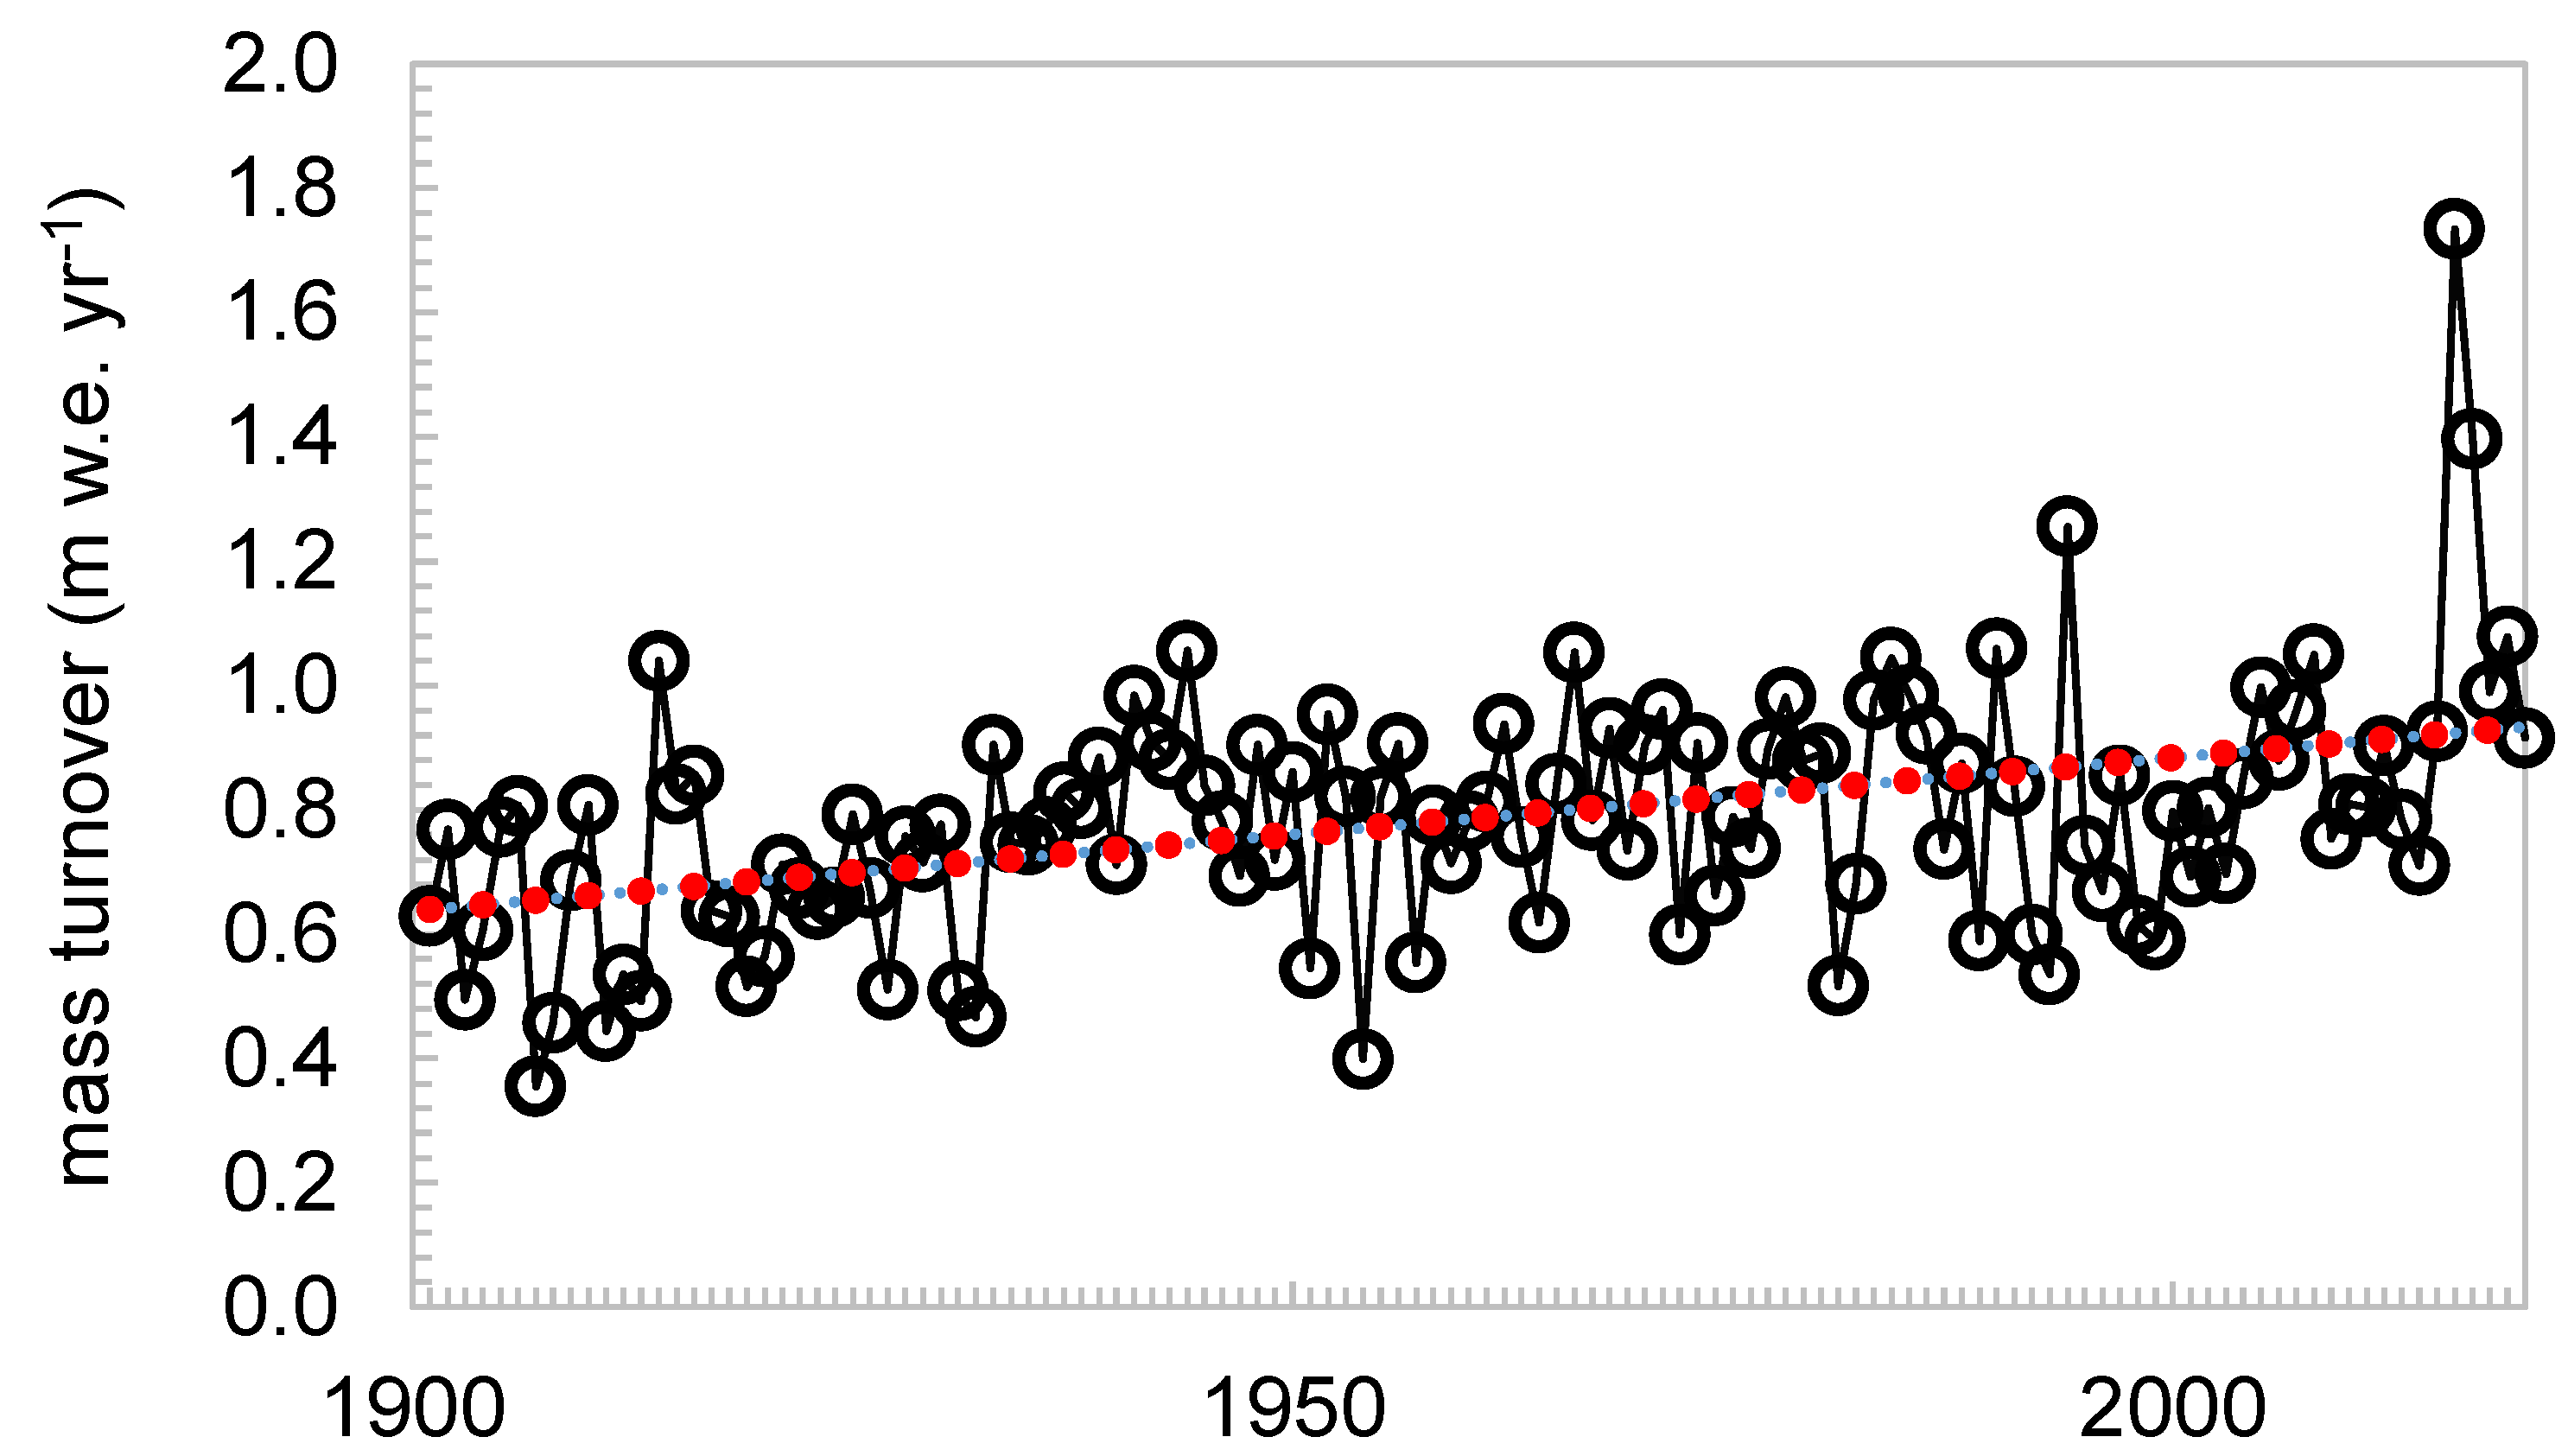
5.3. Mass Balance Variability
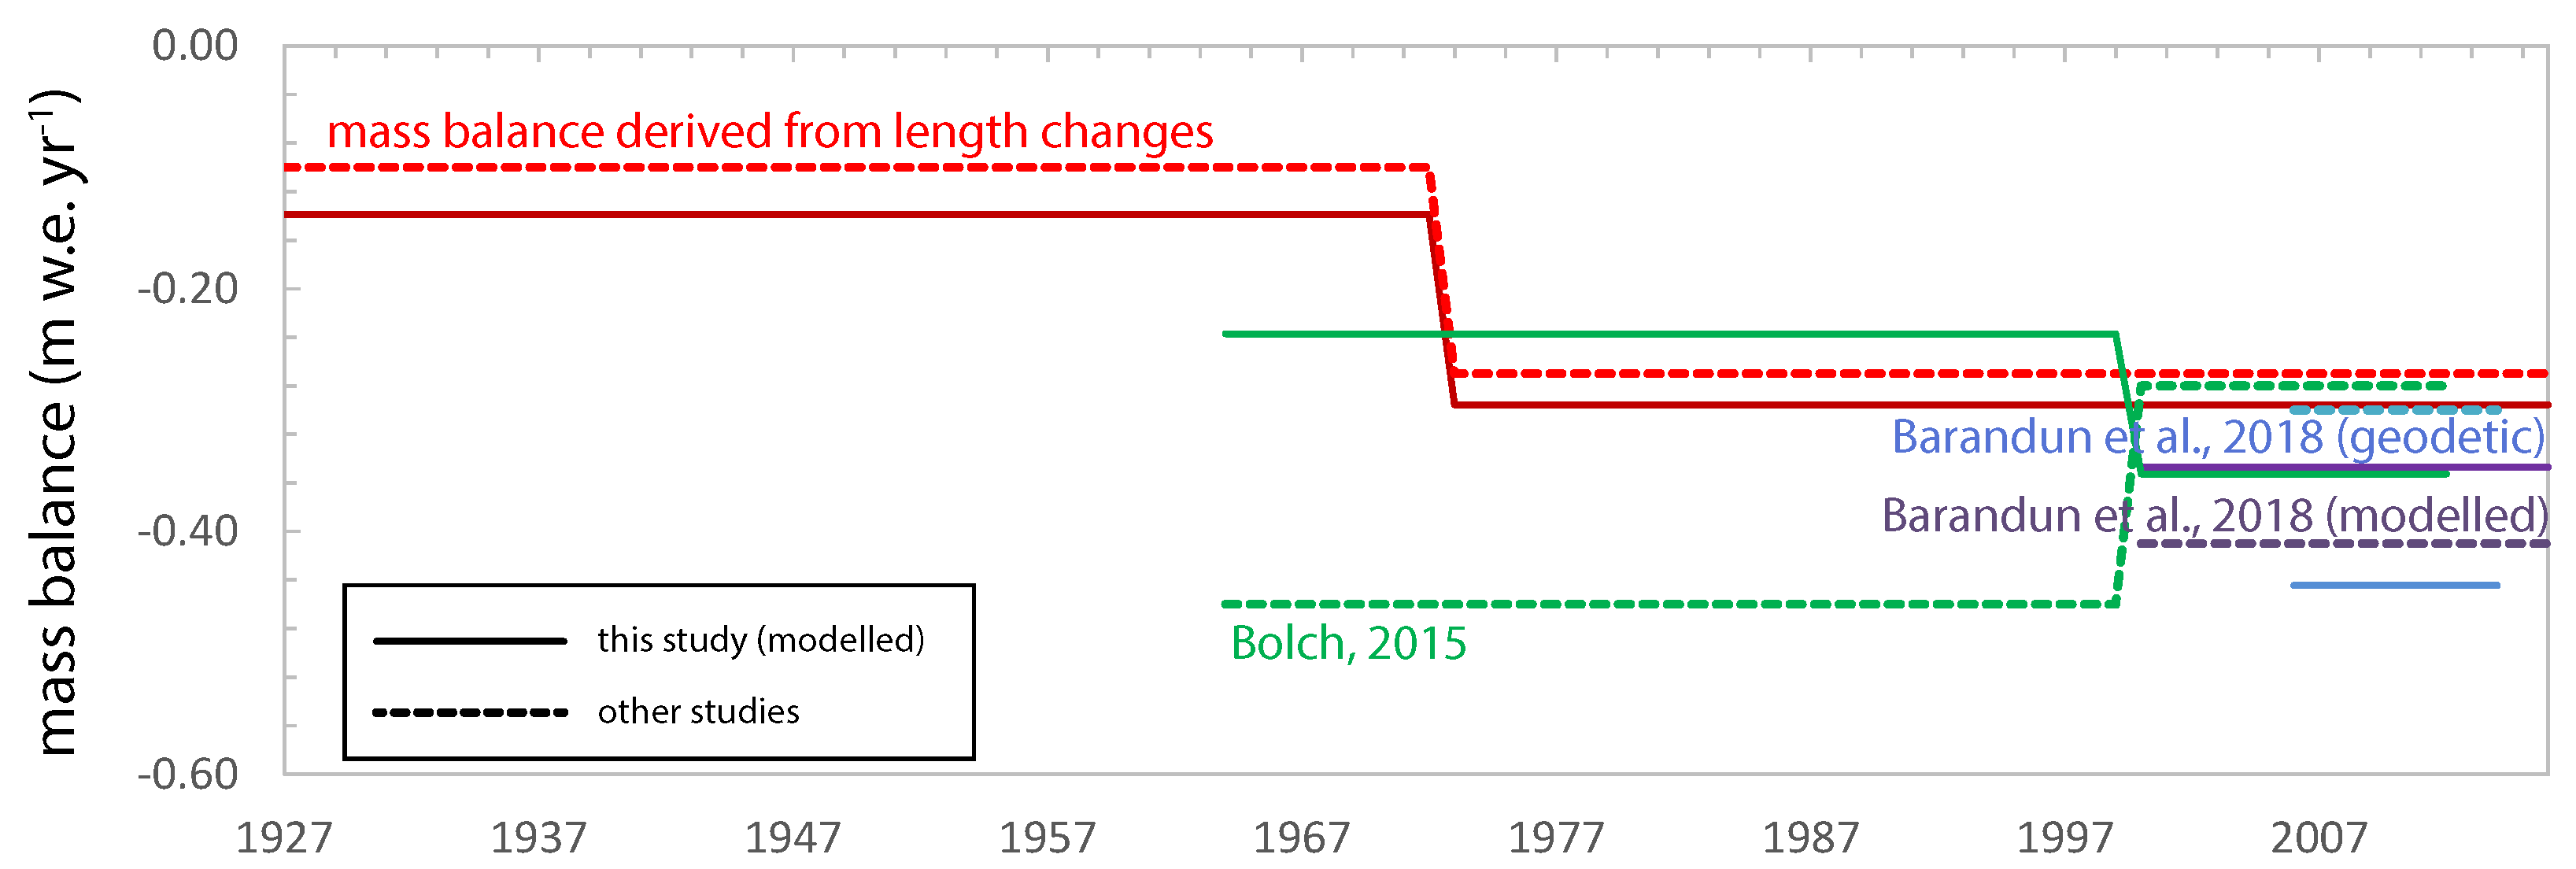
5.4. Comparison with Other Mass Balance Estimates for Tien Shan and Pamir
5.5. Limitations
6. Conclusions
Author Contributions
Funding
Institutional Review Board Statement
Informed Consent Statement
Data Availability Statement
Conflicts of Interest
References
- Aizen, V.B.; Kuzmichenok, V.A.; Surazakov, A.B.; Aizen, E.M. Glacier changes in the central and northern Tien Shan during the last 140 years based on surface and remote-sensing data. Ann. Glaciol. 2006, 43, 202–213. [Google Scholar] [CrossRef]
- Sorg, A.; Huss, M.; Rohrer, M.; Stoffel, M. The days of plenty might soon be over in glacierized Central Asian catchments. Environ. Res. Lett. 2014, 9, 4018. [Google Scholar] [CrossRef]
- Farinotti, D.; Longuevergne, L.; Moholdt, G.; Duethmann, D.; Mölg, T.; Bolch, T.; Vorogushyn, S.; Güntner, A. Substantial glacier mass loss in the Tien Shan over the past 50 years. Nat. Geosci. 2015, 8, 716–722. [Google Scholar] [CrossRef]
- Barandun, M.; Fiddes, J.; Scherler, M.; Mathys, T.; Saks, T.; Petrakov, D.; Hoelzle, M. The state and future of the cryosphere in Central Asia. Water Secur. 2020, 11, 100072. [Google Scholar] [CrossRef]
- Saks, T.; Pohl, E.; Machguth, H.; Dehecq, A.; Barandun, M.; Kenzhebaev, R.; Kalashnikova, O.; Hoelzle, M. Glacier Runoff Variation Since 1981 in the Upper Naryn River Catchments, Central Tien Shan. Front. Environ. Sci. 2022, 9. [Google Scholar] [CrossRef]
- Varis, O. Resources: Curb vast water use in central Asia. Nat. News 2014, 514, 27. [Google Scholar] [CrossRef]
- Kaser, G.; Grosshauser, M. The contribution potential of glaciers to Himalaya river runoff. EGU Gen. Assem. Conf. Abstr. 2010, 12, 10962. [Google Scholar]
- Huss, M.; Hock, R. Global-scale hydrological response to future glacier mass loss. Nat. Clim. Change 2018, 8, 1. [Google Scholar] [CrossRef]
- Zemp, M.; Huss, M.; Thibert, E.; Eckert, N.; McNabb, R.; Huber, J.; Barandun, M.; Machguth, H.; Nussbaumer, S.U.; Gärtner-Roer, I.; et al. Global glacier mass changes and their contributions to sea-level rise from 1961 to 2016. Nature 2019, 568, 382–386. [Google Scholar] [CrossRef]
- Barandun, M.; Pohl, E.; Naegeli, K.; McNabb, R.; Huss, M.; Berthier, E.; Saks, T.; Hoelzle, M. Hot spots of glacier mass balance variability in Central Asia. Geophys. Res. Lett. 2021, 48, e2020GL092084. [Google Scholar] [CrossRef]
- Shean, D.; Bhushan, S.; Montesano, P.; Rounce, D.R.; Arendt, A.; Osmanoğlu, B. A systematic, regional assessment of high mountain Asia glacier mass balance. Front. Earth Sci. 2020, 7, 363. [Google Scholar] [CrossRef]
- Barandun, M.; Huss, M.; Sold, L.; Farinotti, D.; Azisov, E.; Salzmann, N.; Usubaliev, R.; Merkushkin, A.; Hoelzle, M. Re-analysis of seasonal mass balance at Abramov glacier 1968–2014. J. Glaciol. 2015, 61, 1103–1117. [Google Scholar] [CrossRef]
- Barandun, M.; Huss, M.; Usubaliev, R.; Azisov, E.; Berthier, E.; Kääb, A.; Bolch, T.; Hoelzle, M. Multi-decadal mass balance series of three Kyrgyz glaciers inferred from modelling constrained with repeated snow line observations. Cryosphere 2018, 12, 1899–1919. [Google Scholar] [CrossRef]
- Bolch, T. Glacier area and mass changes since 1964 in the Ala Archa Valley, Kyrgyz Ala-Too, northern Tien Shan. Lëd I Sneg 2015, 55, 28–39. [Google Scholar] [CrossRef]
- Brun, F.; Berthier, E.; Wagnon, P.; Kääb, A.; Treichler, D. A spatially resolved estimate of High Mountain Asia glacier mass balances, 2000–2016. Nat. Geosci. 2017, 10, 668. [Google Scholar] [CrossRef]
- Kenzhebaev, R.; Barandun, M.; Kronenberg, M.; Chen, Y.; Usubaliev, R.; Hoelzle, M. Mass balance observations and reconstruction for Batysh Sook Glacier, Tien Shan, from 2004 to 2016. Cold Reg. Sci. Technol. 2017, 135, 76–89. [Google Scholar] [CrossRef]
- Kronenberg, M.; Barandun, M.; Hoelzle, M.; Huss, M.; Farinotti, D.; Azisov, E.; Usubaliev, R.; Gafurov, A.; Petrakov, D.; Kääb, A. Mass-balance reconstruction for Glacier No. 354, Tien Shan, from 2003 to 2014. Ann. Glaciol. 2016, 57, 92–102. [Google Scholar] [CrossRef]
- Pritchard, H.D. Asia’s shrinking glaciers protect large populations from drought stress. Nature 2019, 569, 649–654. [Google Scholar] [CrossRef]
- Unger-Shayesteh, K.; Vorogushyn, S.; Farinotti, D.; Gafurov, A.; Duethmann, D.; Mandychev, A.; Merz, B. What do we know about past changes in the water cycle of Central Asian headwaters? A review. Glob. Planet. Chang. 2013, 110. [Google Scholar] [CrossRef]
- Hoelzle, M.; Azisov, E.; Barandun, M.; Huss, M.; Farinotti, D.; Gafurov, A.; Hagg, W.; Kenzhebaev, R.; Kronenberg, M.; Machguth, H.; et al. Re-establishing glacier monitoring in Kyrgyzstan and Uzbekistan, Central Asia. Geosci. Instrum. Methods Data Syst. 2017, 6, 397. [Google Scholar] [CrossRef]
- Hoelzle, M.; Barandun, M.; Bolch, T.; Fiddes, J.; Gafurov, A.; Muccione, V.; Saks, T.; Shahgedanova, M. The status and role of the alpine cryosphere in Central Asia. In The Aral Sea Basin; Taylor & Francis: Abingdon, UK, 2019. [Google Scholar]
- Huss, M.; Bauder, A.; Funk, M.; Hock, R. Determination of the seasonal mass balance of four Alpine glaciers since 1865. J. Geophys. Res. Earth Surf. 2008, 113. [Google Scholar] [CrossRef]
- Venukov, M. Ocherki Zailiiskogo kraya i Prichuiskoi strany [Essays of Zailiiski region and Prichuiskii country]. Izv. Russ. Geograf. Obshch. 1861, 4, 35–61. [Google Scholar]
- Aizen, V. Reconstruktiya balansa massy lednika Golubina [Golubin glacier mass balance reconstruction]. Mater. Glyatsiol. Issled 1988, 62, 119–126. [Google Scholar]
- WGMS. Fluctuations of Glaciers Database; World Glacier Monitoring Service: Zurich, Switzerland, 2021. [Google Scholar] [CrossRef]
- Schöne, T.; Zech, C.; Unger-Shayesteh, K.; Rudenko, V.; Thoss, H.; Wetzel, H.U.; Gafurov, A.; Illigner, J.; Zubovich, A. A new permanent multi-parameter monitoring network in Central Asian high mountains—From measurements to data bases. Geosci. Instrum. Methods Data Syst. 2013, 2, 97–111. [Google Scholar] [CrossRef]
- Hole-Filled SRTM for the Globe Version 4. CGIAR-CSI SRTM 90m Database. 2008. Available online: http://srtm.csi.cgiar.org/ (accessed on 12 April 2022).
- Paul, F.; Barrand, N.E.; Baumann, S.; Berthier, E.; Bolch, T.; Casey, K.; Frey, H.; Joshi, S.; Konovalov, V.; Le Bris, R.; et al. On the accuracy of glacier outlines derived from remote-sensing data. Ann. Glaciol. 2013, 54, 171–182. [Google Scholar] [CrossRef]
- Poli, P.; Hersbach, H.; Dee, D.P.; Berrisford, P.; Simmons, A.J.; Vitart, F.; Laloyaux, P.; Tan, D.G.; Peubey, C.; Thépaut, J.N.; et al. ERA-20C: An atmospheric reanalysis of the twentieth century. J. Clim. 2016, 29. [Google Scholar] [CrossRef]
- Hoelzle, M.; Haeberli, W.; Dischl, M.; Peschke, W. Secular glacier mass balances derived from cumulative glacier length changes. Glob. Planet. Chang. 2003, 36, 295–306. [Google Scholar] [CrossRef]
- Jóhannesson, T.; Raymond, C.; Waddington, E. A simple method for determining the response time of glaciers. In Glacier Fluctuations and Climatic Change; Springer: Berlin/Heidelberg, Germany, 1989; pp. 343–352. [Google Scholar]
- Van Tricht, L.; Huybrechts, P.; Van Breedam, J.; Fürst, J.J.; Rybak, O.; Satylkanov, R.; Ermenbaiev, B.; Popovnin, V.; Neyns, R.; Paice, C.M.; et al. Measuring and inferring the ice thickness distribution of four glaciers in the Tien Shan, Kyrgyzstan. J. Glaciol. 2021, 67, 269–286. [Google Scholar] [CrossRef]
- Huss, M.; Bauder, A.; Funk, M. Homogenization of long-term mass-balance time series. Ann. Glaciol. 2009, 50, 198–206. [Google Scholar] [CrossRef]
- Hock, R. A distributed temperature-index ice- and snowmelt model including potential direct solar radiation. J. Glaciol. 1999, 45. [Google Scholar] [CrossRef]
- Aizen, V.B.; Aizen, E.M.; Melack, J.M. Climate, snow cover, glaciers, and runoff in the Tien Shan, central Asia. JAWRA J. Am. Water Resour. Assoc. 1995, 31, 1113–1129. [Google Scholar] [CrossRef]
- Mann, H.B. Nonparametric tests against trend. Econom. J. Econom. Soc. 1945, 13, 245–259. [Google Scholar] [CrossRef]
- Kendall, M.G. Rank Correlation Methods; Hodder Arnold: London, UK, 1975. [Google Scholar]
- Hagg, W.; Mayer, C.; Lambrecht, A.; Kriegel, D.; Azizov, E. Glacier changes in the Big Naryn basin, Central Tian Shan. Glob. Planet. Chang. 2013, 110, 40–50. [Google Scholar] [CrossRef]
- Kronenberg, M.; van Pelt, W.; Machguth, H.; Fiddes, J.; Hoelzle, M.; Pertziger, F. Long-term firn and mass balance modelling for Abramov glacier, Pamir Alay. Cryosphere Discuss. 2022, 1–33. [Google Scholar] [CrossRef]
- Rasmussen, L. Meteorological controls on glacier mass balance in High Asia. Ann. Glaciol. 2013, 54, 352–359. [Google Scholar] [CrossRef]
- Aizen, V.B.; Zakharov, V. Mass Balance and Ice Flow Velocity of Davydov Glacier Basing on Research in 1984–1985. Data Glaciol. Stud. 1989, 67, 197–202. [Google Scholar]
- Ushnurtsev, S. Mass balance fluctuations of the Sary-Tor glacier in inner Tien Shan and its reconstruction for the period 1930–1988. Data Glaciol. Stud 1991, 71, 70–79. [Google Scholar]
- Van Tricht, L.; Paice, C.M.; Rybak, O.; Satylkanov, R.; Popovnin, V.; Solomina, O.; Huybrechts, P. Reconstruction of the Historical (1750–2020) Mass Balance of Bordu, Kara-Batkak and Sary-Tor Glaciers in the Inner Tien Shan, Kyrgyzstan. Front. Earth Sci. 2021, 9. [Google Scholar] [CrossRef]
- Dyurgerov, M.; Dwyer, J. ABHANDLUNGEN—The steepening of glacier mass balance gradients with northern hemispere warming. With 6 figures. Z. Gletscherkunde Glazialgeol. 2000, 36, 107–118. [Google Scholar]
- Kuhn, M. Sea level, ice and climatic change: Proceedings of the symposium held 7-8 Dec. 1978. In Climate and Glaciers; Allison, I., Ed.; International Association of Hydrological Sciences: Wallingford, UK, 1980; Volume 131, pp. 3–20. [Google Scholar]
- Kuhn, M. Mass budget imbalances as criterion for a climatic classification of glaciers. Geogr. Ann. Ser. A Phys. Geogr. 1984, 66, 229–238. [Google Scholar] [CrossRef]
- Meier, M.F.; Dyurgerov, M.B.; McCabe, G.J. The health of glaciers: Recent changes in glacier regime. Clim. Chang. 2003, 59, 123–135. [Google Scholar] [CrossRef]
- Dyurgerov, M.B.; Meier, M.F. Twentieth century climate change: Evidence from small glaciers. Proc. Natl. Acad. Sci. USA 2000, 97, 1406–1411. [Google Scholar] [CrossRef] [PubMed]
- Oerlemans, J. Glaciers and Climate Change: A Meteorologist’s View; Balkema Publishers: Lisse, The Netherlands, 2001. [Google Scholar]
- Wang, R.; Liu, S.; Shangguan, D.; Radić, V.; Zhang, Y. Spatial heterogeneity in glacier mass-balance sensitivity across High Mountain Asia. Water 2019, 11, 776. [Google Scholar] [CrossRef]
- Hugonnet, R.; McNabb, R.; Berthier, E.; Menounos, B.; Nuth, C.; Girod, L.; Farinotti, D.; Huss, M.; Dussaillant, I.; Brun, F.; et al. A globally complete, spatiotemporally resolved estimate of glacier mass change from 2000 to 2019. Nature 2021, 592, 726–731. [Google Scholar] [CrossRef]
- Kapitsa, V.; Shahgedanova, M.; Severskiy, I.; Kasatkin, N.; White, K.; Usmanova, Z. Assessment of Changes in Mass Balance of the Tuyuksu Group of Glaciers, Northern Tien Shan, Between 1958 and 2016 Using Ground-Based Observations and Pléiades Satellite Imagery. Front. Earth Sci. 2020, 8, 259. [Google Scholar] [CrossRef]
- Shea, J.; Menounos, B.; Moore, R.D.; Tennant, C. Regional estimates of glacier mass change from MODIS-derived equilibrium line altitudes. Cryosphere Discuss. 2012, 6, 3757–3780. [Google Scholar]
- Kääb, A.; Treichler, D.; Nuth, C.; Berthier, E. Brief Communication: Contending estimates of 2003–2008 glacier mass balance over the Pamir–Karakoram–Himalaya. Cryosphere 2015, 9, 557–564. [Google Scholar] [CrossRef]
- Hagg, W.J.; Braun, L.N.; Uvarov, V.N.; Makarevich, K.G. A comparison of three methods of mass-balance determination in the Tuyuksu glacier region, Tien Shan, Central Asia. J. Glaciol. 2004, 50, 505–510. [Google Scholar] [CrossRef]
- Denzinger, F.; Machguth, H.; Barandun, M.; Berthier, E.; Girod, L.; Kronenberg, M.; Usubaliev, R.; Hoelzle, M. Geodetic mass balance of Abramov Glacier from 1975 to 2015. J. Glaciol. 2021, 67, 331–342. [Google Scholar] [CrossRef]
- Kronenberg, M.; Machguth, H.; Eichler, A.; Schwikowski, M.; Hoelzle, M. Comparison of historical and recent accumulation rates on Abramov Glacier, Pamir Alay. J. Glaciol. 2021, 67, 253–268. [Google Scholar] [CrossRef]
- Maussion, F.; Scherer, D.; Mölg, T.; Collier, E.; Curio, J.; Finkelnburg, R. Precipitation seasonality and variability over the Tibetan Plateau as resolved by the High Asia Reanalysis. J. Clim. 2014, 27, 1910–1927. [Google Scholar] [CrossRef]
- Pereira-Cardenal, S.; Riegels, N.; Berry, P.; Smith, R.; Yakovlev, A.; Siegfried, T.; Bauer-Gottwein, P. Real-time remote sensing driven river basin modeling using radar altimetry. Hydrol. Earth Syst. Sci. 2011, 15, 241–254. [Google Scholar] [CrossRef]
- Fiddes, J.; Gruber, S. TopoSCALE v. 1.0: Downscaling gridded climate data in complex terrain. Geosci. Model Dev. 2014, 7, 387–405. [Google Scholar] [CrossRef]
- Roe, G.H.; Montgomery, D.R.; Hallet, B. Orographic precipitation and the relief of mountain ranges. J. Geophys. Res. Solid Earth 2003, 108. [Google Scholar] [CrossRef]
- Shahgedanova, M.; Afzal, M.; Hagg, W.; Kapitsa, V.; Kasatkin, N.; Mayr, E.; Rybak, O.; Saidaliyeva, Z.; Severskiy, I.; Usmanova, Z.; et al. Emptying water towers? Impacts of future climate and glacier change on river discharge in the northern Tien Shan, Central Asia. Water 2020, 12, 627. [Google Scholar] [CrossRef]
- Zandler, H.; Haag, I.; Samimi, C. Evaluation needs and temporal performance differences of gridded precipitation products in peripheral mountain regions. Sci. Rep. 2019, 9, 1–15. [Google Scholar] [CrossRef]
- Mölg, T.; Maussion, F.; Scherer, D. Mid-latitude westerlies as a driver of glacier variability in monsoonal High Asia. Nat. Clim. Chang. 2014, 4, 68. [Google Scholar] [CrossRef]
- Ayala, A.; Pellicciotti, F.; MacDonell, S.; McPhee, J.; Burlando, P. Patterns of glacier ablation across North-Central Chile: Identifying the limits of empirical melt models under sublimation-favorable conditions. Water Resour. Res. 2017, 53, 5601–5625. [Google Scholar] [CrossRef]
- Lutz, A.; Immerzeel, W.; Shrestha, A.; Bierkens, M. Consistent increase in High Asia’s runoff due to increasing glacier melt and precipitation. Nat. Clim. Chang. 2014, 4, 587–592. [Google Scholar] [CrossRef]
- Immerzeel, W.; Wanders, N.; Lutz, A.; Shea, J.; Bierkens, M. Reconciling high-altitude precipitation in the upper Indus basin with glacier mass balances and runoff. Hydrol. Earth Syst. Sci. 2015, 19, 4673–4687. [Google Scholar] [CrossRef]
- Rounce, D.R.; Hock, R.; Shean, D.E. Glacier Mass Change in High Mountain Asia Through 2100 Using the Open-Source Python Glacier Evolution Model (PyGEM). Front. Earth Sci. 2020, 7, 331. [Google Scholar] [CrossRef]


| 2010/2011–2017/2018 | First Order | Second Order | Units | |
|---|---|---|---|---|
| / | °C km−1 | |||
| 0.7–1.9 | 1.4 | 1.3 | 103 m w.e. d −1°C−1 | |
| r | 0.2–0.5 | 0.3 | 0.2 | 105 m w.e. (W m−2)−1d−1°C−1 |
| r | 0.5–1.3 | 0.9 | 0.3 | 10 m w.e. (W m−2)−1d−1°C−1 |
| C | 50–220 | 128 | 130 | % |
| Uncertainty | ba | bw | bs |
|---|---|---|---|
| ±0.17 | ±0.17 | ±0.19 | |
| ±0.29 | ±0.16 | ±0.27 | |
| ±0.17 | ±0.17 | ±0.19 | |
| ±0.20 | ±0.10 | ±0.23 | |
| ±0.29 | ±0.13 | ±0.25 | |
| ±0.17 | ±0.17 | ±0.19 | |
| ±0.39 | ±0.25 | ±0.40 | |
| ±0.49 | ±0.29 | ±0.47 |
| Period | MB | MB |
|---|---|---|
| 1861–1927 | — | 0.00 |
| 1905–1955 | –0.12 | –0.13 |
| 1927–1972 | –0.14 | –0.11 |
| 1927–1977 | –0.16 | –0.15 |
| 1949–2000 | –0.17 | –0.21 |
| 1955–2006 | –0.20 | –0.22 |
| 1962–2012 | –0.25 | –0.22 |
| 1972–2016 | –0.30 | –0.27 |
Publisher’s Note: MDPI stays neutral with regard to jurisdictional claims in published maps and institutional affiliations. |
© 2022 by the authors. Licensee MDPI, Basel, Switzerland. This article is an open access article distributed under the terms and conditions of the Creative Commons Attribution (CC BY) license (https://creativecommons.org/licenses/by/4.0/).
Share and Cite
Azisov, E.; Hoelzle, M.; Vorogushyn, S.; Saks, T.; Usubaliev, R.; Esenaman uulu, M.; Barandun, M. Reconstructed Centennial Mass Balance Change for Golubin Glacier, Northern Tien Shan. Atmosphere 2022, 13, 954. https://doi.org/10.3390/atmos13060954
Azisov E, Hoelzle M, Vorogushyn S, Saks T, Usubaliev R, Esenaman uulu M, Barandun M. Reconstructed Centennial Mass Balance Change for Golubin Glacier, Northern Tien Shan. Atmosphere. 2022; 13(6):954. https://doi.org/10.3390/atmos13060954
Chicago/Turabian StyleAzisov, Erlan, Martin Hoelzle, Sergiy Vorogushyn, Tomas Saks, Ryskul Usubaliev, Mukhammed Esenaman uulu, and Martina Barandun. 2022. "Reconstructed Centennial Mass Balance Change for Golubin Glacier, Northern Tien Shan" Atmosphere 13, no. 6: 954. https://doi.org/10.3390/atmos13060954
APA StyleAzisov, E., Hoelzle, M., Vorogushyn, S., Saks, T., Usubaliev, R., Esenaman uulu, M., & Barandun, M. (2022). Reconstructed Centennial Mass Balance Change for Golubin Glacier, Northern Tien Shan. Atmosphere, 13(6), 954. https://doi.org/10.3390/atmos13060954