Comparison of Cloud Amounts Retrieved with Three Automatic Methods and Visual Observations
Abstract
:1. Introduction
2. Materials and Methods
2.1. Pyranometer (Long et al. 2016 Method)
2.2. Pyrgeometer (APCADA Method)
2.3. Ceilometer
3. Results
3.1. Analysis of the Cloud Amount Obtained by the Different Methods
3.2. Comparison between Automatic and Visual Methods
3.3. Relationships between Automatic and Visual Methods
4. Conclusions
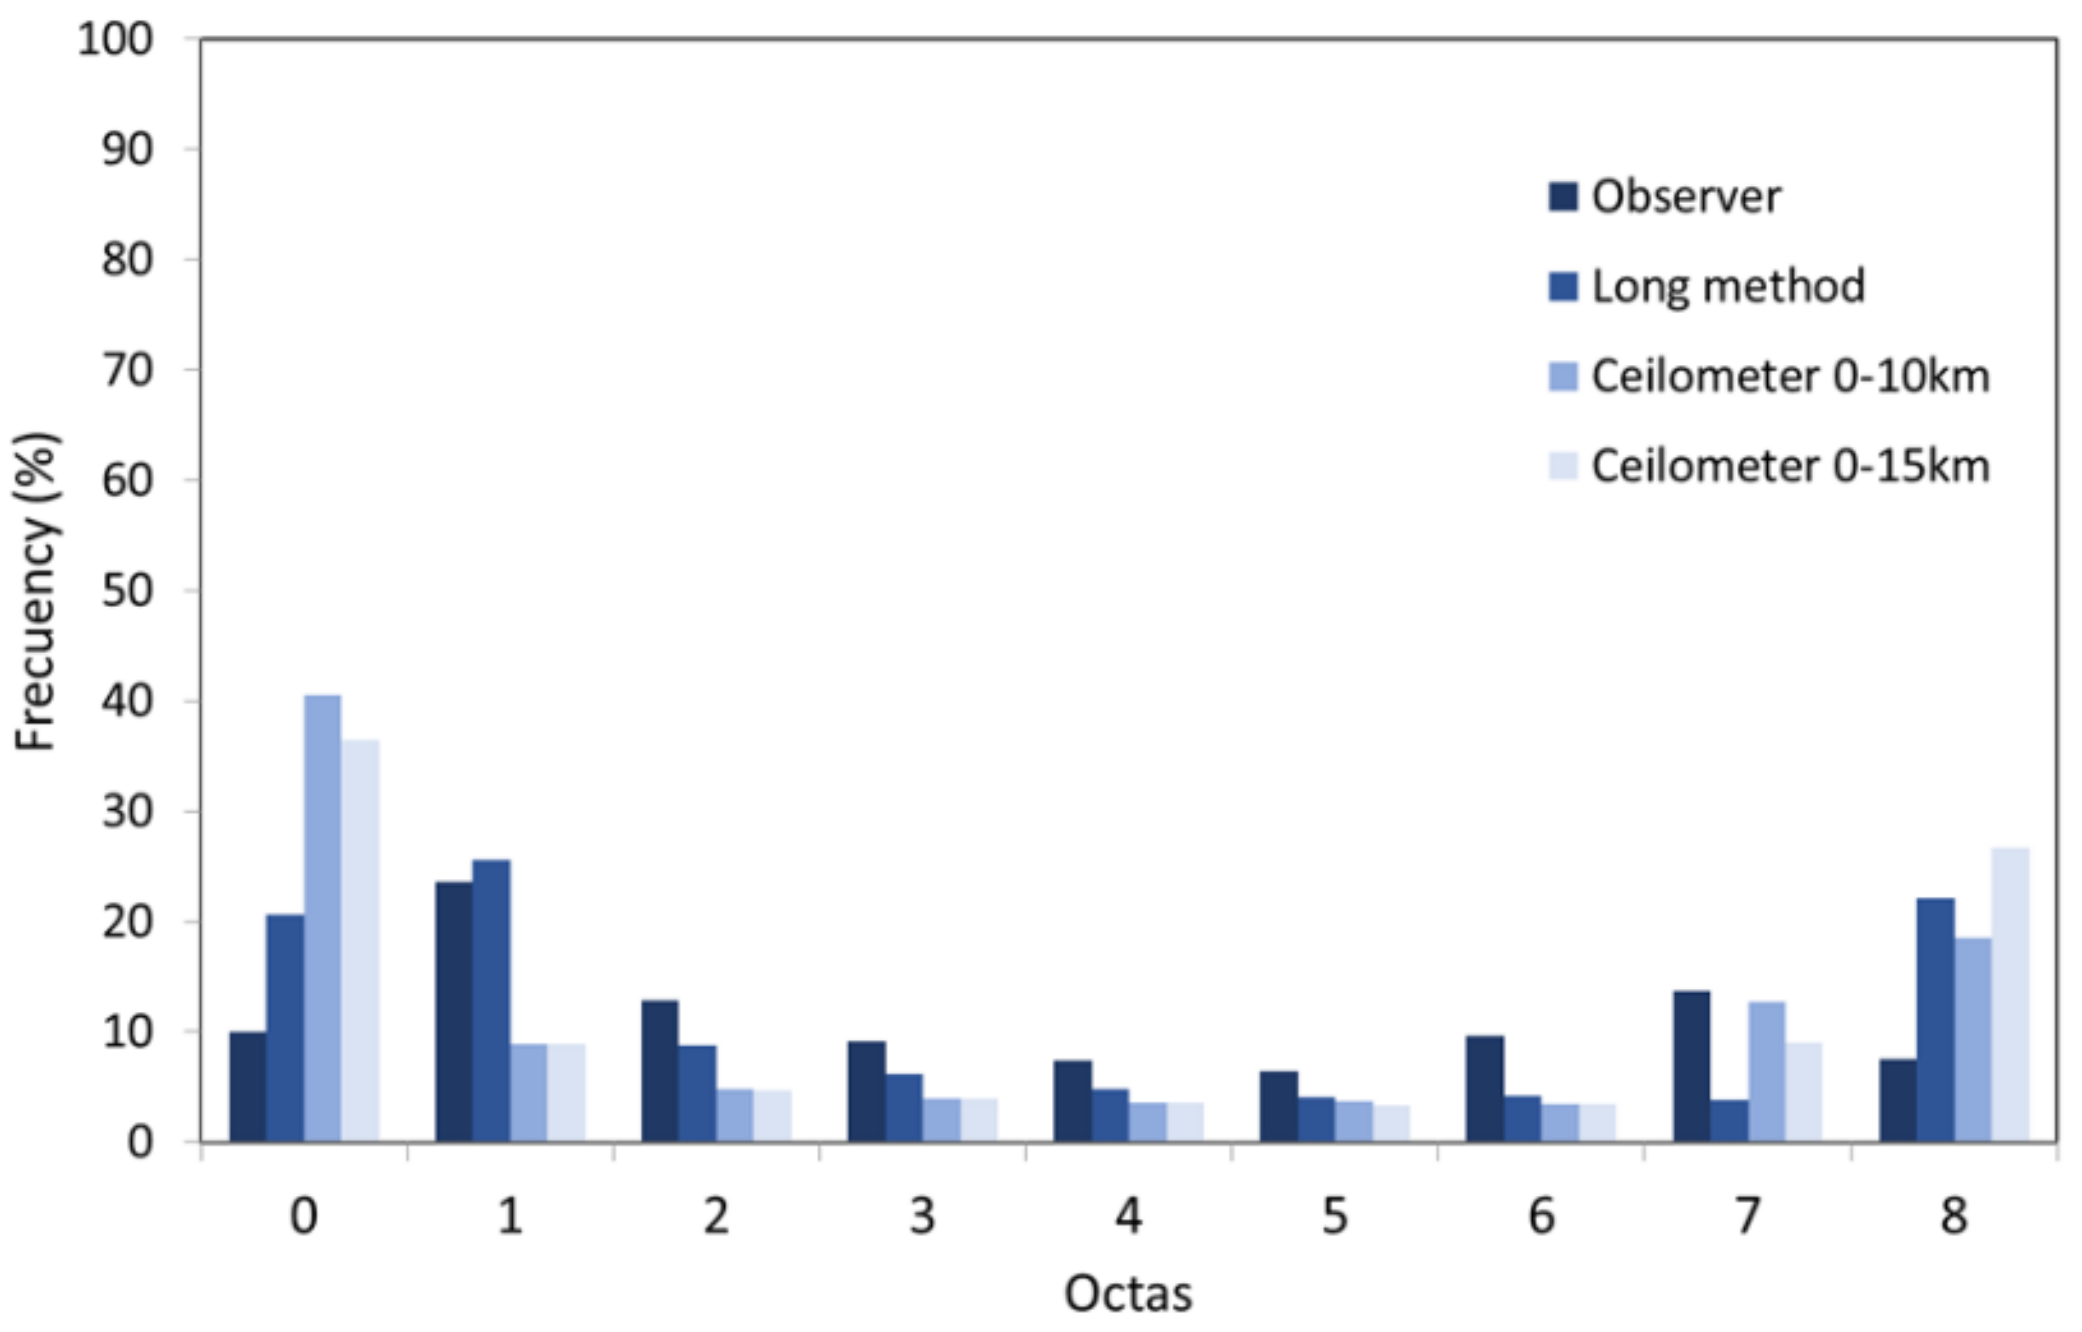
- Visual observations of the low cloud amount indicate that most of the time (approximately 67% of the records) the sky can be considered clear (cloud amount between 0 and 1 octa). In contrast, the total cloud amount is more variable, with no evident dominance of any cloud cover class.
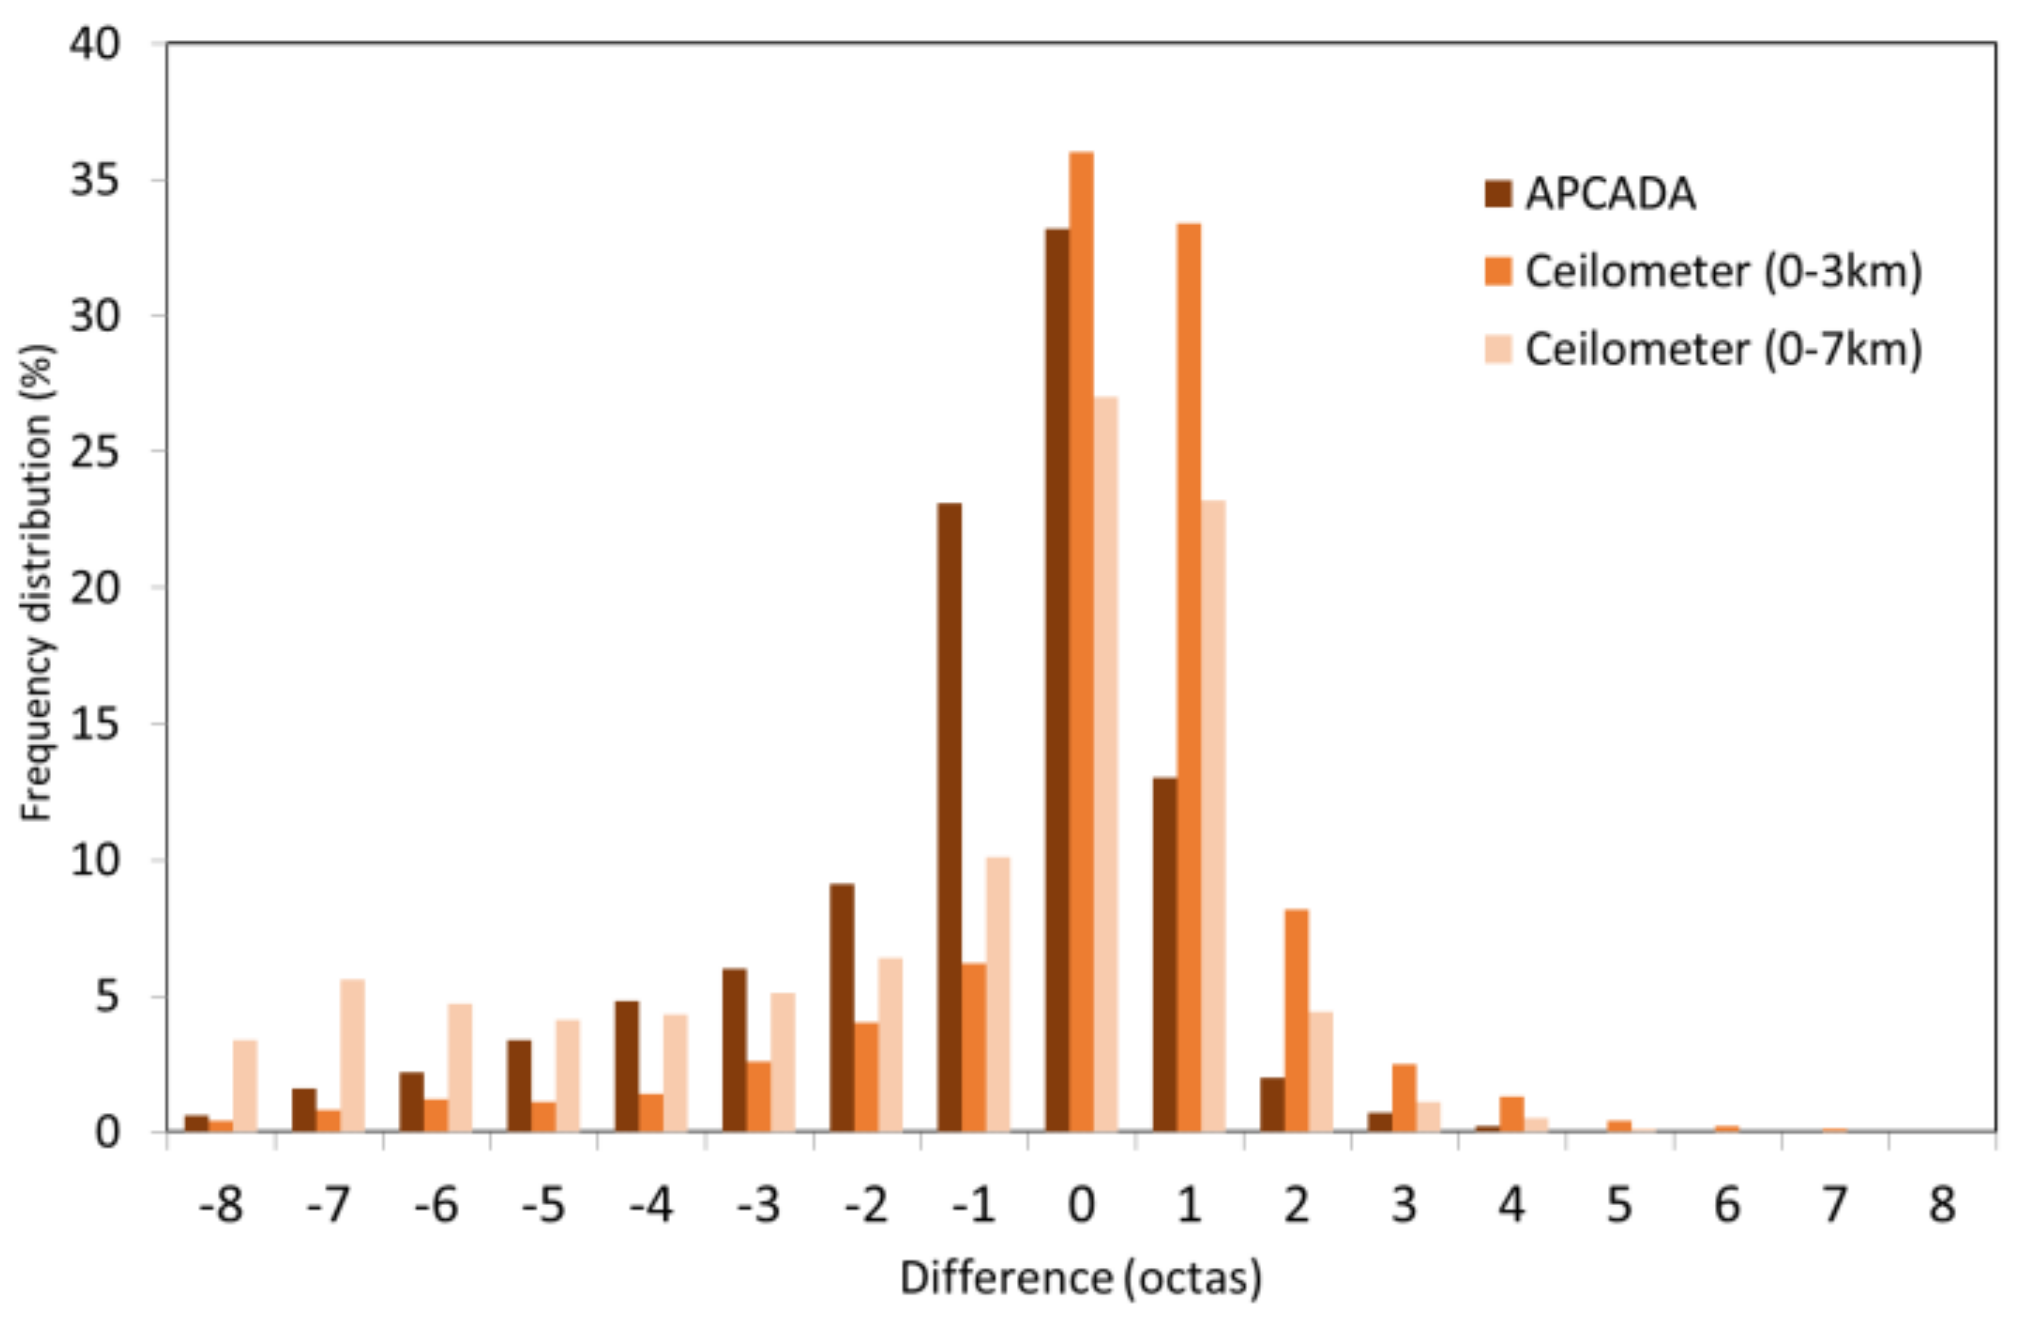
- The application of the APCADA method on the pyrgeometer data also show that clear skies are dominant (0–1 octas). The remaining cloud amount values are registered with a 5–12% frequency.
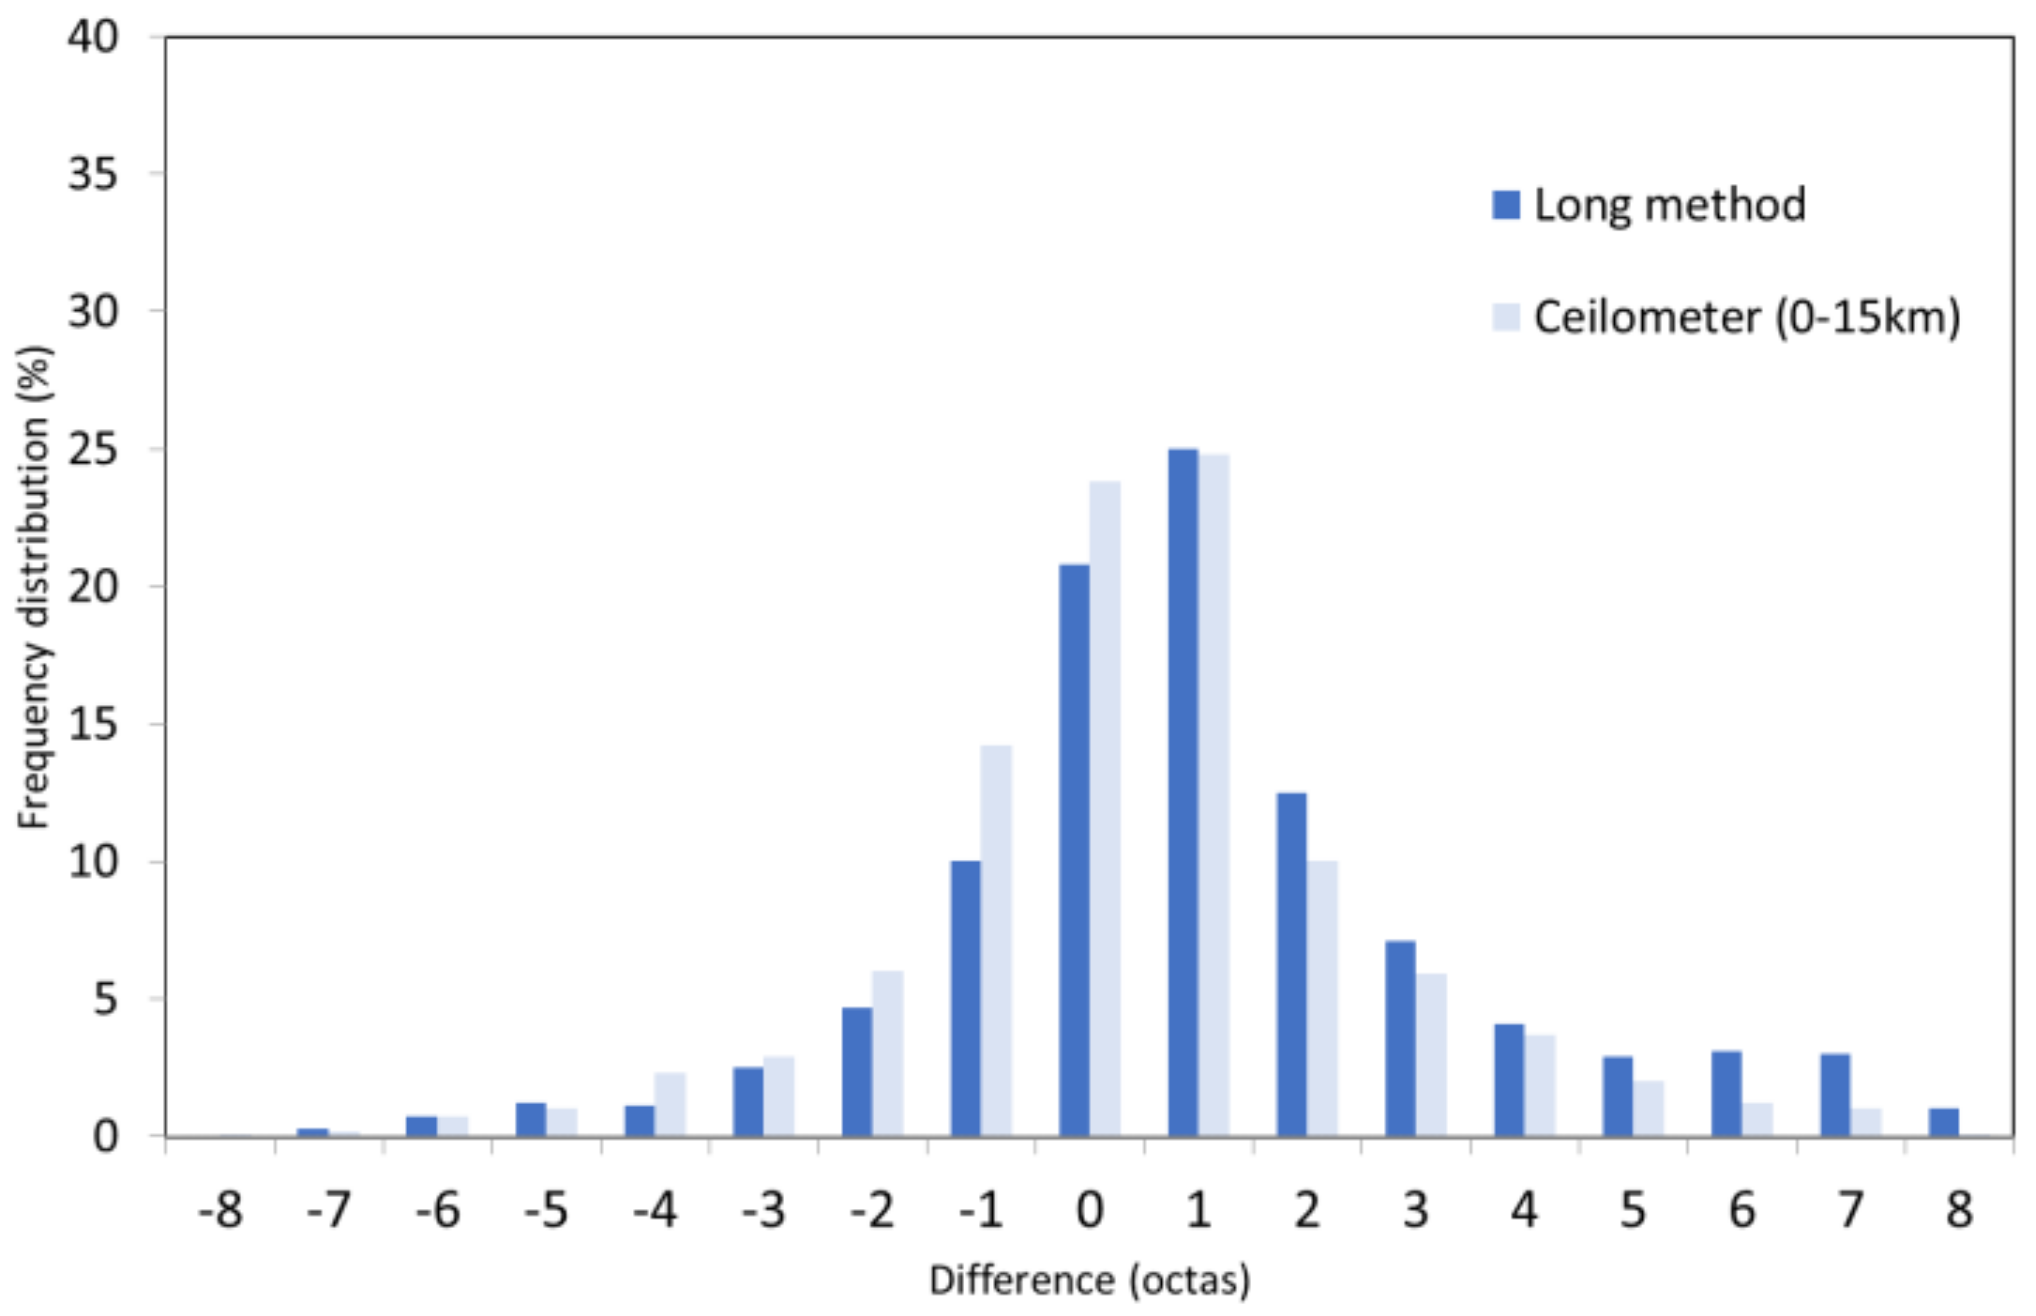
- The application of the Long method on the pyranometer measurements shows that the frequency, in relation to the number of octas, is higher for the extreme cloud amount values (0–1 and 8 octas). The remaining cloud amounts are more uniformly represented with percentages between 4% and 9%.
- The ceilometer results are also consistent with the other two automatic methods, because the clear skies are also dominant. In particular, the maximum frequency corresponds to completely clear skies, with a frequency of 69% for low clouds (0–3 km). Overcast skies are also frequent (8 octas), specially for the 0–15 km layer, with a frequency of almost 26%. Any of the remaining values of cloud amount are less frequent than the extremes.
- The mean cloud amount ranges between 1.6 to 2.7 octas for low-medium clouds and 2.9 to 3.5 octas for total cloud amount. Standard deviation ranges between 2 to 2.8 for low clouds and 2.5 to 3.4 for total cloud amount.
Author Contributions
Funding
Institutional Review Board Statement
Informed Consent Statement
Data Availability Statement
Acknowledgments
Conflicts of Interest
References
- Free, M.; Sun, B.; Yoo, H.L. Comparison between Total Cloud Cover in Four Reanalysis Products and Cloud Measured by Visual Observations at U.S. Weather Stations. J. Clim. 2016, 29, 2015–2021. [Google Scholar] [CrossRef]
- Mitchell, D.I.; Finnegan, W. Modification of cirrus clouds to reduce global warming. Environ. Res. Lett. 2009, 4, 045102. [Google Scholar] [CrossRef]
- Kazantzidis, A.; Tzoumanikas, P.; Bais, A.F.; Fotopoulos, S.; Economou, G. Cloud detection and classification with the use of whole-sky ground-based images. Atmos. Res. 2012, 113, 80–88. [Google Scholar] [CrossRef]
- Wacker, S.; Gröbner, J.; Zysset, C.; Diener, L.; Tzoumanikas, P.; Kazantzidis, A.; Vuilleumier, L.; Stöckli, R.; Nyeki, S.; Kämpfer, N. Cloud observations in Switzerland using hemispherical sky cameras. J. Geophys. Res.-Atmos. 2015, 120, 695–707. [Google Scholar] [CrossRef] [Green Version]
- Boucher, O.; Randall, D.; Artaxo, P.; Bretherton, C.; Feingold, G.; Forster, P.; Kerminen, V.-M.; Kondo, Y.; Liao, H.; Lohmann, U.; et al. Clouds and Aerosols. In Climate Change 2013: The Physical Science Basis; Contribution of Working Group I to the Fifth Assessment Report of the Intergovernmental Panel on Climate Change; Stocker, T.F., Quin, D., Plattner, G., Tignor, M.M.B., Allen, S.K., Boschung, J., Nauels, A., Xia, Y., Bex, V., Midgley, P.M., Eds.; Cambridge University Press: Cambridge, UK; New York, NY, USA, 2013; pp. 571–657. [Google Scholar] [CrossRef]
- Trenberth, K.E.; Jones, P.D.; Ambenje, P.; Bojariu, R.; Easterling, D.; Klein Tank, A.; Parker, D.; Rahimzadeh, F.; Renwick, J.A.; Rusticucci, M.; et al. Observations: Surface and Atmospheric Climate Change. In Climate Change 2007: The Physical Science Basis; Contribution of Working Group I to the Fourth Assessment Report of the Intergovernmental Panel on Climate, Change; Solomon, S., Qin, D., Manning, M., Chen, Z., Marquis, M., Averyt, K.B., Tignor, M., Miller, H.L., Eds.; Cambridge University Press: Cambridge, UK; New York, NY, USA, 2007; pp. 235–336. [Google Scholar]
- Norris, J.R.; Slingo, A. Trends in observed cloudiness and Earth’s radiation budget: What do we not know and what do we need to know? In Clouds in the Perturbed Climate System; Heintzenberg, J., Charlson, R.J., Eds.; MIT Press: Cambridge, MA, USA, 2009; pp. 17–36. [Google Scholar]
- Smith, C.J.; Bright, J.M.; Crook, R. Cloud cover effect of clear-sky index distributions and differences between human and automatic cloud observations. Sol. Energy 2017, 144, 10–21. [Google Scholar] [CrossRef] [Green Version]
- Park, S.; Kim, Y.; Ferrier, N.J.; Collis, S.M.; Sankaran, R.; Beckman, P.H. Prediction of Solar Irradiance and Photovoltaic Solar Energy Product Based on Cloud Coverage Estimation Using Machine Learning Methods. Atmosphere 2021, 12, 395. [Google Scholar] [CrossRef]
- Badescu, V. Solar radiation estimation from cloudiness data. Satellite vs. groundbased observations. Int. J. Green Energy 2015, 12, 852–864. [Google Scholar] [CrossRef]
- Badescu, V.; Dumitrescu, A. Simple models to compute solar global irradiance from the CMSAF product Cloud Fractional Coverage. Renew. Energy 2014, 66, 118–131. [Google Scholar] [CrossRef]
- Liu, Y.; Key, J.R. Assessment of Arctic Cloud Cover Anomalies in Atmospheric Reanalysis Products Using Satellite Data. J. Clim. 2016, 29, 6065–6083. [Google Scholar] [CrossRef]
- Boers, R.; de Haij, M.; Wauben, W.; Baltink, H.; van Ulft, L.; Savenije, M.; Long, C.N. Optimized fractional cloudiness determination from five ground-based remote sensing techniques. J. Geophys. Res-Atmos. 2010, 115, D24116. [Google Scholar] [CrossRef] [Green Version]
- Tapakis, R.; Charalambides, A.G. Equipment and methodologies for cloud detection and classification: A review. Sol. Energy 2013, 95, 392–430. [Google Scholar] [CrossRef]
- Norris, J.; Evan, A.T. Empirical removal of artifacts from the ISCCP and PATMOS-x satellite cloud records. J. Atmos. Oceanic Technol. 2015, 32, 691–702. [Google Scholar] [CrossRef]
- Sun, B.; Free, M.; Yoo, H.; Foster, M.J.; Heidinger, A.; Karlsson, K. Variability and trends in U.S. cloud cover: ISCCP, PATMOS-x, and CLARA-A1 compared to homogeneity adjusted weather observations. J. Clim. 2015, 28, 4373–4389. [Google Scholar] [CrossRef]
- Free, M.; Sun, B. Time-varying biases in U.S. total cloud cover data. J. Atmos. Oceanic Technol. 2013, 30, 2838–2849. [Google Scholar] [CrossRef]
- WMO. Guide to Instruments and Methods of Observation, 2018th ed.; WMO 8; World Meteorological Organization: Geneva, Switzerland, 2018; pp. 490–492. [Google Scholar]
- Huo, J.; Lu, D. Comparison of Cloud Cover from All-Sky Imager and Meteorological Observer. J. Atmos. Oceanic Technol. 2012, 29, 1093–1101. [Google Scholar] [CrossRef]
- Min, Q.; Wang, T.; Long, C.N.; Duan, M. Estimating fractional sky cover from spectral measurements. J. Geophys. Res.-Atmos. 2008, 113, D20208. [Google Scholar] [CrossRef] [Green Version]
- WMO. Manual on the Observation of Clouds and Other Meteors, 2017th ed.; WMO-407; International Cloud Atlas: Geneva, Switzerland, 2007; Volume 1, Available online: https://cloudatlas.wmo.int/en/home.html (accessed on 15 February 2022).
- Hahn, C.J.; Warren, S.G.; London, J. The effect of moonlight on observation of cloud cover at night, and application to cloud climatology. J. Clim. 1995, 8, 1429–1446. [Google Scholar] [CrossRef] [Green Version]
- Kassianov, E.; Ackerman, T.; Marchand, R.; Ovtchinnikov, M. Satellite multiangle cumulus geometry retrieval: Case study. J. Geophys. Res.-Atmos. 2003, 108, 4117. [Google Scholar] [CrossRef]
- Aebi, C.; Gröbner, J.; Kämpfer, N. Cloud fraction determined by thermal infrared and visible all-sky cameras. Atmos. Meas. Technol. 2018, 11, 5549–5563. [Google Scholar] [CrossRef] [Green Version]
- Münkel, C.; Eresmaa, N.; Räsänen, J.; Karppinen, A. Retrieval of mixing height and dust concentration with lidar ceilometer. Bound-Lay. Meteorol. 2007, 124, 117–128. [Google Scholar] [CrossRef]
- Emeis, S.; Schäfer, K.; Münkel, C. Long-term observations of the urban mixing-layer height with ceilometers. In Proceedings of the IOP Conference Series: Earth and Environmental Science, Roskilde, Denmark, 23–25 June 2008; p. 012027. [Google Scholar] [CrossRef]
- Wauben, W.M.F. Evaluation of the NubiScope; Technical Report 291; KNMI: De Bilt, The Netherlands, 2006. [Google Scholar]
- Wauben, W.M.F.; Klein Baltink, H.; de Haij, M.; Maat, N.; Verkaik, J. Status, Evaluation and New Developments in the Automated Cloud Observations in the Netherlands. In Proceedings of the 4th ICEAWS, Lisbon, Portugal, 24–26 May 2006. [Google Scholar]
- Long, C.N.; Ackerman, T.P.; Gaustad, K.L.; Cole, J.N.S. Estimation of fractional sky cover from broadband shortwave radiometer measurements. J. Geophys. Res.-Atmos. 2006, 111, D17202-1. [Google Scholar] [CrossRef] [Green Version]
- Long, C.N.; Ackerman, T.P. Identification of clear skies from broadband pyranometer measurements and calculation of downwelling shortwave cloud effects. J. Geophys. Res.-Atmos. 2000, 105, 15609–15626. [Google Scholar] [CrossRef]
- Durr, B.; Philipona, R. Automatic cloud amount detection by surface longwave downward radiation measurements. J. Geophys. Res.-Atmos. 2004, 109, D05201. [Google Scholar] [CrossRef]
- Ahrens, C. Meteorology Today: An Introduction to Weather, Climate, and the Environment; Cengage Learning: Andover, UK, 2008. [Google Scholar]
- Martucci, G.; Milroy, C.; O’Dowd, C.D. Detection of Cloud-Base Height Using Jenoptik CHM15K and Vaisala CL31 Ceilometers. J. Epidemiol. Community Health 2010, 27, 305–318. [Google Scholar] [CrossRef]
- Ackerman, S.A.; Holz, R.E.; Frey, R.; Eloranta, E.W.; Maddux, B.C.; McGill, M. Cloud Detection with MODIS. Part II: Validation. J. Atmos. Ocean. Technol. 2008, 25, 1073–1086. [Google Scholar] [CrossRef] [Green Version]
- Werkmeister, A.; Lockhoff, M.; Schrempf, M.; Tohsing, K.; Liley, B.; Seckmeyer, G. Comparing satellite- to ground-based automated and manual cloud coverage observations-a case study. Atmos. Meas. Techbol. 2015, 8, 2001–2015. [Google Scholar] [CrossRef] [Green Version]
- An, N.; Wang, K. A Comparison of MODIS-Derived Cloud Fraction with Surface Observations at Five SURFRAD sites. JAMC 2015, 44, 1009–1920. [Google Scholar] [CrossRef]
- Calbó, J.; Badosa, J.; González, J.A.; Dmitrieva, L.; Khan, V.; Enríquez-Alonso, A.; Sanchez-Lorenzo, A. Climatology and changes in cloud cover in the area of the Black Caspian, and Aral seas (1991–2010): A comparison of surface observations with satellite and reanalysis products. Int. J. Climatol. 2016, 36, 1428–1443. [Google Scholar] [CrossRef] [Green Version]
- Kipp-Zonen. Available online: http://www.kippzonen.com/Product/14/CMP21-Pyranometer#.WNkWHfmLSUk (accessed on 14 January 2022).
- Vaisala. Available online: https://www.vaisala.com/en/products/weather-environmental-sensors/ceilometers-CL31-CL51 (accessed on 14 January 2022).
- Wagner, T.J.; Kleiss, J.M. Error Characteristics of Ceilometer-Based Observations of Cloud Amount. J. Atmos. Ocean. Technol. 2016, 33, 1557–1567. [Google Scholar] [CrossRef]
- Marín, M.J.; Estellés, V.; Gómez-Amo, J.L.; Camarasa, J.; Catalán, P.; Utrillas, M.P. Study of cloud cover at different heights from measurements of a ceilometer. In Proceedings of the 8th International Meeting on Meteorology and Climatology of the Mediterranean, Virtual Congress. 25–27 May 2021; Available online: https://www.metmed.eu/53568/section/27848/8th-international-conference-on-meteorology-and-climatology-of-the-mediterranean.html (accessed on 23 February 2022).
- Schade, N.H.; Macke, A.; Sandmann, H.; Stick, C. Total and partial cloud amount detection during summer 2005 at Westerland (Sylt, Germany). Atmos. Chem. Phys. 2009, 9, 1143–1150. [Google Scholar] [CrossRef] [Green Version]


| % | Octas |
|---|---|
| 0 | 0 |
| 0 < % < 18.75 | 1 |
| 18.75 ≤ % < 31.25 | 2 |
| 31.25 ≤ % < 43.75 | 3 |
| 43.75 ≤ % < 56.25 | 4 |
| 56.25 ≤ % < 68.75 | 5 |
| 68.75 ≤ % < 81.25 | 6 |
| 81.25 ≤ % < 100 | 7 |
| 100 | 8 |
| Sensor | Detection | Cloud Amount | Method | Total Data | Common Data |
|---|---|---|---|---|---|
| Human | Visual | Low and total | Observer (octa) | 6426 | 6426 |
| Pyranometer | Automatic | Total | Long (%) | 4936 | |
| Pyrgeometer | Automatic | Low-medium | APCADA (octa) | 4955 | |
| Ceilometer | Automatic | Low, medium, high and total | This article (%) | 3544 |
| APCADA | COBSERVER =a CMODEL + b | ||
| a | b | r2 | |
| Spring | 1.17 ± 0.09 | −1.7 ± 0.5 | 0.96 |
| Summer | 1.18 ± 0.08 | −1.2 ± 0.4 | 0.97 |
| Autumn | 1.18 ± 0.11 | −1.8± 0.6 | 0.95 |
| Winter | 1.22 ± 0.09 | −2.2 ± 0.5 | 0.96 |
| Ceilometer 0–3 km | COBSERVER =a CMODEL + b | ||
| a | b | r2 | |
| Spring | 0.91 ± 0.05 | 0.5 ± 0.2 | 0.98 |
| Summer | 0.88 ± 0.06 | 0.7 ± 0.3 | 0.97 |
| Autumn | 0.95 ± 0.11 | 0.05± 0.30 | 0.97 |
| Winter | 0.93 ± 0.09 | 0.03 ± 0.30 | 0.96 |
| Ceilometer 0–7 km | COBSERVER =a CMODEL + b | ||
| a | b | r2 | |
| Spring | 1.09 ± 0.09 | −1.4 ± 0.5 | 0.97 |
| Summer | 0.99 ± 0.08 | −0.7 ± 0.4 | 0.95 |
| Autumn | 1.18 ± 0.11 | −2.4± 0.6 | 0.96 |
| Winter | 1.39 ± 0.09 | −3.9 ± 0.5 | 0.96 |
| Long | COBSERVER =a CMODEL + b | ||
| a | b | r2 | |
| Spring | 1.01 ± 0.05 | 0.2 ± 0.2 | 0.95 |
| Summer | 1.07 ± 0.03 | −0.14 ± 0.13 | 0.97 |
| Autumn | 0.95 ± 0.06 | 0.6 ± 0.2 | 0.94 |
| Winter | 1.02 ± 0.07 | 0.6± 0.3 | 0.96 |
| Ceilometer 0–15 km | COBSERVER =a CMODEL + b | ||
| a | b | r2 | |
| Spring | 1.06 ± 0.08 | 0.8 ± 0.3 | 0.96 |
| Summer | 1.05 ± 0.07 | 0.7 ± 0.3 | 0.97 |
| Autumn | 1.01 ± 0.04 | 0.16 ± 0.18 | 0.99 |
| Winter | 0.97 ± 0.08 | −0.10± 0.4 | 0.96 |
Publisher’s Note: MDPI stays neutral with regard to jurisdictional claims in published maps and institutional affiliations. |
© 2022 by the authors. Licensee MDPI, Basel, Switzerland. This article is an open access article distributed under the terms and conditions of the Creative Commons Attribution (CC BY) license (https://creativecommons.org/licenses/by/4.0/).
Share and Cite
Utrillas, M.P.; Marín, M.J.; Estellés, V.; Marcos, C.; Freile, M.D.; Gómez-Amo, J.L.; Martínez-Lozano, J.A. Comparison of Cloud Amounts Retrieved with Three Automatic Methods and Visual Observations. Atmosphere 2022, 13, 937. https://doi.org/10.3390/atmos13060937
Utrillas MP, Marín MJ, Estellés V, Marcos C, Freile MD, Gómez-Amo JL, Martínez-Lozano JA. Comparison of Cloud Amounts Retrieved with Three Automatic Methods and Visual Observations. Atmosphere. 2022; 13(6):937. https://doi.org/10.3390/atmos13060937
Chicago/Turabian StyleUtrillas, María Pilar, María José Marín, Víctor Estellés, Carlos Marcos, María Dolores Freile, José Luis Gómez-Amo, and José Antonio Martínez-Lozano. 2022. "Comparison of Cloud Amounts Retrieved with Three Automatic Methods and Visual Observations" Atmosphere 13, no. 6: 937. https://doi.org/10.3390/atmos13060937
APA StyleUtrillas, M. P., Marín, M. J., Estellés, V., Marcos, C., Freile, M. D., Gómez-Amo, J. L., & Martínez-Lozano, J. A. (2022). Comparison of Cloud Amounts Retrieved with Three Automatic Methods and Visual Observations. Atmosphere, 13(6), 937. https://doi.org/10.3390/atmos13060937


