Article

Meteonetwork: An Open Crowdsourced Weather Data System

1
Associazione Meteonetwork OdV, 20142 Milano, Italy
2
Hortus s.r.l., 20025 Legnano, Italy
3
Radarmeteo s.r.l., 35020 Due Carrare, Italy
4
Hypermeteo s.r.l., 00184 Roma, Italy
5
Data Science for Industry and Physics (DSIP), Fondazione Bruno Kessler, 38123 Trento, Italy
6
Water Research Institute—National Research Council of Italy (IRSA-CNR), 20861 Brugherio, Italy
7
Meteo Expert, 20090 Segrate, Italy
8
Department of Biomedical Science for Health, Università degli Studi di Milano, 20133 Milano, Italy
9
Department of Civil and Environmental Engineering (D.I.C.A.), Politecnico di Milano, 20133 Milano, Italy
*
Author to whom correspondence should be addressed.
Atmosphere 2022, 13(6), 928; https://doi.org/10.3390/atmos13060928
Submission received: 14 April 2022 / Revised: 30 May 2022 / Accepted: 2 June 2022 / Published: 7 June 2022

Abstract

:
Citizen science has shown great potential for bringing large groups of people closer to science, thanks in part to cooperation with universities and research centers. In this context, amateur weather networks played a major role in the last few decades thanks to a constant growth in technology. An example is given by the Meteonetwork association, born in 2002, and mainly composed by atmospheric science enthusiasts, who built up in time a huge weather station network in Italy. In recent years, they have enlarged their horizons over Europe, displaying real time observations and daily maps coming from both personal weather stations and official networks. This study described how Meteonetwork has set up an open crowdsourced weather data system, how data are validated, and which products are generated and freely accessible for scientists and stakeholders for their own purposes. Two concrete use cases were described as examples: the Weatherness Project, which selects a subnet of Meteonetwork data for biometeorological and health purposes and the data assimilation process implemented to improve the initial conditions into the WRF meteorological model for daily weather forecasts.

1. Introduction

In recent decades, thanks to the constant development of information and communication technology (ICT) and to cost devices reduction, common people attracted by meteorology have constantly grown, leading to their role as citizen scientists capable of creating large amateur networks with increasingly reliable automatic measuring stations.
“Citizen science” (CS) is recognized as a self-developed significant activity in order to support, and often complement research and institutional monitoring conducted by universities, research centers, environmental control agencies, etc. [1,2,3]. It is a form of collaborative research involving volunteers, amateurs, and enthusiasts [4,5].
CS still presents a wide variety of definitions. Many attempts have recently been made to rationalize it [6], focusing on the work undertaken by communities of citizens to advance science, promote a broad scientific mentality, and/or encourage democracy in data dissemination in a commitment that allows society to tackle complex problems. For instance, the CS can be considered a technique of crowdsourcing, as was first termed by Howe [7] referring to the idea of outsourcing to the crowd, while Dickinson et al. [8] defined it as “getting an undefined public to do work, usually directed by designated individuals or professionals”. Traditionally, it was described as “obtaining data or information by enlisting services of a (potentially large) number of people”. However, due to recent innovations, this definition can now be expanded to include the use of a range of sensors, typically connected via Internet [9].
The great potential of crowdsourcing, given the widespread availability of observations, is limited in terms of data reliability, which is a major concern. Data usually come from a large number of operators who collect their measurements under many different conditions, which may not be standardized. In this context, the assessment of data quality [10] plays a major role. Evaluation is an essential methodological issue, requiring transparent and reliable procedures to ensure credibility and sustainability to citizen science projects. For this reason, the reputation of citizen science will grow only paying more and more attention to procedures for quality control of measurements (sampling plans, methods of sample collection and measurement in the field, calibration of instruments, etc.), as well as in transparent data quality and assurance criteria. In this regard, a review about the wealth of quality norms and methods was well described in Fiebrich et al. [11]. Therefore, to validate citizen science results, the same metrics used by professional researchers must be applied. Thereby, the policy makers can use citizen efforts to expand the knowledge provided by traditional monitoring [12].

1.1. Crowdsourcing and Amateur Weather Networks

The rapid spread of ICT over the past two decades facilitated the process of collecting and sharing data, and led to the growth of several online networks. Considering that traditional meteorological networks are in decline [13] and that, on the contrary, the demand for real-time, high space-time resolution data is increasing, the need for crowdsourcing weather data is clear. As computing power increases, the ability to process and use these kinds of data will also rise; therefore, it is necessary to explore their potential. Since the uncertainty associated with individual citizen observations are higher than for professional stations, the massive redundancy of the first ones helps to detect and improve anomalies in measurements.
The Meteonetwork (MNW) system is a typical example of citizen weather stations (CWSs), covering a wide territory with a high spatial density which allows a high redundancy of measures.

1.2. The Origin and Mission of the Metonetwork Association

The Meteonetwork (MNW) association was founded on 6 April 2002 in Seregno (Italy) by a group of friends and weather enthusiasts; a year later, it was officially registered as association in the city of Mantova (Italy).
MNW is a non-profit organization with the task to “promote and disseminate for the benefit of community the knowledge of meteorological, climatological, environmental, hydrological and glaciological sciences, and their multiple expressions on the territory”. Nowadays, it is comprised of about 200 associated members.
One of its most important goals has always been to develop an integrated and coordinated Automatic Weather Station (AWS) network made of various amateur meteorological sites. This is the main achieved result here presented: the creation of a CWS network, gathering a large number of citizen scientist observations, a goal made possible thanks to a well-established market of low-cost, easy-to-use devices, owned and maintained by private individuals who love to share their data on the Internet for the meteorological and climatological community; a way where people are, in fact, no longer simply consumers of data, but also producers [14].
The aims of this work were to describe the MNW network, and the procedures of data collection and processing with particular attention paid to the activated quality controls; in this way, data, coming from citizen scientists, through a rigorous methodological path, can represent a key tool in the knowledge of local meteorology with benefits in a wide variety of weather applications, including operational weather forecasting, health, energy, agriculture, and water management.
The paper is divided into two sections. The first one describes the open crowdsource weather data system implemented by MNW: the geographical area, the development, and actual consistency of the network, the information technology infrastructure, the main guidelines and ancillary data (the ‘metadata’), and the strict quality control procedures. The second section is focused on services available to all users, such as maps of real time weather data, and on two applied case studies: (a) the data assimilation process using the MNW values into the WRF (Weather Research Forecasting) forecasting model, and (b) the Weatherness project, aimed to set up biometeoclimatic indices for health and medical matters.

2. Materials and Methods

This chapter illustrates the evolution of MNW through years, the methodology, guidelines, and implemented quality control procedures.

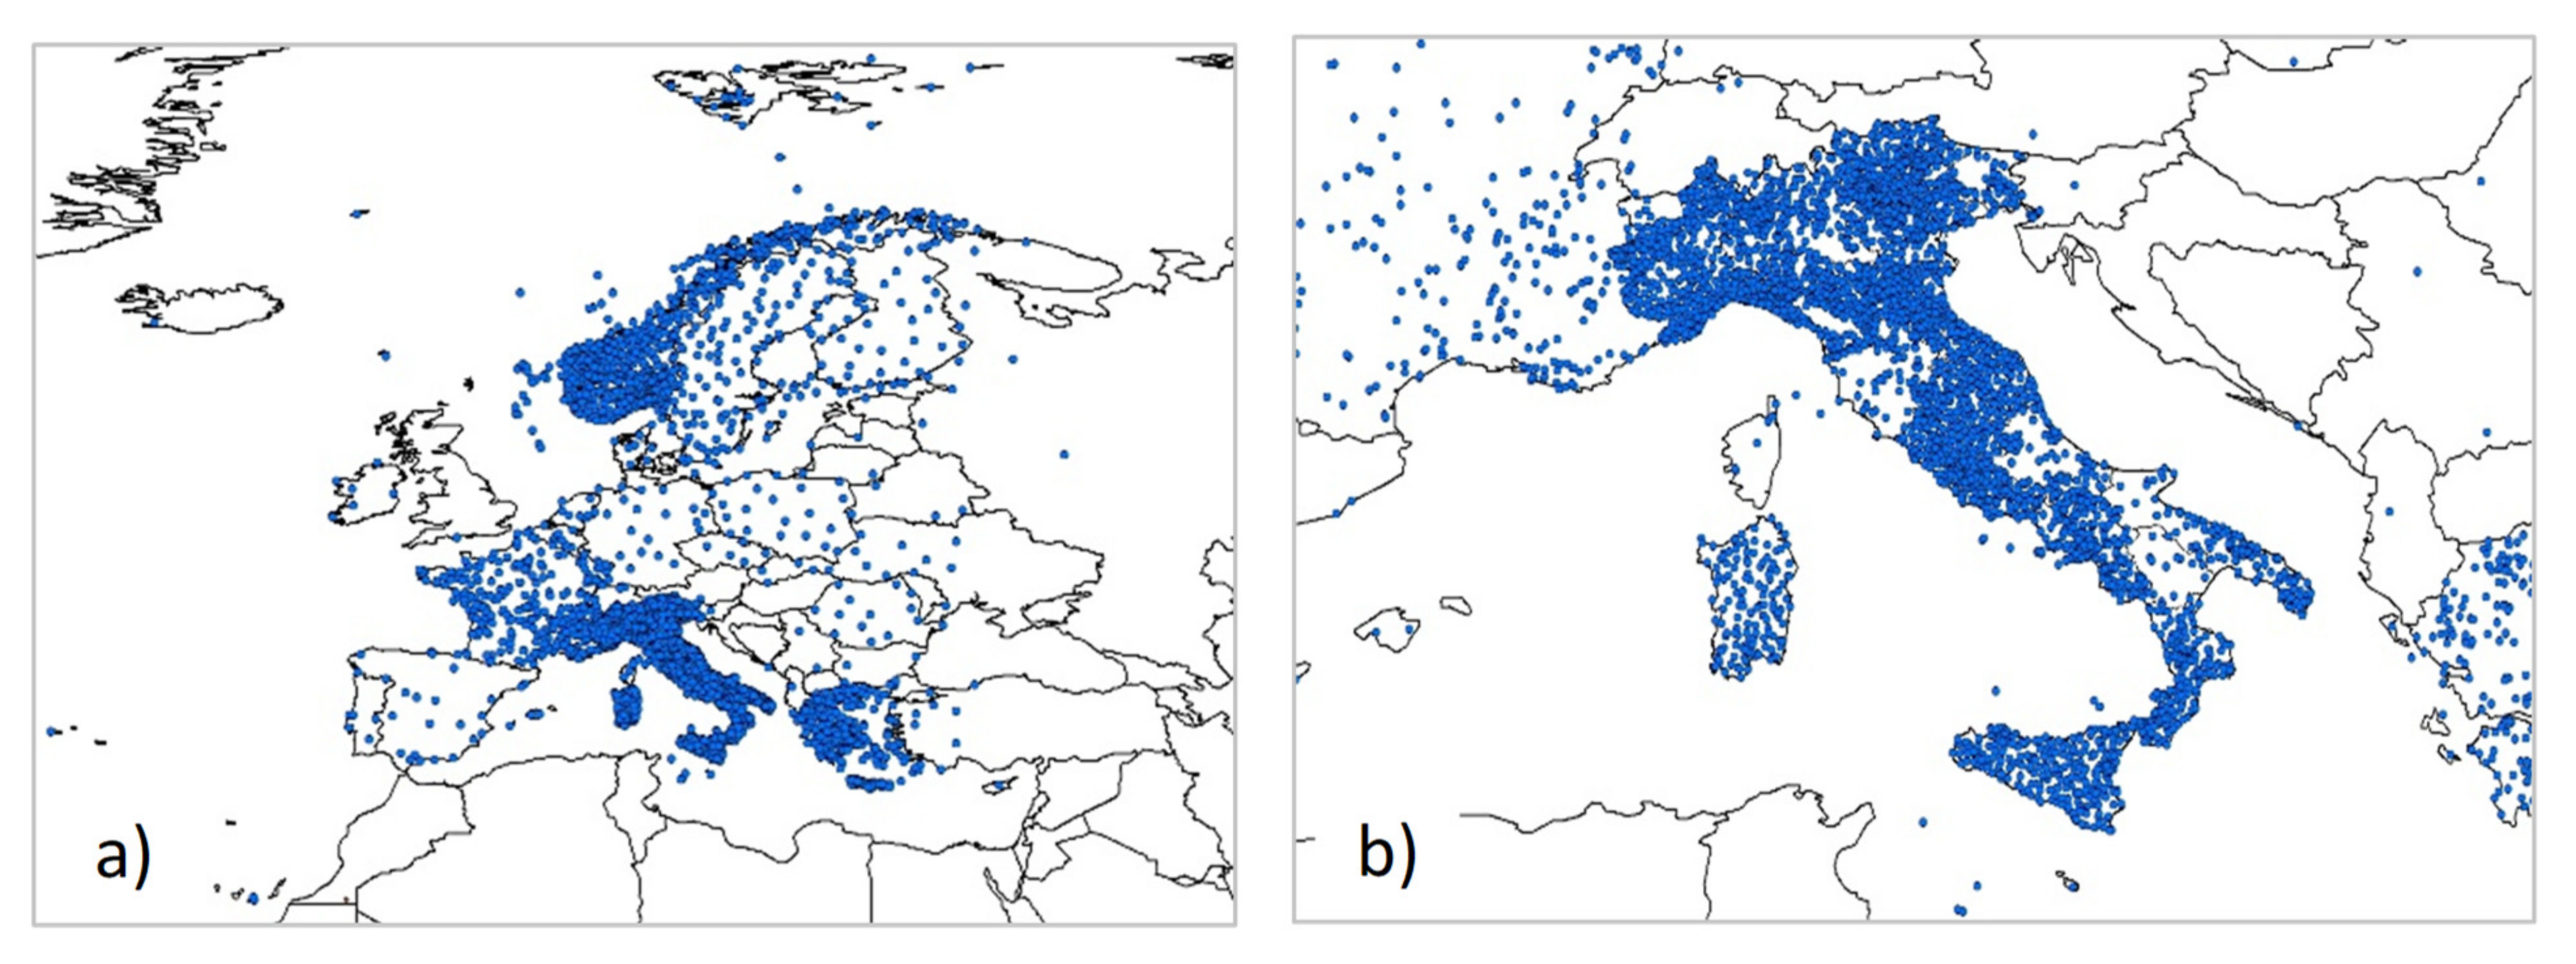
2.1. The Network Geographical Area

The MNW operational area includes the whole European region (Figure 1a), with a particular focus over Italy (Figure 1b). At the end of January 2022, the network consisted of 6506 weather stations from 42 countries around the world (Table 1). A detailed overview of the MNW network can be seen at this web site https://meteonetwork.eu/en (accessed on 15 May 2022).
Besides the acquisition of weather data coming from Italian citizen scientists, during the last decade, two main mutual data exchange agreements with European amateur associations have been signed: Infoclimat in France and MeteoGR in Greece. Furthermore, since 2020 additional data have been imported from the Frost network (https://frost.met.no/index.html (accessed on 15 May 2022)), managed by the Norwegian Meteorological Institute, which include quality-controlled daily, monthly, and yearly measurements of temperature, precipitation and wind data. Locally, official mutual data exchange covenants to automatically integrate data from the Regional Protection Environmental Agency (ARPA) of some Italian regions, like Emilia-Romagna, Veneto and Calabria, and from the meteorological agencies of the autonomous provinces of Trento and Bolzano have been signed.
In 2021, the MNW stations were included in the MISTRAL portal (Meteo Italian SupercompuTing poRtAL, https://www.mistralportal.it/ (accessed on 15 May 2022)); this led to a two-way relationship and to a mutual exchange of weather stations data inside both networks. Table 2 summarizes the number of weather stations and the network provenience in the MNW database.

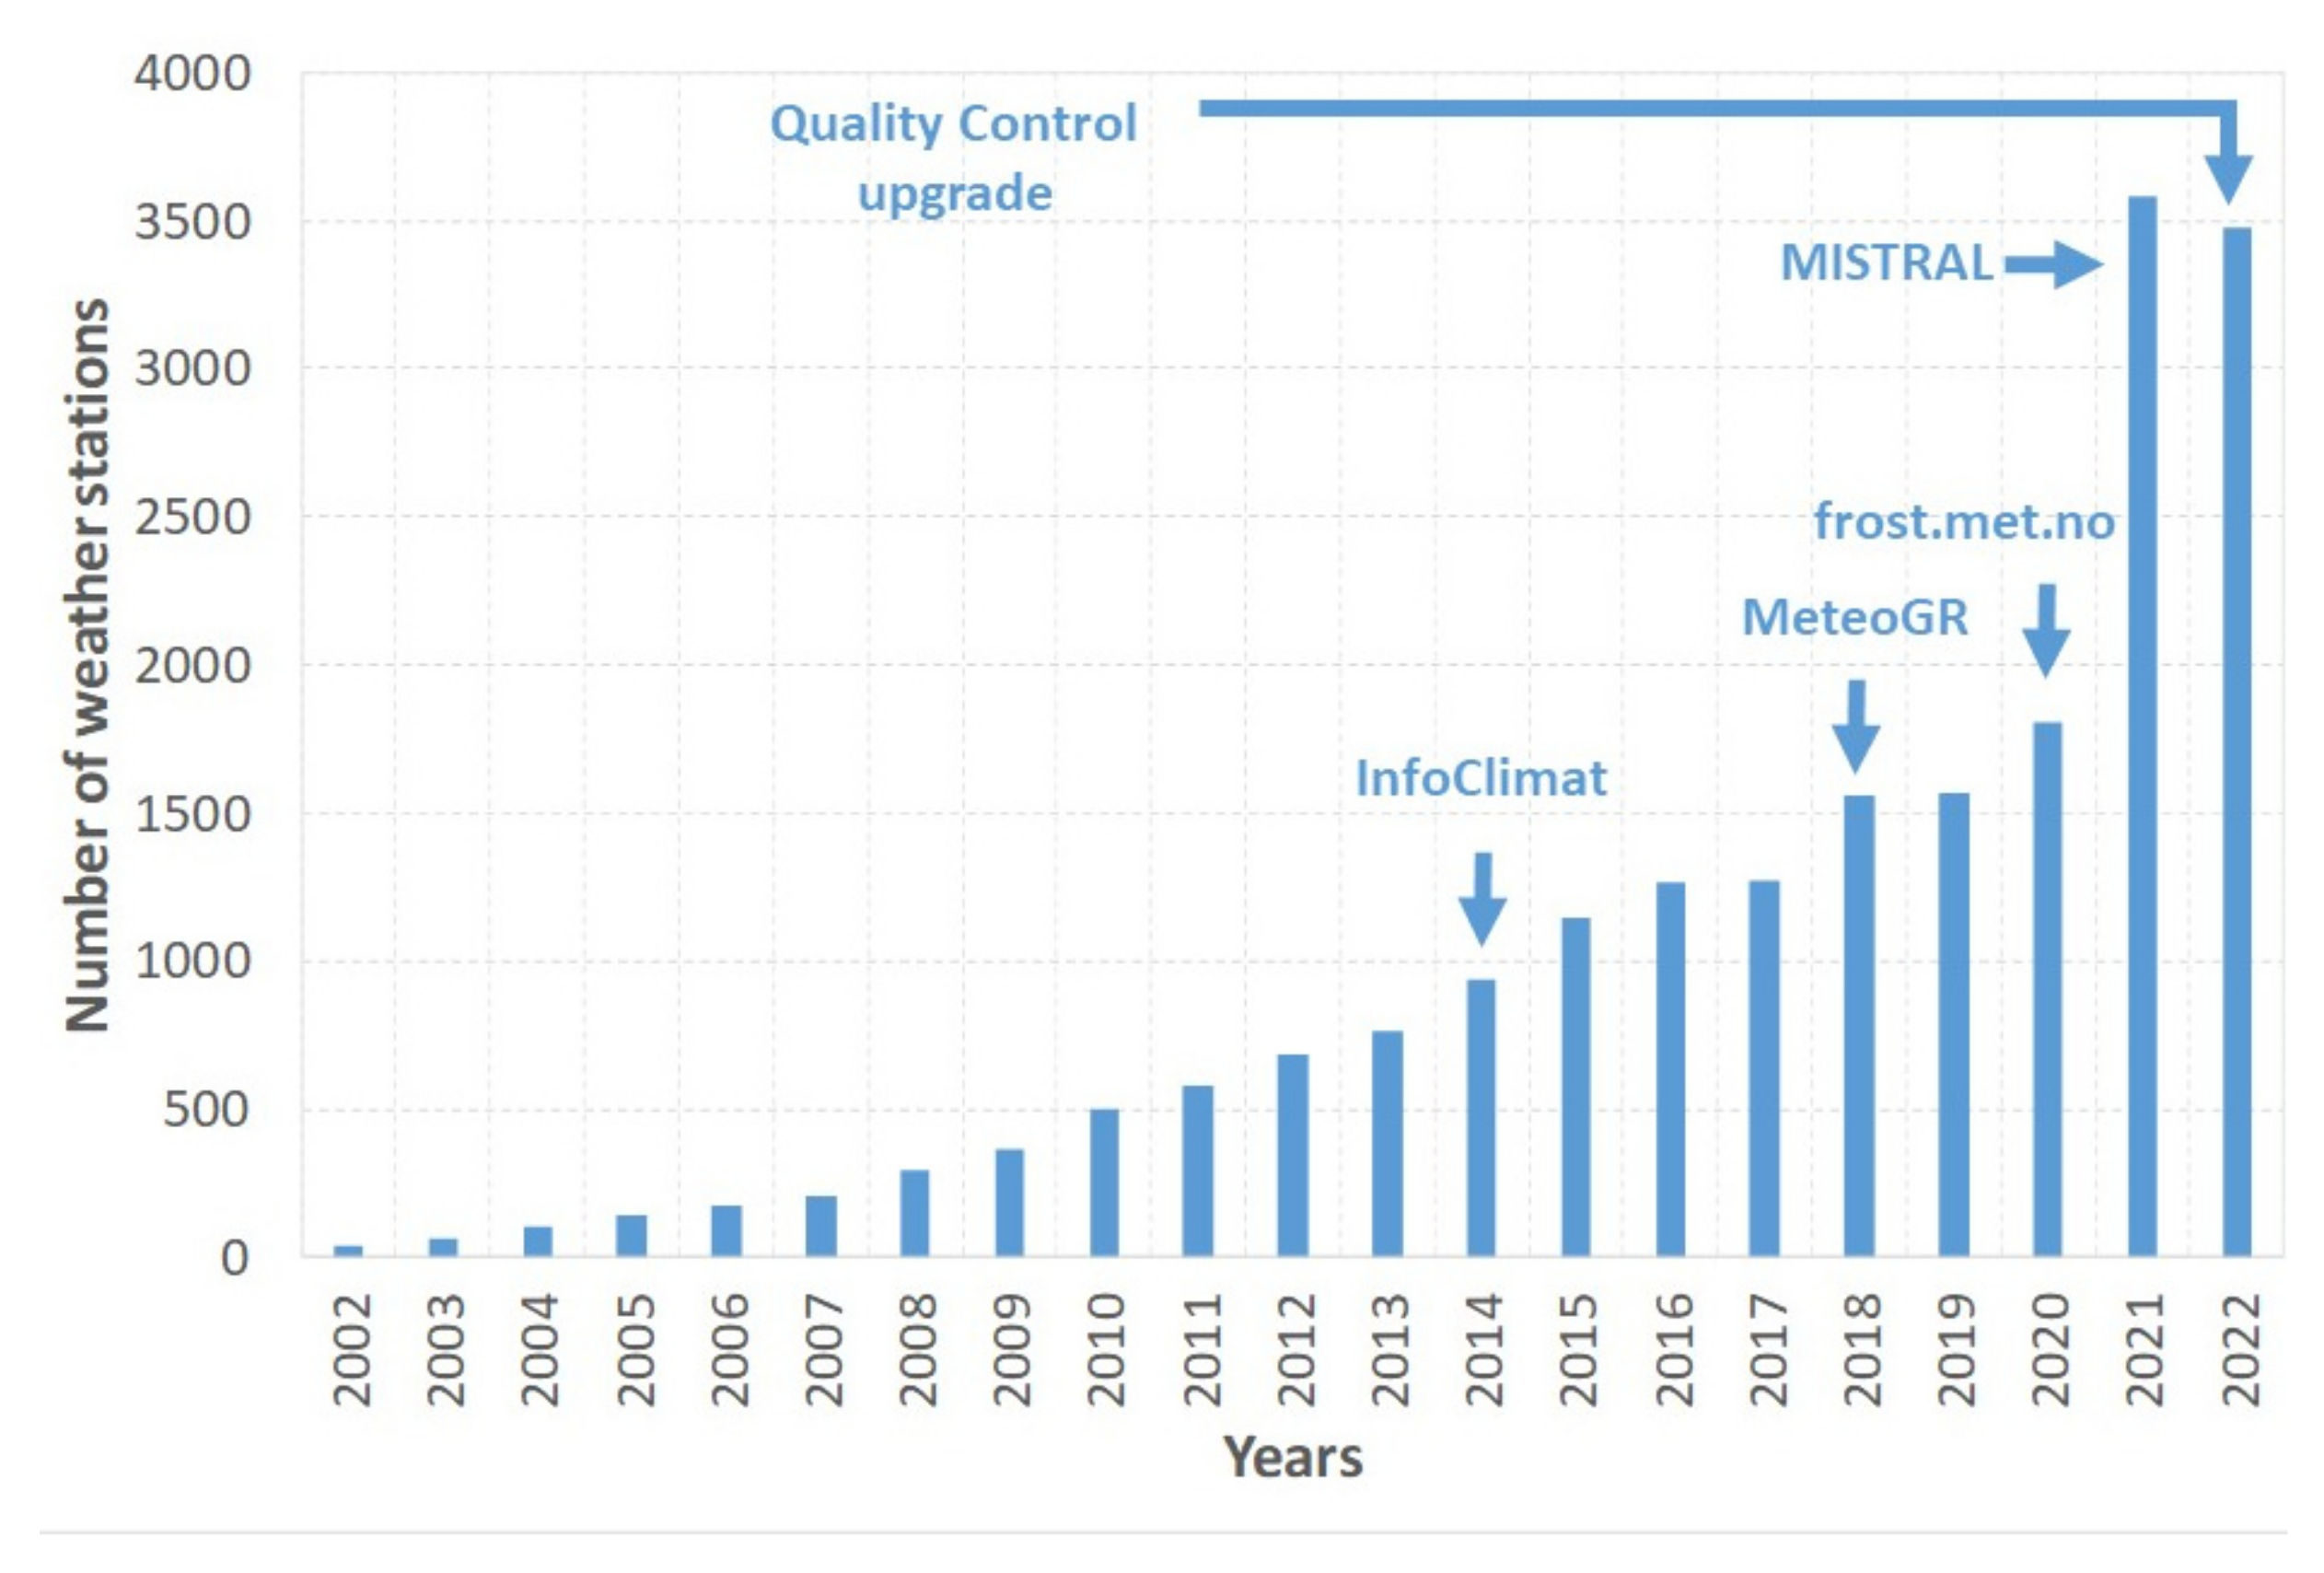
2.2. The Grow and the Actual Consistency of the Network

The MNW network started in 2002 with 35 weather stations. At the beginning, weather instruments were only owned by a few numbers of participants, whose data usually remained in their computer or published on personal websites. At that time, real-time data of weather stations located in Italian territory were not available or easily obtainable on Internet. These were at least two main reasons that prompted the MNW association to decide the set up a meteorological network for “entry-level” stations.
Traditionally, weather stations with a good quality:price ratio are favored, such as Davis (Vantage Pro 2 and Vue versions), Ecowitt, Froggit, Sainlogic, Oregon Scientific, Bresser, PCE, Irox, and Lacrosse. Basically, they all measure air temperature, relative humidity, precipitation, wind speed and direction, and atmospheric pressure, but not all of them are equipped with instruments to monitor atmospheric variables, such as the incoming solar radiation or UV radiation.
Table 3 summarizes the number of instruments for each meteorological variable available for the 6506 weather stations regularly registered into the MNW database, where, to be included, each sensor of the CWS has to go through the quality control process.
Among the 6506 stations, 4780 upload their data on the MNW database at least once every 24 h, and around 3400 are constantly on-line during the day.
Figure 2 depicts the development of the MNW network from the origin with an average growth rate of about 150 stations per year. The last decade saw a rapidly increasing growth, when other (national and foreign) weather networks were imported in the MNW database: Infoclimat (France, 2014), MeteoGR (Greece, 2018), Frost network (Norway, 2020), and MISTRAL (Italian official bodies, 2021). At the beginning of the current year, a quality control (QC) upgrade was implemented, and some weather sites were excluded from the system; this explains the drop in the number of stations in 2022.
Currently, the data stream generated by the Italian stations on MNW averages almost 6 records per second (518,000 data records per day, 21,583 records per hour). Figure 3 shows the sampling frequency of the operative MNW stations in Italy, on average, during the month of January 2022 (1134 stations). The range of the sampling frequency for each instantaneous datum spans between a minimum of 1 min up to 60 min, and most of the stations have a sampling frequency in the range from 3 to 5 min.

2.3. Guidelines and Metadata

The rules established by the World Meteorological Organization (WMO) in the “Guide to Meteorological Instruments and Methods of Observation WMO-No. 8” [15] for correct station siting are difficult to fully comply with, especially with stations located in highly urbanized areas.
Moreover, citizen weather stations typically have missing metadata about their siting and exposure. The lack of this information means the impossibility of an a priori knowledge of the typical data errors for each station. For this reason, many associations and research organizations are adopting installation rules for their own needs in order to guarantee a standard methodology in data collecting. This is the case of the MNW association, which has established its own guidelines, based on WMO rules, but with necessary adaptations to the context of CWS, often located in various types of sites, which allow for a categorization and regularization of sensors installed on roofs, gardens, or other surfaces.

2.3.1. Type of Siting

Proper siting of a weather station can be very challenging, especially in urban or suburban areas. Three types of positioning have been defined by MNW, approximately following the environment characteristics based on the Local Climate Zones (LCZ) classification system by [16].
-
Rural: an extra-urban placement in areas where building density is very low or even absent, equivalent to LCZ A, B, C, and D. The location is not affected by the urban heat island effect and it includes, for example, countryside far from town, mountain installations, etc.
-
Suburban: a semi-urban placement in areas of low building density and abundance of pervious land covers and scattered trees, comparable to LCZ 5, 6, and 7. The urban heat island effect is low, e.g., residential areas far from cities.
-
Urban: an urban placement in areas of high building density, with land cover mostly paved and few or no trees, similar to LCZ 1, 2, 3, 4, and 9. The urban heat island effect is present, e.g., downtown, industrial areas, etc.
For instance, considering the Italian weather stations only, which number 4411 as reported in Table 1, the number of different monitoring sites counts 651 stations in rural areas, 425 in suburban, and most of them (3335) in urban contexts.

2.3.2. Sensors Layout

Weather station sensors have different setting requirements according to the meteorological variable to be measured. For instance, temperature and humidity instruments are the most important group of devices in a CWS, but they are also the most affected by incorrect positioning. In order to be accepted in the MNW database, thermo-hygrometer sensors must be housed in a certified passive or fan aspirated radiation shield (such as Davis, Barani Design, MetSpec, Comet System, Vaisala, Campbell), and properly located, generally between 1.70–2.0 m above ground and at an adequate distance from the surrounding obstacles to not alter the measurement. However, distances and heights, respectively, from obstructions and above ground, are variable according to the positioning of each sensor: for a CS network, some compromises must be made, but, basically, the closer you are to the standards, the better. Generally, the presence of obstacles should not prevent a representative measurement of the surrounding area to be monitored.
MNW has, in fact, defined five different configurations for the installation place, which are listed below:
(i)
Open field: the weather station can be installed in an open field (e.g., countryside) with obstacles at least 10 m away from the station itself.
(ii)
Garden: weather sensors in gardens do not comply with all the requirements of the previous item; hence, they are accepted if obstacles are at least 4 m apart and their heights do not prevent an acceptable measurement.
(iii)
Courtyard: another option is to install the weather station in an area completely or partially enclosed by walls or buildings with further exceptions regarding the type of ground than the previous item (garden).
(iv)
Roof: this is one of the most critical installation places. In this case, the weather station must be installed at least 2 m above the roof surface and at a distance such that chimneys, air conditioning units, or other obstacles cannot influence the right measurement. This type of installation is similar to the historical meteorological observatories.
(v)
Balcony: usually, temperature and humidity sensors are installed separately from the rest of the weather station on a balcony or a terrace. In this case, there are additional limitations: sensors must be installed at least 1.50 m from the walls and at a distance such any obstacles cannot prevent a proper monitoring of the site.
For a complete review on how to place a weather station in order to be accepted in the MNW network, the reader can refer to these guidelines (in Italian): http://wiki.meteonetwork.it/index.php/Norme_OMM_e_Norme_MeteoNetwork (accessed on 15 May 2022).
The open field configuration is closer to the WMO standards (class 3) and, hence, if possible, it should be preferred. In Table 4 an example with the requirements for configuration ii (garden), which is the most common case between the weather stations registered in the MNW network in Italy, is shown. In fact, among the total number of Italian weather stations in the MNW database (4411), we count 594 placements in open field, 2638 in garden, 111 in courtyard, 972 over roofs, and only 96 mounted over balconies.
The procedure for submitting personal weather stations to the MNW association involves the following steps:
-
An owner assessment, specifying in which type of area the weather station will be located (rural, suburban, and urban);
-
The choice for the best sensor layout based on the installation site, and compliance with related requirements, giving priority to temperature and humidity sensors;
-
Sending pictures of the weather station to the MNW team to check the necessary requirements;
-
Approval by the MNW committee and admission of the weather station into the network.
Once the weather station is accepted into the MNW network, an identity card with its siting specifications and measurement configurations will be available on the MNW web pages for each weather station inside the network. The procedure described above has proven to be remarkably effective in ensuring excellent reliability and data consistency, and encouraging station owners to provide the required metadata about their own station. In this way, the citizen has become, over the years, the ‘gatekeeper’ of their own individual sensor, installing it and ensuring its regular operation [17].

2.4. Information Technology Infrastructures

The actual MNW information technology (IT) is based on an edge solution with its own physical and cloud data center, where MNW has always been the IT owner, since the association was founded. In 2016, essential services for MNW activities have been moved to cloud and managed solutions, and in 2021, 6 CentOS Linux servers were installed for a total number of 60 processors (Intel and AMD) and 70 GB of RAM able to run the following weather chains every day:
-
the WRF-ARW (Weather Research Forecasting–Advanced Research WRF) model processing and post-processing;
-
the post-processing of images for the WRF ensembles, GFS (Global Forecasting System), ECMWF (European for Medium range Weather Forecasts), and MOLOCH models.

Data Storage

Between 2002 and 2005, meteorological data were manually uploaded by each citizen scientist; unfortunately, it was an unsustainable solution. Hence, an automatic acquisition process was implemented in 2006, as result of continuous developments in acquiring weather data from stations.
In detail, each weather station is interfaced via computer with a proprietary software which locally stores weather data (e.g., WeatherLink, Virtual Weather Display, etc.), and uploads them via FTP or cloud (e.g., weatherlink.com). MNW, through its automatic scripts, constantly collects raw data minute-by-minute with the following work flow:
-
identification of meteorological station ID and data source (by HTTP protocol);
-
identification of the interface to be used (depending on the format of data source and the software used by each collaborator). Currently, there are drivers for the following software/cloud archives: WeatherLink, WeatherLink IP, Cumulus, Anemos, WS2, Sint Wind PI, and there are automatic picking solutions to interface with the APIs of our partners, including Infoclimat, ARPA Veneto, Meteo Trentino, MeteoGr, and Mistral.
-
data download (daily archive or latest available data);
-
preliminary correction of errors (meteorological variables in a given min/max range, see Section 2.5 for further details);
-
identification of the reliability of single data (depending on the positioning of the weather station, the technical equipment, etc.);
-
data upload on the PostgreSQL database which has now reached a size of 600 GB, 450 of them only to archive raw weather station data.

2.5. Quality Control

Since applying appropriate quality control methods is an essential component when using these observations, specific guidelines, standards and protocols have been set up to achieve high-level of trustworthiness, guarantee robustness, and quantify the reliability of crowdsourced data (e.g., metadata protocols [18]; QA/QC procedures [19]).
The admission procedure for the MNW stations ensures a certain level of data quality for each sensor, since erroneous data reading caused by sensor malfunctions, hardware, or power supply error or changed environmental conditions can still occur. The MNW data are subjected to automatic validation and quality control procedures in order to reduce this possibility of measurement errors entering in the MNW production chain such as the WRF modeling or map generation processes (see Section 3).
The high-quality process has also been highlighted in two recent studies [20,21] where the MNW data, in particular temperature and precipitation, have been compared with official networks of ARPA Emilia-Romagna and Veneto, respectively. Both the summarized results underlined the worth of MNW efficiency, and, above all, how the joint use of the two networks has given a greater or, at worse null, benefit with respect to the ARPA networks only.
The actual automatic control of the data collected is available for the stations located in Italy, but it has not yet implemented for the imported networks previously described.
The automatic control follows two steps:
  • Range test: delete clear incorrect data (e.g., minimum temperatures below −40 °C, maximum temperatures above +50 °C, and rainfall below 0 mm);
  • Cross-validation through percentiles: for each atmospheric variable and each station, the distribution of values measured by the 15 nearest stations in a maximum of 30 km range is analyzed in order to obtain the 10th and 90th percentiles. A tolerance is calculated using the standard deviation of the distribution, which is added to the 90th percentile and subtracted from the 10th percentile to obtain the cut-off values of the quality check. The use of standard deviation for the tolerance computation considers the natural variability of the variable in a specific weather situation: if this variability of the given variable is predominantly accentuated (high standard deviation), the boundaries are more relaxed and less stringent. In a situation where the natural variability of the variable field is very reduced, the tolerance is more rigorous, instead. A general check over the whole Italian domain with the same logic is performed only for the interpolated-map making process, in order to be aware to delete those outliers that might cause graphical issues. Data failing the QC are flagged, and do not enter in the maps elaboration process; however, they remain in the database.

Future Real-time Anomaly Detection System

Given the high frequency and the amount of ingested data, the ability to consistently detect and flag erroneous data readings as soon as possible is of paramount importance to ensure the quality of the downstream products (live maps, extremes, hourly/daily maps, models).
For this reason, MNW is currently testing the adoption of an upgrade version with an automated anomaly detection method to be fully operative by the end of 2022: the aim is to implement a completely automated procedure to highlight anomalous observed values for each individual sensor of the weather stations in real-time.
The current best candidate for the Real-time Anomaly Detection System (RADS) is the adoption of a workflow inspired by the work proposed in refs. [22,23] that features a combination of a rule-based quality control procedure and a machine learning estimate based on the last 24 h of data from the station.
Given that no labels are available in the dataset, the approach for the machine learning is based on unsupervised methods. The aim of machine learning model is to predict values for the next data point measured by the station, based on the last 24 h of data. When the value sensed by the station is between 3σ of the previous 24 h plus or minus the estimate predicted by the machine learning model, the data point is considered nominal (not an anomaly). Otherwise, the record is flagged as an anomaly, and thus excluded from being used in the generation of downstream products.
Careful considerations are required in the choice of the machine learning estimation model, especially given the different sampling frequency of the MNW stations: the machine learning method must be able to model the wide range of operating frequencies of stations when estimating values for the next data point. The current best candidate method is based on the recent deep learning work by ref. [24]. Preliminary testing on a limited dataset shows a promising ability of this method to generate estimates at different sampling frequencies, even when encountering missing and irregular time steps between data points.

3. Products and Discussion

The following section describes main technical and scientific achievements reached using MNW data. In detail: (a) generated services with live data and interpolated maps, (b) the Data Assimilation (DA) using MNW values into the Weather Research Forecasting (WRF) meteorological model, and (c) the Weatherness project, coordinated with the university of Milan (Università degli Studi di Milano).

3.1. Services

Once a weather station proceeds through the validation phase and finally joins the database, data are freely published in real-time on the MNW web sites and app. Data are used to generate various services, such as real-time charts or daily extremes maps. Moreover, through single call or even bulk APIs, MNW data are accessible for users’ researches and studies. The plotted variables are the following: 2 m air temperature (T_2m) and relative humidity (RH_2m), dew point (Td_2m), precipitation (TOT_PREC), wind speed (WSPD) and direction (WDIR), sea level pressure (MSLP), and UV and global solar radiations (UV_RAD and GRAD).

3.1.1. Live Data

CWS data are available in real time from live maps (https://www.meteonetwork.it/rete/livemap/ (accessed on 15 May 2022)) and updated every 5 min for stations registered on the MNW database, while it is 5 to 45 min for the data imported from other networks. On live charts, it is further possible to view the daily extremes for temperature, precipitation, humidity, and wind as well. Additionally, the TOT_PREC and T_2m values greater than 5 °C in the preceding 30 min are shown together with T_2m values of the previous 24 h, in order to be compared with the actual ones. Figure 4 shows a temperature map from the MNW webpage over Europe (a) and a zoom over Italy (b).

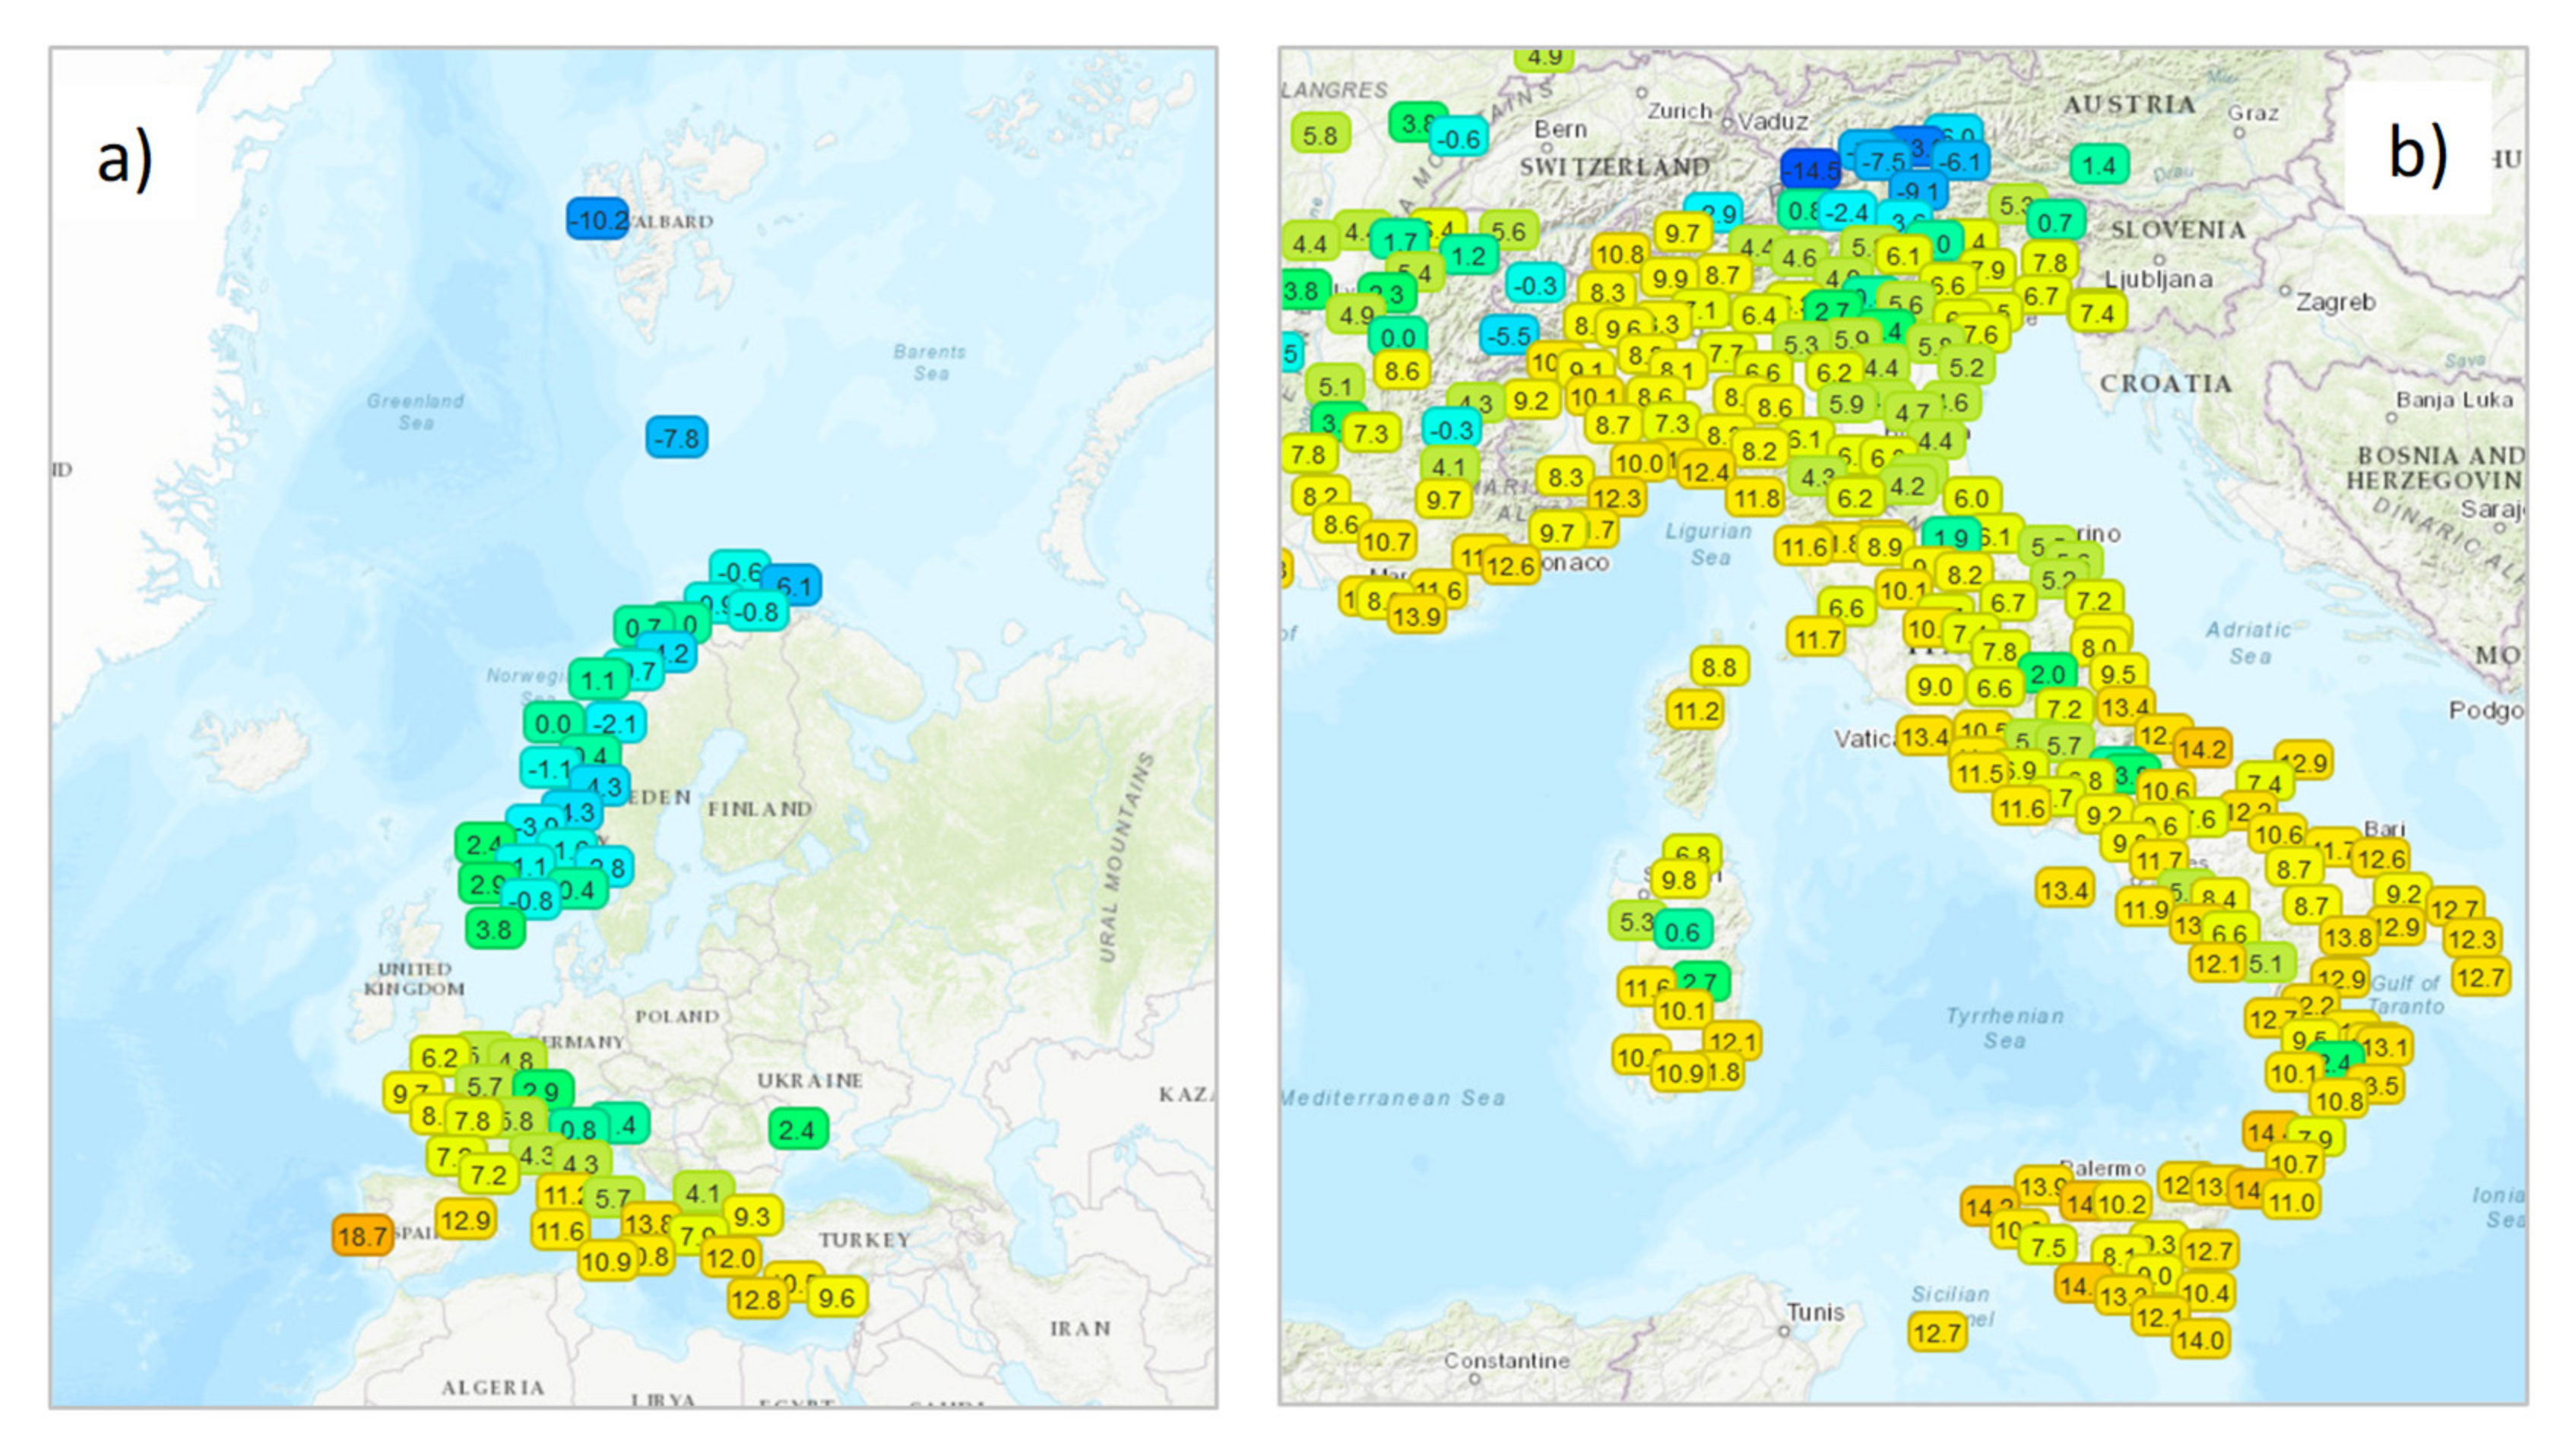
3.1.2. Interpolated Maps

Available MNW data are used to produce maps which show weather fields at a regional, national level and on some European states both in real time (every 20 min) and with a daily update. Animations are available from midnight of the current day to the last data record. These plots are available for Italy with a possible zoom over each regional district, France, Greece, and Norway. Data passing the described quality check enter a processing chain involving geostatistical spatialization methods for representing different variables fields. Spatial data are on grids with different horizontal resolutions, depending on the geographic domain (from 1 km for regional domains to 5.1 km for national domains). The spatialization of data is calculated with an average of the two following methods: the natural neighbor interpolation and the inverse weighted distance (IWD). Generally, the choice of using a mean value of different interpolation methods generally performs better than taking each of them alone [25].
The atmospheric variables directly pass into the spatial analysis process except for temperature. For this field, the spatialization is carried out using the potential temperature data at 2 m, calculated starting from T_2m and the sensor elevation; once the potential temperature grid has been created, the temperature field is obtained by an inverse process, using the altitude by the DEM (Digital Elevation Model) of a specific domain, in order to take into account the influence of orography in generating the field of temperature. The TD_2m is derived from T_2m and RH_2m, using the formula proposed in ref. [26].
For each variable, extreme maps are derived daily, plotting the highest and lowest values (Figure 5) to include daily maximum (Hi_T_2m) and minimum (Low_T_2m) temperature, TOT_PREC, maximum (Hi_RH_2m) and minimum (Low_RH_2m) humidity, and maximum wind gust (Hi_WSPD).
The choice to use the same interpolation method for all the meteorological variables, including precipitation, which has a non-normal distribution of values, has been made to simplify the number of generated maps which, in any case, have the purpose of representing the physical field on a regional/national scale. As a future goal, the feasibility of using more suited interpolation methods for precipitation will be taken into consideration.

3.1.3. The Open-Source Policy

The open-source policy adopted by MNW has allowed to sign scientific agreements with different bodies, such as universities and Regional Environmental Protection Agencies. In fact, the network data are licensed under Creative Commons BY (CCBY) 4.0 and we have active Application Programming Interface (API) services available to users. During the last decade, MNW stipulated official agreements to supply long data series for universities, private companies, institutions, students, and researchers. The university of Politecnico di Milano, for instance, uses MNW data for real-time hydro-meteorological simulations for droughts [27] and floods forecasts [28]. Weather data, provided by MNW association via FTP transfer, help to update the meteorological input into the FEST-WB hydrological model, and give a better overview of local ground measurements in the precipitation field [29] and surface soil moisture [30].
Another example comes from the FOMD (Fondazione Osservatorio Milano Duomo) where MNW data are used to integrate the urban meteorological network to analyze climate conditions in the Milan metropolitan area [31,32].

3.2. MNW Data Assimilation into the WRF Model

Integrating citizen observations into operational systems brings a lot of challenges, but it can potentially benefit a wide variety of applications, including NWP (Numerical Weather Prediction) models [33]. Measurements from a dense network of citizen weather stations, assimilated into a NWP model operational pipeline, improved NWP skills [34,35].
The WRF (https://www.mmm.ucar.edu/weather-research-and-forecasting-model (accessed on 15 May 2022)) is a mesoscale weather forecast model, developed by the National Center for Atmospheric Research (NCAR). It has different versions and different optional packages allowing customization of the modeling chain in a very thorough way; in this case study, the version used is the WRF-ARW (Advanced Research WRF) by ref. [36].
To assimilate the MNW network values into the WRF forecasting model, additional WRF-DA packages (https://www2.mmm.ucar.edu/wrf/users/docs/user_guide_v4/v4.3/users_guide_chap6.html (accessed on 15 May 2022)) were used. Compared to the standard version, the WRF-DA can assimilate the observations at t = 0 as the data measured by meteorological stations on the ground (BUOY, METAR, SHIP, and SYNOP), upper sounding, radar scans, and satellite data.
Usually, the data assimilation is carried out using the 3D-Var or 4D-Var techniques. In this case, the 3D-Var was implemented for the coupled WRF-MNW version model computations. This enormous variety of observations, whether they are made at surface or at upper levels, can be prone to manual or instrumental errors. Therefore, the WRF-DA code has an essential component of forecasting correction based on the calculation of coarse errors, correction of bias, and objective fine-tuning of observation errors, which is essential to produce input data that correspond as much as possible to the real state of the atmosphere at time zero.
The 3D-Var implanted in the WRF-MNW version model runs on a domain between 2° E and 22° E longitude and between 35° and 48° N latitude with a horizontal resolution of 5.1 km and on 38 vertical levels. It uses the GFS initialization and integrated contour data with surface observations at time zero, deriving from the MNW meteorological stations network as well as with data collected from the international synoptic network assimilated in the domain.
The model was set up to use the following physics packages in simulations:
-
microphysics: Ferrier [37]
-
long wave radiation: RRTMG [38]
-
short wave radiation RRTM [39]
-
Planetary Boundary Layer: Yonsei University Scheme [40]
-
surface layer options: MM5 Similarity Scheme [41]
-
land surface options: Unified Noah Land Surface Model [42]
The entire flow scheme of the WRF-MNW system operates on two daily runs: 00 UTC and 12 UTC for a time horizon of 48 h.
As integrating citizen observations has been seen a fundamental source of information that could increase the performance of weather forecasts [43], a future investigation will be to check the benefit given by the introduction of assimilated MNW stations into the WRF model, thereby ensuring that the forecast matches better locally observed weather.

3.3. The Weatherness Project

The Weatherness Project aims to set up some MNW stations among the entire dataset to calculate biometeorological indices of particular interest for health and medical purposes. Biometeorological indices are, in fact, very important in biometeorology and medical bioclimatology, and they are calculated with mathematical formulas that allow evaluation of different human physiological situations up to the physio-pathological expressions (from well-being to physiological discomfort for hot or humid cold). These indices are based on correlations between values expressed by various meteorological variables such as: temperature, relative humidity, wind, and atmospheric pressure. The same World Health Organization (WHO) [44] gives evidence to this issuing, underlying the monitoring of extreme weather events, especially related to the concept of heat stress.
A recent work [45] described a large number of thermal indices reported in scientific literature during the last century. Human health, well-being, comfort, and discomfort are the result of the diversified influence of many factors, one of which is the thermal state of the environment.
The indices taken into account and applied in the MNW Weatherness Project are: the thermo-hygrometric index (THI), [46], two winter indices, namely the Scharlau Winter (WS) and the New Wind Chill (NWC) [47,48] and two summer indices, the Heat Index (HI) [49] and the New Summer Simmer Index (NSSI) [50].
Currently, the Weatherness is an application which runs a subnet of Italian weather stations present in the MNW database, allowing the previous five biometeorological parameters to be shown in real time (Figure 6). With the gradual extension of the MNW meteorological observation platform, it has been possible to structure and incorporate the described indices in a complete system of derived information to be calculated in different climate–environmental modes. In addition, to generate a specific database, the value-index association is shown on real time maps with the possibility of plotting monthly graphs for each station. The index efficiency depends on quality control checks applied to the MNW meteorological observations, which are influenced by possible downstream problems of the system itself. The upgrade version, described in Section 2.5, will also certainly improve the accuracy of the Weatherness data.
The defined indices use formulas combining temperature and relative humidity, except for the NWC, which aggregates temperature and wind speed. THI roughly calculates the Thom Discomfort Index (TDI) value [51], using air temperature and relative humidity directly, thus excluding the wet bulb temperature from calculation. It leads directly to a seasonal bioclimatic classification and its extreme classes. Software, applicable to both hemispheres at middle and high latitudes, comes to estimate the real feeling of physiological discomfort for cold, which is greater when air relative humidity is close to the saturation point [52]. Another factor related to temperature and relative humidity is the wind speed: in such situations, the feeling of discomfort, especially during the winter season, occurs somewhat differently with situations of calm wind or with the presence of breeze. The summer thermal indices included in the MNW system concern the HI and NSSI. The HI is of particular interest, especially in the current phase of global warming and simultaneous aging of human population (in more economically developed areas). The HI index allows estimation of the physiological discomfort caused by meteorological conditions characterized by high temperatures and high levels of relative humidity. This index can be calculated for temperatures ≥ 27 °C and RH ≥ 40%. Finally, the NSSI is a recent thermal index included in the MNW database in its latest version. It is applied when temperature is ≥ 22 °C, and it is sensitive up to a temperature of 53 °C. It is, therefore, a thermal index aimed to describe the conditions of heat stress during the hot season. The MNW platform, in the latest update, counts 175 weather stations in the Italian studied area, selected by the MNW database in the Weatherness Project. The percentage distribution by geographical area is approximately the following: northern Italy (62.6%), central Italy (17.2%), southern Italy (13.2%), and the largest Italian islands (6.9%). Several selected observation points of the Ultra-Violet Index (UVI) have also been included as part of the MNW meteorological station system. This parameter is of particular importance for human health. A recent systematic review [53] was carried out over two decades of international research investigating awareness, comprehension, use, and health impact of the UVI index in several countries (USA, Canada, Europe, Australia, New Zealand).

4. Conclusions

The paper showed the open crowd-sourced weather system developed by the Meteonetwork association, which is a peculiar example of citizen science, born by passion in atmospheric sciences, meteorology, and climatology. One of its greatest results is the MNW automatic weather station network, gathering about 6500 stations from 42 different European countries. Out of this massive amount of weather data, almost 4800 meteorological sites archive their data at least once a day, and about 3400 of them are constantly real-time connected. Produced data and maps are freely shared online and via app, and accessible for scientific purposes as well.
A constant upgrade through the years has led to the implementation of a robust database and servers to accommodate the huge amount of data flow. Notwithstanding this, quality control of meteorological observations is not affected by the volume of ingested data, which is regularly checked and updated. The metadata about the type of siting and configuration of sensors published on the MNW web pages not only increase user confidence with data, but also ensure that contributors think more about the quality of data they are producing [54].
Downstream products such as maps, data, and all meteorological and climatological products about temperature, relative humidity, precipitation, wind, pressure, and solar and UV radiations in the last decade have been shared to many institutions for scientific purposes. Weatherness project, by the Università degli Studi di Milano in Italy, uses a subnet of MNW data in order to study the effects of climate on human health in accordance with the WHO, who nowadays pays particular attention to problems related to extreme weather events. Lastly, a data assimilation system to introduce MNW data into the WRF-ARW meteorological model in addition to the international synoptic weather networks has been developed in order to improve initial conditions of everyday forecasts over Italian territory.
From the MNW experience, crowdsourcing is now an appreciated tool for engaging the public and scientific research. If appropriate validation and quality control procedures are adopted and implemented, it has huge potential for providing an integrative valuable source of high temporal and spatial resolution real-time data, especially in regions where few observations currently exist, thereby adding value to science, technology, and society.

Author Contributions

M.G.: he is the president of the Meteonetwork Association who coordinates all the projects and activities; G.P.: he works in the informatics groups of MNW: he follows the data flow of the MNW database; L.C.: he works in the informatics groups of MNW: he follows the MNW web dashboard; M.F.: he coordinates the informatics group of MNW: he wrote the database and server section; I.F.R.: she is a member of the MNW scientific committee: she reviews the entire paper; A.C. (Andrea Chini): he wrote the data assimilation section which he implemented; G.F. (Gianluca Ferrari): he wrote the data quality section which he implemented; G.C.: he works in the informatics group of MNW: he follows the real-time production of weather and climate maps; G.F. (Gabriele Franch): he works in the informatics group of MNW: he wrote the new method of anomaly detection system; G.T.: he is a member of the MNW scientific committee: he wrote the introduction and reviewed the entire paper; F.G.: he is a member of the MNW scientific committee: he wrote the guidelines of the MNW network which he developed; V.C.: he wrote the Weatherness project developed by himself and by his university staff; A.C. (Alessandro Ceppi): he had the idea of this paper: he supervised the entire work, writing many sections of it. All authors have read and agreed to the published version of the manuscript.

Funding

This research received no external funding.

Institutional Review Board Statement

Not applicable.

Informed Consent Statement

Not applicable.

Data Availability Statement

The data presented in this study are available on reasonable request from the corresponding author.

Acknowledgments

The authors are grateful to Massimo Gestro of University of Milan for his kind support in the Weatherness Project. The authors recognize Giovanni Tesauro for the management of the MNW network in the first 15 years and Mauro Serenello for his support during these recent years. The authors thank Marco Tadini for his kind care in reviewing the paper. Last but not least, a special mention goes to all our associated members who have contributed to grow the Meteonetwork Association through these years, and to all weather amateurs who have freely decided to share their weather data for the community.

Conflicts of Interest

The authors declare no conflict of interest.

References

  1. Wehn, U.; Gharesifard, M.; Ceccaroni, L.; Joyce, H.; Ajates, R.; Woods, S.; Bilbao, A.; Parkinson, P.; Gold, M.; Wheatland, J. Impact assessment of citizen science: State of the art and guiding principles for a consolidated approach. Sustain. Sci. 2021, 16, 1683–1699. [Google Scholar] [CrossRef]
  2. Strasser, B.J.; Baudry, J.; Maha, D.; Sanchez, G.; Taicogne, E. “Citizen Science”? Rethinking Science and Public Participation. Sci. Technol. Stud. 2019, 32, 52–76. [Google Scholar] [CrossRef]
  3. Rubio-Iglesias, J.M.; Edovald, T.; Grew, R.; Kark, T.; Kideys, A.E.; Peltola, T.; Volten, H. Citizen Science and Environmental Protection Agencies: Engaging Citizens to Address Key Environmental Challenges. Front. Clim. 2020, 2, 600998. [Google Scholar] [CrossRef]
  4. Wiggins, A.; Crowston, K. From conservation to crowdsourcing: A typology of citizen science. In Proceedings of the 2011 44th Hawaii International Conference on System Sciences, Kauai, HI, USA, 4–7 January 2011; pp. 1–10. [Google Scholar]
  5. Goodchild, M.F. Citizens as sensors: The world of volunteered geography. GeoJournal 2007, 69, 211–221. [Google Scholar] [CrossRef] [Green Version]
  6. Ceccaroni, L.; Bowser, A.; Brenton, P. Civic Education and Citizen Science: Definitions, Categories, Knowledge Representation. In Analyzing the Role of Citizen Science in Modern Research; Ceccaroni, L., Piera, J., Eds.; IGI: Hershey, PA, USA, 2017; pp. 1–23. [Google Scholar] [CrossRef]
  7. Howe, J. Crowdsourcing: A Definition. Wired Blog Network: Crowdsourcing. 2006. Available online: https://crowdsourcing.typepad.com/cs/2006/06/crowdsourcing_a.html (accessed on 15 May 2022).
  8. Dickinson, J.L.; Zuckerberg, B.; Bonter, D.N. Citizen science as an ecological research tool: Challenges and benefits. Annu. Rev. Ecol. Evol. Syst. 2010, 41, 149–172. [Google Scholar] [CrossRef] [Green Version]
  9. Muller, C.; Chapman, L.; Johnston, S.; Kidd, C.; Illingworth, S.; Foody, G.; Overeem, A.; Leigh, R. Crowdsourcing for climate and atmospheric sciences: Cur rent status and future potential. Int. J. Climatol. 2015, 35, 3185–3203. [Google Scholar] [CrossRef] [Green Version]
  10. Balázs, B.; Mooney, P.; Nováková, E.; Bastin, L.; Jokar Arsanjani, J. Data Quality in Citizen Science. In The Science of Citizen Science; Vohland, K., Land-Zandstra, A., Ceccaroni, L., Lemmens, R., Perelló, J., Ponti, M., Samson, R., Wagenknecht, K., Eds.; Springer: Cham, Switzerland, 2021; Chapter 8; pp. 139–157. [Google Scholar] [CrossRef]
  11. Fiebrich, C.A.; Morgan, C.R.; McCombs, A.G.; Hall, P.K.; McPherson, R.A. Quality assurance procedures for mesoscale meteorological data. J. Atmos. Ocean. Technol. 2010, 27, 1565–1582. [Google Scholar] [CrossRef]
  12. Lukyanenko, R.; Wiggins, A.; Rosser, H.K. Citizen Science: An Information Quality Research Frontier. Inf. Syst. Front. 2020, 22, 961–983. [Google Scholar] [CrossRef] [Green Version]
  13. GCOS. Implementation Plan for the Global Observing System for Climate in Support of the UNFCCC (2010 Update). GOOS-184, GTOS-76, WMO-TD/No. 1523. 2010. Available online: https://library.wmo.int/doc_num.php?explnum_id=3851 (accessed on 15 May 2022).
  14. Campbell, A.T.; Eisenman, S.B.; Lane, N.D.; Miluzzo, E.; Peterson, R.A. People-centric urban sensing. In Proceeding of the 2nd Annual International Workshop on Wireless Internet, WICON ’06, New York, NY, USA, 2–5 August 2006. [Google Scholar] [CrossRef]
  15. WMO. Guide to Instruments and Methods of Observation, Volume I—Measurement of Meteorological Variables (WMO-No. 8); World Meteorological Organization: Geneva, Switzerland, 2018; 573p, Available online: https://library.wmo.int/index.php?lvl=notice_display&id=12407#.Yjj6XjXSKHt (accessed on 15 May 2022).
  16. Stewart, I.D.; Oke, T.R. Local Climate Zones for Urban Temperature Studies. Bull. Am. Meteorol. Soc. 2012, 93, 1879–1900. [Google Scholar] [CrossRef]
  17. Cuff, D.; Hansen, M.; Kang, J. Urban sensing: Out of the woods. Commun. ACM 2008, 51, 24–33. [Google Scholar] [CrossRef]
  18. Muller, C.L.; Chapman, L.; Grimmond, C.S.B.; Young, D.T.; Cai, X. Toward a standardized metadata protocol for urban meteorological networks. Bull. Am. Meteorol. Soc. 2013, 94, 1161–1185. [Google Scholar] [CrossRef] [Green Version]
  19. Boulos, M.N.K.; Resch, B.; Crowley, D.N.; Breslin, J.G.; Sohn, G.; Burtner, R.; Pike, W.A.; Jezierski, E.; Chuang, K.-Y.S. Crowdsourcing, citizen sensing and sensor web technologies for public and environmental health surveillance and crisis management: Trends, OGC standards and application examples. Int. J. Health Geogr. 2011, 10, 67. [Google Scholar] [CrossRef] [PubMed] [Green Version]
  20. Sartori, M.; Avaldi, L.J.; Patruno, P. Studio Statistico Dell’impatto Della rete MeteoNetwork Sulla Stima di Parametri Meteo Superficiali in Emilia-Romagna. Agenzia Regionale per la Prevenzione e Protezione Ambientale dell’Emilia Romagna. 2016. Available online: https://www.meteonetwork.it/wp-content/uploads/2017/03/report.pdf (accessed on 15 May 2022). (In Italian).
  21. Ceschin, S. Due Fonti per le Stesse Informazioni: Confronti e Integrazione di reti di Stazioni Meteorologiche. Tesi di Laurea. 2017. Available online: http://tesi.cab.unipd.it/56467/1/Ceschin_Sara.pdf (accessed on 15 May 2022). (In Italian).
  22. Kim, H.-J.; Lee, H.S.; Choi, B.J.; Kim, Y.-H. Machine learning-based quality control and error correction using homogeneous temporal data collected by IoT sensors. J. Korea Converg. Soc. 2019, 10, 17–23. [Google Scholar] [CrossRef]
  23. Kim, H.-J.; Park, S.M.; Choi, B.J.; Moon, S.-K.; Kim, Y.-H. Spatiotemporal approaches for quality control and error correction of atmospheric data through machine learning. Comput. Intell. Neurosci. 2020, 2020, 7980434. [Google Scholar] [CrossRef] [PubMed] [Green Version]
  24. Narayan, S.S.; Marlin, B.M. Multi-Time Attention Networks for Irregularly Sampled Time Series. In Proceedings of the ICLR 2021, Conference Paper 881. Virtual, 3–7 May 2021; Available online: https://iclr.cc/Conferences/2021 (accessed on 15 May 2022).
  25. Ravazzani, G.; Ceppi, A.; Davolio, S. Wind speed interpolation for evapotranspiration assessment in complex topography area. Bull. of Atmos. Sci. Technol. 2020, 1, 13–22. [Google Scholar] [CrossRef] [Green Version]
  26. Dutton, J.A. The Ceaseless Wind, An Introduction to the Theory of Atmospheric Motion; McGraw-Hill: New York, NY, USA, 1976; p. XV+579. [Google Scholar] [CrossRef] [Green Version]
  27. Ceppi, A.; Ravazzani, G.; Corbari, C.; Salerno, R.; Meucci, S.; Mancini, M. Real-time drought forecasting system for irrigation management. Hydrol. Earth Syst. Sci. 2014, 18, 3353–3366. [Google Scholar] [CrossRef] [Green Version]
  28. Ravazzani, G.; Amengual, A.; Ceppi, A.; Homar, V.; Romero, R.; Lombardi, G.; Mancini, M. Potentialities of ensemble strategies for flood forecasting over the Milano urban area. J. Hydrol. 2016, 539, 237–253. [Google Scholar] [CrossRef]
  29. Lombardi, G.; Ceppi, A.; Ravazzani, G.; Davolio, S.; Mancini, M. From deterministic to probabilistic forecasts: The ‘shift-target’ approach in the Milan urban area (northern italy). Geosci. J. 2018, 8, 181. [Google Scholar] [CrossRef] [Green Version]
  30. Paciolla, N.; Corbari, C.; Al Bitar, A.; Kerr, Y.; Mancini, M. Irrigation and Precipitation Hydrological Consistency with SMOS, SMAP, ESA-CCI, Copernicus SSM1km, and AMSR-2 Remotely Sensed Soil Moisture Products. Remote Sens. 2020, 12, 3737. [Google Scholar] [CrossRef]
  31. Montoli, E.; Frustaci, G.; Lavecchia, C.; Pilati, S. High-resolution climatic characterization of air temperature in the urban canopy layer. Bull. Atmos. Sci. Technol. 2021, 2, 7. [Google Scholar] [CrossRef]
  32. Frustaci, G.; Pilati, S.; Lavecchia, C.; Montoli, E.M. High-Resolution Gridded Air Temperature Data for the Urban Environment: The Milan Data Set. Forecasting 2022, 4, 14. [Google Scholar] [CrossRef]
  33. Nipen, T.N.; Seierstad, I.A.; Lussana, C.; Kristiansen, J.; Hov, Ø. Adopting Citizen Observations in Operational Weather Prediction. Bull. Am. Meteorol. Soc. 2020, 101, E43–E57. [Google Scholar] [CrossRef]
  34. Madaus, L.E.; Hakim, G.J.; Mass, C.F. Utility of dense pressure observa tions for improving mesoscale analyses and forecasts. Mon. Wea. Rev. 2014, 142, 2398–2413. [Google Scholar] [CrossRef] [Green Version]
  35. Gasperoni, N.A.; Wang, X.; Brewster, K.A.; Carr, F.H. Assessing impacts of the high-frequency assimilation of surface observations for the forecast of convection initiation on 3 April 2014 within the Dalla–Fort Worth test bed. Mon. Wea. Rev. 2018, 146, 3845–3872. [Google Scholar] [CrossRef]
  36. Skamarock, W.C.; Klemp, J.B.; Dudhia, J.; Gill, D.O.; Liu, Z.; Berner, J.; Wang, W.; Powers, J.G.; Duda, M.G.; Barker, D.; et al. A Description of the Advanced Research WRF Model Version 4.3; (No. NCAR/TN-556+STR); National Center for Atmospheric Research: Boulder, CO, USA, 2021; p. 145. [Google Scholar] [CrossRef]
  37. Ferrier, B.S.; Jin, Y.; Lin, Y.; Black, T.; Rogers, E.; DiMego, G. Implementation of a New Grid-Scale Cloud and Precipitation Scheme in the NCEP Eta Model. In Proceedings of the 15th Conference on Numerical Weather Prediction, San Antonio, TX, USA, 12–16 August 2002; pp. 280–283. [Google Scholar]
  38. Iacono, M.J.; Delamere, J.S.; Mlawer, E.J.; Shephard, M.W.; Clough, S.A.; Collins, W.D. Radiative forcing by long-lived greenhouse gases: Calculations with the AER radiative transfer models. J. Geophys. Res. 2008, 113, D13103. [Google Scholar] [CrossRef]
  39. Mlawer, E.J.; Taubman, S.J.; Brown, P.D.; Iacono, M.J.; Clough, S.A. Radiative transfer for inhomogeneous atmosphere: RRTM, a validated correlated-k model for the longwave. J. Geophys. Res. 1997, 102, 16663–16682. [Google Scholar] [CrossRef] [Green Version]
  40. Hong, S.-Y.; Noh, Y.; Dudhia, J. A new vertical diffusion package with an explicit treatment of entrainment processes. Mon. Weather. Rev. 2006, 134, 2318–2341. [Google Scholar] [CrossRef] [Green Version]
  41. Jiménez, P.A.; Dudhia, J.; González-Rouco, J.F.; Montávez, J.P.; García-Bustamante, E.; Navarro, J.; Vilà-Gueraude Arellano, J.; Muñoz-Roldán, A. An evaluation of WRF’s ability to reproduce the surface wind over complex terrain based on typical circulation patterns. J. Geophys. Res. Atmos. 2013, 118, 7651–7669. [Google Scholar] [CrossRef] [Green Version]
  42. Chen, F.; Dudhia, J. Coupling an advanced land-surface/hydrology model with the Penn State/NCAR MM5 modeling system. Part I: Model description and implementation. Mon. Wea. Rev. 2001, 129, 569–585. [Google Scholar] [CrossRef] [Green Version]
  43. Ravazzani, G.; Corbari, C.; Ceppi, A.; Feki, M.; Mancini, M.; Ferrari, F.; Gianfreda, R.; Colombo, R.; Ginocchi, M.; Meucci, S.; et al. From (cyber)space to ground: New technologies for smart farming. Hydrol. Res. 2017, 48, 656–672. [Google Scholar] [CrossRef] [Green Version]
  44. WHO. Global Strategy on Health, Environment and Climate Change: The Transformation Needed to Improve Lives and Wellbeing Sustainably through Healthy Environments. 2020. Available online: https://apps.who.int/iris/handle/10665/331959 (accessed on 15 May 2022).
  45. De Freitas, C.R.; Grigorieva, E.A. A comprehensive catalogue and classification of human thermal climate indices. Int. J. Biometeorol. 2015, 59, 109–120. [Google Scholar] [CrossRef]
  46. Kliber, H.H. Environmental physiology and shelter engineering. LXVII. Thermal effects of various temperature-humidity combinations on Holstein cattle as measured by physiological responses. Res. Bull. Mo. Agric. 1964, 1964, 862. [Google Scholar]
  47. Scharlau, K. Einführung eines Schwülemasstabes und Abgrenzung von Schwülezonen durch Isohygrothermen. Erdkunde 1950, 4, 188–201. (In German) [Google Scholar] [CrossRef] [Green Version]
  48. Siple, P.A.; Passel, C.F. Measurements of dry atmospheric cooling in subfreezing temperatures. Proc. Amer. Phill. Soc. 1945, 89, 177–199. [Google Scholar] [CrossRef]
  49. Steadman, R.G. The assessment of sultriness. Part I: A temperature-humidity index based on human physiology and clothing science. J. Appl. Meteorol. 1979, 18, 861–873. [Google Scholar] [CrossRef] [Green Version]
  50. Pepi, W.J. The New Summer Simmer Index. In Proceedings of the International Audience at the 80th Annual Meeting of the American Meteorological Society (AMS), Long Beach, CA, USA, 11 January 2000. [Google Scholar]
  51. Thom, E.C. The Discomfort Index. Weatherwise 1959, 12, 57–61. [Google Scholar] [CrossRef]
  52. Heckman, C.J.; Liang, K.; Riley, M. Awareness, understanding, use, and impact of the UV index: A systematic review of over two decades of international research. Prev. Med. 2019, 123, 71–83. [Google Scholar] [CrossRef]
  53. Matzarakis, A. Weather and climate related information for tourism. Tour. Plan. Dev. 2006, 3, 99–115. [Google Scholar] [CrossRef]
  54. Bell, S.; Cornford, D.; Bastin, L. How good are citizen weather stations? Addressing a biased opinion. Weather 2015, 70, 75–84. [Google Scholar] [CrossRef] [Green Version]
Figure 1. Geographical distribution of operational weather stations in the MNW database in Europe (a) and Italy (b).
Atmosphere 13 00928 g001
Figure 2. Sum of weather stations constantly online on the MNW webpage during day. The bins before the year 2006 are referred to the number of weather stations online at least once every 24 h.
Atmosphere 13 00928 g002
Figure 3. Most common sampling frequency for each of the MNW stations (1134 total) active on average in the month of January 2022 in Italy.
Atmosphere 13 00928 g003
Figure 4. Real-time values over Europe (a) and a zoom over Italy (b) as they appear on the MNW web page.
Atmosphere 13 00928 g004
Figure 5. An example of a daily map for the maximum air temperature (°C) at 2 m.
Atmosphere 13 00928 g005
Figure 6. An example of a real-time map for the Scharlau index.
Atmosphere 13 00928 g006
Table 1. Number of operative weather stations in the MWN database.
CountryStations (N)Owner
Italy4411MNW (2128)/other national bodies (2283) *
Norway866Frost
Greece444MeteoGR (336)/Frost (8)/MNW (2)
France367Infoclimat (321)/Frost (29)/MNW (17)
Sweden125Frost
Finland50Frost
Spain31Frost (18)/MNW (11)/Infoclimat (2)
Poland23Frost
Germany22Frost
Svalbard Islands (Norway)20Frost
Romania14Frost
Russia14Frost
Swiss14Infoclimat (5)/MNW (5)/Frost (4)
Denmark11Frost
Ukraine10Frost
Belgium9Frost (5)/Infoclimat (4)
Netherlands9Frost (6)/Infoclimat (3)
Turkey9Frost
Portugal8Frost (5)/Infoclimat (3)
Ireland6Frost
Republic of San Marino5MNW
Belarus4Frost
Czech Republic4Frost
Slovakia4Frost
Bulgaria3Frost
Brazil2MNW
Canada2Infoclimat
Latvia2Frost
Slovenia2Frost (1)/MNW (1)
Albania1MNW
Antarctica1Frost
Austria1MNW
Croatia1Frost
Cyprus1MeteoGR
Estonia1Frost
Greenland (Denmark)1Frost
Iceland1Frost
Kosovo1MNW
Lithuania1Frost
Luxembourg1Frost
Malta1Frost
Moldova1MNW
Serbia1Frost
United Kingdom1MNW
Total number of stations6506
* For a detailed classification about Italian weather stations, the reader is referred to Table 2.
Table 2. Number of weather stations included in the MNW database and their relative percentage out of the total. The country column refers to the origin of the network owner; however, some weather stations are located outside the origin nation, hence, the term “et al.” can be here interpreted as “and other countries”.
NetworkCountryStations (N)%
MNW (citizen scientists)Italy et al.216333
MISTRALItaly178927
FrostNorway et al.128720
MeteoGRGreece et al.4357
InfoclimatFrance et al.3385
ARPA CalabriaItaly1633
Meteo TrentinoItaly1162
Civil Protection of Bolzano ProvinceItaly841
ARPA VenetoItaly691
ARPA Emilia-RomagnaItaly621
Table 3. Number of sensors installed inside the MNW network. The percentage column is calculated in regard to the total number of operative weather stations (6506).
Meteorological VariableSensors (N)%
Precipitation631297
Air temperature592691
Air relative humidity490675
Wind speed and direction475173
Atmospheric pressure441068
Solar radiation (global)147123
UV radiation113217
Table 4. Example of requirements for the configuration of a garden.
SensorHeight above
Ground (m)
Notes
Thermo-hygrometer1.7 ÷ 2.0The thermo-hygrometer must be housed in a certified radiation shield at a height above ground (a short grass or grass with not much gravel or sand surface) between 1.70 m and 2.00 m, or higher if necessary, to overcome hedges or other obstacles, and at least 4 m from the nearest building or obstacle.
Rain gaugeAt least >0.50The rain gauge must be placed at least 4 m from the nearest obstacle, and at a distance such that any vertical barrier (tree, building) cannot prevent acceptable measurement in case of oblique precipitation. The rain gauge can also be separately placed on the roof.
AnemometerVariableThe anemometer must be placed at a height such that any vertical obstacle cannot prevent acceptable measurement of gusts. The influence of turbulence should be considered as well. The anemometer can also be separately placed on the roof.
Solar and UV radiation-The sensors must be placed so that they are never in the shade throughout the day; even these sensors can be separately placed on the roof.
Publisher’s Note: MDPI stays neutral with regard to jurisdictional claims in published maps and institutional affiliations.

